Attached files
| file | filename |
|---|---|
| 8-K - 8-K - Customers Bancorp, Inc. | cubi-20200212.htm |

KBW Winter Financial Services Symposium February 2020 NYSE: CUBI Member FDIC

Forward-Looking Statements This presentation, as well as other written or oral communications made from time to time by us, contains forward-looking information within the meaning of the safe harbor provisions of the U.S. Private Securities Litigation Reform Act of 1995. These statements relate to future events or future predictions, including events or predictions relating to future financial performance, and are generally identifiable by the use of forward-looking terminology such as “believe,” “expect,” “may,” “will,” “should,” “plan,” “intend,” or “anticipate” or the negative thereof or comparable terminology. Forward- looking statements in this presentation include, among other matters, guidance for our financial performance, and our financial performance targets. Forward-looking statements reflect numerous assumptions, estimates and forecasts as to future events. No assurance can be given that the assumptions, estimates and forecasts underlying such forward-looking statements will accurately reflect future conditions, or that any guidance, goals, targets or projected results will be realized. The assumptions, estimates and forecasts underlying such forward-looking statements involve judgments with respect to, among other things, future economic, competitive, regulatory and financial market conditions and future business decisions, which may not be realized and which are inherently subject to significant business, economic, competitive and regulatory uncertainties and known and unknown risks, including the risks described under “Risk Factors” in our Annual Report on Form 10-K for the year ended December 31, 2018 and subsequent Quarterly Reports on Form 10-Q and current reports on Form 8-K, including any amendments thereto, as such factors may be updated from time to time in our filings with the SEC. Our actual results may differ materially from those reflected in the forward-looking statements. In addition to the risks described under “Risk Factors” in our filings with the SEC, important factors to consider and evaluate with respect to our forward-looking statements include: • changes in external competitive market factors that might impact our results of operations; • changes in laws and regulations, including without limitation, changes in capital requirements under Basel III; • the potential effects of heightened regulatory requirements applicable to banks with assets in excess of $10 billion; • changes in our business strategy or an inability to execute our strategy due to the occurrence of unanticipated events; • our ability to identify potential candidates for, and consummate, acquisition or investment transactions; • the timing of acquisition, investment or disposition transactions; • constraints on our ability to consummate an attractive acquisition or investment transaction because of significant competition for these opportunities; • local, regional and national economic conditions and events and the impact they may have on us and our customers; • costs and effects of regulatory and legal developments, including the results of regulatory examinations and the outcome of regulatory or other governmental inquiries and proceedings, such as fines or restrictions on our business activities; • our ability to attract deposits and other sources of liquidity; • changes in the financial performance and/or condition of our borrowers; • changes in the level of non-performing and classified assets and charge-offs; • changes in estimates of future loan loss reserve requirements based upon the periodic review thereof under relevant regulatory and accounting requirements, including the adoption of the Current Expected Credit Losses standard; • inflation, interest rate, securities market and monetary fluctuations, including the discontinuance of LIBOR; • timely development and acceptance of new banking products and services and perceived overall value of these products and services by users, including the products and services being developed and introduced to the market by the BankMobile division of Customers Bank; • changes in consumer spending, borrowing and saving habits; • technological changes; • our ability to increase market share and control expenses; • continued volatility in the credit and equity markets and its effect on the general economy; • effects of changes in accounting policies and practices, as may be adopted by the regulatory agencies, the Financial Accounting Standards Board and other accounting standard setters; • the businesses of Customers Bank and any acquisition targets or merger partners and subsidiaries not integrating successfully or such integration being more difficult, time-consuming or costly than expected; 2

Forward-Looking Statements (Cont.) • material differences in the actual financial results of merger and acquisition activities compared with our expectations, such as with respect to the full realization of anticipated cost savings and revenue enhancements within the expected time frame; • our ability to successfully implement our growth strategy, control expenses and maintain liquidity; • Customers Bank's ability to pay dividends to Customers Bancorp; • risks relating to BankMobile, including: • the implementation of Customers Bancorp, Inc.'s strategy to retain BankMobile for 2-3 years, the possibility that the expected benefits of retaining BankMobile for 2-3 years may not be achieved, or the possible effects on Customers' results of operations if BankMobile is never divested causing Customers Bancorp's actual results to differ from those in the forward- looking statements; • our ability to successfully complete a divestiture of BankMobile and the timing of completion; • the ability of Customers and an acquirer of BankMobile to meet all of the conditions to completion of the proposed divestiture; • our ability to execute on our White Label strategy to grow demand deposits through strategic partnerships; • material variances in the adoption rate of BankMobile's services by new students • the usage rate of BankMobile's services by current student customers compared to our expectations; • the levels of usage of other BankMobile student customers following graduation of additional product and service offerings of BankMobile or Customers Bank, including mortgages and consumer loans, and the mix of products and services used; • our ability to implement changes to BankMobile's product and service offerings under current and future regulations and governmental policies; • our ability to effectively manage revenue and expense fluctuations that may occur with respect to BankMobile's student-oriented business activities, which result from seasonal factors related to the higher-education academic year; and • BankMobile's ability to successfully implement its growth strategy and control expenses. • risks related to planned changes in our balance sheet, including: • our ability to reduce the size of our multi-family loan portfolio; • our ability to execute our digital distribution strategy; • our ability to manage the risk of change in our loan mix to include a greater proportion of consumer loans; and • our ability to earn increased net interest income to recover reduced interchange income due to the loss of the small issuer exemption to the Durbin Amendment. You are cautioned not to place undue reliance on any forward-looking statements we make, which speak only as of the date they are made. We do not undertake any obligation to release publicly or otherwise provide any revisions to any forward-looking statements we may make, including any forward-looking financial information, to reflect events or circumstances occurring after the date hereof or to reflect the occurrence of unanticipated events, except as may be required under applicable law. This presentation shall not constitute an offer to sell or the solicitation of an offer to sell or the solicitation of an offer to buy any securities, nor shall there be any sale of securities in any jurisdiction in which such offer, solicitation or sale would be unlawful prior to registration or qualification under the securities laws of any such jurisdiction. 3
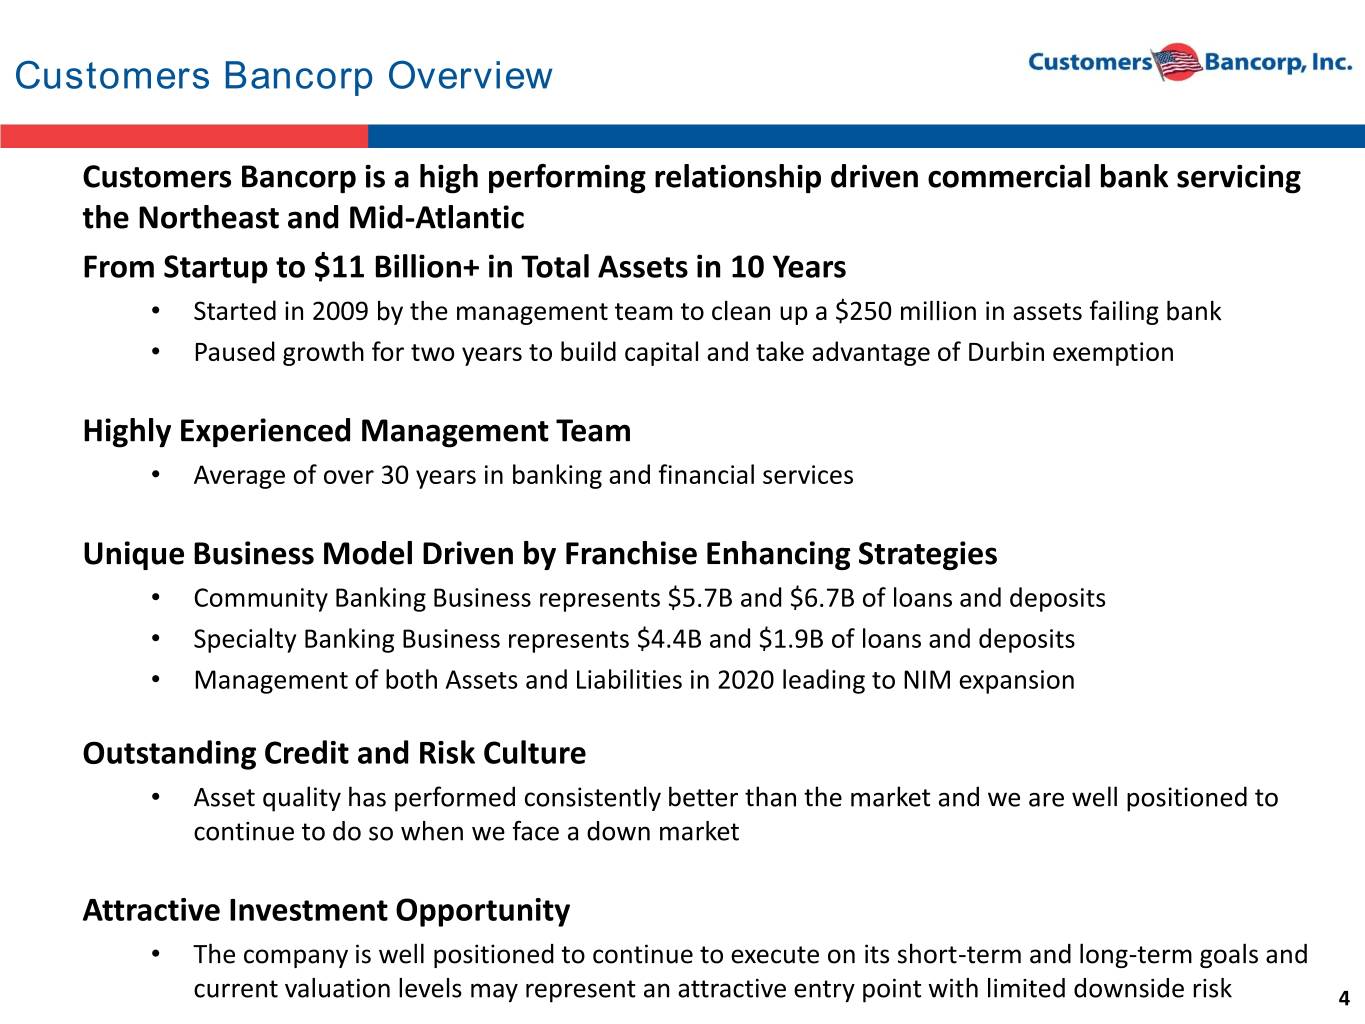
Customers Bancorp Overview Customers Bancorp is a high performing relationship driven commercial bank servicing the Northeast and Mid-Atlantic From Startup to $11 Billion+ in Total Assets in 10 Years • Started in 2009 by the management team to clean up a $250 million in assets failing bank • Paused growth for two years to build capital and take advantage of Durbin exemption Highly Experienced Management Team • Average of over 30 years in banking and financial services Unique Business Model Driven by Franchise Enhancing Strategies • Community Banking Business represents $5.7B and $6.7B of loans and deposits • Specialty Banking Business represents $4.4B and $1.9B of loans and deposits • Management of both Assets and Liabilities in 2020 leading to NIM expansion Outstanding Credit and Risk Culture • Asset quality has performed consistently better than the market and we are well positioned to continue to do so when we face a down market Attractive Investment Opportunity • The company is well positioned to continue to execute on its short-term and long-term goals and current valuation levels may represent an attractive entry point with limited downside risk 4
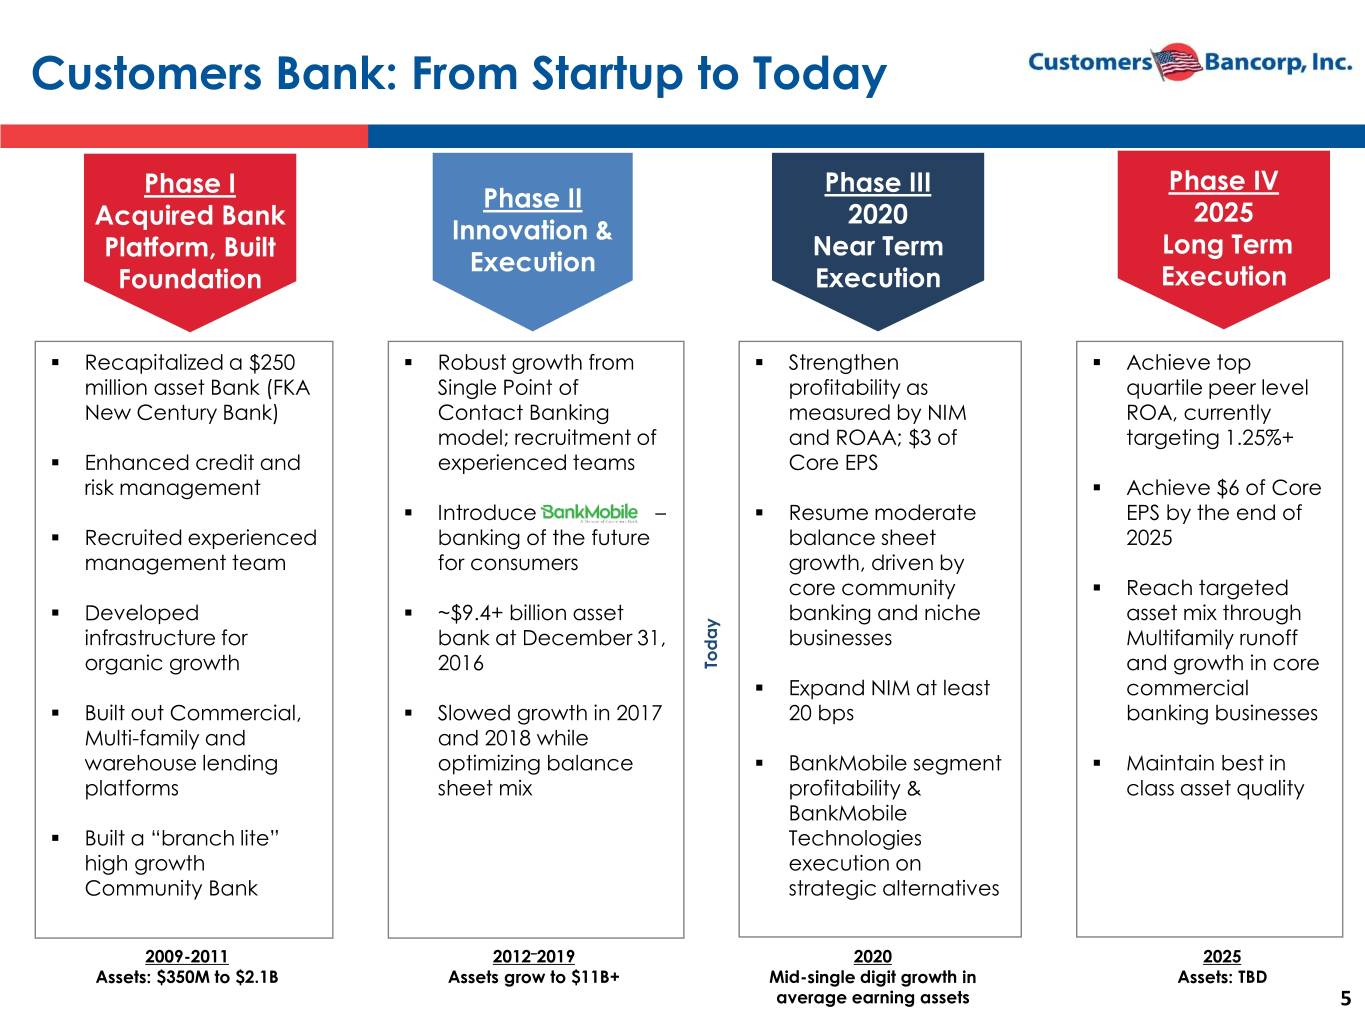
Customers Bank: From Startup to Today Phase I Phase III Phase IV Phase II Acquired Bank 2020 2025 Innovation & Platform, Built Near Term Long Term Execution Foundation Execution Execution ▪ Recapitalized a $250 ▪ Robust growth from ▪ Strengthen ▪ Achieve top million asset Bank (FKA Single Point of profitability as quartile peer level New Century Bank) Contact Banking measured by NIM ROA, currently model; recruitment of and ROAA; $3 of targeting 1.25%+ ▪ Enhanced credit and experienced teams Core EPS risk management ▪ Achieve $6 of Core ▪ Introduce – ▪ Resume moderate EPS by the end of ▪ Recruited experienced banking of the future balance sheet 2025 management team for consumers growth, driven by core community ▪ Reach targeted ▪ Developed ▪ ~$9.4+ billion asset banking and niche asset mix through infrastructure for bank at December 31, businesses Multifamily runoff organic growth 2016 Today and growth in core ▪ Expand NIM at least commercial ▪ Built out Commercial, ▪ Slowed growth in 2017 20 bps banking businesses Multi-family and and 2018 while warehouse lending optimizing balance ▪ BankMobile segment ▪ Maintain best in platforms sheet mix profitability & class asset quality BankMobile ▪ Built a “branch lite” Technologies high growth execution on Community Bank strategic alternatives 2009-2011 2012–2019 2020 2025 Assets: $350M to $2.1B Assets grow to $11B+ Mid-single digit growth in Assets: TBD average earning assets 5

Proven Track Record of Consistent Growth Balance Sheet Tangible Book Value Per Share Deposits Loans Assets TBV/Share CUBI Stock Price $ in billions $12.0 $40.00 $11.5 $35.00 $10.0 $10.1 $9.8 $9.8 $9.4 $30.00 $8.7 $8.6 $8.0 $8.4 $8.3 $8.5 $25.00 $26.17 $7.3 $7.3 $7.1 $23.32 $6.0 $6.8 $20.00 $21.90 $20.49 $5.9 $18.39 $15.00 $4.0 $10.00 $2.0 $5.00 $0.0 $0.00 12/31/15 12/31/16 12/31/17 12/31/18 12/31/19 12/31/15 12/31/16 12/31/17 12/31/18 12/31/19 6

Business Model Customers Bank Franchise Enhancing Diversified Lending Businesses Community Banking Specialty Banking Businesses Businesses $5.7B loans outstanding $4.4B loans outstanding at December 31, 2019 at December 31, 2019 7

Business Model: Diversified Lending Increasing Franchise Value Strategically Managing Loan Portfolio to Maximize Shareholder Value SBA Lending Commercial Loans to Mortgage Companies 1% 8% 23% Specialty Finance Commercial Loans to Equipment Residential 5% Finance & Residential Mortgage Companies Mortgages Leasing Mortgages 18% 4% SBA Lending 5% Specialty Finance Multi-Family 39% 1% 12% Fintech Banking Q4 2% Q4 1% 2% Equipment Finance & Leasing 2018 Fintech Banking 2019 Multi-Family 24% 14% 14% Community Banking Community Banking C&I / CRE O.O 14% 13% C&I / CRE O.O Commercial RE Investment Commercial RE Investment Loan Portfolio Q4 2018 Q4 2019 % Change Community Banking C&I / CRE O.O. $1.2 $1.4 17% Community Banking Commercial RE Investment $1.2 $1.3 8% Multi-Family $3.3 $2.4 27% SBA Lending $0.1 $0.1 0% Residential Mortgages $0.7 $0.5 29% $ in billions Commercial Loans to Mortgage Companies $1.5 $2.3 53% Specialty Finance $0.2 $0.5 150% Equipment Finance & Leasing $0.2 $0.4 100% Fintech Banking $0.1 $1.2 1,100% Total Loans $8.5 $10.1 19% 8
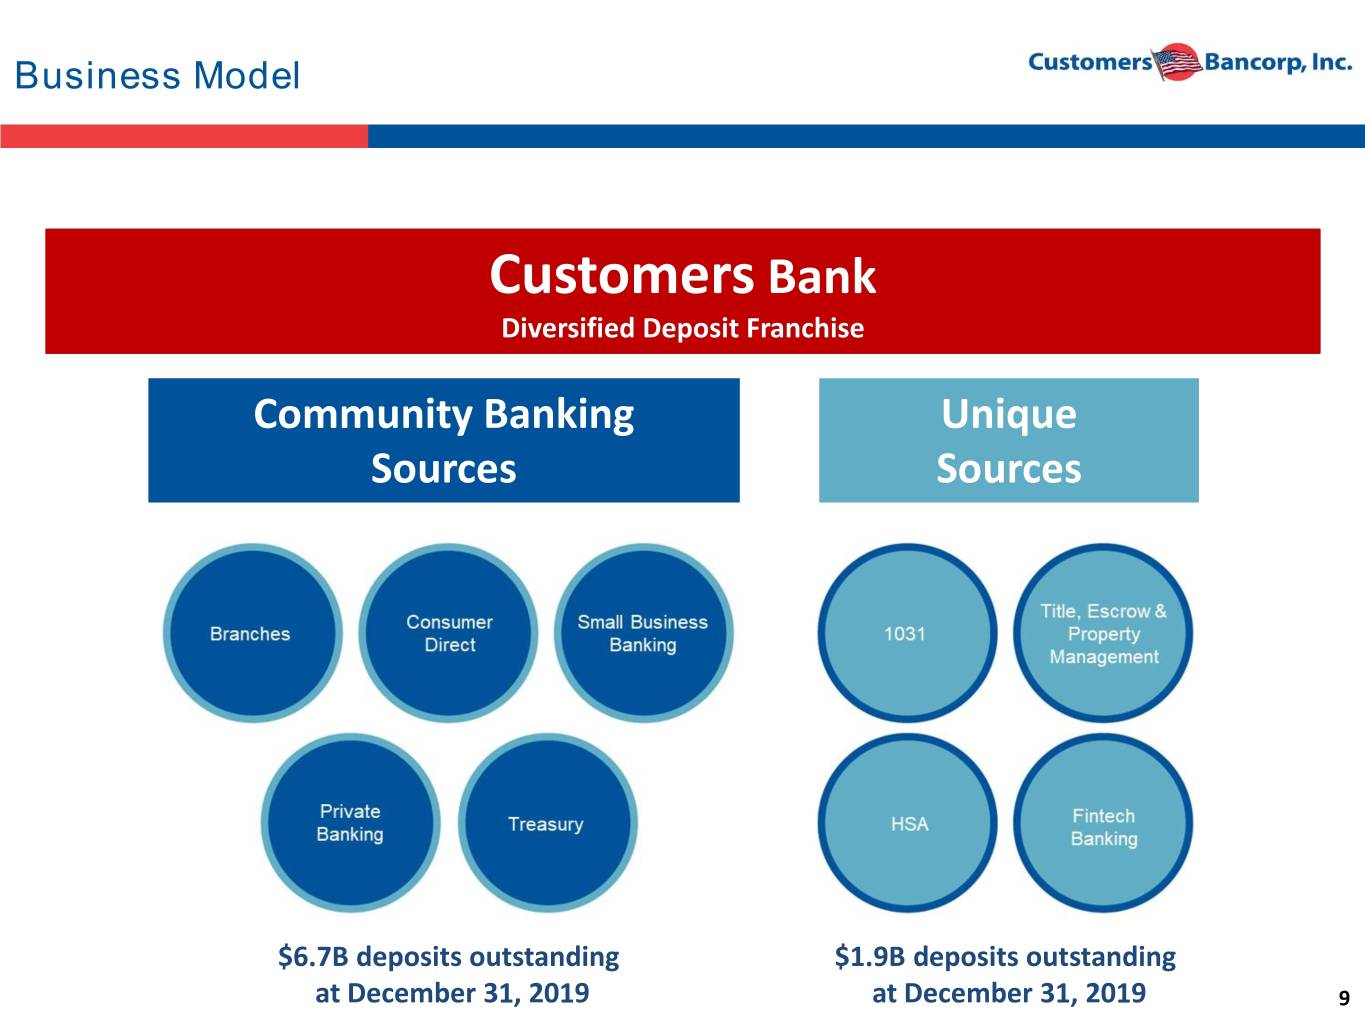
Business Model Customers Bank Diversified Deposit Franchise Community Banking Unique Sources Sources $6.7B deposits outstanding $1.9B deposits outstanding at December 31, 2019 at December 31, 2019 9

Business Model: 2019 Deposits Growth In The Right Areas Deposit Growth We continue to improve our funding mix as we replace higher cost funding with lower cost core deposits from BankMobile, our Digital Direct Bank, and core business units Source: Company Data Total may not sum due to rounding 10

Business Model: Translating to Net Interest Margin FTE Net Interest Margin(1) Interest-Earning Assets Interest-Bearing Liabilities NIM(1) significantly expanded in Q4 2019 over Q4 2018: • NIM(1) expanded 6 basis points from Q3 2019 to 2.89% in Q4 2019 and up 32 basis points over Q4 2018; marking our fifth consecutive quarter of NIM (1) expansion from the trough of 2.47% reported in Q3 2018 • Yield on interest-earning assets decreased 11 basis points from Q3 2019 to 4.61%, but expanded 30 basis points when compared to Q4 2018 • Cost of interest-bearing liabilities decreased 16 basis points from Q3 2019 to 2.17% and was flat when compared to Q4 2018 (1) A non-GAAP measure; refer to the reconciliation schedules at the end of this document 11 Source: Company data

Outstanding Credit Quality Remains Better Than Peers Strong Track Record and NPLs to Total Assets Underwriting Comprehensive underwriting standards and processes • Loan origination supported by centralized credit group • Disciplined LTV and DSC standards for CRE o Only 2 bps of charge-offs in multi- family portfolio • Measured growth High quality direct commercial lending relationship • Lending within geographic footprint Specialized institutional lending teams in higher margin / lower risk niches • No direct leveraged lending • Grow and create niche businesses • Strong Fintech Banking with in-house loan underwriting team o Developing deep and broad relationships with selected fintechs within our defined credit appetite (average 744 FICO, no subprime) Source: S&P Global, Company data. Peer data consists of Northeast and Mid-Atlantic banks and thrifts with comparable asset size and predominantly commercial business focused loan portfolios as further described in our 2019 proxy. Industry data includes all commercial and savings banks. Peer and industry data as of September 30, 2019. Industry and peer data in the current YTD period is not yet available for all companies. 12

Attractive Investment Opportunity The Company is well positioned to execute on its 2020 and 2025 LT strategies • 2020: $3 Core EPS, ~3% NIM, ~1% ROA, ~1.3% pre-tax, pre-provision ROA, and double-digit ROE • 2025: $6 Core EPS, 3%+ NIM, 1.25% ROA, ~1.5%+ pre-tax, pre-provision ROA, and double-digit ROE 2020 NIM expansion and profitability targets will be achieved by executing on: Assets: Measured growth while focus on maintaining / increasing yield on assets • Increase and expand Commercial client relationships in Community Banking Businesses • Increase and expand Specialty Banking Business and hire team(s) to expand niche business lines • Decrease lower yielding Multi-Family Deposits: Continue to grow core deposits and experience repricing in 2020 • Continue to grow high quality core deposits at above market growth rates • Further reduce deposit costs by repricing for 2019 fed cuts with the full benefit to be mostly realized in 2H2020 Expenses: Converge to peer efficiency represents significant upside • Continue digital transformation through creation of fintech ecosystem combined with process improvement to achieve peer efficiency in near term • Goal to achieve 40% efficiency ratio or better Capital allocation and philosophy consistent expected to be viewed favorably • Emphasis will be on continuously improving quality of balance sheet Common Tier I Capital Total Capital Tier I Capital Equity Tier I to RWA(1) to RWA(1) to Average • Capital management will dictate our assets and earnings decisions to RWA(1) Assets(1) • TCE not to go below 7% at year-end 8.0% 10.1% 12.2% 9.3% Customers has publicly stated it is exploring strategic alternatives in 2020 for BankMobile Customers trading at 0.85x TBV(2) and 7.5x 2020 EPS(2) versus 1.6x and 12.4x for our peer group(3), which limits downside with significant upside potential (1) Regulatory capital ratios are estimated for Q4 2019 (2) Based on February 11, 2020 closing stock price of $22.37, December 31, 2019 tangible book value per common share of $26.17, and 2020 EPS of $3.00 per share. (3) Source: S&P Global, Company data. Peer data consists of Northeast and Mid-Atlantic banks and thrifts with comparable asset size and predominantly commercial business focused loan portfolios as further described in our 2019 proxy. 13 Customers and peer data as of December 31, 2019.

Appendix 14

Q4 2019 Profitability – Continued Improvement QoQ YoY ($ in thousands) Q4 2019 Q3 2019 Q4 2018 $ Change % Change $ Change % Change GAAP Profitability Metrics: GAAP earnings $23,911 $23,451 $14,247 $460 2% $9,664 68% Diluted EPS $0.75 $0.74 $0.44 $0.01 1% $0.31 70% ROAA 0.97% 0.95% 0.71% 0.02% 2% 0.26% 37% ROCE 11.58% 11.81% 7.58% (0.23)% (2)% 4.00% 53% Non-GAAP Profitability Metrics(1): Core earnings $24,272 $23,024 $16,992 $1,248 5% $7,280 43% Core diluted EPS $0.76 $0.73 $0.53 $0.03 4% $0.23 43% NIM, TE 2.89% 2.83% 2.57% 0.06% 2% 0.32% 12% Adjusted ROAA Pre- 1.59% 1.38% 1.12% 0.21% 15% 0.47% 42% tax and Pre-provision Core ROAA 0.98% 0.94% 0.82% 0.04% 4% 0.16% 20% Core ROCE 11.76% 11.59% 9.05% 0.17% 1% 2.71% 30% (1) Non-GAAP measures; refer to the reconciliation schedules at the end of this document 15
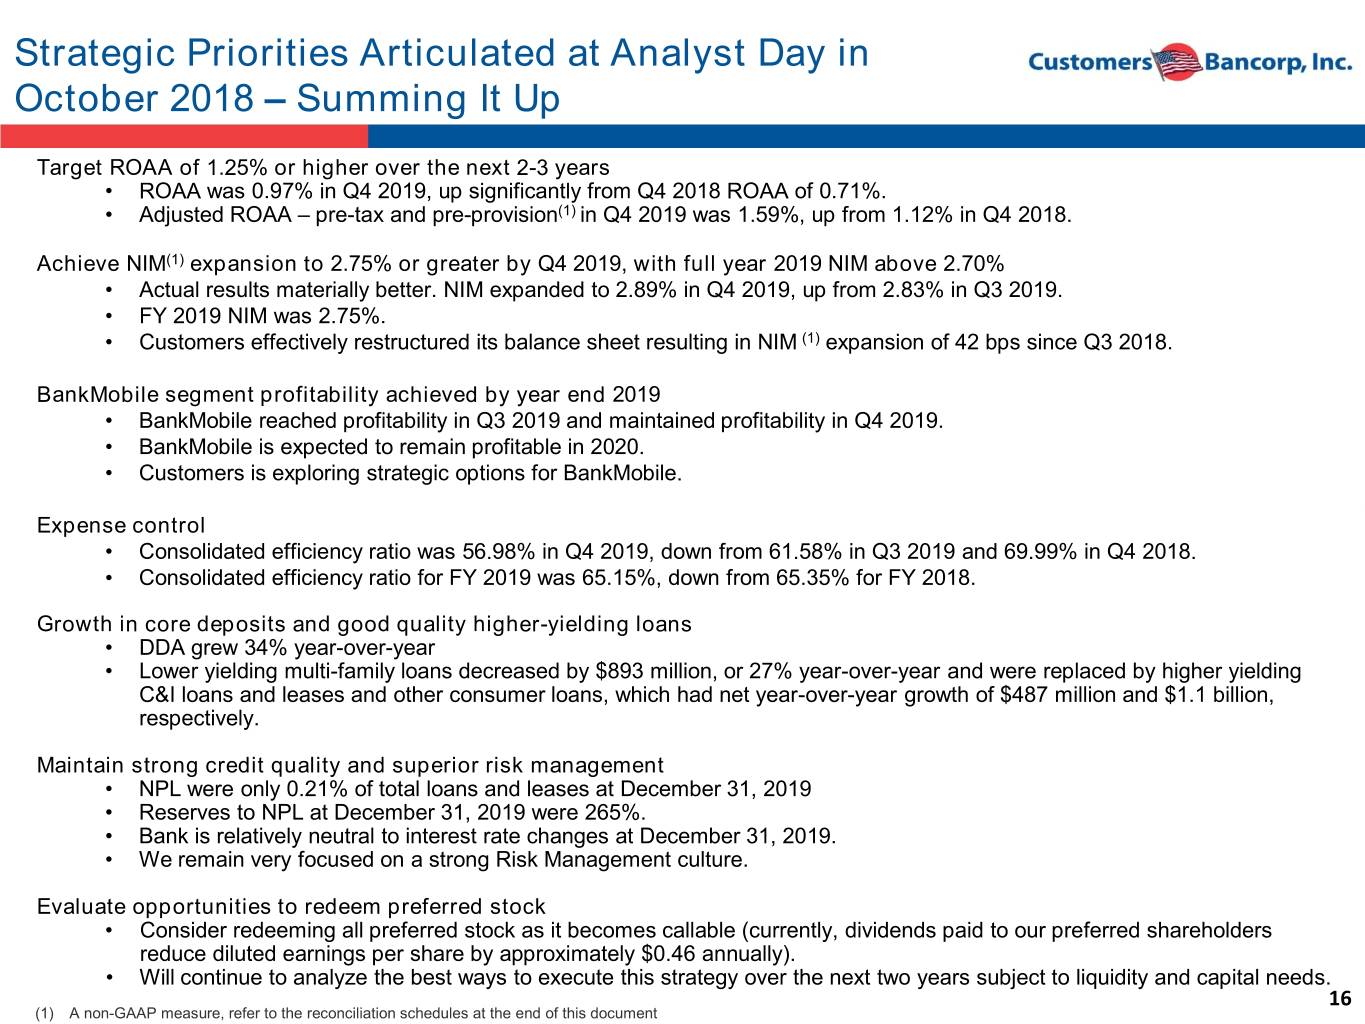
Strategic Priorities Articulated at Analyst Day in October 2018 – Summing It Up Target ROAA of 1.25% or higher over the next 2-3 years • ROAA was 0.97% in Q4 2019, up significantly from Q4 2018 ROAA of 0.71%. • Adjusted ROAA – pre-tax and pre-provision(1) in Q4 2019 was 1.59%, up from 1.12% in Q4 2018. Achieve NIM(1) expansion to 2.75% or greater by Q4 2019, with full year 2019 NIM above 2.70% • Actual results materially better. NIM expanded to 2.89% in Q4 2019, up from 2.83% in Q3 2019. • FY 2019 NIM was 2.75%. • Customers effectively restructured its balance sheet resulting in NIM (1) expansion of 42 bps since Q3 2018. BankMobile segment profitability achieved by year end 2019 • BankMobile reached profitability in Q3 2019 and maintained profitability in Q4 2019. • BankMobile is expected to remain profitable in 2020. • Customers is exploring strategic options for BankMobile. Expense control • Consolidated efficiency ratio was 56.98% in Q4 2019, down from 61.58% in Q3 2019 and 69.99% in Q4 2018. • Consolidated efficiency ratio for FY 2019 was 65.15%, down from 65.35% for FY 2018. Growth in core deposits and good quality higher-yielding loans • DDA grew 34% year-over-year • Lower yielding multi-family loans decreased by $893 million, or 27% year-over-year and were replaced by higher yielding C&I loans and leases and other consumer loans, which had net year-over-year growth of $487 million and $1.1 billion, respectively. Maintain strong credit quality and superior risk management • NPL were only 0.21% of total loans and leases at December 31, 2019 • Reserves to NPL at December 31, 2019 were 265%. • Bank is relatively neutral to interest rate changes at December 31, 2019. • We remain very focused on a strong Risk Management culture. Evaluate opportunities to redeem preferred stock • Consider redeeming all preferred stock as it becomes callable (currently, dividends paid to our preferred shareholders reduce diluted earnings per share by approximately $0.46 annually). • Will continue to analyze the best ways to execute this strategy over the next two years subject to liquidity and capital needs. 16 (1) A non-GAAP measure, refer to the reconciliation schedules at the end of this document

Contacts Company: Carla Leibold, CFO of Customers Bancorp, Inc and Customers Bank Tel: 484-923-8802 cleibold@customersbank.com Jay Sidhu Chairman & CEO of Customers Bancorp, Inc. and Executive Chairman of Customers Bank Tel: 610-935-8693 jsidhu@customersbank.com Richard Ehst President & COO of Customers Bancorp, Inc. and CEO of Customers Bank Tel: 610-917-3263 rehst@customersbank.com Sam Sidhu COO of Customers Bank & Head of Corporate Development of Customers Bancorp Tel: 212-843-2485 ssidhu@customersbank.com 17

Reconciliation of Non-GAAP Measures - Unaudited Customers believes that the non-GAAP measurements disclosed within this document are useful for investors, regulators, management and others to evaluate our core results of operations and financial condition relative to other financial institutions. These non-GAAP financial measures are frequently used by securities analysts, investors, and other interested parties in the evaluation of companies in Customers' industry. These non-GAAP financial measures exclude from corresponding GAAP measures the impact of certain elements that we do not believe are representative of our ongoing financial results, which we believe enhance an overall understanding of our performance and increases comparability of our period to period results. Investors should consider our performance and financial condition as reported under GAAP and all other relevant information when assessing our performance or financial condition. Although non-GAAP financial measures are frequently used in the evaluation of a company, they have limitations as analytical tools and should not be considered in isolation or as a substitute for analysis of our results of operations or financial condition as reported under GAAP. The following tables present reconciliations of GAAP to non-GAAP measures disclosed within this document. 18
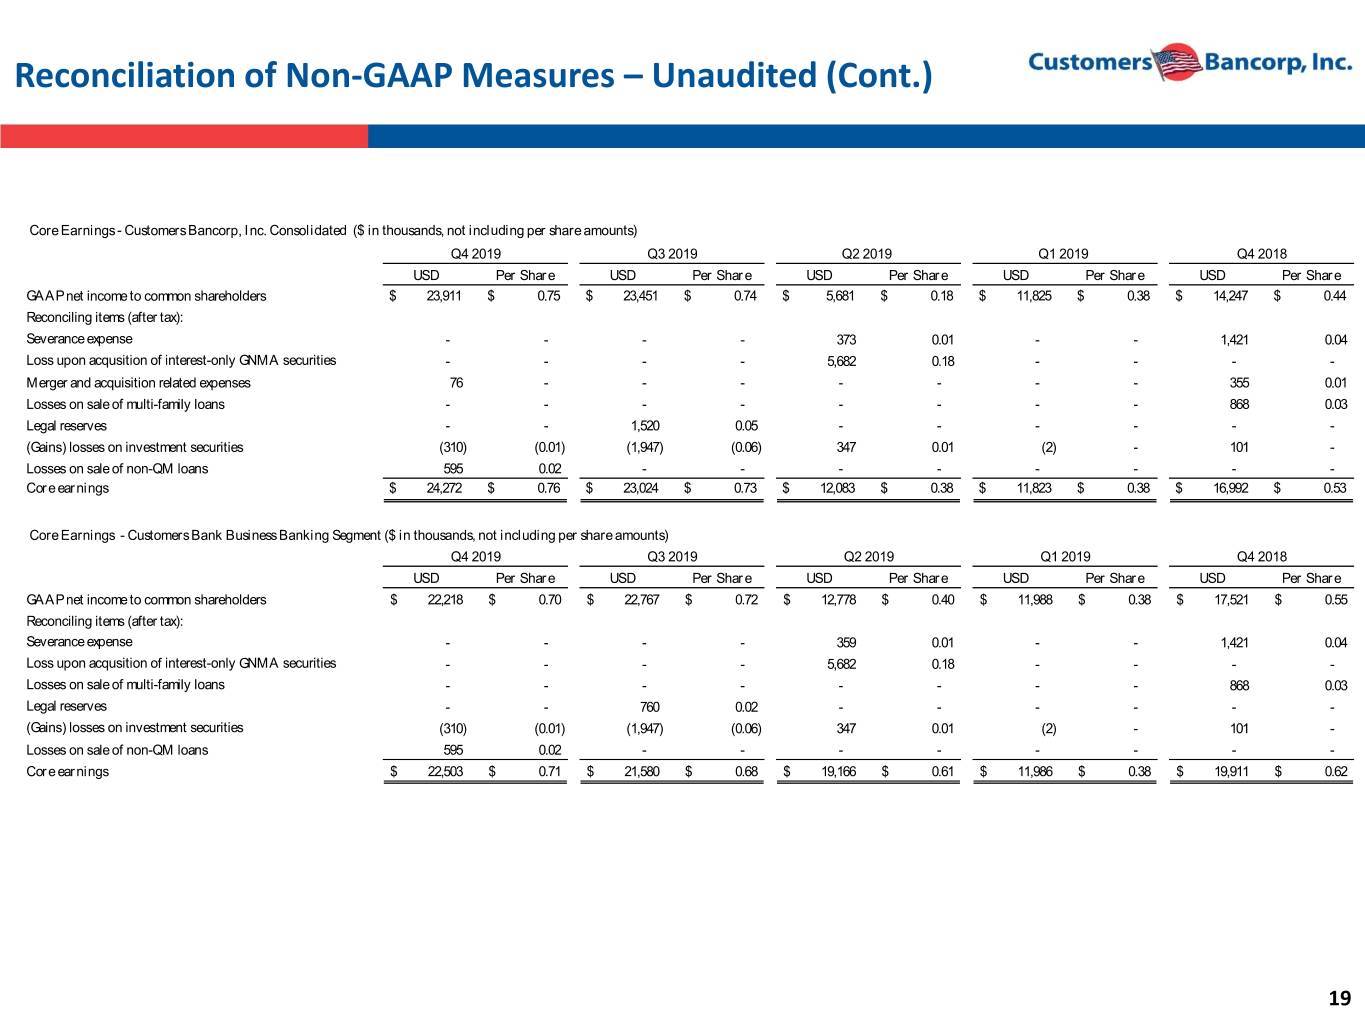
Reconciliation of Non-GAAP Measures – Unaudited (Cont.) Core Earnings - Customers Bancorp, Inc. Consolidated ($ in thousands, not including per share amounts) Q4 2019 Q3 2019 Q2 2019 Q1 2019 Q4 2018 USD Per Share USD Per Share USD Per Share USD Per Share USD Per Share GAAP net income to common shareholders $ 23,911 $ 0.75 $ 23,451 $ 0.74 $ 5,681 $ 0.18 $ 11,825 $ 0.38 $ 14,247 $ 0.44 Reconciling items (after tax): Severance expense - - - - 373 0.01 - - 1,421 0.04 Loss upon acqusition of interest-only GNMA securities - - - - 5,682 0.18 - - - - Merger and acquisition related expenses 76 - - - - - - - 355 0.01 Losses on sale of multi-family loans - - - - - - - - 868 0.03 Legal reserves - - 1,520 0.05 - - - - - - (Gains) losses on investment securities (310) (0.01) (1,947) (0.06) 347 0.01 (2) - 101 - Losses on sale of non-QM loans 595 0.02 - - - - - - - - Core earnings $ 24,272 $ 0.76 $ 23,024 $ 0.73 $ 12,083 $ 0.38 $ 11,823 $ 0.38 $ 16,992 $ 0.53 Core Earnings - Customers Bank Business Banking Segment ($ in thousands, not including per share amounts) Q4 2019 Q3 2019 Q2 2019 Q1 2019 Q4 2018 USD Per Share USD Per Share USD Per Share USD Per Share USD Per Share GAAP net income to common shareholders $ 22,218 $ 0.70 $ 22,767 $ 0.72 $ 12,778 $ 0.40 $ 11,988 $ 0.38 $ 17,521 $ 0.55 Reconciling items (after tax): Severance expense - - - - 359 0.01 - - 1,421 0.04 Loss upon acqusition of interest-only GNMA securities - - - - 5,682 0.18 - - - - Losses on sale of multi-family loans - - - - - - - - 868 0.03 Legal reserves - - 760 0.02 - - - - - - (Gains) losses on investment securities (310) (0.01) (1,947) (0.06) 347 0.01 (2) - 101 - Losses on sale of non-QM loans 595 0.02 - - - - - - - - Core earnings $ 22,503 $ 0.71 $ 21,580 $ 0.68 $ 19,166 $ 0.61 $ 11,986 $ 0.38 $ 19,911 $ 0.62 19
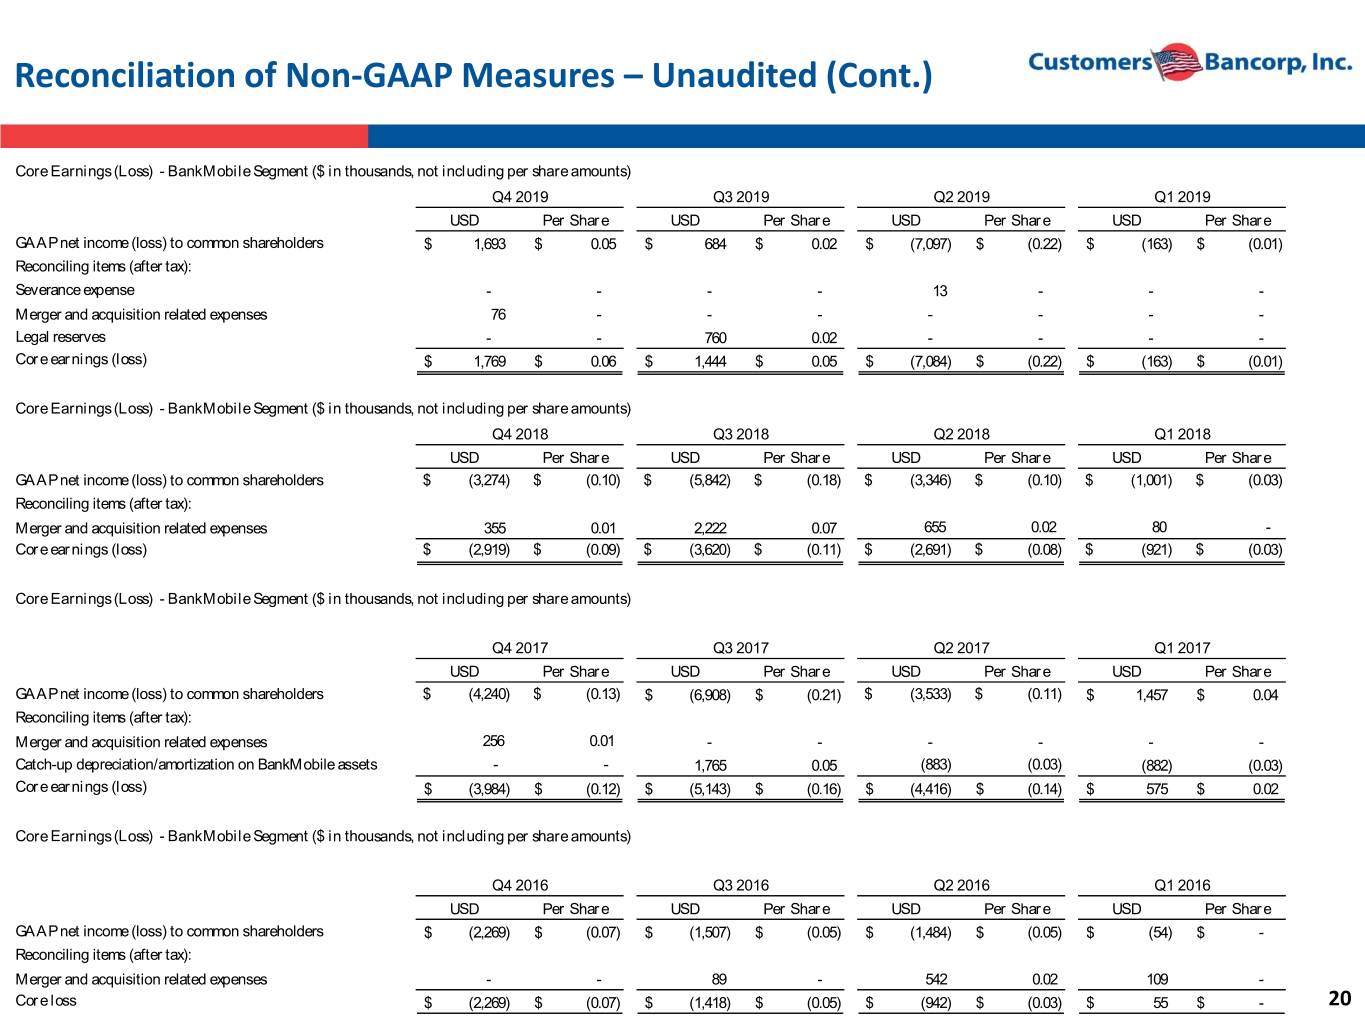
Reconciliation of Non-GAAP Measures – Unaudited (Cont.) Core Earnings (Loss) - BankMobile Segment ($ in thousands, not including per share amounts) Q4 2019 Q3 2019 Q2 2019 Q1 2019 USD Per Share USD Per Share USD Per Share USD Per Share GAAP net income (loss) to common shareholders $ 1,693 $ 0.05 $ 684 $ 0.02 $ (7,097) $ (0.22) $ (163) $ (0.01) Reconciling items (after tax): Severance expense - - - - 13 - - - Merger and acquisition related expenses 76 - - - - - - - Legal reserves - - 760 0.02 - - - - Core earnings (loss) $ 1,769 $ 0.06 $ 1,444 $ 0.05 $ (7,084) $ (0.22) $ (163) $ (0.01) Core Earnings (Loss) - BankMobile Segment ($ in thousands, not including per share amounts) Q4 2018 Q3 2018 Q2 2018 Q1 2018 USD Per Share USD Per Share USD Per Share USD Per Share GAAP net income (loss) to common shareholders $ (3,274) $ (0.10) $ (5,842) $ (0.18) $ (3,346) $ (0.10) $ (1,001) $ (0.03) Reconciling items (after tax): Merger and acquisition related expenses 355 0.01 2,222 0.07 655 0.02 80 - Core earnings (loss) $ (2,919) $ (0.09) $ (3,620) $ (0.11) $ (2,691) $ (0.08) $ (921) $ (0.03) Core Earnings (Loss) - BankMobile Segment ($ in thousands, not including per share amounts) Q4 2017 Q3 2017 Q2 2017 Q1 2017 USD Per Share USD Per Share USD Per Share USD Per Share GAAP net income (loss) to common shareholders $ (4,240) $ (0.13) $ (6,908) $ (0.21) $ (3,533) $ (0.11) $ 1,457 $ 0.04 Reconciling items (after tax): Merger and acquisition related expenses 256 0.01 - - - - - - Catch-up depreciation/amortization on BankMobile assets - - 1,765 0.05 (883) (0.03) (882) (0.03) Core earnings (loss) $ (3,984) $ (0.12) $ (5,143) $ (0.16) $ (4,416) $ (0.14) $ 575 $ 0.02 Core Earnings (Loss) - BankMobile Segment ($ in thousands, not including per share amounts) Q4 2016 Q3 2016 Q2 2016 Q1 2016 USD Per Share USD Per Share USD Per Share USD Per Share GAAP net income (loss) to common shareholders $ (2,269) $ (0.07) $ (1,507) $ (0.05) $ (1,484) $ (0.05) $ (54) $ - Reconciling items (after tax): Merger and acquisition related expenses - - 89 - 542 0.02 109 - Core loss $ (2,269) $ (0.07) $ (1,418) $ (0.05) $ (942) $ (0.03) $ 55 $ - 20

Reconciliation of Non-GAAP Measures – Unaudited (Cont.) Tangible Book Value per Common Share - Customers Bancorp, Inc. Consolidated ($ in thousands, except per share data) Q4 2019 Q3 2019 Q2 2019 Q1 2019 Q4 2018 Q4 2017 Q4 2016 Q4 2015 Q4 2014 GAAP -Total Shareholders' Equity $ 1,052,795 $ 1,019,919 $ 991,405 $ 978,373 $ 956,816 $ 920,964 $ 855,872 $ 553,902 $ 443,145 Reconciling Items: Preferred Stock (217,471) (217,471) (217,471) (217,471) (217,471) (217,471) (217,471) (55,569) - Goodwill and Other Intangibles (15,195) (15,521) (15,847) (16,173) (16,499) (16,295) (17,621) (3,651) (3,664) Tangible Common Equity $ 820,129 $ 786,927 $ 758,087 $ 744,729 $ 722,846 $ 687,198 $ 620,780 $ 494,682 $ 439,481 Common shares outstanding 31,336,791 31,245,776 31,202,023 31,131,247 31,003,028 31,382,503 30,289,917 26,901,801 26,745,529 Tangible Book Value per Common Share $ 26.17 $ 25.16 $ 24.30 $ 23.92 $ 23.32 $ 21.90 $ 20.49 $ 18.39 $ 16.43 CAGR 9.76% Customers Bancorp, Inc. Consolidated - Net Interest Margin, tax equivalent ($ in thousands) Twelve Months Ended December 31, Q4 2019 Q3 2019 Q2 2019 Q1 2019 Q4 2018 2019 2018 GAAP Net interest income $ 77,593 $ 75,735 $ 64,679 $ 59,304 $ 61,524 $ 277,310 $ 257,877 Tax-equivalent adjustment 187 184 183 181 171 735 685 Net interest income tax equivalent $ 77,780 $ 75,919 $ 64,862 $ 59,485 $ 61,695 $ 278,045 $ 258,562 Average total interest earning assets $ 10,676,730 $ 10,667,198 $ 9,851,150 $ 9,278,413 $ 9,518,120 $ 10,123,708 $ 10,011,799 Net interest margin, tax equivalent 2.89% 2.83% 2.64% 2.59% 2.57% 2.75% 2.58% 21

Reconciliation of Non-GAAP Measures – Unaudited (Cont.) Twelve Months Ended Core Return on Average Assets - Customers Bancorp December 31, (dollars in thousands except per share data) Q4 2019 Q3 2019 Q2 2019 Q1 2019 Q4 2018 2019 2018 GAAP net income 27,526 27,066 9,296 15,440 17,862 79,327 71,695 Reconciling items (after tax): Severance expense - - 373 - 1,421 373 1,421 Loss upon acquisition of interest-only GNMA securities - - 5,682 - - 5,682 - Merger and acquisition related expenses 76 - - - 355 76 3,312 Losses on sale of multi-family loans - - - - 868 - 868 Legal reserves - 1,520 - - - 1,520 - (Gains) losses on investment securities (310) (1,947) 347 (2) 101 (1,912) 15,646 Losses on sale of non-QM loans 595 - - - - 595 - Core net income 27,887 26,639 15,698 15,438 20,607 85,661 92,942 Average total assets 11,257,141 11,259,144 10,371,842 9,759,529 9,947,367 10,667,653 10,418,102 Core return on average assets 0.98% 0.94% 0.61% 0.64% 0.82% 0.80% 0.89% Twelve Months Ended Core Return on Average Common Equity - Customers Bancorp December 31, (dollars in thousands except per share data) Q4 2019 Q3 2019 Q2 2019 Q1 2019 Q4 2018 2019 2018 GAAP net income to common shareholders 23,911 23,451 5,681 11,825 14,247 64,868 57,236 Reconciling items (after tax): Severance expense - - 373 - 1,421 373 1,421 Loss upon acquisition of interest-only GNMA securities - - 5,682 - - 5,682 - Merger and acquisition related expenses 76 - - - 355 76 3,312 Losses on sale of multi-family loans - - - - 868 - 868 Legal reserves - 1,520 - - - 1,520 - (Gains) losses on investment securities (310) (1,947) 347 (2) 101 (1,912) 15,646 Losses on sale of non-QM loans 595 - - - - 595 - Core earnings 24,272 23,024 12,083 11,823 16,992 71,202 78,483 Average total common shareholders' equity 819,018 768,592 751,133 745,226 732,302 781,860 724,505 Core return on average common equity 11.76% 11.59% 6.31% 6.38% 9.05% 9.11% 10.83% 22

Reconciliation of Non-GAAP Measures – Unaudited (Cont.) Adjusted Net Income and Adjusted ROAA - Pre-Tax Pre-Provision - Twelve Months Ended Customers Bancorp December 31, (dollars in thousands except per share data) Q4 2019 Q3 2019 Q2 2019 Q1 2019 Q4 2018 2019 2018 GAAP net income 27,526 27,066 9,296 15,440 17,862 79,327 71,695 Reconciling items: Income tax expense 7,451 8,020 2,491 4,831 5,109 22,793 19,359 Provision for loan and lease losses 9,689 4,426 5,346 4,767 1,385 24,227 5,642 Severance expense - - 490 - 1,869 490 1,869 Loss upon acquisition of interest-only GNMA securities - - 7,476 - - 7,476 - Merger and acquisition related expenses 100 - - - 470 100 4,391 Losses on sale of multi-family loans - - - - 1,161 - 1,161 Legal reserves - 2,000 - - - 2,000 - (Gains) losses on investment securities (310) (2,334) 347 (2) 101 (2,300) 20,293 Losses on sale of non-QM residential mortgage loans 782 - - - - 782 - Adjusted net income - pre-tax pre-provision 45,238 39,178 25,446 25,036 27,957 134,895 124,410 Average total assets 11,257,207 11,259,144 10,371,842 9,759,529 9,947,367 10,667,653 10,418,102 Adjusted ROAA - pre-tax pre-provision 1.59% 1.38% 0.98% 1.04% 1.12% 1.26% 1.19% 23
