Attached files
| file | filename |
|---|---|
| 8-K - 8-K - BRYN MAWR BANK CORP | bmtc-20200212.htm |

BRYN MAWR BANK CORPORATION 4th Quarter 2019 Presentation 1

Table of Contents i. Strategic Overview 4 ii. Commercial Banking 10 iii. Credit Environment 16 iv. BMT Wealth Management 21 v. Technology Strategy 26 vi. Financials: Tying it all together 28 vii. Appendix 32 2
Forward Looking Statement The statements contained herein that are not historical facts are forward-looking statements based on management’s current expectations and beliefs concerning future developments and their potential effects on the Bryn Mawr Bank Corp. (the “Corporation") including, without limitation, plans, strategies, goals and assumptions, and statements about the Corporation’s expectations regarding revenue and asset growth, financial performance and profitability, loan and deposit growth, yields and returns, loan diversification and credit management, stockholder value creation, tax rates and the impact of acquisitions we have made or may make. Such statements involve inherent risks and uncertainties, many of which are difficult to predict and are generally beyond the control of the Corporation. There can be no assurance that future developments affecting the Corporation will be the same as those anticipated by management. The Corporation cautions readers that a number of important factors could cause actual results to differ materially from those expressed in, or implied or projected by, such forward-looking statements. These risks and uncertainties include, but are not limited to, the following: the strength of the United States economy in general and the strength of the local economies in which we conduct operations; the effects of, and changes in, trade, monetary and fiscal policies and laws, including interest rate policies of the Board of Governors of the Federal Reserve System; inflation/deflation, interest rate, market and monetary fluctuations; the effect of acquisitions we may make, including, without limitation, the failure to achieve the expected revenue growth and/or expense savings from such acquisitions, and/or the failure to effectively integrate an acquisition target into our operations; the timely development of competitive new products and services and the acceptance of these products and services by new and existing customers; the impact of changes in financial services policies, laws and regulations, including those concerning taxes, banking, securities and insurance, and the application thereof by regulatory bodies; the effectiveness of our risk management framework and quantitative models; changes in the level of our nonperforming assets and charge-offs; uncertainty regarding the future of LIBOR; the effect of changes in accounting policies and practices or accounting standards, as may be adopted from time- to-time by bank regulatory agencies, the U.S. Securities and Exchange Commission (“SEC”), the Public Company Accounting Oversight Board, the Financial Accounting Standards Board or other accounting standards setters, including ASU 2016-13 (Topic 326), “Measurement of Credit Losses on Financial Instruments,” commonly referenced as the Current Expected Credit Loss (“CECL”) model, which will change how we estimate credit losses and may increase the required level of our allowance for credit losses after adoption on January 1, 2020; possible other-than-temporary impairments of securities held by us; the impact of current governmental efforts to restructure the U.S. financial regulatory system, including any amendments to the Dodd-Frank Wall Street Reform and Consumer Protection Act; changes in consumer spending, borrowing and savings habits; the effects of our lack of a diversified loan portfolio, including the risks of geographic and industry concentrations; our ability to attract deposits and other sources of liquidity; the possibility that we may reduce or discontinue the payments of dividends on common stock; changes in the financial performance and/or condition of our borrowers; changes in the competitive environment among financial and bank holding companies and other financial service providers; geopolitical conditions, including acts or threats of terrorism, actions taken by the United States or other governments in response to acts or threats of terrorism and/or military conflicts, which could impact business and economic conditions in the United States and abroad; cybersecurity threats and the cost of defending against them, including the costs of compliance with potential legislation to combat cybersecurity at a state, national or global level; unanticipated regulatory or legal proceedings; and our ability to manage the risks involved in the foregoing. Additional factors that could cause actual results to differ materially from those expressed in the forward-looking statements are discussed in the Corporation’s 2018 Annual Report on Form 10-K and other reports filed with the SEC and available at the SEC’s Internet site (http://www.sec.gov). The Corporation undertakes no obligation to revise or publicly release any revision or update to these forward-looking statements to reflect events or circumstances that occur after the date on which such statements were made. Member FDIC. Equal Housing Lender. Securities, insurance, foreign exchange, and derivatives products are not a deposit, not FDIC insured, not bank guaranteed, not insured by any federal government agency, and may lose value. Statement on Non-GAAP Measures: The Corporation believes the presentation of the following non-GAAP financial measures provides useful supplemental information that is essential to an investor’s proper understanding of the results of operations and financial condition of the Corporation. Management uses non-GAAP financial measures in its analysis of the Corporation’s performance. These non-GAAP measures should not be viewed as substitutes for the financial measures determined in accordance with GAAP, nor are they necessarily comparable to non-GAAP performance measures that may be presented by other companies. 3

Strategic Overview

Located between the Boston-Washington corridor. The largest mega-region globally by economic output at $3.65 trillion. 5 Source: Visual Capitalist, 2018 data

Differentiating through One BMT One BMT is built upon a holistic approach to serving our clients by delivering advice and solutions that meet their financial needs. “One” team of uniquely qualified professionals serving “One” client at a time and delivering a full compliment of competitive products and services. BMT differentiates its services from its competitors based on the following: ― Personalized advice and solutions driven approach ― Achieving a consistent level of customer service ― Comprehensive product offering ― Competitive rates and fees ― Superior relationship management We expect every employee to operate under the principal of ONE Company, working as ONE team, serving clients ONE at a time. 6

Key Strategic Initiatives BMT believes there are four key strategic initiatives that span the company, and when executed, enable us to successfully achieve our vision: Communication Cultural Evolution Enhancement Operational & Risk Management Technological Maturation Transformation 7

Cultural Evolution & Corporate Social Responsibility Education Health & Wellness A solid education is one of the greatest assets anyone can have, and we at Our BMT Men’s & Women’s Health Initiatives bring our employees BMT believe one of the most impactful ways we can give back is by aiding together in unique ways to spotlight issues which affect many throughout schools and educational organizations in a variety of ways. our communities. Diversity & Inclusion Volunteerism BMT is committed to helping as many organizations as possible, and we We can make our communities stronger by making sure everyone has a have made it easier for our employees to give their valuable time to more seat at the table. organizations. Financial Empowerment Green Initiatives Being responsible with our resources does not focus solely on solid BMT is committed to empowering people to reach for their dreams financial management; it also means being responsible with our natural without being confined by income, credit score, or past mistakes. resources and our environmental impact. 8

Investment in Talent Linda Sanchez SVP, Chief Human Resources Officer Mike Patrick Killeen Harrington Michael Adam Bonanno EVP, Chief Financial David Wong EVP, Chief Risk Officer Chief Technology Officer Officer SVP, Chief Audit Officer Thompson Jeff Mills Jennifer SVP & CFO, BMT Banking SVP & CIO, BMT Tina McDonald Neil Orechiwsky Kim Trubiano Wealth SVP, Director of SVP, Managing Director of Dempsey Fox President BMT Ins. Marketing Capital Market President BMT Wealth Advisors Chris McGill Jim Donovan Mike LaPlante Market President, Phila. & SVP, Head C&I Banking Keith SVP, Chief Accounting Southern NJ Officer Emanuel Ball McCutcheon Kevin Tylus SVP, Director of SVP, Treasurer Facilities Stephen President BMT Banking Wellman Mark Bradford Liam Brickley Lori SVP, CIO BMT Wealth Elizabeth Walsh SVP, Wealth Management Director SVP, Chief Credit Goldman SVP, Princeton Wealth Director Officer SVP, General Counsel 9

Banking

Banking Initiatives and Strategic Focus ▪ Expand C&I concentration over next five years ▪ Leverage Capital Market capabilities to support growth 65.0% 55.0% 55.9% 51.8% 48.2% 45.0% 44.1% 35.0% CRE C&I ▪ Dynamic and improved talent recruiting ▪ Alignment of company-wide incentives through One BMT ▪ Expanded geographic reach through cross-functional locations in Hershey and Princeton, for example C&I is comprised of commercial and industrial loans plus owner-occupied commercial mortgage loans. 11

Market Opportunities Dauphin County Businesses: 15k+ Target Businesses*: 1.6k+ Nonprofits: 700+ Mercer County Businesses: 32k+ Target Businesses*: 3.9k+ Nonprofits: 1.4k+ Philadelphia MSA Philadelphia MSA Businesses: 270k+ Target Businesses*: 39k+ Nonprofits: 10k+ 12 *$3-$20 million in annual revenue Source: S&P Global

C&I Opportunities in Key Segments ▪ Targeting professional, wholesale and manufacturing C&I ▪ Current C&I portfolio mix Utilities, 2% Other, 14% Professional, 3% Real Estate, 27% Wholesale Trade, 3% Manufacturing, 5% Healthcare, 14% Educational Finance & Services, 9% Insurance, 11% ▪ Investment in talent, focused on credit creation ▪ C&I Opportunities lead to: ▪ Treasury management ▪ Capital Markets including foreign exchange and trade-finance ▪ Wealth Management 13 Source: Public Filings as of 12/31/2019

Funding Our Growth Deposit growth will be driven by… ▪ Capitalizing on opportunities from market consolidation Philly MSA: Consolidation creates Opportunity BMT has gone from 11th to 4th largest2 $ billion 2010 2019 Bank in terms of total deposits 1 Institutions 106 36% 68 1. PNC Total Deposits $64.4 21% $77.7 2. WSFS 3. UVSP Market Share 17% Flat 17% 4. BMTC Total Branches 1,028 28% 736 5. FULT ▪ Business banking (C&I) build-out is partially self-funded ▪ Continued penetration of wealth customer base ▪ Improved digital channels ▪ Continued retail growth initiatives ▪ Leverage municipal opportunities as alternative to wholesale deposits 1Headquartered in PA, NJ or DE, with >$10 million in deposits 2Headquartered in PA, NJ or DE, with >$10 million in deposits and more than 1 branch 14 Source: S&P Global
About BMT Capital Markets BMT Capital Markets works with customers that have interest rate or foreign currency market exposures by delivering risk management strategies and product structuring solutions ✓ We help operating companies and individuals minimize cross-border transaction risk with more efficient international payment practices and foreign exchange hedging tools ✓ We help commercial borrowers and middle market debt issuers manage their liabilities with effective interest rate hedging strategies ✓ We provide risk management capabilities to partner financial institutions, leveraging the capital markets infrastructure to access opportunities beyond BMT’s existing customer base ✓ We lead with analysis in delivering big bank capabilities with community bank relationship values BMT Capital Markets has a wide array of products and services to meet the needs of our customers ✓ Interest Rate Hedging ✓ Foreign Exchange Payments ✓ Trade Finance • Swaps • SWIFT Payments • Import Letters of Credit • Forward Rate Locks • Incoming Foreign Wires • Export Letters of Credit • Caps • Outgoing Foreign Wires • Standby Letters of Credit • Collars • Banknotes • Documentary Collections • Cancellables • Check Collections & Drafts • EXIM, SBA International • Customized Solutions • Foreign Currency Accounts • Structured Solutions ✓ Foreign Exchange Hedging • Forwards • Options • Customized Programs 15

Credit Management

Credit Management A track record of consistency Loan Growth $4,000 Acquired Royal 40% Acquired First Bancshares of $3,689 Keystone Acquired Pennsylvania, Inc. Financial, Inc. Continental Bank 30% Holdings, Inc. $3,000 First Bank of 20% Delaware loans $2,000 & deposits $ in $ millions 10% $1,000 $692 0% $0 -10% Total Loans Loan Growth ➢ Additionally, 10% annual organic loan growth since 2006 17 Source: Public Filings

Credit Management A track record of consistency NPLs / Total Loans Acquired First 4.00% Keystone Financial, Inc. 3.37% 3.00% 2.63% Acquired Continental Bank 2.00% Holdings, Inc. Acquired Royal Bancshares of Pennsylvania, Inc. First Bank of Delaware loans 0.87% 1.00% & deposits 0.94% 0.49% 0.75% 0.46% 0.54% 0.10% 0.00% BMTC Peer Average Banks $3-$7B Disciplined, consistent credit culture through both organic growth and acquisitions 18 Source: S&P Global

Loan Portfolio Composition Loan Portfolio: $3.7 Billion Construction, 4% Consumer, 2% Leases, 4% Home equity loans and lines, 5% Residential Commercial Mortgages, mortgages, 13% 40% Commercial & Industrial, 19% Commercial Mortgages C&I and Commercial (Owner-Occupied), 12% Mortgage Product Subset: $2.6 Billion C&I and Owner- Nonowner Occupied Occupied, 56% Commercial Mtg, 44% C&I is comprised of commercial and industrial loans plus owner-occupied commercial mortgage loans. 19 Source: Public Filings as of 12/31/2019
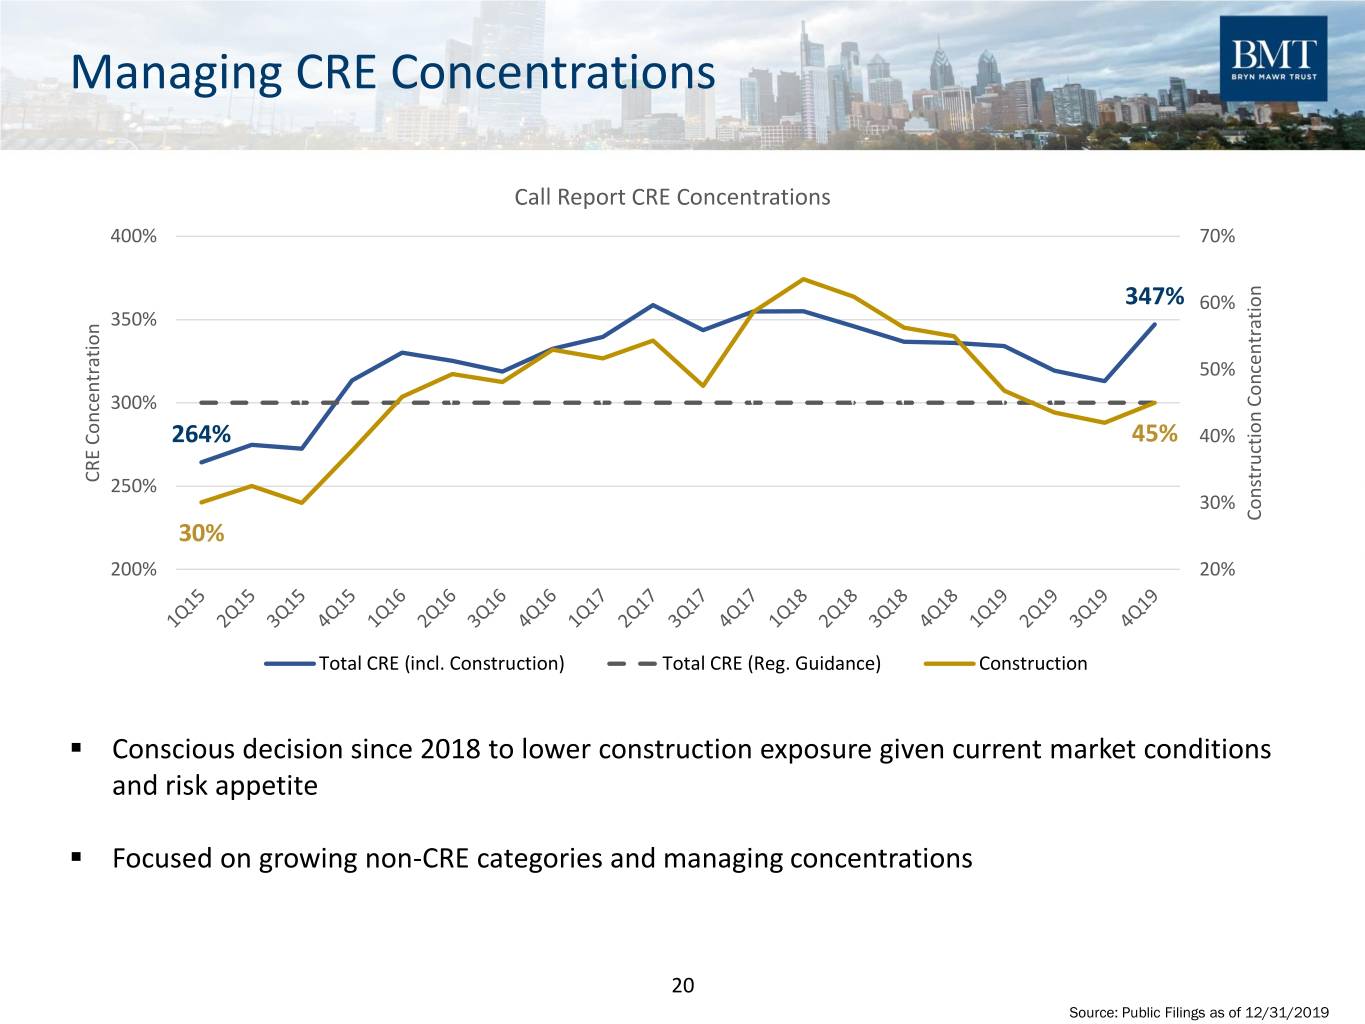
Managing CRE Concentrations Call Report CRE Concentrations 400% 70% 347% 60% 350% 50% 300% 264% 45% 40% CRE Concentration CRE 250% 30% Construction Concentration Construction 30% 200% 20% Total CRE (incl. Construction) Total CRE (Reg. Guidance) Construction ▪ Conscious decision since 2018 to lower construction exposure given current market conditions and risk appetite ▪ Focused on growing non-CRE categories and managing concentrations 20 Source: Public Filings as of 12/31/2019

Wealth Management

BMT Wealth Management ▪ Capabilities and professional depth of a large enterprise ▪ Wealth advisory/planning – Comprehensive, dynamic planning ▪ Investments – Disciplined approach has provided strong, risk-adjusted returns over decades of market cycles ▪ Fiduciary – 130 years of corporate fiduciary leadership ▪ Private Banking– Sophisticated solutions for high-net-worth clients ▪ BMT Insurance Advisors – Helping clients manage their risk ▪ Responsiveness of a community organization ▪ Local management and decision making ▪ Dedicated advisory team for every client relationship ▪ Multi-generational client care and stewardship ▪ Communications at level and frequency desired by every client ▪ Uniquely aligned with the interests of our clients ▪ Independent investment decisions ▪ Transparent fee structure ▪ Client-centric 22

Promise, Purpose & Priorities BMT: Your connection to a life fulfilled At BMT we connect clients to their purpose and promise. To achieve this: ▪ We lead with collaborative advice and planning ▪ We activate the best in every relationship ▪ We focus our attention, abilities and resources by connecting you to a life (mission, promise, purpose) fulfilled PRIORITIES Client Experience Employee Experience Business Results ✓ Enhance personal client ✓ Organize full wealth management ✓ Enhanced sales culture to drive service offering team to drive growth organic growth ✓ Create institutional asset ✓ Talent management ✓ Accelerated growth through management focus ✓ Leverage technology strategic hires ✓ Leverage marketing and ✓ Growth through targeted technology acquisitions 23
A Premier Wealth Management Brand A Premier Wealth Management Brand in the Region: ▪ Voted among “Best in Trust Administration” by The Legal Intelligencer for six consecutive years (2013-2018) ▪ In 2018, voted among “Best in Private Banks,” “Best in Wealth Management,” and “Best in Attorney Escrow Services” ▪ Ranked among the top money managers in the Philadelphia region by assets under management in the Philadelphia Business Journal’s 2018 List of Money Managers 2019 Accomplishments Toward Taking BMT Wealth to the Next Level Business Growth Client & Team Member Experience ✓ Enhanced Sales Culture ✓ eMoney Financial Planning ✓ Sales training – Legacy Companies ✓ Client Segmentation ✓ Disciplined Sales Process ✓ Asset Allocation ✓ OneBMT ✓ Tools & Technology ✓ Strategic Hires ✓ Philanthropic Segment ✓ Efficiency 24

BMT Delaware: The Delaware Advantage Delaware Advantage: Provide wealth management strategies by utilizing the range of legal and business advantages which are part of Delaware’s exceptional trust and tax environment. ▪ Tax advantages for wealth protection and wealth transfer ▪ A world-renowned legal system with specialized expertise in fiduciary and corporate matters ▪ Flexibility of investment strategy and execution ▪ Favorable rules pertaining to dynasty, directed trusts and domestic partnership ▪ Laws sensitive to clients’ need for confidentiality Why Choose BMT Delaware? ▪ Nationally positioned ▪ 2017 Tax Cuts & Jobs Act heightened awareness around tax planning opportunities, particularly for residents in high-tax states such as: CA, NY, NJ, CT, MA ▪ One BMT Strategy ▪ Extensive track record and history ▪ Access to other platform services 25

Technology Strategy

Technology Strategy AGILITY LOYALTY EFFICIENCY Latest Features Economies CLOUD Mobile Native of Elasticity FOUNDATIONS Scale High Performance Easy Consistent DIGITAL repeatable Pivot on demand INTEGRATION Simple processes PLATFORM Fast & controls Actionable Measurable Repeatable INSIGHT & Advice Outcomes Results AUTOMATION 27

Financial Outlook

Financial Recap – Q4 and Full Year 2019 RECAP 4th Quarter Full Year 2019 Comments Core EPS Growth* 0.00% -10.40% Investments in core business beginning to pay dividends Net Interest Margin 3.36% 3.55% Selective funding strategies to defend the margin Core ROAA* 1.36% 1.34% Core ROATE* 16.85% 17.10% Strong and stable performance metrics despite the business investment Efficiency Ratio 59.89% 60.14% Nearing expense and revenue growth inflexion point Loan Growth (annualized) 16.65% 7.65% Year-end loan growth drives achievement of full year targets Diverse Revenue Stream ($000) 70,000 4,000 110% 3,842 60,000 105% 8% 3,800 12% 9% 8% 9% 10% 8% 4% 10% 2% 4% 9% 3,689 50,000 1% 1% 4% 3% 100% 8% 22% 1% 21% 22% 22% 21% 23% 22% 23% 3,600 97% 40,000 96% 25% 95% 30,000 3,374 $ in $ billions 3,400 90% 20,000 66% 65% 67% 68% 66% 64% 66% 61% 66% 3,200 3,286 10,000 85% - 3,000 80% 4Q17 1Q18 2Q18 3Q18 4Q18 1Q19 2Q19 3Q19 4Q19 4Q17 1Q18 2Q18 3Q18 4Q18 1Q19 2Q19 3Q19 4Q19 Net Interest Income Wealth & Ins. Capital Markets Other Total Loans Total Deposits Loan-to-Deposit Ratio 29 Source: Public Filings as of 12/31/2019 *Reconciliation of Non-GAAP figures can be found in the appendix of this presentation
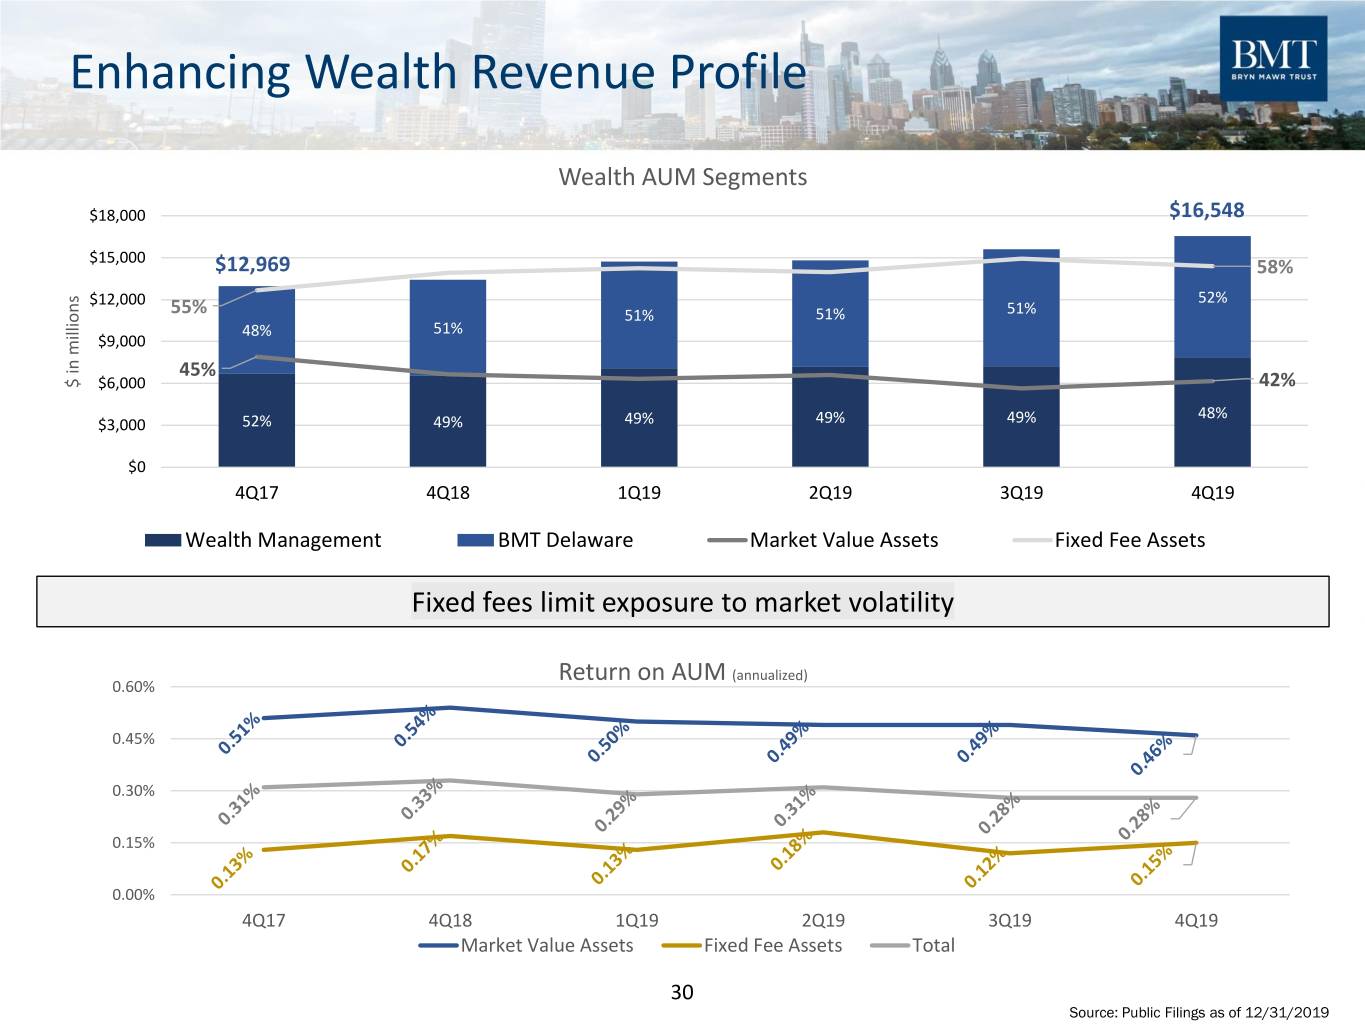
Enhancing Wealth Revenue Profile Wealth AUM Segments $18,000 $16,548 $15,000 $12,969 58% $12,000 52% 55% 51% 51% 51% 48% 51% $9,000 45% $ in $ millions $6,000 42% 48% $3,000 52% 49% 49% 49% 49% $0 4Q17 4Q18 1Q19 2Q19 3Q19 4Q19 Wealth Management BMT Delaware Market Value Assets Fixed Fee Assets Fixed fees limit exposure to market volatility Return on AUM (annualized) 0.60% 0.45% 0.30% 0.15% 0.00% 4Q17 4Q18 1Q19 2Q19 3Q19 4Q19 Market Value Assets Fixed Fee Assets Total 30 Source: Public Filings as of 12/31/2019
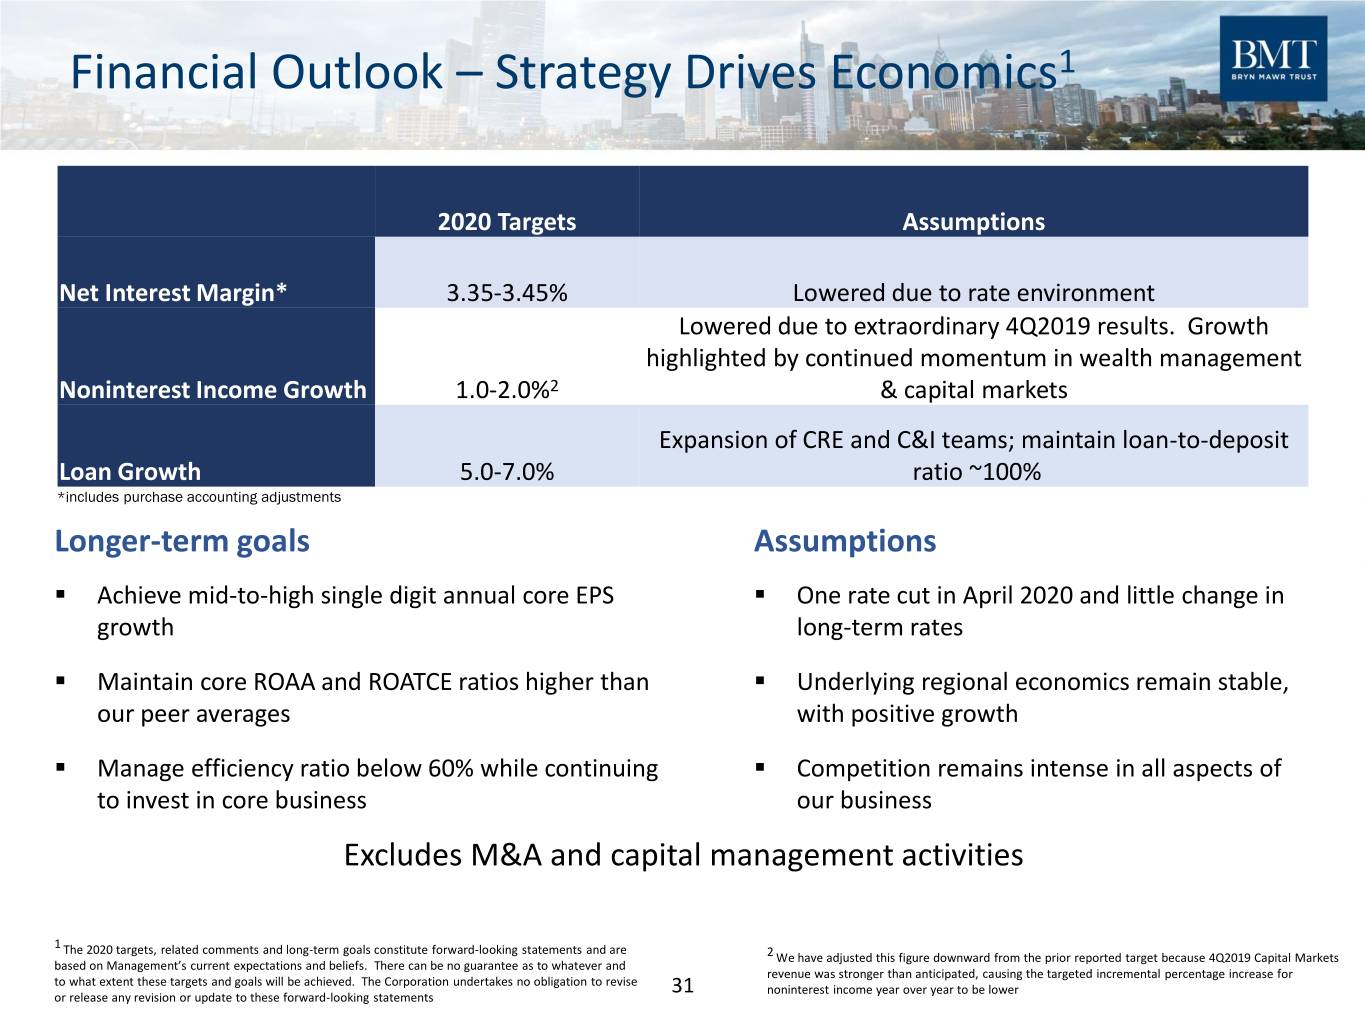
Financial Outlook – Strategy Drives Economics1 2020 Targets Assumptions Net Interest Margin* 3.35-3.45% Lowered due to rate environment Lowered due to extraordinary 4Q2019 results. Growth highlighted by continued momentum in wealth management Noninterest Income Growth 1.0-2.0%2 & capital markets Expansion of CRE and C&I teams; maintain loan-to-deposit Loan Growth 5.0-7.0% ratio ~100% *includes purchase accounting adjustments Longer-term goals Assumptions ▪ Achieve mid-to-high single digit annual core EPS ▪ One rate cut in April 2020 and little change in growth long-term rates ▪ Maintain core ROAA and ROATCE ratios higher than ▪ Underlying regional economics remain stable, our peer averages with positive growth ▪ Manage efficiency ratio below 60% while continuing ▪ Competition remains intense in all aspects of to invest in core business our business Excludes M&A and capital management activities 1 The 2020 targets, related comments and long-term goals constitute forward-looking statements and are 2 We have adjusted this figure downward from the prior reported target because 4Q2019 Capital Markets based on Management’s current expectations and beliefs. There can be no guarantee as to whatever and revenue was stronger than anticipated, causing the targeted incremental percentage increase for to what extent these targets and goals will be achieved. The Corporation undertakes no obligation to revise 31 noninterest income year over year to be lower or release any revision or update to these forward-looking statements

Appendix
Statement on Non-GAAP Measures Statement on Non-GAAP Measures: The Corporation believes the presentation of the following non-GAAP financial measures provides useful supplemental information that is essential to an investor’s proper understanding of the results of operations and financial condition of the Corporation. Managements use non-GAAP measures should not be viewed as a substitute for the financial measures determined in accordance with GAAP, nor are they necessarily comparable to non-GAAP performance measure that may be presented by other companies. 33

Non-GAAP Reconciliation As of or For the Three Months Ended As of or For the Twelve Months Ended December 31, September 30, December 31, December 31, 2019 2019 2019 2018 Reconciliation of Net Income to Net Income (core): Net income attributable to BMBC (a GAAP measure) $ 16,384 $ 16,360 $ 59,206 $ 63,792 Less: Tax-effected non-core noninterest income: Gain on sale of investment securities available for sale - - - (6) Add: Tax-effected non-core noninterest expense items: Due diligence, merger-related and merger integration expenses - - - 6,131 Voluntary years of service incentive program expenses - - 3,553 - Add: Federal income tax expense related to re-measurement of net deferred tax asset due to tax reform legislation - - - 703 Net income (core) (a non-GAAP measure) $ 16,384 $ 16,360 $ 62,759 $ 70,620 Calculation of Basic and Diluted Earnings per Common Share (core): Weighted average common shares outstanding 20,124,553 20,132,117 20,142,306 20,234,792 Dilutive common shares 88,455 76,513 91,065 155,375 Weighted average diluted shares 20,213,008 20,208,630 20,233,371 20,390,167 Basic earnings per common share (core) (a non-GAAP measure) $ 0.81 $ 0.81 $ 3.12 $ 3.49 Diluted earnings per common share (core) (a non-GAAP measure) $ 0.81 $ 0.81 $ 3.10 $ 3.46 34 Source: Public Filings as of 12/31/2019

Non-GAAP Reconciliation As of or For the Three As of or For the Twelve Months Ended Months Ended December 31, December 31, 2019 2019 Calculation of Return on Average Tangible Equity: Net income attributable to BMBC (a GAAP measure) $ 16,384 $ 59,206 Add: Tax-effected amortization and impairment of intangible assets 753 3,003 Net tangible income (numerator) $ 17,137 $ 62,209 Average shareholders' equity $ 606,508 $ 588,955 Less: Average Noncontrolling interest 694 690 Less: Average goodwill and intangible assets (203,663) (205,143) Net average tangible equity (denominator) $ 403,539 $ 384,502 Return on tangible equity (a non-GAAP measure) 16.85% 16.18% Calculation of Return on Average Tangible Equity (core): Net income (core) (a non-GAAP measure) $ 16,384 $ 62,759 Add: Tax-effected amortization and impairment of intangible assets 753 3,003 Net tangible income (core) (numerator) $ 17,137 $ 65,762 Average shareholders' equity $ 606,508 $ 588,955 Less: Average Noncontrolling interest 694 690 Less: Average goodwill and intangible assets (203,663) (205,143) Net average tangible equity (denominator) $ 403,539 $ 384,502 Return on tangible equity (core) (a non-GAAP measure) 16.85% 17.10% Calculation of Return on Average Assets (core) Return on average assets (GAAP) 1.36% 1.26% Effect of adjustment to GAAP net income to core net income 0.00% 0.08% Return on average assets (core) 1.36% 1.34% 35 Source: Public Filings as of 12/31/2019

2019 Peer Group Bryn Mawr Bank Corporation's peer group consists of the following: 1st Source Corporation (SRCE), Boston Private Financial Holdings, Inc. (BPFH), Camden National Corporation (CAC), Community Trust Bancorp, Inc. (CTBI), FB Financial Corporation (FBK), First Busey Corporation (BUSE), First Commonwealth Financial Corporation (FCF), First Mid Bancshares, Inc. (FMBH), Horizon Bancorp, Inc. (HBNC), Midland States Bancorp, Inc. (MSBI), Park National Corporation (PRK), Peapack-Gladstone Financial Corporation (PGC), Peoples Bancorp Inc. (PEBO), Stock Yards Bancorp, Inc. (SYBT), Tompkins Financial Corporation (TMP), Univest Financial Corporation (UVSP), Washington Trust Bancorp, Inc. (WASH), WSFS Financial Corporation (WSFS) http://www.snl.com/IRW/Peer/100154 36
