Attached files
| file | filename |
|---|---|
| 8-K - 8-K - CORPORATE OFFICE PROPERTIES TRUST | copt12312019earnings8k.htm |
Exhibit 99.1

Corporate Office Properties Trust
Summary Description
The Company: Corporate Office Properties Trust (the “Company” or “COPT”) is a self-managed real estate investment trust (“REIT”). COPT is listed on the New York Stock Exchange under the symbol “OFC” and is an S&P MidCap 400 Company. We own, manage, lease, develop and selectively acquire office and data center properties. The majority of our portfolio is in locations that support the United States Government and its contractors, most of whom are engaged in national security, defense and information technology (“IT”) related activities servicing what we believe are growing, durable, priority missions; we refer to these properties as Defense/IT Locations. We also own a portfolio of office properties located in select urban/urban-like submarkets in the Greater Washington, DC/Baltimore region with durable Class-A office fundamentals and characteristics; these properties are included in a segment referred to as Regional Office Properties. As of December 31, 2019, we derived 88% of our core portfolio annualized rental revenue from Defense/IT Locations and 12% from Regional Office Properties. As of December 31, 2019, our core portfolio of 168 office and data center shell properties, including 15 owned through unconsolidated joint ventures, encompassed 19.0 million square feet and was 94.6% leased. As of the same date, we also owned a wholesale data center with a critical load of 19.25 megawatts that was 76.9% leased.
Management: | Investor Relations: |
Stephen E. Budorick, President & CEO | Stephanie M. Krewson-Kelly, VP of IR |
Paul R. Adkins, EVP & COO | 443-285-5453, stephanie.kelly@copt.com |
Anthony Mifsud, EVP & CFO | Michelle Layne, Manager of IR |
443-285-5452, michelle.layne@copt.com | |
Corporate Credit Rating: Fitch: BBB- Stable; Moody’s: Baa3 Stable; and S&P: BBB- Positive
Disclosure Statement: This supplemental package contains forward-looking statements within the meaning of the Federal securities laws. Forward-looking statements can be identified by the use of words such as “may,” “will,” “should,” “could,” “believe,” “anticipate,” “expect,” “estimate,” “plan” or other comparable terminology. Forward-looking statements are inherently subject to risks and uncertainties, many of which we cannot predict with accuracy and some of which we might not even anticipate. Although we believe that the expectations, estimates and projections reflected in such forward-looking statements are based on reasonable assumptions at the time made, we can give no assurance that these expectations, estimates and projections will be achieved. Future events and actual results may differ materially from those discussed in the forward-looking statements and we undertake no obligation to update or supplement any forward-looking statements. The areas of risk that may affect these expectations, estimates and projections include, but are not limited to, those risks described in Item 1A of our Annual Report on Form 10-K for the year ended December 31, 2018 and Quarterly Report on Form 10-Q for the quarter ended June 30, 2019.
1
Corporate Office Properties Trust
Equity Research Coverage
Firm | Senior Analyst | Phone | Email | |||
Bank of America Merrill Lynch | Jamie Feldman | 646-855-5808 | james.feldman@baml.com | |||
BTIG | Tom Catherwood | 212-738-6410 | tcatherwood@btig.com | |||
Capital One Securities | Chris Lucas | 571-633-8151 | christopher.lucas@capitalone.com | |||
Citigroup Global Markets | Manny Korchman | 212-816-1382 | emmanuel.korchman@citi.com | |||
Evercore ISI | Steve Sakwa | 212-446-9462 | steve.sakwa@evercoreisi.com | |||
Green Street Advisors | Daniel Ismail | 949-640-8780 | dismail@greenst.com | |||
Jefferies & Co. | Jonathan Petersen | 212-284-1705 | jpetersen@jefferies.com | |||
JP Morgan | Tony Paolone | 212-622-6682 | anthony.paolone@jpmorgan.com | |||
KeyBanc Capital Markets | Craig Mailman | 917-368-2316 | cmailman@key.com | |||
Mizuho Securities USA Inc. | Tayo Okusanya | 646-949-9672 | omotayo.okusanya@mizuhogroup.com | |||
Raymond James | Bill Crow | 727-567-2594 | bill.crow@raymondjames.com | |||
Robert W. Baird & Co., Inc. | Dave Rodgers | 216-737-7341 | drodgers@rwbaird.com | |||
SMBC Nikko Securities America, Inc. | Rich Anderson | 917-262-2795 | randerson@smbcnikko-si.com | |||
Stifel Financial Corp. | John Guinee | 443-224-1307 | jwguinee@stifel.com | |||
SunTrust Robinson Humphrey, Inc. | Michael Lewis | 212-319-5659 | michael.lewis@suntrust.com | |||
Wells Fargo Securities | Blaine Heck | 443-263-6529 | blaine.heck@wellsfargo.com | |||
With the exception of Green Street Advisors, the above-listed firms are those whose analysts publish research material on the Company and whose estimates of our FFO per share can be tracked through Thomson’s First Call Corporation. Any opinions, estimates, or forecasts the above analysts make regarding COPT’s future performance are their own and do not represent the views, estimates, or forecasts of COPT’s management.
2
Corporate Office Properties Trust
Selected Financial Summary Data
(in thousands, except per share data)
Page | Three Months Ended | Year Ended | ||||||||||||||||||||||||||||
SUMMARY OF RESULTS | Refer. | 12/31/19 | 9/30/19 | 6/30/19 | 3/31/19 | 12/31/18 | 12/31/19 | 12/31/18 | ||||||||||||||||||||||
Net income | 6 | $ | 44,877 | $ | 23,246 | $ | 109,563 | $ | 22,318 | $ | 18,456 | $ | 200,004 | $ | 78,643 | |||||||||||||||
NOI from real estate operations | 13 | $ | 82,504 | $ | 82,621 | $ | 86,136 | $ | 83,764 | $ | 80,738 | $ | 335,025 | $ | 321,036 | |||||||||||||||
Same Properties NOI | 16 | $ | 72,243 | $ | 71,790 | $ | 71,521 | $ | 70,010 | $ | 69,689 | $ | 285,564 | $ | 277,996 | |||||||||||||||
Same Properties cash NOI | 17 | $ | 73,708 | $ | 71,177 | $ | 71,781 | $ | 69,278 | $ | 69,377 | $ | 285,944 | $ | 275,094 | |||||||||||||||
Adjusted EBITDA | 10 | $ | 76,024 | $ | 77,523 | $ | 80,280 | $ | 77,450 | $ | 75,200 | $ | 311,277 | $ | 300,247 | |||||||||||||||
Diluted AFFO avail. to common share and unit holders | 9 | $ | 40,270 | $ | 42,794 | $ | 46,961 | $ | 46,648 | $ | 42,755 | $ | 176,247 | $ | 160,264 | |||||||||||||||
Dividend per common share | N/A | $ | 0.275 | $ | 0.275 | $ | 0.275 | $ | 0.275 | $ | 0.275 | $ | 1.100 | $ | 1.100 | |||||||||||||||
Per share - diluted: | ||||||||||||||||||||||||||||||
EPS | 8 | $ | 0.38 | $ | 0.19 | $ | 0.95 | $ | 0.19 | $ | 0.16 | $ | 1.71 | $ | 0.69 | |||||||||||||||
FFO - Nareit | 8 | $ | 0.49 | $ | 0.51 | $ | 0.52 | $ | 0.50 | $ | 0.49 | $ | 2.02 | $ | 1.99 | |||||||||||||||
FFO - as adjusted for comparability | 8 | $ | 0.50 | $ | 0.51 | $ | 0.52 | $ | 0.50 | $ | 0.50 | $ | 2.03 | $ | 2.01 | |||||||||||||||
Numerators for diluted per share amounts: | ||||||||||||||||||||||||||||||
Diluted EPS | 6 | $ | 42,664 | $ | 21,139 | $ | 107,512 | $ | 20,773 | $ | 16,906 | $ | 191,201 | $ | 71,839 | |||||||||||||||
Diluted FFO available to common share and unit holders | 7 | $ | 56,032 | $ | 57,255 | $ | 58,913 | $ | 56,740 | $ | 54,195 | $ | 228,514 | $ | 214,303 | |||||||||||||||
Diluted FFO available to common share and unit holders, as adjusted for comparability | 7 | $ | 56,330 | $ | 57,430 | $ | 59,222 | $ | 56,788 | $ | 54,974 | $ | 229,344 | $ | 215,800 | |||||||||||||||
Payout ratios: | ||||||||||||||||||||||||||||||
Diluted FFO | N/A | 55.6 | % | 54.2 | % | 52.7 | % | 54.7 | % | 56.4 | % | 54.4 | % | 55.4 | % | |||||||||||||||
Diluted FFO - as adjusted for comparability | N/A | 55.3 | % | 54.1 | % | 52.4 | % | 54.7 | % | 55.6 | % | 54.2 | % | 55.0 | % | |||||||||||||||
Diluted AFFO | N/A | 77.3 | % | 72.6 | % | 66.1 | % | 66.6 | % | 71.5 | % | 70.5 | % | 74.1 | % | |||||||||||||||
CAPITALIZATION | ||||||||||||||||||||||||||||||
Total Market Capitalization | 29 | $ | 5,182,065 | $ | 5,259,182 | $ | 4,794,853 | $ | 4,992,411 | $ | 4,193,726 | |||||||||||||||||||
Total Equity Market Capitalization | 29 | $ | 3,339,258 | $ | 3,384,363 | $ | 2,997,549 | $ | 3,102,491 | $ | 2,355,222 | |||||||||||||||||||
Gross debt | 30 | $ | 1,893,057 | $ | 1,920,179 | $ | 1,827,304 | $ | 1,919,920 | $ | 1,868,504 | |||||||||||||||||||
Net debt to adjusted book | 32 | 36.8 | % | 37.3 | % | 36.1 | % | 38.8 | % | 38.9 | % | N/A | N/A | |||||||||||||||||
Net debt plus preferred equity to adjusted book | 32 | 37.0 | % | 37.5 | % | 36.2 | % | 39.0 | % | 39.1 | % | N/A | N/A | |||||||||||||||||
Adjusted EBITDA fixed charge coverage ratio | 32 | 3.7 | x | 3.7 | x | 3.7 | x | 3.6 | x | 3.6 | x | 3.7 | x | 3.6 | x | |||||||||||||||
Net debt to in-place adjusted EBITDA ratio | 32 | 6.1 | x | 6.1 | x | 5.7 | x | 6.2 | x | 6.0 | x | N/A | N/A | |||||||||||||||||
Net debt plus pref. equity to in-place adj. EBITDA ratio | 32 | 6.1 | x | 6.1 | x | 5.7 | x | 6.2 | x | 6.0 | x | N/A | N/A | |||||||||||||||||
3
Corporate Office Properties Trust
Selected Portfolio Data (1)
12/31/19 | 9/30/19 | 6/30/19 | 3/31/19 | 12/31/18 | ||||||||||
Operating Office and Data Center Shell Properties | ||||||||||||||
# of Properties | ||||||||||||||
Total Portfolio | 170 | 169 | 169 | 165 | 163 | |||||||||
Consolidated Portfolio | 155 | 156 | 156 | 159 | 157 | |||||||||
Core Portfolio | 168 | 167 | 167 | 163 | 161 | |||||||||
Same Properties | 147 | 147 | 147 | 147 | 147 | |||||||||
% Occupied | ||||||||||||||
Total Portfolio | 92.9 | % | 92.7 | % | 92.7 | % | 92.6 | % | 93.0 | % | ||||
Consolidated Portfolio | 91.9 | % | 91.7 | % | 91.8 | % | 92.2 | % | 92.6 | % | ||||
Core Portfolio | 93.1 | % | 92.8 | % | 92.9 | % | 92.8 | % | 93.1 | % | ||||
Same Properties | 91.9 | % | 91.7 | % | 91.8 | % | 92.0 | % | 92.6 | % | ||||
% Leased | ||||||||||||||
Total Portfolio | 94.4 | % | 94.3 | % | 93.9 | % | 93.5 | % | 93.9 | % | ||||
Consolidated Portfolio | 93.6 | % | 93.6 | % | 93.1 | % | 93.1 | % | 93.5 | % | ||||
Core Portfolio | 94.6 | % | 94.5 | % | 94.1 | % | 93.7 | % | 94.0 | % | ||||
Same Properties | 93.7 | % | 93.7 | % | 93.2 | % | 92.9 | % | 93.5 | % | ||||
Square Feet (in thousands) | ||||||||||||||
Total Portfolio | 19,173 | 18,956 | 18,945 | 18,338 | 18,094 | |||||||||
Consolidated Portfolio | 16,739 | 16,818 | 16,807 | 17,374 | 17,132 | |||||||||
Core Portfolio | 19,016 | 18,799 | 18,788 | 18,181 | 17,937 | |||||||||
Same Properties | 15,890 | 15,891 | 15,891 | 15,891 | 15,891 | |||||||||
Wholesale Data Center | ||||||||||||||
Megawatts Operational | 19.25 | 19.25 | 19.25 | 19.25 | 19.25 | |||||||||
% Leased | 76.9 | % | 82.1 | % | 82.1 | % | 87.6 | % | 87.6 | % | ||||
(1) | Total and core portfolio and same properties include properties owned through unconsolidated real estate joint ventures (see page 34). |
4
Corporate Office Properties Trust
Consolidated Balance Sheets
(dollars in thousands)
12/31/19 | 9/30/19 | 6/30/19 | 3/31/19 | 12/31/18 | |||||||||||||||
Assets | |||||||||||||||||||
Properties, net: | |||||||||||||||||||
Operating properties, net | $ | 2,772,647 | $ | 2,713,900 | $ | 2,719,585 | $ | 2,865,829 | $ | 2,847,265 | |||||||||
Development and redevelopment in progress, including land (1) | 274,639 | 259,489 | 185,007 | 146,514 | 139,304 | ||||||||||||||
Land held (1) | 293,600 | 285,434 | 289,780 | 290,659 | 264,057 | ||||||||||||||
Total properties, net | 3,340,886 | 3,258,823 | 3,194,372 | 3,303,002 | 3,250,626 | ||||||||||||||
Property - operating right-of-use assets (2) | 27,864 | 27,325 | 27,434 | 27,569 | — | ||||||||||||||
Property - finance right-of-use assets (2) | 40,458 | 40,467 | 40,476 | 40,488 | — | ||||||||||||||
Assets held for sale, net | — | 61,728 | 54,448 | — | — | ||||||||||||||
Cash and cash equivalents | 14,733 | 34,005 | 46,282 | 7,780 | 8,066 | ||||||||||||||
Investment in unconsolidated real estate joint ventures | 51,949 | 49,408 | 65,336 | 39,359 | 39,845 | ||||||||||||||
Accounts receivable | 35,444 | 37,623 | 58,189 | 25,261 | 26,277 | ||||||||||||||
Deferred rent receivable | 87,736 | 88,001 | 86,707 | 91,304 | 89,350 | ||||||||||||||
Intangible assets on real estate acquisitions, net | 27,392 | 29,454 | 31,162 | 33,172 | 43,470 | ||||||||||||||
Deferred leasing costs, net | 58,392 | 55,839 | 52,227 | 51,736 | 50,191 | ||||||||||||||
Investing receivables | 73,523 | 72,114 | 70,656 | 69,390 | 56,982 | ||||||||||||||
Prepaid expenses and other assets, net | 96,076 | 100,582 | 76,180 | 86,798 | 91,198 | ||||||||||||||
Total assets | $ | 3,854,453 | $ | 3,855,369 | $ | 3,803,469 | $ | 3,775,859 | $ | 3,656,005 | |||||||||
Liabilities and equity | |||||||||||||||||||
Liabilities: | |||||||||||||||||||
Debt | $ | 1,831,139 | $ | 1,862,301 | $ | 1,784,362 | $ | 1,876,149 | $ | 1,823,909 | |||||||||
Accounts payable and accrued expenses | 148,746 | 141,242 | 152,196 | 112,076 | 92,855 | ||||||||||||||
Rents received in advance and security deposits | 33,620 | 27,975 | 27,477 | 25,635 | 30,079 | ||||||||||||||
Dividends and distributions payable | 31,263 | 31,345 | 31,346 | 31,346 | 30,856 | ||||||||||||||
Deferred revenue associated with operating leases | 7,361 | 7,665 | 8,161 | 8,415 | 9,125 | ||||||||||||||
Property - operating lease liabilities (2) | 17,317 | 16,686 | 16,640 | 16,619 | — | ||||||||||||||
Interest rate derivatives | 25,682 | 34,825 | 23,547 | 11,894 | 5,459 | ||||||||||||||
Other liabilities | 10,649 | 8,706 | 10,826 | 10,162 | 10,414 | ||||||||||||||
Total liabilities | 2,105,777 | 2,130,745 | 2,054,555 | 2,092,296 | 2,002,697 | ||||||||||||||
Redeemable noncontrolling interests | 29,431 | 28,677 | 29,803 | 27,385 | 26,260 | ||||||||||||||
Equity: | |||||||||||||||||||
COPT’s shareholders’ equity: | |||||||||||||||||||
Common shares | 1,121 | 1,121 | 1,119 | 1,119 | 1,102 | ||||||||||||||
Additional paid-in capital | 2,481,558 | 2,480,083 | 2,475,293 | 2,475,497 | 2,431,355 | ||||||||||||||
Cumulative distributions in excess of net income | (778,275 | ) | (790,235 | ) | (780,667 | ) | (856,703 | ) | (846,808 | ) | |||||||||
Accumulated other comprehensive (loss) income | (25,444 | ) | (34,580 | ) | (23,465 | ) | (9,538 | ) | (238 | ) | |||||||||
Total COPT’s shareholders’ equity | 1,678,960 | 1,656,389 | 1,672,280 | 1,610,375 | 1,585,411 | ||||||||||||||
Noncontrolling interests in subsidiaries: | |||||||||||||||||||
Common units in the Operating Partnership | 19,597 | 19,365 | 21,039 | 20,167 | 19,168 | ||||||||||||||
Preferred units in the Operating Partnership | 8,800 | 8,800 | 8,800 | 8,800 | 8,800 | ||||||||||||||
Other consolidated entities | 11,888 | 11,393 | 16,992 | 16,836 | 13,669 | ||||||||||||||
Total noncontrolling interests in subsidiaries | 40,285 | 39,558 | 46,831 | 45,803 | 41,637 | ||||||||||||||
Total equity | 1,719,245 | 1,695,947 | 1,719,111 | 1,656,178 | 1,627,048 | ||||||||||||||
Total liabilities, redeemable noncontrolling interests and equity | $ | 3,854,453 | $ | 3,855,369 | $ | 3,803,469 | $ | 3,775,859 | $ | 3,656,005 | |||||||||
(1) | Refer to pages 25, 26 and 28 for detail. |
(2) | Applicable to periods subsequent to 12/31/18 in connection with our adoption of lease accounting guidance effective 1/1/19 without adjustments to prior reporting periods. |
5
Corporate Office Properties Trust
Consolidated Statements of Operations
(in thousands, except per share data)
Three Months Ended | Year Ended | ||||||||||||||||||||||||||
12/31/19 | 9/30/19 | 6/30/19 | 3/31/19 | 12/31/18 | 12/31/19 | 12/31/18 | |||||||||||||||||||||
Revenues | |||||||||||||||||||||||||||
Lease revenue | $ | 130,693 | $ | 129,461 | $ | 131,415 | $ | 130,903 | $ | 129,596 | $ | 522,472 | $ | 512,327 | |||||||||||||
Other property revenue | 1,275 | 1,273 | 1,356 | 1,087 | 1,229 | 4,991 | 4,926 | ||||||||||||||||||||
Construction contract and other service revenues | 25,817 | 28,697 | 42,299 | 16,950 | 7,657 | 113,763 | 60,859 | ||||||||||||||||||||
Total revenues | 157,785 | 159,431 | 175,070 | 148,940 | 138,482 | 641,226 | 578,112 | ||||||||||||||||||||
Operating expenses | |||||||||||||||||||||||||||
Property operating expenses | 51,098 | 49,714 | 47,886 | 49,445 | 51,298 | 198,143 | 201,035 | ||||||||||||||||||||
Depreciation and amortization associated with real estate operations | 32,779 | 34,692 | 34,802 | 34,796 | 36,219 | 137,069 | 137,116 | ||||||||||||||||||||
Construction contract and other service expenses | 24,832 | 27,802 | 41,002 | 16,326 | 7,111 | 109,962 | 58,326 | ||||||||||||||||||||
Impairment losses | 2 | 327 | — | — | 2,367 | 329 | 2,367 | ||||||||||||||||||||
General and administrative expenses | 7,043 | 6,105 | 7,650 | 6,719 | 5,105 | 27,517 | 22,829 | ||||||||||||||||||||
Leasing expenses | 2,293 | 1,824 | 1,736 | 2,032 | 1,976 | 7,885 | 6,071 | ||||||||||||||||||||
Business development expenses and land carry costs | 1,292 | 964 | 870 | 1,113 | 1,425 | 4,239 | 5,840 | ||||||||||||||||||||
Total operating expenses | 119,339 | 121,428 | 133,946 | 110,431 | 105,501 | 485,144 | 433,584 | ||||||||||||||||||||
Interest expense | (16,777 | ) | (17,126 | ) | (18,475 | ) | (18,674 | ) | (18,475 | ) | (71,052 | ) | (75,385 | ) | |||||||||||||
Interest and other income | 1,917 | 1,842 | 1,849 | 2,286 | 74 | 7,894 | 4,358 | ||||||||||||||||||||
Gain on sales of real estate | 20,761 | — | 84,469 | — | 2,367 | 105,230 | 2,340 | ||||||||||||||||||||
Loss on early extinguishment of debt | — | — | — | — | (258 | ) | — | (258 | ) | ||||||||||||||||||
Income before equity in income of unconsolidated entities and income taxes | 44,347 | 22,719 | 108,967 | 22,121 | 16,689 | 198,154 | 75,583 | ||||||||||||||||||||
Equity in income of unconsolidated entities | 426 | 396 | 420 | 391 | 1,577 | 1,633 | 2,697 | ||||||||||||||||||||
Income tax benefit (expense) | 104 | 131 | 176 | (194 | ) | 190 | 217 | 363 | |||||||||||||||||||
Net income | 44,877 | 23,246 | 109,563 | 22,318 | 18,456 | 200,004 | 78,643 | ||||||||||||||||||||
Net income attributable to noncontrolling interests: | |||||||||||||||||||||||||||
Common units in the Operating Partnership | (500 | ) | (267 | ) | (1,339 | ) | (257 | ) | (210 | ) | (2,363 | ) | (1,742 | ) | |||||||||||||
Preferred units in the Operating Partnership | (77 | ) | (157 | ) | (165 | ) | (165 | ) | (165 | ) | (564 | ) | (660 | ) | |||||||||||||
Other consolidated entities | (1,515 | ) | (1,565 | ) | (1,268 | ) | (1,037 | ) | (1,061 | ) | (5,385 | ) | (3,940 | ) | |||||||||||||
Net income attributable to COPT common shareholders | $ | 42,785 | $ | 21,257 | $ | 106,791 | $ | 20,859 | $ | 17,020 | $ | 191,692 | $ | 72,301 | |||||||||||||
Distributions on dilutive convertible preferred units | — | — | 165 | — | — | — | — | ||||||||||||||||||||
Redeemable noncontrolling interests | 33 | — | 902 | — | — | 132 | — | ||||||||||||||||||||
Amount allocable to share-based compensation awards | (154 | ) | (118 | ) | (346 | ) | (86 | ) | (114 | ) | (623 | ) | (462 | ) | |||||||||||||
Numerator for diluted EPS | $ | 42,664 | $ | 21,139 | $ | 107,512 | $ | 20,773 | $ | 16,906 | $ | 191,201 | $ | 71,839 | |||||||||||||
6
Corporate Office Properties Trust
Funds from Operations
(in thousands)
Three Months Ended | Year Ended | ||||||||||||||||||||||||||
12/31/19 | 9/30/19 | 6/30/19 | 3/31/19 | 12/31/18 | 12/31/19 | 12/31/18 | |||||||||||||||||||||
Net income | $ | 44,877 | $ | 23,246 | $ | 109,563 | $ | 22,318 | $ | 18,456 | $ | 200,004 | $ | 78,643 | |||||||||||||
Real estate-related depreciation and amortization | 32,779 | 34,692 | 34,802 | 34,796 | 36,219 | 137,069 | 137,116 | ||||||||||||||||||||
Impairment losses on real estate | 2 | 327 | — | — | 2,367 | 329 | 2,367 | ||||||||||||||||||||
Gain on sales of real estate | (20,761 | ) | — | (84,469 | ) | — | (2,367 | ) | (105,230 | ) | (2,340 | ) | |||||||||||||||
Depreciation and amortization on unconsolidated real estate JVs (1) | 781 | 790 | 566 | 566 | 565 | 2,703 | 2,256 | ||||||||||||||||||||
FFO - per Nareit (2)(3) | 57,678 | 59,055 | 60,462 | 57,680 | 55,240 | 234,875 | 218,042 | ||||||||||||||||||||
Noncontrolling interests - preferred units in the Operating Partnership | (77 | ) | (157 | ) | (165 | ) | (165 | ) | (165 | ) | (564 | ) | (660 | ) | |||||||||||||
FFO allocable to other noncontrolling interests (4) | (1,436 | ) | (1,429 | ) | (1,188 | ) | (971 | ) | (1,011 | ) | (5,024 | ) | (3,768 | ) | |||||||||||||
Basic and diluted FFO allocable to share-based compensation awards | (243 | ) | (248 | ) | (229 | ) | (185 | ) | (200 | ) | (905 | ) | (851 | ) | |||||||||||||
Basic FFO available to common share and common unit holders (3) | 55,922 | 57,221 | 58,880 | 56,359 | 53,864 | 228,382 | 212,763 | ||||||||||||||||||||
Distributions on dilutive preferred units in the Operating Partnership | 77 | — | — | — | — | — | — | ||||||||||||||||||||
Redeemable noncontrolling interests | 33 | 34 | 33 | 381 | 331 | 132 | 1,540 | ||||||||||||||||||||
Diluted FFO available to common share and common unit holders (3) | 56,032 | 57,255 | 58,913 | 56,740 | 54,195 | 228,514 | 214,303 | ||||||||||||||||||||
Loss on early extinguishment of debt | — | — | — | — | 258 | — | 258 | ||||||||||||||||||||
Demolition costs on redevelopment and nonrecurring improvements | 104 | — | — | 44 | 163 | 148 | 462 | ||||||||||||||||||||
Executive transition costs | — | — | — | 4 | 371 | 4 | 793 | ||||||||||||||||||||
Non-comparable professional and legal expenses | 195 | 175 | 311 | — | — | 681 | — | ||||||||||||||||||||
Diluted FFO comparability adjustments allocable to share-based compensation awards | (1 | ) | — | (2 | ) | — | (13 | ) | (3 | ) | (16 | ) | |||||||||||||||
Diluted FFO available to common share and common unit holders, as adjusted for comparability (3) | $ | 56,330 | $ | 57,430 | $ | 59,222 | $ | 56,788 | $ | 54,974 | $ | 229,344 | $ | 215,800 | |||||||||||||
(1) | FFO adjustment pertaining to COPT’s share of unconsolidated real estate joint ventures reported on page 34. |
(2) | See reconciliation on page 35 for components of FFO per Nareit. |
(3) | Refer to the section entitled “Definitions” for a definition of this measure. |
(4) | Pertains to noncontrolling interests in consolidated real estate joint ventures reported on page 33. |
7
Corporate Office Properties Trust
Diluted Share and Unit Computations
(in thousands)
Three Months Ended | Year Ended | ||||||||||||||||||||||||||
12/31/19 | 9/30/19 | 6/30/19 | 3/31/19 | 12/31/18 | 12/31/19 | 12/31/18 | |||||||||||||||||||||
EPS Denominator: | |||||||||||||||||||||||||||
Weighted average common shares - basic | 111,670 | 111,582 | 111,557 | 109,951 | 108,528 | 111,196 | 103,946 | ||||||||||||||||||||
Dilutive effect of share-based compensation awards | 293 | 361 | 310 | 267 | 45 | 308 | 134 | ||||||||||||||||||||
Dilutive effect of forward equity sale agreements | — | — | — | — | — | — | 45 | ||||||||||||||||||||
Dilutive effect of redeemable noncontrolling interests | 108 | — | 1,062 | — | — | 119 | — | ||||||||||||||||||||
Dilutive convertible preferred units | — | — | 176 | — | — | — | — | ||||||||||||||||||||
Weighted average common shares - diluted | 112,071 | 111,943 | 113,105 | 110,218 | 108,573 | 111,623 | 104,125 | ||||||||||||||||||||
Diluted EPS | $ | 0.38 | $ | 0.19 | $ | 0.95 | $ | 0.19 | $ | 0.16 | $ | 1.71 | $ | 0.69 | |||||||||||||
Weighted Average Shares for period ended: | |||||||||||||||||||||||||||
Common shares | 111,670 | 111,582 | 111,557 | 109,951 | 108,528 | 111,196 | 103,946 | ||||||||||||||||||||
Dilutive effect of share-based compensation awards | 293 | 361 | 310 | 302 | 45 | 308 | 134 | ||||||||||||||||||||
Dilutive effect of forward equity sale agreements | — | — | — | — | — | — | 45 | ||||||||||||||||||||
Common units | 1,228 | 1,312 | 1,327 | 1,331 | 1,345 | 1,299 | 2,468 | ||||||||||||||||||||
Redeemable noncontrolling interests | 108 | 109 | 136 | 1,013 | 1,126 | 119 | 936 | ||||||||||||||||||||
Dilutive convertible preferred units | 176 | — | — | — | — | — | — | ||||||||||||||||||||
Denominator for diluted FFO per share and as adjusted for comparability | 113,475 | 113,364 | 113,330 | 112,597 | 111,044 | 112,922 | 107,529 | ||||||||||||||||||||
Weighted average common units | (1,228 | ) | (1,312 | ) | (1,327 | ) | (1,331 | ) | (1,345 | ) | (1,299 | ) | (2,468 | ) | |||||||||||||
Redeemable noncontrolling interests | — | (109 | ) | 926 | (1,013 | ) | (1,126 | ) | — | (936 | ) | ||||||||||||||||
Anti-dilutive EPS effect of share-based compensation awards | — | — | — | (35 | ) | — | — | — | |||||||||||||||||||
Dilutive convertible preferred units | (176 | ) | — | 176 | — | — | — | — | |||||||||||||||||||
Denominator for diluted EPS | 112,071 | 111,943 | 113,105 | 110,218 | 108,573 | 111,623 | 104,125 | ||||||||||||||||||||
Diluted FFO per share - Nareit | $ | 0.49 | $ | 0.51 | $ | 0.52 | $ | 0.50 | $ | 0.49 | $ | 2.02 | $ | 1.99 | |||||||||||||
Diluted FFO per share - as adjusted for comparability | $ | 0.50 | $ | 0.51 | $ | 0.52 | $ | 0.50 | $ | 0.50 | $ | 2.03 | $ | 2.01 | |||||||||||||
8
Corporate Office Properties Trust
Adjusted Funds from Operations
(in thousands)
Three Months Ended | Year Ended | ||||||||||||||||||||||||||
12/31/19 | 9/30/19 | 6/30/19 | 3/31/19 | 12/31/18 | 12/31/19 | 12/31/18 | |||||||||||||||||||||
Diluted FFO available to common share and common unit holders, as adjusted for comparability | $ | 56,330 | $ | 57,430 | $ | 59,222 | $ | 56,788 | $ | 54,974 | $ | 229,344 | $ | 215,800 | |||||||||||||
Straight line rent adjustments and lease incentive amortization | 1,386 | (515 | ) | 1,051 | (1,667 | ) | (46 | ) | 255 | (1,487 | ) | ||||||||||||||||
Amortization of intangibles included in NOI | (174 | ) | (59 | ) | (50 | ) | 62 | 153 | (221 | ) | 893 | ||||||||||||||||
Share-based compensation, net of amounts capitalized | 1,735 | 1,697 | 1,623 | 1,673 | 1,601 | 6,728 | 6,193 | ||||||||||||||||||||
Amortization of deferred financing costs | 541 | 538 | 529 | 528 | 550 | 2,136 | 1,954 | ||||||||||||||||||||
Amortization of net debt discounts, net of amounts capitalized | 382 | 377 | 374 | 370 | 365 | 1,503 | 1,439 | ||||||||||||||||||||
Accum. other comprehensive loss on derivatives amortized to expense | — | 12 | 33 | 34 | 34 | 79 | 135 | ||||||||||||||||||||
Replacement capital expenditures (1) | (19,862 | ) | (16,752 | ) | (16,002 | ) | (11,173 | ) | (14,848 | ) | (63,789 | ) | (64,784 | ) | |||||||||||||
Other diluted AFFO adjustments associated with real estate JVs (2) | (68 | ) | 66 | 181 | 33 | (28 | ) | 212 | 121 | ||||||||||||||||||
Diluted AFFO available to common share and common unit holders (“diluted AFFO”) | $ | 40,270 | $ | 42,794 | $ | 46,961 | $ | 46,648 | $ | 42,755 | $ | 176,247 | $ | 160,264 | |||||||||||||
Replacement capital expenditures (1) | |||||||||||||||||||||||||||
Tenant improvements and incentives | $ | 11,447 | $ | 10,880 | $ | 8,568 | $ | 7,152 | $ | 7,876 | $ | 38,047 | $ | 37,502 | |||||||||||||
Building improvements | 8,826 | 8,908 | 4,333 | 4,531 | 9,306 | 26,598 | 22,977 | ||||||||||||||||||||
Leasing costs | 2,998 | 2,722 | 2,761 | 3,182 | 3,800 | 11,663 | 9,847 | ||||||||||||||||||||
Net (exclusions from) additions to tenant improvements and incentives | (426 | ) | (2,156 | ) | 1,759 | (1,469 | ) | (2,131 | ) | (2,292 | ) | 1,577 | |||||||||||||||
Excluded building improvements | (2,983 | ) | (3,602 | ) | (1,419 | ) | (2,223 | ) | (3,984 | ) | (10,227 | ) | (7,073 | ) | |||||||||||||
Excluded leasing costs | — | — | — | — | (19 | ) | — | (46 | ) | ||||||||||||||||||
Replacement capital expenditures | $ | 19,862 | $ | 16,752 | $ | 16,002 | $ | 11,173 | $ | 14,848 | $ | 63,789 | $ | 64,784 | |||||||||||||
(1) Refer to the section entitled “Definitions” for a definition of this measure. | |||||||||||||||||||||||||||
(2) AFFO adjustments pertaining to noncontrolling interests on consolidated joint ventures reported on page 33 and COPT’s share of unconsolidated real estate joint ventures reported on page 34. | |||||||||||||||||||||||||||
9
Corporate Office Properties Trust
EBITDAre and Adjusted EBITDA
(in thousands)
Three Months Ended | Year Ended | ||||||||||||||||||||||||||
12/31/19 | 9/30/19 | 6/30/19 | 3/31/19 | 12/31/18 | 12/31/19 | 12/31/18 | |||||||||||||||||||||
Net income | $ | 44,877 | $ | 23,246 | $ | 109,563 | $ | 22,318 | $ | 18,456 | $ | 200,004 | $ | 78,643 | |||||||||||||
Interest expense | 16,777 | 17,126 | 18,475 | 18,674 | 18,475 | 71,052 | 75,385 | ||||||||||||||||||||
Income tax (benefit) expense | (104 | ) | (131 | ) | (176 | ) | 194 | (190 | ) | (217 | ) | (363 | ) | ||||||||||||||
Depreciation of furniture, fixtures and equipment | 438 | 467 | 496 | 433 | 404 | 1,834 | 1,947 | ||||||||||||||||||||
Real estate-related depreciation and amortization | 32,779 | 34,692 | 34,802 | 34,796 | 36,219 | 137,069 | 137,116 | ||||||||||||||||||||
Impairment losses on real estate | 2 | 327 | — | — | 2,367 | 329 | 2,367 | ||||||||||||||||||||
Gain on sales of real estate | (20,761 | ) | — | (84,469 | ) | — | (2,367 | ) | (105,230 | ) | (2,340 | ) | |||||||||||||||
Adjustments from unconsolidated real estate JVs (1) | 1,206 | 1,202 | 830 | 827 | 832 | 4,065 | 3,314 | ||||||||||||||||||||
EBITDAre | 75,214 | 76,929 | 79,521 | 77,242 | 74,196 | $ | 308,906 | $ | 296,069 | ||||||||||||||||||
Loss on early extinguishment of debt | — | — | — | — | 258 | — | 258 | ||||||||||||||||||||
Net gain on other investments | (1 | ) | — | (12 | ) | (388 | ) | (449 | ) | (401 | ) | (449 | ) | ||||||||||||||
Business development expenses | 512 | 419 | 460 | 548 | 661 | 1,939 | 3,114 | ||||||||||||||||||||
Non-comparable professional and legal expenses | 195 | 175 | 311 | — | — | 681 | — | ||||||||||||||||||||
Demolition costs on redevelopment and nonrecurring improvements | 104 | — | — | 44 | 163 | 148 | 462 | ||||||||||||||||||||
Executive transition costs | — | — | — | 4 | 371 | 4 | 793 | ||||||||||||||||||||
Adjusted EBITDA | 76,024 | 77,523 | 80,280 | 77,450 | 75,200 | $ | 311,277 | $ | 300,247 | ||||||||||||||||||
Proforma NOI adjustment for property changes within period | 463 | — | (1,981 | ) | 252 | 2,052 | |||||||||||||||||||||
Change in collectability of deferred rental revenue | 928 | — | — | — | — | ||||||||||||||||||||||
In-place adjusted EBITDA | $ | 77,415 | $ | 77,523 | $ | 78,299 | $ | 77,702 | $ | 77,252 | |||||||||||||||||
(1) Includes COPT’s share of adjusted EBITDA adjustments in unconsolidated real estate joint ventures (see page 34).
10
Corporate Office Properties Trust
Office and Data Center Shell Properties by Segment (1) - 12/31/19
(square feet in thousands)
# of Properties | Operational Square Feet | % Occupied | % Leased | |||||||||
Core Portfolio: (2) | ||||||||||||
Defense/IT Locations: | ||||||||||||
Fort Meade/Baltimore Washington (“BW”) Corridor: | ||||||||||||
National Business Park | 31 | 3,823 | 90.1 | % | 90.6 | % | ||||||
Howard County | 35 | 2,849 | 94.1 | % | 95.5 | % | ||||||
Other | 22 | 1,624 | 95.0 | % | 96.7 | % | ||||||
Total Fort Meade/BW Corridor | 88 | 8,296 | 92.4 | % | 93.5 | % | ||||||
Northern Virginia (“NoVA”) Defense/IT | 13 | 1,993 | 82.4 | % | 87.7 | % | ||||||
Lackland AFB (San Antonio, Texas) | 7 | 953 | 100.0 | % | 100.0 | % | ||||||
Navy Support | 21 | 1,242 | 92.5 | % | 95.1 | % | ||||||
Redstone Arsenal (Huntsville, Alabama) | 10 | 806 | 99.3 | % | 99.7 | % | ||||||
Data Center Shells: | ||||||||||||
Consolidated Properties | 7 | 1,309 | 100.0 | % | 100.0 | % | ||||||
Unconsolidated JV Properties (3) | 15 | 2,435 | 100.0 | % | 100.0 | % | ||||||
Total Defense/IT Locations | 161 | 17,034 | 93.7 | % | 95.0 | % | ||||||
Regional Office | 7 | 1,982 | 88.1 | % | 90.9 | % | ||||||
Core Portfolio | 168 | 19,016 | 93.1 | % | 94.6 | % | ||||||
Other Properties | 2 | 157 | 73.0 | % | 73.0 | % | ||||||
Total Portfolio | 170 | 19,173 | 92.9 | % | 94.4 | % | ||||||
Consolidated Portfolio | 155 | 16,739 | 91.9 | % | 93.6 | % | ||||||
(1) | This presentation sets forth core portfolio data by segment followed by data for the remainder of the portfolio. |
(2) | Represents Defense/IT Locations and Regional Office properties. |
(3) | See page 34 for additional disclosure regarding our unconsolidated real estate joint ventures. |
11
Corporate Office Properties Trust
NOI from Real Estate Operations and Occupancy by Property Grouping - 12/31/19
(dollars and square feet in thousands)
As of Period End | |||||||||||||||||||||||||
# of Office and Data Center Shell Properties | Operational Square Feet | % Occupied (1) | % Leased (1) | Annualized Rental Revenue (2) | % of Total Annualized Rental Revenue (2) | NOI from Real Estate Operations | |||||||||||||||||||
Property Grouping | Three Months Ended | Year Ended | |||||||||||||||||||||||
Core Portfolio: | |||||||||||||||||||||||||
Same Properties: (3) | |||||||||||||||||||||||||
Consolidated properties | 139 | 14,769 | 91.6% | 93.5% | $ | 459,831 | 91.3 | % | $ | 70,613 | $ | 279,120 | |||||||||||||
Unconsolidated real estate JV (4) | 6 | 964 | 100.0% | 100.0% | 5,619 | 1.1 | % | 1,214 | 4,852 | ||||||||||||||||
Total Same Properties in Core Portfolio | 145 | 15,733 | 92.1% | 93.9% | 465,450 | 92.4 | % | 71,827 | 283,972 | ||||||||||||||||
Properties Placed in Service (5) | 14 | 1,812 | 95.9% | 95.9% | 33,230 | 6.6 | % | 6,047 | 20,020 | ||||||||||||||||
Properties contributed to uncons. real estate JV (4)(6) | 9 | 1,471 | 100.0% | 100.0% | 2,099 | 0.4 | % | 1,221 | 11,067 | ||||||||||||||||
Wholesale Data Center and Other | N/A | N/A | N/A | N/A | N/A | N/A | 2,993 | 18,374 | |||||||||||||||||
Total Core Portfolio | 168 | 19,016 | 93.1% | 94.6% | 500,779 | 99.4 | % | 82,088 | 333,433 | ||||||||||||||||
Other Properties (Same Properties) | 2 | 157 | 73.0% | 73.0% | 2,807 | 0.6 | % | 416 | 1,592 | ||||||||||||||||
Total Portfolio | 170 | 19,173 | 92.9% | 94.4% | $ | 503,586 | 100.0 | % | $ | 82,504 | $ | 335,025 | |||||||||||||
Consolidated Portfolio | 155 | 16,739 | 91.9% | 93.6% | $ | 495,868 | 98.5 | % | $ | 80,870 | $ | 329,320 | |||||||||||||
As of Period End | |||||||||||||||||||||||||
# of Office and Data Center Shell Properties | Operational Square Feet | % Occupied (1) | % Leased (1) | Annualized Rental Revenue (2) | % of Core Annualized Rental Revenue (2) | NOI from Real Estate Operations | |||||||||||||||||||
Property Grouping | Three Months Ended | Year Ended | |||||||||||||||||||||||
Core Portfolio: | |||||||||||||||||||||||||
Defense/IT Locations (6)(7): | |||||||||||||||||||||||||
Consolidated properties | 146 | 14,599 | 92.6% | 94.2% | $ | 435,064 | 86.9 | % | $ | 70,636 | $ | 281,683 | |||||||||||||
Unconsolidated real estate JVs (4) | 15 | 2,435 | 100.0% | 100.0% | 7,718 | 1.5 | % | 1,634 | 5,705 | ||||||||||||||||
Total Defense/IT Locations | 161 | 17,034 | 93.7% | 95.0% | 442,782 | 88.4 | % | 72,270 | 287,388 | ||||||||||||||||
Regional Office | 7 | 1,982 | 88.1% | 90.9% | 57,997 | 11.6 | % | 6,919 | 29,929 | ||||||||||||||||
Wholesale Data Center and Other | N/A | N/A | N/A | N/A | N/A | N/A | 2,899 | 16,116 | |||||||||||||||||
Total Core Portfolio | 168 | 19,016 | 93.1% | 94.6% | $ | 500,779 | 100.0 | % | $ | 82,088 | $ | 333,433 | |||||||||||||
(1) | Percentages calculated based on operational square feet. |
(2) | Excludes Annualized Rental Revenue from our wholesale data center, DC-6, of $21.8 million as of 12/31/19. With regard to properties owned through unconsolidated real estate joint ventures, we include the portion of Annualized Rental Revenue allocable to COPT’s ownership interest. |
(3) | Includes office and data center shell properties stably owned and 100% operational since at least 1/1/18. Our number of Same Properties decreased by three since 9/30/19 due to two properties sold to an unconsolidated JV on 12/5/19 and the removal from service of our DC-3 property on 10/1/19. |
(4) | See page 34 for additional disclosure regarding our unconsolidated real estate joint ventures. |
(5) | Newly developed or redeveloped properties placed in service that were not fully operational by 1/1/18. |
(6) | Includes nine data center shell properties in which we sold a 90% interest and retained a 10% interest through a newly-formed unconsolidated real estate joint venture in 2019 (seven on 6/20/19 and two on 12/5/19) (see page 24). |
(7) | For the nine data center shell properties in which we sold a 90% interest and retained a 10% interest through a newly-formed unconsolidated real estate joint venture in 2019, the activity associated with these properties prior to their sale to the joint venture is included in consolidated properties and the activity thereafter is included in unconsolidated real estate JVs. |
12
Corporate Office Properties Trust
Consolidated Real Estate Revenues and NOI by Segment
(dollars in thousands)
Three Months Ended | Year Ended | ||||||||||||||||||||||||||
12/31/19 | 9/30/19 | 6/30/19 | 3/31/19 | 12/31/18 | 12/31/19 | 12/31/18 | |||||||||||||||||||||
Consolidated real estate revenues | |||||||||||||||||||||||||||
Defense/IT Locations: | |||||||||||||||||||||||||||
Fort Meade/BW Corridor | $ | 65,003 | $ | 63,436 | $ | 61,659 | $ | 62,683 | $ | 62,756 | $ | 252,781 | $ | 248,927 | |||||||||||||
NoVA Defense/IT | 13,448 | 13,551 | 13,912 | 14,831 | 13,879 | 55,742 | 53,518 | ||||||||||||||||||||
Lackland Air Force Base | 14,772 | 12,703 | 12,104 | 11,561 | 11,207 | 51,140 | 46,286 | ||||||||||||||||||||
Navy Support | 8,136 | 8,183 | 8,185 | 8,155 | 8,031 | 32,659 | 31,927 | ||||||||||||||||||||
Redstone Arsenal | 4,515 | 4,171 | 3,968 | 3,939 | 3,726 | 16,593 | 14,745 | ||||||||||||||||||||
Data Center Shells-Consolidated | 4,680 | 5,913 | 8,624 | 7,354 | 7,175 | 26,571 | 25,650 | ||||||||||||||||||||
Total Defense/IT Locations | 110,554 | 107,957 | 108,452 | 108,523 | 106,774 | 435,486 | 421,053 | ||||||||||||||||||||
Regional Office | 14,252 | 15,508 | 15,018 | 14,833 | 15,329 | 59,611 | 61,181 | ||||||||||||||||||||
Wholesale Data Center | 6,409 | 6,565 | 8,560 | 7,871 | 7,929 | 29,405 | 31,892 | ||||||||||||||||||||
Other | 753 | 704 | 741 | 763 | 793 | 2,961 | 3,127 | ||||||||||||||||||||
Consolidated real estate revenues | $ | 131,968 | $ | 130,734 | $ | 132,771 | $ | 131,990 | $ | 130,825 | $ | 527,463 | $ | 517,253 | |||||||||||||
NOI | |||||||||||||||||||||||||||
Defense/IT Locations: | |||||||||||||||||||||||||||
Fort Meade/BW Corridor | $ | 44,610 | $ | 42,693 | $ | 42,315 | $ | 40,348 | $ | 41,331 | $ | 169,966 | $ | 165,952 | |||||||||||||
NoVA Defense/IT | 8,620 | 8,586 | 9,218 | 9,539 | 8,699 | 35,963 | 33,188 | ||||||||||||||||||||
Lackland Air Force Base | 5,486 | 5,554 | 5,456 | 5,602 | 4,843 | 22,098 | 19,398 | ||||||||||||||||||||
Navy Support | 4,828 | 4,602 | 4,899 | 4,751 | 4,438 | 19,080 | 18,391 | ||||||||||||||||||||
Redstone Arsenal | 2,744 | 2,454 | 2,369 | 2,400 | 2,194 | 9,967 | 8,695 | ||||||||||||||||||||
Data Center Shells: | |||||||||||||||||||||||||||
Consolidated properties | 4,348 | 5,395 | 7,865 | 7,001 | 6,117 | 24,609 | 22,425 | ||||||||||||||||||||
COPT’s share of unconsolidated real estate JVs (1) | 1,634 | 1,601 | 1,251 | 1,219 | 1,211 | 5,705 | 4,818 | ||||||||||||||||||||
Total Defense/IT Locations | 72,270 | 70,885 | 73,373 | 70,860 | 68,833 | 287,388 | 272,867 | ||||||||||||||||||||
Regional Office | 6,919 | 8,165 | 7,428 | 7,417 | 7,548 | 29,929 | 30,928 | ||||||||||||||||||||
Wholesale Data Center | 3,026 | 3,191 | 4,942 | 5,033 | 3,960 | 16,192 | 15,550 | ||||||||||||||||||||
Other | 289 | 380 | 393 | 454 | 397 | 1,516 | 1,691 | ||||||||||||||||||||
NOI from real estate operations | $ | 82,504 | $ | 82,621 | $ | 86,136 | $ | 83,764 | $ | 80,738 | $ | 335,025 | $ | 321,036 | |||||||||||||
(1) See page 34 for additional disclosure regarding our unconsolidated real estate joint ventures.
13
Corporate Office Properties Trust
Cash NOI by Segment
(dollars in thousands)
Three Months Ended | Year Ended | ||||||||||||||||||||||||||
12/31/19 | 9/30/19 | 6/30/19 | 3/31/19 | 12/31/18 | 12/31/19 | 12/31/18 | |||||||||||||||||||||
Cash NOI | |||||||||||||||||||||||||||
Defense/IT Locations: | |||||||||||||||||||||||||||
Fort Meade/BW Corridor | $ | 43,939 | $ | 42,604 | $ | 42,180 | $ | 40,256 | $ | 41,027 | $ | 168,979 | $ | 163,975 | |||||||||||||
NoVA Defense/IT | 8,963 | 8,064 | 8,771 | 8,757 | 8,773 | 34,555 | 32,697 | ||||||||||||||||||||
Lackland Air Force Base | 5,906 | 5,839 | 5,731 | 5,383 | 5,157 | 22,859 | 20,260 | ||||||||||||||||||||
Navy Support | 4,987 | 4,808 | 5,113 | 4,785 | 4,508 | 19,693 | 18,943 | ||||||||||||||||||||
Redstone Arsenal | 2,377 | 2,220 | 2,302 | 2,330 | 2,219 | 9,229 | 8,807 | ||||||||||||||||||||
Data Center Shells: | |||||||||||||||||||||||||||
Consolidated properties | 3,762 | 4,857 | 7,247 | 6,462 | 5,688 | 22,328 | 20,370 | ||||||||||||||||||||
COPT’s share of unconsolidated real estate JVs (1) | 1,553 | 1,513 | 1,202 | 1,160 | 1,154 | 5,428 | 4,564 | ||||||||||||||||||||
Total Defense/IT Locations | 71,487 | 69,905 | 72,546 | 69,133 | 68,526 | 283,071 | 269,616 | ||||||||||||||||||||
Regional Office | 7,606 | 7,356 | 7,367 | 6,990 | 6,990 | 29,319 | 28,457 | ||||||||||||||||||||
Wholesale Data Center | 3,162 | 3,231 | 3,945 | 4,698 | 3,601 | 15,036 | 13,845 | ||||||||||||||||||||
Other | 292 | 380 | 465 | 525 | 435 | 1,662 | 1,813 | ||||||||||||||||||||
Cash NOI from real estate operations | 82,547 | 80,872 | 84,323 | 81,346 | 79,552 | 329,088 | 313,731 | ||||||||||||||||||||
Straight line rent adjustments and lease incentive amortization | (1,488 | ) | 235 | (1,274 | ) | 1,505 | (40 | ) | (1,022 | ) | 833 | ||||||||||||||||
Amortization of acquired above- and below-market rents | 197 | 82 | 73 | (40 | ) | (97 | ) | 312 | (671 | ) | |||||||||||||||||
Amortization of below-market cost arrangements | (23 | ) | (23 | ) | (23 | ) | (23 | ) | (56 | ) | (92 | ) | (222 | ) | |||||||||||||
Lease termination fees, gross | 436 | 841 | 2,458 | 521 | 906 | 4,256 | 3,662 | ||||||||||||||||||||
Tenant funded landlord assets and lease incentives | 754 | 526 | 530 | 396 | 416 | 2,206 | 3,449 | ||||||||||||||||||||
Cash NOI adjustments in unconsolidated real estate JVs | 81 | 88 | 49 | 59 | 57 | 277 | 254 | ||||||||||||||||||||
NOI from real estate operations | $ | 82,504 | $ | 82,621 | $ | 86,136 | $ | 83,764 | $ | 80,738 | $ | 335,025 | $ | 321,036 | |||||||||||||
(1) | See page 34 for additional disclosure regarding our unconsolidated real estate joint ventures. |
14
Corporate Office Properties Trust
Same Properties (1) Average Occupancy Rates by Segment
(square feet in thousands)
# of Properties | Operational Square Feet | Three Months Ended | Year Ended | |||||||||||||||||||||||
12/31/19 | 9/30/19 | 6/30/19 | 3/31/19 | 12/31/18 | 12/31/19 | 12/31/18 | ||||||||||||||||||||
Core Portfolio: | ||||||||||||||||||||||||||
Defense/IT Locations: | ||||||||||||||||||||||||||
Fort Meade/BW Corridor | 84 | 7,948 | 92.9 | % | 92.3 | % | 91.3 | % | 91.2 | % | 92.3 | % | 91.9 | % | 91.7 | % | ||||||||||
NoVA Defense/IT | 13 | 1,993 | 82.4 | % | 83.9 | % | 88.5 | % | 91.3 | % | 85.8 | % | 86.5 | % | 83.5 | % | ||||||||||
Lackland Air Force Base | 7 | 953 | 100.0 | % | 100.0 | % | 100.0 | % | 100.0 | % | 100.0 | % | 100.0 | % | 100.0 | % | ||||||||||
Navy Support | 21 | 1,242 | 92.4 | % | 90.9 | % | 90.8 | % | 89.5 | % | 89.8 | % | 90.9 | % | 88.2 | % | ||||||||||
Redstone Arsenal | 7 | 651 | 99.2 | % | 99.2 | % | 98.4 | % | 98.5 | % | 99.0 | % | 98.8 | % | 98.5 | % | ||||||||||
Data Center Shells (2) | 6 | 964 | 100.0 | % | 100.0 | % | 100.0 | % | 100.0 | % | 100.0 | % | 100.0 | % | 100.0 | % | ||||||||||
Total Defense/IT Locations | 138 | 13,751 | 92.6 | % | 92.3 | % | 92.4 | % | 92.6 | % | 92.5 | % | 92.5 | % | 91.7 | % | ||||||||||
Regional Office | 7 | 1,982 | 88.0 | % | 88.6 | % | 88.9 | % | 88.1 | % | 89.3 | % | 88.4 | % | 88.1 | % | ||||||||||
Core Portfolio Same Properties | 145 | 15,733 | 92.0 | % | 91.8 | % | 91.9 | % | 92.1 | % | 92.1 | % | 92.0 | % | 91.2 | % | ||||||||||
Other Same Properties | 2 | 157 | 72.4 | % | 72.1 | % | 72.7 | % | 73.7 | % | 77.2 | % | 72.7 | % | 79.6 | % | ||||||||||
Total Same Properties | 147 | 15,890 | 91.8 | % | 91.7 | % | 91.7 | % | 91.9 | % | 91.9 | % | 91.8 | % | 91.1 | % | ||||||||||
Same Properties (1) Period End Occupancy Rates by Segment (square feet in thousands) | ||||||||||||||||||||||||||
# of Properties | Operational Square Feet | Three Months Ended | ||||||||||||||||||||||||
12/31/19 | 9/30/19 | 6/30/19 | 3/31/19 | 12/31/18 | ||||||||||||||||||||||
Core Portfolio: | ||||||||||||||||||||||||||
Defense/IT Locations: | ||||||||||||||||||||||||||
Fort Meade/BW Corridor | 84 | 7,948 | 93.0 | % | 92.6 | % | 91.4 | % | 91.1 | % | 92.1 | % | ||||||||||||||
NoVA Defense/IT | 13 | 1,993 | 82.4 | % | 82.3 | % | 87.6 | % | 91.7 | % | 91.3 | % | ||||||||||||||
Lackland Air Force Base | 7 | 953 | 100.0 | % | 100.0 | % | 100.0 | % | 100.0 | % | 100.0 | % | ||||||||||||||
Navy Support | 21 | 1,242 | 92.5 | % | 91.7 | % | 90.9 | % | 90.9 | % | 90.5 | % | ||||||||||||||
Redstone Arsenal | 7 | 651 | 99.2 | % | 99.2 | % | 98.6 | % | 98.3 | % | 99.0 | % | ||||||||||||||
Data Center Shells (2) | 6 | 964 | 100.0 | % | 100.0 | % | 100.0 | % | 100.0 | % | 100.0 | % | ||||||||||||||
Total Defense/IT Locations | 138 | 13,751 | 92.7 | % | 92.4 | % | 92.3 | % | 92.7 | % | 93.3 | % | ||||||||||||||
Regional Office | 7 | 1,982 | 88.1 | % | 88.6 | % | 89.3 | % | 88.3 | % | 89.2 | % | ||||||||||||||
Core Portfolio Same Properties | 145 | 15,733 | 92.1 | % | 91.9 | % | 92.0 | % | 92.2 | % | 92.8 | % | ||||||||||||||
Other Same Properties | 2 | 157 | 73.0 | % | 72.1 | % | 72.1 | % | 73.7 | % | 77.2 | % | ||||||||||||||
Total Same Properties | 147 | 15,890 | 91.9 | % | 91.7 | % | 91.8 | % | 92.0 | % | 92.6 | % | ||||||||||||||
(1) | Includes office and data center shell properties stably owned and 100% operational since at least 1/1/18. |
(2) | Properties owned through an unconsolidated real estate joint venture. See page 34 for additional disclosure. |
15
Corporate Office Properties Trust
Same Properties Real Estate Revenues and NOI by Segment
(dollars in thousands)
Three Months Ended | Year Ended | ||||||||||||||||||||||||||
12/31/19 | 9/30/19 | 6/30/19 | 3/31/19 | 12/31/18 | 12/31/19 | 12/31/18 | |||||||||||||||||||||
Same Properties real estate revenues | |||||||||||||||||||||||||||
Defense/IT Locations: | |||||||||||||||||||||||||||
Fort Meade/BW Corridor | $ | 63,017 | $ | 61,832 | $ | 60,051 | $ | 61,119 | $ | 61,331 | $ | 246,019 | $ | 242,570 | |||||||||||||
NoVA Defense/IT | 13,448 | 13,551 | 13,912 | 14,831 | 13,879 | 55,742 | 53,508 | ||||||||||||||||||||
Lackland Air Force Base | 14,144 | 12,074 | 11,479 | 10,928 | 11,200 | 48,625 | 46,279 | ||||||||||||||||||||
Navy Support | 8,135 | 8,183 | 8,185 | 8,155 | 8,031 | 32,658 | 31,927 | ||||||||||||||||||||
Redstone Arsenal | 3,895 | 3,868 | 3,793 | 3,785 | 3,696 | 15,341 | 14,714 | ||||||||||||||||||||
Total Defense/IT Locations | 102,639 | 99,508 | 97,420 | 98,818 | 98,137 | 398,385 | 388,998 | ||||||||||||||||||||
Regional Office | 14,251 | 15,509 | 15,018 | 14,833 | 15,300 | 59,611 | 61,033 | ||||||||||||||||||||
Other Properties | 753 | 704 | 741 | 760 | 821 | 2,958 | 3,135 | ||||||||||||||||||||
Same Properties real estate revenues | $ | 117,643 | $ | 115,721 | $ | 113,179 | $ | 114,411 | $ | 114,258 | $ | 460,954 | $ | 453,166 | |||||||||||||
Same Properties NOI | |||||||||||||||||||||||||||
Defense/IT Locations: | |||||||||||||||||||||||||||
Fort Meade/BW Corridor | $ | 43,176 | $ | 41,672 | $ | 41,279 | $ | 39,380 | $ | 40,378 | $ | 165,507 | $ | 160,960 | |||||||||||||
NoVA Defense/IT | 8,619 | 8,586 | 9,219 | 9,539 | 8,699 | 35,963 | 33,169 | ||||||||||||||||||||
Lackland Air Force Base | 4,868 | 4,936 | 4,841 | 4,972 | 4,837 | 19,617 | 19,392 | ||||||||||||||||||||
Navy Support | 4,828 | 4,602 | 4,899 | 4,751 | 4,438 | 19,080 | 18,391 | ||||||||||||||||||||
Redstone Arsenal | 2,295 | 2,236 | 2,264 | 2,321 | 2,171 | 9,116 | 8,672 | ||||||||||||||||||||
Data Center Shells (1) | 1,214 | 1,214 | 1,205 | 1,219 | 1,211 | 4,852 | 4,818 | ||||||||||||||||||||
Total Defense/IT Locations | 65,000 | 63,246 | 63,707 | 62,182 | 61,734 | 254,135 | 245,402 | ||||||||||||||||||||
Regional Office | 6,918 | 8,163 | 7,430 | 7,417 | 7,500 | 29,928 | 30,784 | ||||||||||||||||||||
Other Properties | 325 | 381 | 384 | 411 | 455 | 1,501 | 1,810 | ||||||||||||||||||||
Same Properties NOI | $ | 72,243 | $ | 71,790 | $ | 71,521 | $ | 70,010 | $ | 69,689 | $ | 285,564 | $ | 277,996 | |||||||||||||
(1) Represents COPT’s share of unconsolidated real estate JV. See page 34 for additional disclosure regarding our unconsolidated real estate joint ventures.
16
Corporate Office Properties Trust
Same Properties Cash NOI by Segment
(dollars in thousands)
Three Months Ended | Year Ended | ||||||||||||||||||||||||||
12/31/19 | 9/30/19 | 6/30/19 | 3/31/19 | 12/31/18 | 12/31/19 | 12/31/18 | |||||||||||||||||||||
Same Properties cash NOI | |||||||||||||||||||||||||||
Defense/IT Locations: | |||||||||||||||||||||||||||
Fort Meade/BW Corridor | $ | 43,001 | $ | 41,841 | $ | 41,393 | $ | 39,419 | $ | 40,126 | $ | 165,654 | $ | 159,592 | |||||||||||||
NoVA Defense/IT | 8,963 | 8,064 | 8,771 | 8,757 | 8,774 | 34,555 | 32,680 | ||||||||||||||||||||
Lackland Air Force Base | 5,333 | 5,266 | 5,161 | 5,293 | 5,157 | 21,053 | 20,260 | ||||||||||||||||||||
Navy Support | 4,987 | 4,808 | 5,113 | 4,785 | 4,508 | 19,693 | 18,943 | ||||||||||||||||||||
Redstone Arsenal | 2,311 | 2,291 | 2,359 | 2,391 | 2,224 | 9,352 | 8,811 | ||||||||||||||||||||
Data Center Shells (1) | 1,180 | 1,171 | 1,160 | 1,160 | 1,154 | 4,671 | 4,564 | ||||||||||||||||||||
Total Defense/IT Locations | 65,775 | 63,441 | 63,957 | 61,805 | 61,943 | 254,978 | 244,850 | ||||||||||||||||||||
Regional Office | 7,606 | 7,355 | 7,368 | 6,990 | 6,943 | 29,319 | 28,314 | ||||||||||||||||||||
Other Properties | 327 | 381 | 456 | 483 | 491 | 1,647 | 1,930 | ||||||||||||||||||||
Same Properties cash NOI | 73,708 | 71,177 | 71,781 | 69,278 | 69,377 | 285,944 | 275,094 | ||||||||||||||||||||
Straight line rent adjustments and lease incentive amortization | (2,838 | ) | (830 | ) | (1,163 | ) | (173 | ) | (907 | ) | (5,004 | ) | (3,111 | ) | |||||||||||||
Amortization of acquired above- and below-market rents | 197 | 82 | 73 | (40 | ) | (97 | ) | 312 | (671 | ) | |||||||||||||||||
Amortization of below-market cost arrangements | (23 | ) | (23 | ) | (23 | ) | (23 | ) | (56 | ) | (92 | ) | (222 | ) | |||||||||||||
Lease termination fees, gross | 417 | 823 | 285 | 521 | 906 | 2,046 | 3,231 | ||||||||||||||||||||
Tenant funded landlord assets and lease incentives | 748 | 519 | 522 | 388 | 409 | 2,177 | 3,421 | ||||||||||||||||||||
Cash NOI adjustments in unconsolidated real estate JV (1) | 34 | 42 | 46 | 59 | 57 | 181 | 254 | ||||||||||||||||||||
Same Properties NOI | $ | 72,243 | $ | 71,790 | $ | 71,521 | $ | 70,010 | $ | 69,689 | $ | 285,564 | $ | 277,996 | |||||||||||||
Percentage change in total Same Properties cash NOI (2) | 6.2 | % | 3.9 | % | |||||||||||||||||||||||
Percentage change in Defense/IT Locations Same Properties cash NOI (2) | 6.2 | % | 4.1 | % | |||||||||||||||||||||||
(1) | Represents COPT’s share of unconsolidated real estate JV. See page 34 for additional disclosure regarding our unconsolidated real estate joint ventures. |
(2) | Represents the change between the current period and the same period in the prior year. |
17
Corporate Office Properties Trust
Leasing - Office and Data Center Shell Portfolio (1)
Quarter Ended 12/31/19
(square feet in thousands)
Defense/IT Locations | |||||||||||||||||||||||||||||||
Ft Meade/BW Corridor | NoVA Defense/IT | Navy Support | Redstone Arsenal | Total Defense/IT Locations | Regional Office | Other | Total | ||||||||||||||||||||||||
Renewed Space | |||||||||||||||||||||||||||||||
Leased Square Feet | 245 | — | 63 | — | 308 | 3 | 28 | 339 | |||||||||||||||||||||||
Expiring Square Feet | 281 | — | 63 | — | 344 | 33 | 28 | 404 | |||||||||||||||||||||||
Vacating Square Feet | 36 | — | — | — | 36 | 29 | — | 65 | |||||||||||||||||||||||
Retention Rate (% based upon square feet) | 87.1 | % | — | % | 100.0 | % | — | % | 89.5 | % | 10.0 | % | 100.0 | % | 83.8 | % | |||||||||||||||
Statistics for Completed Leasing: | |||||||||||||||||||||||||||||||
Per Annum Average Committed Cost per Square Foot (2) | $ | 4.12 | $ | — | $ | 3.62 | $ | — | $ | 4.02 | $ | 0.46 | $ | 1.73 | $ | 3.80 | |||||||||||||||
Weighted Average Lease Term in Years | 7.3 | — | 3.6 | — | 6.5 | 1.2 | 2.1 | 6.1 | |||||||||||||||||||||||
Average Rent Per Square Foot | |||||||||||||||||||||||||||||||
Renewal Average Rent | $ | 29.56 | $ | — | $ | 23.64 | $ | — | $ | 28.34 | $ | 26.89 | $ | 21.60 | $ | 27.78 | |||||||||||||||
Expiring Average Rent | $ | 29.58 | $ | — | $ | 23.22 | $ | — | $ | 28.28 | $ | 26.86 | $ | 19.80 | $ | 27.57 | |||||||||||||||
Change in Average Rent | (0.1 | )% | — | % | 1.8 | % | — | % | 0.2 | % | 0.1 | % | 9.1 | % | 0.8 | % | |||||||||||||||
Cash Rent Per Square Foot | |||||||||||||||||||||||||||||||
Renewal Cash Rent | $ | 28.71 | $ | — | $ | 23.48 | $ | — | $ | 27.64 | $ | 26.86 | $ | 22.00 | $ | 27.17 | |||||||||||||||
Expiring Cash Rent | $ | 32.10 | $ | — | $ | 24.33 | $ | — | $ | 30.50 | $ | 26.86 | $ | 20.60 | $ | 29.66 | |||||||||||||||
Change in Cash Rent | (10.6 | )% | — | % | (3.5 | )% | — | % | (9.4 | )% | — | % | 6.8 | % | (8.4 | )% | |||||||||||||||
Average Escalations Per Year | 2.4 | % | — | % | 2.7 | % | — | % | 2.4 | % | 4.0 | % | — | % | 2.3 | % | |||||||||||||||
New Leases | |||||||||||||||||||||||||||||||
Development and Redevelopment Space | |||||||||||||||||||||||||||||||
Leased Square Feet | 25 | — | — | 113 | 138 | 20 | — | 158 | |||||||||||||||||||||||
Statistics for Completed Leasing: | |||||||||||||||||||||||||||||||
Per Annum Average Committed Cost per Square Foot (2) | $ | 8.36 | $ | — | $ | — | $ | 7.24 | $ | 7.44 | $ | 13.43 | $ | — | $ | 8.21 | |||||||||||||||
Weighted Average Lease Term in Years | 10.6 | — | — | 11.7 | 11.5 | 16.3 | — | 12.1 | |||||||||||||||||||||||
Average Rent Per Square Foot | $ | 34.87 | $ | — | $ | — | $ | 23.85 | $ | 25.85 | $ | 89.55 | $ | — | $ | 34.01 | |||||||||||||||
Cash Rent Per Square Foot | $ | 33.50 | $ | — | $ | — | $ | 23.28 | $ | 25.14 | $ | 85.70 | $ | — | $ | 32.89 | |||||||||||||||
Vacant Space (3) | |||||||||||||||||||||||||||||||
Leased Square Feet | 99 | 20 | 26 | — | 144 | 17 | 1 | 162 | |||||||||||||||||||||||
Statistics for Completed Leasing: | |||||||||||||||||||||||||||||||
Per Annum Average Committed Cost per Square Foot (2) | $ | 6.40 | $ | 13.49 | $ | 3.72 | $ | — | $ | 6.89 | $ | 12.82 | $ | 1.67 | $ | 7.46 | |||||||||||||||
Weighted Average Lease Term in Years | 6.8 | 5.0 | 7.2 | — | 6.6 | 6.9 | 3.0 | 6.6 | |||||||||||||||||||||||
Average Rent Per Square Foot | $ | 28.79 | $ | 42.30 | $ | 23.34 | $ | — | $ | 29.66 | $ | 35.66 | $ | 25.76 | $ | 30.25 | |||||||||||||||
Cash Rent Per Square Foot | $ | 28.50 | $ | 40.12 | $ | 21.74 | $ | — | $ | 28.89 | $ | 34.39 | $ | 25.00 | $ | 29.43 | |||||||||||||||
Total Square Feet Leased | 369 | 20 | 89 | 113 | 590 | 40 | 29 | 659 | |||||||||||||||||||||||
Average Escalations Per Year | 2.4 | % | 2.8 | % | 2.6 | % | 1.5 | % | 2.2 | % | 2.4 | % | 0.2 | % | 2.2 | % | |||||||||||||||
Average Escalations Excl. Data Center Shells | 2.2 | % | |||||||||||||||||||||||||||||
(1) | Activity is exclusive of owner occupied space, leases with less than a one-year term and expirations associated with space removed from service. Weighted average lease term is based on the lease term defined in the lease assuming no exercise of early termination rights. Committed costs for leasing are reported above in the period of lease execution. Actual capital expenditures for leasing are reported on page 9 in the period such costs are incurred. |
(2) | Committed costs include tenant improvements and leasing commissions and exclude free rent concession. |
(3) | Vacant space includes acquired first generation space, vacated second generation space and leases executed on developed and redeveloped space previously placed in service. |
18
Corporate Office Properties Trust
Leasing - Office and Data Center Shell Portfolio (1)
Year Ended 12/31/19
(square feet in thousands)
Defense/IT Locations | |||||||||||||||||||||||||||||||||||
Ft Meade/BW Corridor | NoVA Defense/IT | Navy Support | Redstone Arsenal | Data Center Shells | Total Defense/IT Locations | Regional Office | Other | Total | |||||||||||||||||||||||||||
Renewed Space | |||||||||||||||||||||||||||||||||||
Leased Square Feet | 1,172 | 11 | 317 | 276 | — | 1,776 | 45 | 42 | 1,863 | ||||||||||||||||||||||||||
Expiring Square Feet | 1,392 | 217 | 361 | 276 | — | 2,245 | 137 | 48 | 2,430 | ||||||||||||||||||||||||||
Vacating Square Feet | 219 | 205 | 45 | — | — | 469 | 93 | 6 | 567 | ||||||||||||||||||||||||||
Retention Rate (% based upon square feet) | 84.2 | % | 5.3 | % | 87.6 | % | 100.0 | % | — | % | 79.1 | % | 32.5 | % | 88.4 | % | 76.7 | % | |||||||||||||||||
Statistics for Completed Leasing: | |||||||||||||||||||||||||||||||||||
Per Annum Average Committed Cost per Square Foot (2) | $ | 2.75 | $ | 1.31 | $ | 3.30 | $ | 0.84 | $ | — | $ | 2.54 | $ | 2.49 | $ | 1.89 | $ | 2.53 | |||||||||||||||||
Weighted Average Lease Term in Years | 4.7 | 5.3 | 4.1 | 1.5 | — | 4.1 | 2.7 | 2.4 | 4.1 | ||||||||||||||||||||||||||
Average Rent Per Square Foot | |||||||||||||||||||||||||||||||||||
Renewal Average Rent | $ | 33.95 | $ | 31.58 | $ | 28.89 | $ | 22.19 | $ | — | $ | 31.21 | $ | 36.96 | $ | 22.38 | $ | 31.15 | |||||||||||||||||
Expiring Average Rent | $ | 34.32 | $ | 35.00 | $ | 28.98 | $ | 21.79 | $ | — | $ | 31.43 | $ | 33.66 | $ | 20.33 | $ | 31.23 | |||||||||||||||||
Change in Average Rent | (1.1 | )% | (9.8 | )% | (0.3 | )% | 1.8 | % | — | % | (0.7 | )% | 9.8 | % | 10.1 | % | (0.3 | )% | |||||||||||||||||
Cash Rent Per Square Foot | |||||||||||||||||||||||||||||||||||
Renewal Cash Rent | $ | 33.68 | $ | 32.29 | $ | 28.44 | $ | 22.18 | $ | — | $ | 30.95 | $ | 36.01 | $ | 22.41 | $ | 30.88 | |||||||||||||||||
Expiring Cash Rent | $ | 36.27 | $ | 38.43 | $ | 30.25 | $ | 21.91 | $ | — | $ | 32.99 | $ | 36.23 | $ | 21.34 | $ | 32.80 | |||||||||||||||||
Change in Cash Rent | (7.1 | )% | (16.0 | )% | (6.0 | )% | 1.2 | % | — | % | (6.2 | )% | (0.6 | )% | 5.0 | % | (5.8 | )% | |||||||||||||||||
Average Escalations Per Year | 2.4 | % | 2.5 | % | 2.6 | % | 2.6 | % | — | % | 2.4 | % | 2.9 | % | 0.1 | % | 2.4 | % | |||||||||||||||||
New Leases | |||||||||||||||||||||||||||||||||||
Development and Redevelopment Space | |||||||||||||||||||||||||||||||||||
Leased Square Feet | 144 | 348 | — | 548 | 1,164 | 2,205 | 20 | — | 2,225 | ||||||||||||||||||||||||||
Statistics for Completed Leasing: | |||||||||||||||||||||||||||||||||||
Per Annum Average Committed Cost per Square Foot (2) | $ | 10.06 | $ | 2.55 | $ | — | $ | 5.82 | $ | — | $ | 2.51 | $ | 13.43 | $ | — | $ | 2.61 | |||||||||||||||||
Weighted Average Lease Term in Years | 7.6 | 12.0 | — | 9.0 | 15.1 | 12.6 | 16.3 | — | 12.6 | ||||||||||||||||||||||||||
Average Rent Per Square Foot | $ | 29.35 | $ | 41.46 | $ | — | $ | 19.61 | $ | 21.64 | $ | 24.77 | $ | 89.55 | $ | — | $ | 25.36 | |||||||||||||||||
Cash Rent Per Square Foot | $ | 28.27 | $ | 41.46 | $ | — | $ | 18.93 | $ | 18.94 | $ | 23.10 | $ | 85.70 | $ | — | $ | 23.68 | |||||||||||||||||
Vacant Space (3) | |||||||||||||||||||||||||||||||||||
Leased Square Feet | 442 | 122 | 93 | 6 | — | 664 | 115 | 5 | 784 | ||||||||||||||||||||||||||
Statistics for Completed Leasing: | |||||||||||||||||||||||||||||||||||
Per Annum Average Committed Cost per Square Foot (2) | $ | 5.20 | $ | 10.07 | $ | 5.04 | $ | 20.29 | $ | — | $ | 6.22 | $ | 10.23 | $ | 1.08 | $ | 6.77 | |||||||||||||||||
Weighted Average Lease Term in Years | 5.4 | 8.0 | 5.9 | 5.6 | — | 6.0 | 8.9 | 2.3 | 6.4 | ||||||||||||||||||||||||||
Average Rent Per Square Foot | $ | 28.97 | $ | 33.25 | $ | 24.66 | $ | 25.47 | $ | — | $ | 29.12 | $ | 34.09 | $ | 22.83 | $ | 29.81 | |||||||||||||||||
Cash Rent Per Square Foot | $ | 29.26 | $ | 31.93 | $ | 24.03 | $ | 24.76 | $ | — | $ | 28.98 | $ | 32.58 | $ | 22.40 | $ | 29.46 | |||||||||||||||||
Total Square Feet Leased | 1,759 | 482 | 410 | 830 | 1,164 | 4,644 | 180 | 47 | 4,872 | ||||||||||||||||||||||||||
Average Escalations Per Year | 2.5 | % | 0.3 | % | 2.6 | % | 2.5 | % | 2.3 | % | 2.1 | % | 2.4 | % | 0.4 | % | 2.1 | % | |||||||||||||||||
Average Escalations Excl. Data Center Shells | 2.0 | % | |||||||||||||||||||||||||||||||||
(1) | Activity is exclusive of owner occupied space, leases with less than a one-year term and expirations associated with space removed from service. Weighted average lease term is based on the lease term defined in the lease assuming no exercise of early termination rights. Committed costs for leasing are reported above in the period of lease execution. Actual capital expenditures for leasing are reported on page 9 in the period such costs are incurred. |
(2) | Committed costs include tenant improvements and leasing commissions and exclude free rent concession. |
(3) | Vacant space includes acquired first generation space, vacated second generation space and leases executed on developed and redeveloped space previously placed in service. |
19
Corporate Office Properties Trust
Lease Expiration Analysis as of 12/31/19 (1)
(dollars and square feet in thousands, except per square foot amounts)
Office and Data Center Shells
Segment of Lease and Year of Expiration (2) | Square Footage of Leases Expiring | Annualized Rental Revenue of Expiring Leases (3) | % of Core/Total Annualized Rental Revenue Expiring (3)(4) | Annualized Rental Revenue of Expiring Leases per Occupied Sq. Foot (3) | ||||||||||
Core Portfolio | ||||||||||||||
Ft Meade/BW Corridor | 895 | $ | 30,932 | 6.2 | % | $ | 34.48 | |||||||
NoVA Defense/IT | 121 | 3,553 | 0.7 | % | 29.24 | |||||||||
Lackland Air Force Base | 250 | 11,834 | 2.4 | % | 47.34 | |||||||||
Navy Support | 150 | 4,266 | 0.9 | % | 28.36 | |||||||||
Redstone Arsenal | 11 | 261 | 0.1 | % | 23.41 | |||||||||
Regional Office | 77 | 2,533 | 0.5 | % | 33.03 | |||||||||
2020 | 1,504 | 53,380 | 10.7 | % | 35.42 | |||||||||
Ft Meade/BW Corridor | 1,047 | 36,571 | 7.3 | % | 34.92 | |||||||||
NoVA Defense/IT | 108 | 3,124 | 0.6 | % | 29.03 | |||||||||
Navy Support | 263 | 7,489 | 1.5 | % | 28.50 | |||||||||
Redstone Arsenal | 397 | 8,800 | 1.8 | % | 22.17 | |||||||||
Regional Office | 41 | 1,310 | 0.3 | % | 31.97 | |||||||||
2021 | 1,856 | 57,295 | 11.5 | % | 30.88 | |||||||||
Ft Meade/BW Corridor | 800 | 26,417 | 5.3 | % | 33.00 | |||||||||
NoVA Defense/IT | 135 | 4,524 | 0.9 | % | 33.42 | |||||||||
Navy Support | 177 | 4,639 | 0.9 | % | 26.23 | |||||||||
Redstone Arsenal | 33 | 790 | 0.2 | % | 23.84 | |||||||||
Regional Office | 492 | 16,946 | 3.4 | % | 34.42 | |||||||||
2022 | 1,637 | 53,316 | 10.6 | % | 32.54 | |||||||||
Ft Meade/BW Corridor | 1,402 | 49,256 | 9.8 | % | 35.13 | |||||||||
NoVA Defense/IT | 144 | 4,673 | 0.9 | % | 32.36 | |||||||||
Navy Support | 183 | 5,396 | 1.1 | % | 29.44 | |||||||||
Redstone Arsenal | 7 | 167 | — | % | 24.01 | |||||||||
Regional Office | 139 | 4,180 | 0.8 | % | 30.00 | |||||||||
2023 | 1,875 | 63,672 | 12.7 | % | 33.94 | |||||||||
Ft Meade/BW Corridor | 1,178 | 42,005 | 8.4 | % | 35.64 | |||||||||
NoVA Defense/IT | 460 | 15,228 | 3.0 | % | 33.07 | |||||||||
Navy Support | 218 | 4,402 | 0.9 | % | 20.22 | |||||||||
Redstone Arsenal | 75 | 1,698 | 0.3 | % | 22.66 | |||||||||
Data Center Shells-Unconsolidated JV Properties | 546 | 3,135 | 0.6 | % | 11.48 | |||||||||
Regional Office | 146 | 4,199 | 0.8 | % | 28.73 | |||||||||
2024 | 2,623 | 70,666 | 14.1 | % | 28.13 | |||||||||
Thereafter | ||||||||||||||
Consolidated Properties | 6,317 | 197,867 | 39.6 | % | 30.92 | |||||||||
Unconsolidated JV Properties | 1,889 | 4,583 | 0.9 | % | 12.87 | |||||||||
Core Portfolio | 17,701 | $ | 500,779 | 100.0 | % | $ | 29.52 | |||||||
20
Segment of Lease and Year of Expiration (2) | Square Footage of Leases Expiring | Annualized Rental Revenue of Expiring Leases (3) | % of Core/Total Annualized Rental Revenue Expiring (3)(4) | Annualized Rental Revenue of Expiring Leases per Occupied Sq. Foot (3) | ||||||||||
Core Portfolio | 17,701 | $ | 500,779 | 99.4 | % | $ | 29.52 | |||||||
Other Properties | 115 | 2,807 | 0.6 | % | 24.46 | |||||||||
Total Portfolio | 17,816 | $ | 503,586 | 100.0 | % | $ | 31.28 | |||||||
Consolidated Portfolio | 15,381 | $ | 495,868 | |||||||||||
Unconsolidated JV Properties | 2,435 | $ | 7,718 | |||||||||||
Note: As of 12/31/19, the weighted average lease term was 5.2 years for the core portfolio, 5.1 years for the total portfolio and 4.9 years for the consolidated portfolio.
Wholesale Data Center
Year of Expiration | Critical Load (MW) | Annualized Rental Revenue of Expiring Leases (3) | |||||
2020 | 13.30 | $ | 18,539 | ||||
2021 | 0.15 | 413 | |||||
2022 | 1.11 | 2,104 | |||||
2023 | 0.25 | 453 | |||||
2024 | — | 10 | |||||
Thereafter | — | 233 | |||||
14.81 | $ | 21,752 | |||||
(1) | This expiration analysis reflects occupied space of our total portfolio (including consolidated and unconsolidated properties) and includes the effect of early renewals completed on existing leases but excludes the effect of new tenant leases on square feet yet to commence as of 12/31/19 of 281,966 for the core portfolio. With regard to properties owned through unconsolidated real estate joint ventures, the amounts reported above reflect 100% of the properties’ square footage but only reflect the portion of Annualized Rental Revenue that was allocable to COPT’s ownership interest. |
(2) | A number of our leases are subject to certain early termination provisions. The year of lease expiration is based on the lease term determined in accordance with GAAP. |
(3) | Total Annualized Rental Revenue is the monthly contractual base rent as of 12/31/19 (ignoring free rent then in effect) multiplied by 12 plus the estimated annualized expense reimbursements under existing leases. The amounts reported above for Annualized Rental Revenue include the portion of properties owned through unconsolidated real estate joint ventures that was allocable to COPT’s ownership interest. |
(4) | Amounts reported represent the percentage of our core portfolio for components of such portfolio while other amounts represent the percentage of our total portfolio. |
21
Corporate Office Properties Trust
2020 Core Portfolio Quarterly Lease Expiration Analysis as of 12/31/19 (1)
(dollars and square feet in thousands, except per square foot amounts)
Segment of Lease and Quarter of Expiration (2) | Square Footage of Leases Expiring | Annualized Rental Revenue of Expiring Leases (3) | % of Core Annualized Rental Revenue Expiring (3)(4) | Annualized Rental Revenue of Expiring Leases per Occupied Sq. Foot | ||||||||||
Core Portfolio | ||||||||||||||
Ft Meade/BW Corridor | 238 | $ | 6,897 | 1.4 | % | $ | 28.54 | |||||||
Navy Support | 9 | 124 | — | % | 13.94 | |||||||||
Q1 2020 | 247 | 7,021 | 1.4 | % | 28.02 | |||||||||
Ft Meade/BW Corridor | 364 | 13,642 | 2.7 | % | 37.52 | |||||||||
NoVA Defense/IT | 14 | 332 | 0.1 | % | 23.97 | |||||||||
Navy Support | 16 | 468 | 0.1 | % | 29.69 | |||||||||
Regional Office | 29 | 924 | 0.2 | % | 32.21 | |||||||||
Q2 2020 | 423 | 15,366 | 3.1 | % | 36.42 | |||||||||
Ft Meade/BW Corridor | 192 | 6,762 | 1.4 | % | 35.18 | |||||||||
NoVA Defense/IT | 11 | 334 | 0.1 | % | 31.04 | |||||||||
Navy Support | 91 | 2,562 | 0.5 | % | 28.01 | |||||||||
Regional Office | 20 | 568 | 0.1 | % | 28.56 | |||||||||
Q3 2020 | 314 | 10,226 | 2.1 | % | 32.53 | |||||||||
Ft Meade/BW Corridor | 100 | 3,632 | 0.7 | % | 36.22 | |||||||||
NoVA Defense/IT | 97 | 2,887 | 0.6 | % | 29.80 | |||||||||
Lackland Air Force Base | 250 | 11,834 | 2.4 | % | 47.34 | |||||||||
Navy Support | 34 | 1,112 | 0.2 | % | 32.43 | |||||||||
Redstone Arsenal | 11 | 261 | 0.1 | % | 23.41 | |||||||||
Regional Office | 28 | 1,041 | 0.2 | % | 37.05 | |||||||||
Q4 2020 | 520 | 20,767 | 4.2 | % | 39.88 | |||||||||
1,504 | $ | 53,380 | 10.7 | % | $ | 35.42 | ||||||||
(1) | This expiration analysis reflects occupied space of our total portfolio (including consolidated and unconsolidated properties) and includes the effect of early renewals completed on existing leases but excludes the effect of new tenant leases on square feet yet to commence as of 12/31/19. |
(2) | A number of our leases are subject to certain early termination provisions. The period of lease expiration is based on the lease term determined in accordance with GAAP. |
(3) | Total Annualized Rental Revenue is the monthly contractual base rent as of 12/31/19 (ignoring free rent then in effect) multiplied by 12 plus the estimated annualized expense reimbursements under existing leases. |
(4) | Amounts reported represent the percentage of our core portfolio. |
22
Corporate Office Properties Trust
Top 20 Tenants as of 12/31/19 (1)
(dollars and square feet in thousands)
Tenant | Total Annualized Rental Revenue (2) | % of Total Annualized Rental Revenue (2) | Occupied Square Feet in Office and Data Center Shells | Weighted Average Remaining Lease Term in Office and Data Center Shells (3) | ||||||||||
United States Government | (4) | $ | 181,898 | 34.6 | % | 4,409 | 4.6 | |||||||
Fortune 500 Company | 41,255 | 7.9 | % | 3,744 | 8.6 | |||||||||
General Dynamics Corporation | 26,000 | 4.9 | % | 725 | 3.9 | |||||||||
The Boeing Company | 16,810 | 3.2 | % | 609 | 1.9 | |||||||||
CACI International Inc | 13,171 | 2.5 | % | 339 | 4.6 | |||||||||
Northrop Grumman Corporation | 11,617 | 2.2 | % | 422 | 2.0 | |||||||||
CareFirst Inc. | 11,086 | 2.1 | % | 312 | 3.1 | |||||||||
Booz Allen Hamilton, Inc. | 10,957 | 2.1 | % | 298 | 1.8 | |||||||||
Wells Fargo & Company | 6,712 | 1.3 | % | 176 | 8.7 | |||||||||
AT&T Corporation | 6,587 | 1.3 | % | 317 | 9.7 | |||||||||
University of Maryland | 6,428 | 1.2 | % | 218 | 5.1 | |||||||||
Miles and Stockbridge, PC | 5,702 | 1.1 | % | 160 | 7.7 | |||||||||
Kratos Defense and Security Solutions | 5,245 | 1.0 | % | 131 | 0.3 | |||||||||
Science Applications International Corp. | 5,101 | 1.0 | % | 136 | 2.3 | |||||||||
The Raytheon Company | 5,079 | 1.0 | % | 136 | 2.5 | |||||||||
Jacobs Engineering Group Inc. | 5,070 | 1.0 | % | 165 | 6.1 | |||||||||
Transamerica Life Insurance Company | 4,889 | 0.9 | % | 140 | 2.0 | |||||||||
Peraton Inc. | 4,474 | 0.9 | % | 135 | 6.9 | |||||||||
The MITRE Corporation | 3,870 | 0.7 | % | 118 | 4.6 | |||||||||
Mantech International Corp. | 3,834 | 0.7 | % | 135 | 4.1 | |||||||||
Subtotal Top 20 Tenants | 375,785 | 71.6 | % | 12,825 | 5.6 | |||||||||
All remaining tenants | 149,553 | 28.4 | % | 4,991 | 4.0 | |||||||||
Total/Weighted Average | $ | 525,338 | 100.0 | % | 17,816 | 5.1 | ||||||||
(1) | Includes Annualized Rental Revenue (“ARR”) in our portfolio of operating office and data center shells and our wholesale data center. For properties owned through unconsolidated real estate joint ventures, includes COPT’s share of those properties’ ARR of $7.7 million (see page 34 for additional information). |
(2) | Total ARR is the monthly contractual base rent as of 12/31/19, multiplied by 12, plus the estimated annualized expense reimbursements under existing leases. With regard to properties owned through unconsolidated real estate joint ventures, the amounts reported above reflect 100% of the properties’ square footage but only reflect the portion of ARR that was allocable to COPT’s ownership interest. |
(3) | Weighted average remaining lease term is based on the lease term determined in accordance with GAAP for our office and data center shell properties (i.e., excluding the effect of our wholesale data center leases). The weighting of the lease term was computed based on occupied square feet. |
(4) | Substantially all of our government leases are subject to early termination provisions which are customary in government leases. As of 12/31/19, $5.3 million in ARR (or 2.9% of our ARR from the United States Government and 1.0% of our total ARR) was through the General Services Administration (GSA). |
23
Corporate Office Properties Trust
Property Dispositions
(dollars and square feet in thousands)
Property | Property Segment | Location | # of Properties | Operational Square Feet | Transaction Date | % Occupied on Transaction Date | Transaction Price (1) | |||||||||||
Quarter Ended 6/30/19 | ||||||||||||||||||
90% interest in DC 15, 16, 17, 18, 19, 20 and 23 | Data Center Shells | Northern Virginia | 7 | 1,174 | 6/20/19 | 100.0% | $ | 238,500 | ||||||||||
Quarter Ended 12/31/19 | ||||||||||||||||||
90% interest in DC 21 and 22 | Data Center Shells | Northern Virginia | 2 | 297 | 12/5/2019 | 100.0% | 72,054 | |||||||||||
Total 2019 Dispositions | 9 | 1,471 | $ | 310,554 | ||||||||||||||
(1) | We sold a 90% interest in these properties based on an aggregate property value of $345.1 million ($265.0 million on the 6/20/19 transaction and $80.1 million on the 12/5/19 one) and retained a 10% interest in the properties through a newly-formed joint venture. The joint venture obtained $202.5 million in non-recourse mortgage loans on the properties, resulting in additional net proceeds to us of $20.1 million. |
24
Corporate Office Properties Trust
Summary of Development Projects as of 12/31/19 (1)
(dollars and square feet in thousands)
Total Rentable Square Feet | % Leased as of 1/31/20 | as of 12/31/19 (2) | Actual or Anticipated Shell Completion Date | Anticipated Operational Date (3) | |||||||||||||
Anticipated Total Cost | Cost to Date | Cost to Date Placed in Service | |||||||||||||||
Property and Segment | Location | ||||||||||||||||
Fort Meade/BW Corridor: | |||||||||||||||||
4600 River Road | College Park, Maryland | 102 | 25% | $ | 30,509 | $ | 8,928 | $ | — | 3Q 20 | 3Q 21 | ||||||
Redstone Arsenal: | |||||||||||||||||
7500 Advanced Gateway | Huntsville, Alabama | 135 | 100% | 19,118 | 7,195 | — | 2Q 20 | 2Q 20 | |||||||||
7600 Advanced Gateway | Huntsville, Alabama | 126 | 100% | 14,239 | 2,543 | — | 2Q 20 | 2Q 20 | |||||||||
100 Secured Gateway | Huntsville, Alabama | 250 | 16% | 58,600 | 25,763 | — | 2Q 20 | 2Q 21 | |||||||||
8600 Advanced Gateway | Huntsville, Alabama | 105 | 100% | 27,680 | 4,931 | — | 4Q 20 | 4Q 20 | |||||||||
8000 Rideout Road | Huntsville, Alabama | 100 | 0% | 25,200 | 2,564 | — | 4Q 20 | 4Q 21 | |||||||||
6000 Redstone Gateway | Huntsville, Alabama | 40 | 79% | 9,526 | 788 | — | 4Q 20 | 4Q 21 | |||||||||
Subtotal / Average | 756 | 58% | 154,363 | 43,784 | — | ||||||||||||
Data Center Shells: | |||||||||||||||||
P2 A | Northern Virginia | 230 | 100% | 54,270 | 46,610 | — | 1Q 20 | 1Q 20 | |||||||||
Oak Grove A | Northern Virginia | 216 | 100% | 48,295 | 29,420 | — | 2Q 20 | 2Q 20 | |||||||||
P2 B | Northern Virginia | 274 | 100% | 64,636 | 32,115 | — | 3Q 20 | 3Q 20 | |||||||||
P2 C | Northern Virginia | 230 | 100% | 51,120 | 18,727 | — | 1Q 21 | 1Q 21 | |||||||||
Subtotal / Average | 950 | 100% | 218,321 | 126,872 | — | ||||||||||||
NoVA Defense/IT: | |||||||||||||||||
NOVA Office C | Chantilly, Virginia | 348 | 100% | 106,219 | 20,870 | 2,794 | 2Q 22 | 2Q 22 | |||||||||
Regional Office: | |||||||||||||||||
2100 L Street | Washington, DC | 190 | 53% | 174,000 | 126,112 | — | 2Q 20 | 2Q 21 | |||||||||
Total Under Development | 2,346 | 79% | $ | 683,412 | $ | 326,566 | $ | 2,794 | |||||||||
(1) | Includes properties under, or contractually committed for, development as of 12/31/19. |
(2) | Cost includes land, development, leasing costs and allocated portion of structured parking and other shared infrastructure, if applicable. |
(3) | Anticipated operational date is the earlier of the estimated date when leases have commenced on 100% of a property’s space or one year from the cessation of major construction activities. |
25
Corporate Office Properties Trust
Summary of Redevelopment Projects as of 12/31/19
(dollars and square feet in thousands)
Property Segment | Total Rentable Square Feet | % Leased as of 12/31/19 | as of 12/31/19 (1) | Actual or Anticipated Completion Date | Anticipated Operational Date (2) | |||||||||||||||||
Historical Basis, Net | Incremental Redevelopment Cost | Anticipated Total Cost | Cost to Date | Cost to Date Placed in Service | ||||||||||||||||||
Property and Location | ||||||||||||||||||||||
6950 Columbia Gateway Columbia, Maryland (3) | Ft Meade/BW Corridor | 106 | 80% | $ | 9,778 | $ | 15,777 | $ | 25,555 | $ | 23,276 | $ | 22,028 | 2Q 19 | 2Q 20 | |||||||
(1) | Cost includes land, development, leasing costs and allocated portion of shared infrastructure. |
(2) | Anticipated operational date is the earlier of the estimated date when leases have commenced on 100% of a property’s space or one year from the cessation of major construction activities. |
(3) | Although classified as under redevelopment, 85,000 square feet were operational as of 12/31/19. |
26
Corporate Office Properties Trust
Development and Redevelopment Placed in Service as of 12/31/19
(square feet in thousands)
Total Property | Square Feet Placed in Service | Space Placed in Service % Leased as of 12/31/19 | ||||||||||||||||
Property Segment | % Leased as of 12/31/19 | Rentable Square Feet | Prior Year | 2019 | ||||||||||||||
Property and Location | 1st Quarter | 2nd Quarter | 3rd Quarter | 4th Quarter | Total 2019 | |||||||||||||
5801 University Research Court College Park, Maryland | Ft Meade/BW Corridor | 100% | 71 | 60 | 11 | — | — | — | 11 | 100% | ||||||||
IN 1 Northern Virginia | Data Center Shells | 100% | 149 | — | 149 | — | — | — | 149 | 100% | ||||||||
4100 Market Street Huntsville, Alabama | Redstone Arsenal | 100% | 36 | — | 21 | — | 7 | 8 | 36 | 100% | ||||||||
MP 1 Northern Virginia | Data Center Shells | 100% | 216 | — | — | 216 | — | — | 216 | 100% | ||||||||
DC 23 Northern Virginia (1) | Data Center Shells | 100% | 149 | — | — | 149 | — | — | 149 | 100% | ||||||||
IN 2 Northern Virginia | Data Center Shells | 100% | 216 | — | — | 216 | — | — | 216 | 100% | ||||||||
4000 Market Street Huntsville, Alabama | Redstone Arsenal | 100% | 43 | 18 | — | 15 | 10 | — | 25 | 100% | ||||||||
6950 Columbia Gateway Columbia, Maryland | Ft Meade/BW Corridor | 80% | 106 | — | — | 10 | — | 75 | 85 | 100% | ||||||||
8800 Redstone Gateway Huntsville, Alabama | Redstone Arsenal | 100% | 76 | — | — | — | — | 76 | 76 | 100% | ||||||||
Oak Grove B Northern Virginia | Data Center Shells | 100% | 216 | — | — | — | — | 216 | 216 | 100% | ||||||||
Total Development/Redevelopment Placed in Service | 98% | 1,278 | 78 | 181 | 606 | 17 | 375 | 1,179 | 100% | |||||||||
(1) | Subsequent to being placed in service, we sold a 90% interest in this property by contributing it into a newly-formed, unconsolidated joint venture on 6/20/19. |
27
Corporate Office Properties Trust
Summary of Land Owned/Controlled as of 12/31/19 (1)
(square feet in thousands)
Location | Acres | Estimated Developable Square Feet | Carrying Amount | ||||||
Land owned/controlled for future development | |||||||||
Defense/IT Locations: | |||||||||
Fort Meade/BW Corridor: | |||||||||
National Business Park | 196 | 2,106 | |||||||
Howard County | 19 | 290 | |||||||
Other | 126 | 1,338 | |||||||
Total Fort Meade/BW Corridor | 341 | 3,734 | |||||||
NoVA Defense/IT | 52 | 1,618 | |||||||
Lackland AFB | 49 | 785 | |||||||
Navy Support | 44 | 109 | |||||||
Redstone Arsenal (2) | 366 | 3,227 | |||||||
Data Center Shells | 53 | 934 | |||||||
Total Defense/IT Locations | 905 | 10,407 | |||||||
Regional Office | 10 | 900 | |||||||
Total land owned/controlled for future development | 915 | 11,307 | $ | 290,571 | |||||
Other land owned/controlled | 43 | 638 | 3,412 | ||||||
Land held, net | 958 | 11,945 | $ | 293,983 | |||||
(1) | This land inventory schedule includes properties under ground lease to us and excludes all properties listed as development or redevelopment as detailed on pages 25 and 26. The costs associated with the land included on this summary are reported on our consolidated balance sheet in the line entitled “land held.” |
(2) | This land is controlled under a long-term master lease agreement to LW Redstone Company, LLC, a consolidated joint venture (see page 33). As this land is developed in the future, the joint venture will execute site-specific leases under the master lease agreement. Rental payments will commence under the site-specific leases as cash rents under tenant leases commence at the respective properties. |
28
Corporate Office Properties Trust
Capitalization Overview
(dollars, shares and units in thousands)
Wtd. Avg. Maturity (Years) | Stated Rate | Effective Rate (1)(2) | Gross Debt Balance at | ||||||||||
12/31/19 | |||||||||||||
Debt | |||||||||||||
Secured debt | 4.0 | 4.06 | % | 4.01 | % | $ | 214,546 | ||||||
Unsecured debt | 3.4 | 3.93 | % | 4.08 | % | 1,628,261 | |||||||
Total Consolidated Debt | 3.5 | 3.94 | % | 4.07 | % | $ | 1,842,807 | ||||||
Fixed rate debt (2) | 3.7 | 4.30 | % | 4.22 | % | $ | 1,618,739 | ||||||
Variable rate debt | 3.0 | 2.99 | % | 3.00 | % | 224,068 | |||||||
Total Consolidated Debt | $ | 1,842,807 | |||||||||||
Preferred Equity | Redeemable | ||||||||||||
3.5% Series I Convertible Preferred Units (3) | Jan-20 | $ | 8,800 | ||||||||||
Common Equity (4) | |||||||||||||
Common Shares | 112,069 | ||||||||||||
Common Units | 1,289 | ||||||||||||
Total Common Shares and Units | 113,358 | ||||||||||||
Closing Common Share Price on 12/31/19 | $ | 29.38 | |||||||||||
Common Equity Market Capitalization | $ | 3,330,458 | |||||||||||
Total Equity Market Capitalization | $ | 3,339,258 | |||||||||||
Total Market Capitalization | $ | 5,182,065 | |||||||||||
(1) Excludes the effect of deferred financing cost amortization. | |||||||||||||
(2) Includes the effect of interest rate swaps with notional amounts of $273.6 million that hedge the risk of changes in interest rates on variable rate debt. | |||||||||||||
(3) 352,000 units outstanding with a liquidation preference of $25 per unit, and convertible into 176,000 common units. | |||||||||||||
(4) Excludes unvested share-based compensation awards subject to market conditions. | |||||||||||||
Investment Grade Ratings & Outlook | Latest Affirmation | |||||
Fitch | BBB- | Stable | 10/7/19 | |||
Moody’s | Baa3 | Stable | 11/20/18 | |||
Standard & Poor’s | BBB- | Positive | 6/21/19 | |||
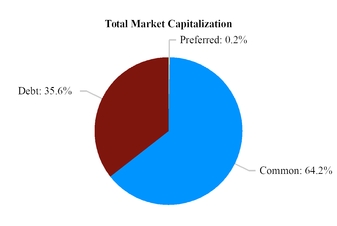
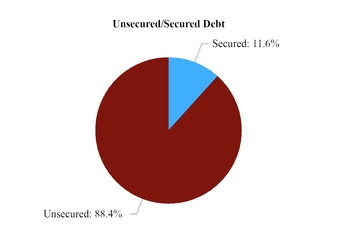
29
Corporate Office Properties Trust
Summary of Outstanding Debt as of 12/31/19
(dollars in thousands)
Unsecured Debt | Stated Rate | Amount Outstanding | Maturity Date | Secured Debt | Stated Rate | Amount Outstanding | Balloon Payment Due Upon Maturity | Maturity Date | |||||||||||||
Revolving Credit Facility | L + 1.10% | $ | 177,000 | Mar-23 | (1)(2) | 7200 & 7400 Redstone Gateway (3) | L + 1.85% | $ | 12,438 | $ | 12,132 | Oct-20 | |||||||||
Senior Unsecured Notes | 7740 Milestone Parkway | 3.96 | % | 17,352 | 15,902 | Feb-23 | |||||||||||||||
3.70% due 2021 | 3.70 | % | $ | 300,000 | Jun-21 | 100 & 30 Light Street | 4.32 | % | 51,527 | 47,676 | Jun-23 | ||||||||||
3.60% due 2023 | 3.60 | % | 350,000 | May-23 | 1000, 1200 & 1100 Redstone | ||||||||||||||||
5.25% due 2024 | 5.25 | % | 250,000 | Feb-24 | Gateway (3) | 4.47 | % | (4) | 32,875 | 27,649 | Jun-24 | ||||||||||
5.00% due 2025 | 5.00 | % | 300,000 | Jul-25 | M-Square: | ||||||||||||||||
Subtotal - Senior Unsecured Notes | 4.32 | % | $ | 1,200,000 | 5825 & 5850 University Research | ||||||||||||||||
Court (3) | 3.82 | % | 42,086 | 35,603 | Jun-26 | ||||||||||||||||
Unsecured Bank Term Loans | 5801 University Research Court (2)(3) | L + 1.45% | 11,200 | 10,020 | Aug-26 | ||||||||||||||||
2022 Maturity | L + 1.25% | $ | 250,000 | Dec-22 | (2) | 2100 L Street (2)(3) | L + 2.35% | 47,068 | 47,068 | Sept-22 | (5) | ||||||||||
Other Unsecured Debt | 0.00 | % | 1,261 | May-26 | Total Secured Debt | 4.06 | % | $ | 214,546 | ||||||||||||
Total Unsecured Debt | 3.93 | % | $ | 1,628,261 | |||||||||||||||||
Debt Summary | |||||||||||||||||||||
Total Unsecured Debt | 3.93 | % | $ | 1,628,261 | |||||||||||||||||
Total Secured Debt | 4.06 | % | 214,546 | ||||||||||||||||||
Consolidated Debt | 3.94 | % | $ | 1,842,807 | |||||||||||||||||
Net discounts and deferred | |||||||||||||||||||||
financing costs | (11,668 | ) | |||||||||||||||||||
Debt, per balance sheet | $ | 1,831,139 | |||||||||||||||||||
Consolidated Debt | $ | 1,842,807 | |||||||||||||||||||
COPT’s share of unconsolid. JV gross debt (6) | 50,250 | ||||||||||||||||||||
Gross debt | $ | 1,893,057 | |||||||||||||||||||
(1) | The Company’s $800 million Revolving Credit Facility matures in March 2023 and may be extended for two six-month periods, at our option. |
(2) | Pre-payable anytime without penalty. |
(3) | These properties are owned through consolidated joint ventures. |
(4) | Represents the weighted average rate of three loans on the properties. |
(5) | The loan maturity may be extended by one year, provided certain conditions are met. |
(6) | See page 34 for additional disclosure regarding our unconsolidated real estate joint ventures. |
30
Corporate Office Properties Trust
Summary of Outstanding Debt as of 12/31/19 (continued)
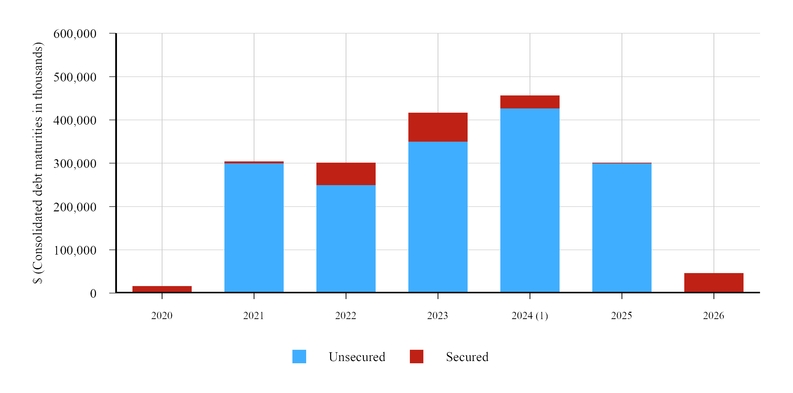
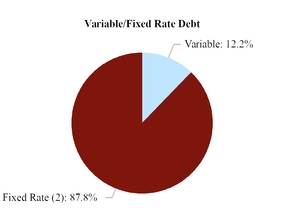
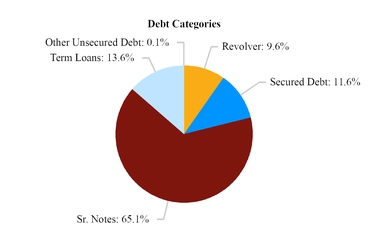
(1) Revolving Credit Facility maturity of $177.0 million scheduled for 2023 is presented assuming our exercise of two six-month extension options.
(2) Includes the effect of interest rate swaps in effect that hedge the risk of changes in interest rates on variable rate debt.
31
Corporate Office Properties Trust
Debt Analysis
(dollars and square feet in thousands)
As of and for Three Months Ended | As of and for Three Months Ended | ||||||||||||||
Senior Note Covenants (1) | Required | 12/31/19 | Line of Credit & Term Loan Covenants (1) | Required | 12/31/19 | ||||||||||
Total Debt / Total Assets | < 60% | 37.4% | Total Debt / Total Assets | < 60% | 34.0% | ||||||||||
Secured Debt / Total Assets | < 40% | 4.6% | Secured Debt / Total Assets | < 40% | 4.3% | ||||||||||
Debt Service Coverage | > 1.5x | 4.2x | Adjusted EBITDA / Fixed Charges | > 1.5x | 3.6x | ||||||||||
Unencumbered Assets / Unsecured Debt | > 150% | 271.6% | Unsecured Debt / Unencumbered Assets | < 60% | 33.3% | ||||||||||
Unencumbered Adjusted NOI / Unsecured Interest Expense | > 1.75x | 4.2x | |||||||||||||
Debt Ratios | Source | Unencumbered Portfolio Analysis | |||||||||||||
Gross debt | p. 30 | $ | 1,893,057 | # of unencumbered properties | 147 | ||||||||||
Adjusted book | p. 37 | $ | 5,099,768 | % of total portfolio | 86 | % | |||||||||
Net debt / adjusted book ratio | 36.8 | % | Unencumbered square feet in-service | 15,532 | |||||||||||
Net debt plus pref. equity / adj. book ratio | 37.0 | % | % of total portfolio | 81 | % | ||||||||||
Net debt | p. 37 | $ | 1,877,826 | NOI from unencumbered real estate operations | $ | 73,772 | |||||||||
Net debt plus preferred equity | p. 37 | $ | 1,886,626 | % of total NOI from real estate operations | 89 | % | |||||||||
In-place adjusted EBITDA | p. 10 | $ | 77,415 | Adjusted EBITDA from unencumbered real estate operations | $ | 67,459 | |||||||||
Net debt / in-place adjusted EBITDA ratio | 6.1 | x | % of total adjusted EBITDA from real estate operations | 89 | % | ||||||||||
Net debt plus pref. equity / in-place adj. EBITDA ratio | 6.1 | x | Unencumbered adjusted book | $ | 4,510,643 | ||||||||||
Denominator for debt service coverage | p. 36 | $ | 17,280 | % of total adjusted book | 88 | % | |||||||||
Denominator for fixed charge coverage | p. 36 | $ | 20,824 | ||||||||||||
Adjusted EBITDA | p. 10 | $ | 76,024 | ||||||||||||
Adjusted EBITDA debt service coverage ratio | 4.4 | x | |||||||||||||
Adjusted EBITDA fixed charge coverage ratio | 3.7 | x | |||||||||||||
(1) The covenants are calculated as defined in the applicable agreements, and the calculations differ between those agreements.
32
Corporate Office Properties Trust
Consolidated Real Estate Joint Ventures as of 12/31/19
(dollars and square feet in thousands)
Operating Properties | Operational Square Feet | % Occupied | % Leased | NOI for the Three Months Ended 12/31/19 (1) | NOI for the Year Ended 12/31/19 (1) | Total Assets (2) | Venture Level Debt | % COPT Owned | |||||||||
Suburban Maryland: | |||||||||||||||||
M Square Associates, LLC (3 properties) | 313 | 99.6% | 99.6% | $ | 1,955 | $ | 6,873 | $ | 71,411 | $ | 53,286 | 50% | |||||
Huntsville, Alabama: | |||||||||||||||||
LW Redstone Company, LLC (9 properties) | 668 | 99.6% | 100.0% | 2,328 | 8,250 | 124,901 | 45,313 | 85% | |||||||||
Total/Average | 981 | 99.6% | 99.9% | $ | 4,283 | $ | 15,123 | $ | 196,312 | $ | 98,599 | ||||||
Non-operating Properties | Estimated Developable Square Feet | Total Assets (2) | Venture Level Debt | % COPT Owned | |||||||
Suburban Maryland: | |||||||||||
M Square Research Park | 450 | $ | 16,504 | $ | — | 50% | |||||
Huntsville, Alabama: | |||||||||||
Redstone Gateway (3) | 3,983 | 124,974 | — | 85% | |||||||
Washington, DC: | |||||||||||
Stevens Place | 190 | 126,603 | 47,068 | 95% | |||||||
Total | 4,623 | $ | 268,081 | $ | 47,068 | ||||||
(1) | Represents NOI of the joint venture operating properties before allocation to joint venture partners. |
(2) | Total assets includes the assets of the consolidated joint venture plus any outside investment basis. |
(3) | Total assets include $59.4 million due from the City of Huntsville (including accrued interest) in connection with infrastructure costs funded by the joint venture. |
33
Corporate Office Properties Trust
Unconsolidated Real Estate Joint Ventures as of 12/31/19
(dollars and square feet in thousands)
Joint venture information | DC Shell JV formed 7/21/16 | DC Shell JV formed 6/20/19 (1) | |||||||||||||||||||||||||||||
COPT ownership % | 50 | % | 10 | % | |||||||||||||||||||||||||||
COPT’s investment | $ | 37,816 | $ | 14,133 | |||||||||||||||||||||||||||
# of Properties | 6 | 9 | |||||||||||||||||||||||||||||
Square Feet | 964 | 1,471 | |||||||||||||||||||||||||||||
% Occupied | 100 | % | 100 | % | |||||||||||||||||||||||||||
COPT’s share of annualized rental revenue | $ | 5,619 | $ | 2,099 | |||||||||||||||||||||||||||
Balance sheet information | DC Shell JV formed 7/21/16 | DC Shell JV formed 6/20/19 | Total | COPT’s Share (1) | |||||||||||||||||||||||||||
Operating properties, net | $ | 121,038 | $ | 315,427 | $ | 436,465 | $ | 92,062 | |||||||||||||||||||||||
Total assets | $ | 135,564 | $ | 349,010 | $ | 484,574 | $ | 102,683 | |||||||||||||||||||||||
Debt | $ | 59,693 | $ | 200,729 | $ | 260,422 | $ | 49,920 | |||||||||||||||||||||||
Total liabilities | $ | 59,932 | $ | 207,680 | $ | 267,612 | $ | 50,734 | |||||||||||||||||||||||
Three Months Ended 12/31/19 | Year Ended 12/31/19 | ||||||||||||||||||||||||||||||
Operating information | DC Shell JV formed 7/21/16 | DC Shell JV formed 6/20/19 | Total | COPT’s Share (1) | DC Shell JV formed 7/21/16 | DC Shell JV formed 6/20/19 | Total | COPT’s Share (1) | |||||||||||||||||||||||
Revenue | $ | 2,937 | $ | 4,709 | $ | 7,646 | $ | 1,939 | $ | 11,761 | $ | 9,537 | $ | 21,298 | $ | 6,834 | |||||||||||||||
Operating expenses | (511 | ) | (504 | ) | (1,015 | ) | (305 | ) | (2,059 | ) | (999 | ) | (3,058 | ) | (1,129 | ) | |||||||||||||||
NOI and EBITDA | 2,426 | 4,205 | 6,631 | 1,634 | 9,702 | 8,538 | 18,240 | 5,705 | |||||||||||||||||||||||
Interest expense | (533 | ) | (1,585 | ) | (2,118 | ) | (425 | ) | (2,115 | ) | (3,046 | ) | (5,161 | ) | (1,362 | ) | |||||||||||||||
Depreciation and amortization | (1,132 | ) | (2,154 | ) | (3,286 | ) | (781 | ) | (4,529 | ) | (4,392 | ) | (8,921 | ) | (2,703 | ) | |||||||||||||||
Net income | $ | 761 | $ | 466 | $ | 1,227 | $ | 428 | $ | 3,058 | $ | 1,100 | $ | 4,158 | $ | 1,640 | |||||||||||||||
NOI (per above) | $ | 2,426 | $ | 4,205 | $ | 6,631 | $ | 1,634 | $ | 9,702 | $ | 8,538 | $ | 18,240 | $ | 5,705 | |||||||||||||||
Tenant funded landlord assets | — | — | — | — | (32 | ) | — | (32 | ) | (16 | ) | ||||||||||||||||||||
Straight line rent adjustments | (66 | ) | (323 | ) | (389 | ) | (67 | ) | (328 | ) | (660 | ) | (988 | ) | (231 | ) | |||||||||||||||
Amortization of acquired above- and below-market rents | — | (142 | ) | (142 | ) | (14 | ) | — | (299 | ) | (299 | ) | (30 | ) | |||||||||||||||||
Cash NOI | $ | 2,360 | $ | 3,740 | $ | 6,100 | $ | 1,553 | $ | 9,342 | $ | 7,579 | $ | 16,921 | $ | 5,428 | |||||||||||||||
(1) This JV acquired seven properties from us on 6/20/19 and an additional two properties on 12/5/19.
(2) Represents the portion allocable to our ownership interest.
34
Corporate Office Properties Trust Supplementary Reconciliations of Non-GAAP Measures (dollars in thousands) | |||||||||||||||||||||||||||
Three Months Ended | Year Ended | ||||||||||||||||||||||||||
12/31/19 | 9/30/19 | 6/30/19 | 3/31/19 | 12/31/18 | 12/31/19 | 12/31/18 | |||||||||||||||||||||
NOI from real estate operations (1) | |||||||||||||||||||||||||||
Real estate revenues (2) | $ | 131,968 | $ | 130,734 | $ | 132,771 | $ | 131,990 | $ | 130,825 | $ | 527,463 | $ | 517,253 | |||||||||||||
Property operating expenses (2) | (51,098 | ) | (49,714 | ) | (47,886 | ) | (49,445 | ) | (51,298 | ) | (198,143 | ) | (201,035 | ) | |||||||||||||
COPT’s share of NOI in unconsolidated real estate JVs (3) | 1,634 | 1,601 | 1,251 | 1,219 | 1,211 | 5,705 | 4,818 | ||||||||||||||||||||
NOI from real estate operations | 82,504 | 82,621 | 86,136 | 83,764 | 80,738 | 335,025 | 321,036 | ||||||||||||||||||||
General and administrative expenses | (7,043 | ) | (6,105 | ) | (7,650 | ) | (6,719 | ) | (5,105 | ) | (27,517 | ) | (22,829 | ) | |||||||||||||
Leasing expenses | (2,293 | ) | (1,824 | ) | (1,736 | ) | (2,032 | ) | (1,976 | ) | (7,885 | ) | (6,071 | ) | |||||||||||||
Business development expenses and land carry costs | (1,292 | ) | (964 | ) | (870 | ) | (1,113 | ) | (1,425 | ) | (4,239 | ) | (5,840 | ) | |||||||||||||
NOI from construction contracts and other service operations | 985 | 895 | 1,297 | 624 | 546 | 3,801 | 2,533 | ||||||||||||||||||||
Equity in (loss) income of unconsolidated non-real estate entities | (2 | ) | (3 | ) | (1 | ) | (1 | ) | 1,198 | (7 | ) | 1,193 | |||||||||||||||
Interest and other income | 1,917 | 1,842 | 1,849 | 2,286 | 74 | 7,894 | 4,358 | ||||||||||||||||||||
Loss on early extinguishment of debt | — | — | — | — | (258 | ) | — | (258 | ) | ||||||||||||||||||
Interest expense | (16,777 | ) | (17,126 | ) | (18,475 | ) | (18,674 | ) | (18,475 | ) | (71,052 | ) | (75,385 | ) | |||||||||||||
COPT’s share of interest expense of unconsolidated real estate JVs (3) | (425 | ) | (412 | ) | (264 | ) | (261 | ) | (267 | ) | (1,362 | ) | (1,058 | ) | |||||||||||||
Income tax benefit (expense) | 104 | 131 | 176 | (194 | ) | 190 | 217 | 363 | |||||||||||||||||||
FFO - per Nareit (1) | $ | 57,678 | $ | 59,055 | $ | 60,462 | $ | 57,680 | $ | 55,240 | $ | 234,875 | $ | 218,042 | |||||||||||||
Real estate revenues | |||||||||||||||||||||||||||
Lease revenue | |||||||||||||||||||||||||||
Fixed contractual payments | $ | 101,116 | $ | 102,389 | $ | 104,193 | $ | 104,644 | $ | 102,900 | $ | 412,342 | $ | 404,940 | |||||||||||||
Variable lease payments | |||||||||||||||||||||||||||
Lease termination fees | 436 | 841 | 2,458 | 521 | 906 | 4,256 | 3,662 | ||||||||||||||||||||
Other variable lease payments (4) | 29,141 | 26,231 | 24,764 | 25,738 | 25,790 | 105,874 | 103,725 | ||||||||||||||||||||
Lease revenue | 130,693 | 129,461 | 131,415 | 130,903 | 129,596 | 522,472 | 512,327 | ||||||||||||||||||||
Other property revenue | 1,275 | 1,273 | 1,356 | 1,087 | 1,229 | 4,991 | 4,926 | ||||||||||||||||||||
Real estate revenues | $ | 131,968 | $ | 130,734 | $ | 132,771 | $ | 131,990 | $ | 130,825 | $ | 527,463 | $ | 517,253 | |||||||||||||
Provision for credit losses (recoveries) (2) | $ | 579 | $ | 39 | $ | (2 | ) | $ | 70 | $ | 39 | $ | 686 | $ | 339 | ||||||||||||
(1) | Refer to section entitled “Definitions” for a definition of this measure. |
(2) | Provision for credit losses is included in real estate revenues in 2019 and property operating expenses in prior periods. |
(3) | See page 34 for a schedule of the related components. |
(4) | Represents primarily lease revenue associated with property operating expense reimbursements from tenants. |
35
Corporate Office Properties Trust Supplementary Reconciliations of Non-GAAP Measures (continued) (dollars in thousands) | |||||||||||||||||||||||||||
Three Months Ended | Year Ended | ||||||||||||||||||||||||||
12/31/19 | 9/30/19 | 6/30/19 | 3/31/19 | 12/31/18 | 12/31/19 | 12/31/18 | |||||||||||||||||||||
Total interest expense | $ | 16,777 | $ | 17,126 | $ | 18,475 | $ | 18,674 | $ | 18,475 | $ | 71,052 | $ | 75,385 | |||||||||||||
Less: Amortization of deferred financing costs | (541 | ) | (538 | ) | (529 | ) | (528 | ) | (550 | ) | (2,136 | ) | (1,954 | ) | |||||||||||||
Less: Amortization of net debt discounts, net of amounts capitalized | (382 | ) | (377 | ) | (374 | ) | (370 | ) | (365 | ) | (1,503 | ) | (1,439 | ) | |||||||||||||
Less: Accum. other comprehensive loss on derivatives amortized to expense | — | (12 | ) | (33 | ) | (34 | ) | (34 | ) | (79 | ) | (135 | ) | ||||||||||||||
COPT’s share of interest expense of unconsolidated real estate JVs, excluding deferred financing costs | 416 | 403 | 258 | 255 | 260 | 1,332 | 1,034 | ||||||||||||||||||||
Denominator for interest coverage | 16,270 | 16,602 | 17,797 | 17,997 | 17,786 | 68,666 | 72,891 | ||||||||||||||||||||
Scheduled principal amortization | 1,010 | 1,107 | 1,095 | 1,098 | 1,079 | 4,310 | 4,240 | ||||||||||||||||||||
Denominator for debt service coverage | 17,280 | 17,709 | 18,892 | 19,095 | 18,865 | 72,976 | 77,131 | ||||||||||||||||||||
Capitalized interest | 3,467 | 2,927 | 2,388 | 2,004 | 1,748 | 10,786 | 5,929 | ||||||||||||||||||||
Preferred unit distributions | 77 | 157 | 165 | 165 | 165 | 564 | 660 | ||||||||||||||||||||
Denominator for fixed charge coverage | $ | 20,824 | $ | 20,793 | $ | 21,445 | $ | 21,264 | $ | 20,778 | $ | 84,326 | $ | 83,720 | |||||||||||||
Preferred unit distributions | $ | 77 | $ | 157 | $ | 165 | $ | 165 | $ | 165 | $ | 564 | $ | 660 | |||||||||||||
Common share dividends - unrestricted shares and deferred shares | 30,724 | 30,721 | 30,693 | 30,685 | 30,206 | 122,823 | 116,285 | ||||||||||||||||||||
Common share dividends - restricted shares and deferred shares | 102 | 103 | 63 | 68 | 114 | 336 | 462 | ||||||||||||||||||||
Common unit distributions - unrestricted units | 337 | 338 | 365 | 365 | 367 | 1,405 | 2,498 | ||||||||||||||||||||
Common unit distributions - restricted units | 22 | 22 | 23 | 20 | — | 87 | — | ||||||||||||||||||||
Total dividends/distributions | $ | 31,262 | $ | 31,341 | $ | 31,309 | $ | 31,303 | $ | 30,852 | $ | 125,215 | $ | 119,905 | |||||||||||||
Common share dividends - unrestricted shares and deferred shares | $ | 30,724 | $ | 30,721 | $ | 30,693 | $ | 30,685 | $ | 30,206 | $ | 122,823 | $ | 116,285 | |||||||||||||
Common unit distributions - unrestricted units | 337 | 338 | 365 | 365 | 367 | 1,405 | 2,498 | ||||||||||||||||||||
Distributions on dilutive preferred units | 77 | — | — | — | — | — | — | ||||||||||||||||||||
Dividends and distributions for payout ratios | $ | 31,138 | $ | 31,059 | $ | 31,058 | $ | 31,050 | $ | 30,573 | $ | 124,228 | $ | 118,783 | |||||||||||||
36
Corporate Office Properties Trust Supplementary Reconciliations of Non-GAAP Measures (continued) (dollars in thousands) | |||||||||||||||||||||||||||
Three Months Ended | |||||||||||||||||||||||||||
12/31/19 | 9/30/19 | 6/30/19 | 3/31/19 | 12/31/18 | |||||||||||||||||||||||
Total assets | $ | 3,854,453 | $ | 3,855,369 | $ | 3,803,469 | $ | 3,775,859 | $ | 3,656,005 | |||||||||||||||||
Accumulated depreciation | 1,007,120 | 979,353 | 949,111 | 927,266 | 897,903 | ||||||||||||||||||||||
Accumulated depreciation included in assets held for sale | — | 1,397 | 1,397 | — | — | ||||||||||||||||||||||
Accumulated amort. of real estate intangibles and deferred leasing costs | 212,547 | 212,222 | 210,183 | 208,973 | 204,882 | ||||||||||||||||||||||
Accumulated amortization of real estate intangibles and deferred leasing costs included in assets held for sale | — | 4 | 4 | — | — | ||||||||||||||||||||||
COPT’s share of liabilities of unconsolidated real estate JVs | 50,734 | 46,061 | 30,588 | 30,156 | 29,917 | ||||||||||||||||||||||
COPT’s share of accumulated depreciation and amortization of unconsolidated real estate JVs | 8,164 | 7,376 | 6,578 | 6,012 | 5,446 | ||||||||||||||||||||||
Less: Property - operating lease liabilities | (17,317 | ) | (16,686 | ) | (16,640 | ) | (16,619 | ) | — | ||||||||||||||||||
Less: Property - finance lease liabilities | (702 | ) | (702 | ) | (712 | ) | (716 | ) | (660 | ) | |||||||||||||||||
Less: Cash and cash equivalents | (14,733 | ) | (34,005 | ) | (46,282 | ) | (7,780 | ) | (8,066 | ) | |||||||||||||||||
Less: COPT’s share of cash of unconsolidated real estate JVs | (498 | ) | (505 | ) | (406 | ) | (377 | ) | (293 | ) | |||||||||||||||||
Adjusted book | $ | 5,099,768 | $ | 5,049,884 | $ | 4,937,290 | $ | 4,922,774 | $ | 4,785,134 | |||||||||||||||||
Gross debt (page 30) | $ | 1,893,057 | $ | 1,920,179 | $ | 1,827,304 | $ | 1,919,920 | $ | 1,868,504 | |||||||||||||||||
Less: Cash and cash equivalents | (14,733 | ) | (34,005 | ) | (46,282 | ) | (7,780 | ) | (8,066 | ) | |||||||||||||||||
Less: COPT’s share of cash of unconsolidated real estate JVs | (498 | ) | (505 | ) | (406 | ) | (377 | ) | (293 | ) | |||||||||||||||||
Net debt | $ | 1,877,826 | $ | 1,885,669 | $ | 1,780,616 | $ | 1,911,763 | $ | 1,860,145 | |||||||||||||||||
Preferred equity | 8,800 | 8,800 | 8,800 | 8,800 | 8,800 | ||||||||||||||||||||||
Net debt plus preferred equity | $ | 1,886,626 | $ | 1,894,469 | $ | 1,789,416 | $ | 1,920,563 | $ | 1,868,945 | |||||||||||||||||
37
Corporate Office Properties Trust
Definitions
Non-GAAP Measures
We believe that the measures defined below that are not determined in accordance with generally accepted accounting principles (“GAAP”) are helpful to investors in measuring our performance and comparing it to that of other real estate investment trusts (“REITs”). Since these measures exclude certain items includable in their respective most comparable GAAP measures, reliance on the measures has limitations; management compensates for these limitations by using the measures simply as supplemental measures that are weighed in balance with other GAAP and non-GAAP measures. These measures should not be used as an alternative to the respective most comparable GAAP measures when evaluating our financial performance or to cash flow from operating, investing and financing activities when evaluating our liquidity or ability to make cash distributions or pay debt service.
Adjusted book
Defined as total assets presented on our consolidated balance sheet, net of lease liabilities associated with property right-of-use assets, and excluding the effect of cash and cash equivalents, accumulated depreciation on real estate properties, accumulated amortization of intangible assets on real estate acquisitions, accumulated amortization of deferred leasing costs, disposed properties included in assets held for sale, unconsolidated real estate joint ventures (“JVs”) cash and cash equivalents, liabilities and accumulated depreciation and amortization (of real estate intangibles and deferred leasing costs) allocable to our ownership interest in the JVs and the effect of properties serving as collateral for debt in default that we extinguished (or intend to extinguish) via conveyance of such properties.
Adjusted earnings before interest, income taxes, depreciation and amortization (“Adjusted EBITDA”)
Adjusted EBITDA is net income adjusted for the effects of interest expense, depreciation and amortization, impairment losses, gain on sales of real estate, gain or loss on early extinguishment of debt, net gain or loss on other investments, operating property acquisition costs, income taxes, business development expenses, demolition costs on redevelopment and nonrecurring improvements, executive transition costs and certain other expenses that we believe are not closely correlated with our operating performance. Adjusted EBITDA also includes adjustments to net income for the effects of the items noted above pertaining to unconsolidated real estate JVs that were allocable to our ownership interest in the JV. While EBITDA (earnings before interest, taxes, depreciation and amortization) is a universally-defined supplemental measure, Adjusted EBITDA incorporates additional adjustments for gains and losses from investing and financing activities and certain other items that we believe are not closely correlated to (or associated with) our operating performance. We believe that adjusted EBITDA is a useful supplemental measure for assessing our un-levered performance. We believe that net income is the most directly comparable GAAP measure to this non-GAAP measure.
Amortization of acquisition intangibles included in NOI
Represents the amortization of intangible asset and liability categories that is included in net operating income, including amortization of above- or below-market leases and above- or below-market cost arrangements.
Basic FFO available to common share and common unit holders (“Basic FFO”)
This measure is FFO adjusted to subtract (1) preferred share dividends, (2) income attributable to noncontrolling interests through ownership of preferred units in Corporate Office Properties, L.P. (the “Operating Partnership”) or interests in other consolidated entities not owned by us, (3) depreciation and amortization allocable to noncontrolling interests in other consolidated entities, (4) Basic FFO allocable to share-based compensation awards and (5) issuance costs associated with redeemed preferred shares. With these adjustments, Basic FFO represents FFO available to common shareholders and holders of common units in the Operating Partnership (“common units”). Common units are substantially similar to our common shares of beneficial interest (“common shares”) and are exchangeable into common shares, subject to certain conditions. We believe that Basic FFO is useful to investors due to the close correlation of common units to common shares. We believe that net income is the most directly comparable GAAP measure to this non-GAAP measure.
38
Corporate Office Properties Trust
Definitions
Cash net operating income (“Cash NOI”)
Defined as NOI from real estate operations adjusted to eliminate the effects of: straight-line rental adjustments, amortization of tenant incentives, amortization of acquisition intangibles included in FFO and NOI (including above- and below-market leases and above- or below-market cost arrangements), lease termination fees from tenants to terminate their lease obligations prior to the end of the agreed upon lease terms and rental revenue recognized under GAAP resulting from landlord assets and lease incentives funded by tenants. Cash NOI also includes adjustments to NOI from real estate operations for the effects of the items noted above pertaining to unconsolidated real estate JVs that were allocable to our ownership interest in the JVs. Under GAAP, rental revenue is recognized evenly over the term of tenant leases (through straight-line rental adjustments and amortization of tenant incentives), which, given the long term nature of our leases, does not align with the economics of when tenant payments are due to us under the arrangements. Also under GAAP, when a property is acquired, we allocate the acquisition to certain intangible components, which are then amortized into NOI over their estimated lives, even though the resulting revenue adjustments are not reflective of our lease economics. In addition, revenue from lease termination fees and tenant-funded landlord improvements, absent an adjustment from us, would result in large one-time lump sum amounts in Cash NOI that we do not believe are reflective of a property’s long-term value. We believe that Cash NOI is a useful supplemental measure of operating performance for a REIT’s operating real estate because it makes adjustments to NOI for the above stated items to be more reflective of the economics of when tenant payments are due to us under our leases and the value of our properties. As is the case with NOI, the measure is useful in our opinion in evaluating and comparing the performance of geographic segments, Same Properties groupings and individual properties. We believe that NOI from real estate operations, our segment performance measure, is the most directly comparable GAAP measure to this non-GAAP measure.
COPT’s share of NOI from unconsolidated real estate JVs
Represents the net of revenues and property operating expenses of real estate operations owned through unconsolidated JVs that are allocable to COPT’s ownership interest. This measure is included in the computation of NOI, our segment performance measure, as discussed below.
Diluted adjusted funds from operations available to common share and common unit holders (“Diluted AFFO”)
Defined as Diluted FFO, as adjusted for comparability, adjusted for the following: (1) the elimination of the effect of (a) noncash rental revenues and property operating expenses (comprised of straight-line rental adjustments, which includes the amortization of recurring tenant incentives, and amortization of acquisition intangibles included in FFO and NOI, both of which are described under “Cash NOI” above), (b) share-based compensation, net of amounts capitalized, (c) amortization of deferred financing costs, (d) amortization of debt discounts and premiums and (e) amortization of settlements of debt hedges; and (2) replacement capital expenditures (defined below). Diluted AFFO also includes adjustments to Diluted FFO, as adjusted for comparability for the effects of the items noted above pertaining to unconsolidated real estate JVs that were allocable to our ownership interest in the JVs. We believe that Diluted AFFO is a useful supplemental measure of operating performance for a REIT because it incorporates adjustments for: certain revenue and expenses that are not associated with cash to or from us during the period; and certain capital expenditures for operating properties incurred during the period that do require cash outlays. We believe that net income is the most directly comparable GAAP measure to this non-GAAP measure.
Diluted FFO available to common share and common unit holders (“Diluted FFO”)
Diluted FFO is Basic FFO adjusted to add back any changes in Basic FFO that would result from the assumed conversion of securities that are convertible or exchangeable into common shares. The computation of Diluted FFO assumes the conversion of common units but does not assume the conversion of other securities that are convertible into common shares if the conversion of those securities would increase Diluted FFO per share in a given period. We believe that Diluted FFO is useful to investors because it is the numerator used to compute Diluted FFO per share, discussed below. We believe that net income is the most directly comparable GAAP measure to this non-GAAP measure.
39
Corporate Office Properties Trust
Definitions
Diluted FFO available to common share and common unit holders, as adjusted for comparability (“Diluted FFO, as adjusted for comparability”)
Defined as Diluted FFO or FFO adjusted to exclude: operating property acquisition costs; gain or loss on early extinguishment of debt; FFO associated with properties that secured non-recourse debt on which we defaulted and, subsequently, extinguished via conveyance of such properties (including property NOI, interest expense and gains on debt extinguishment); loss on interest rate derivatives; demolition costs on redevelopment and nonrecurring improvements; executive transition costs, accounting charges for original issuance costs associated with redeemed preferred shares and certain other expenses that we believe are not closely correlated with our operating performance. Diluted FFO, as adjusted for comparability also includes adjustments to Diluted FFO for the effects of the items noted above pertaining to unconsolidated real estate JVs that were allocable to our ownership interest in the JVs. We believe this to be a useful supplemental measure alongside Diluted FFO as it excludes gains and losses from certain investing and financing activities and certain other items that we believe are not closely correlated to (or associated with) our operating performance. The adjustment for FFO associated with properties securing non-recourse debt on which we defaulted pertains to the periods subsequent to our default on the loan’s payment terms, which was the result of our decision to not support payments on the loan since the estimated fair value of the properties was less than the loan balance. While we continued as the legal owner of the properties during this period, all cash flows produced by them went directly to the lender and we did not fund any debt service shortfalls, which included incremental additional interest under the default rate. We believe that net income is the most directly comparable GAAP measure to this non-GAAP measure.
Diluted FFO per share
Diluted FFO per share is (1) Diluted FFO divided by (2) the sum of the (a) weighted average common shares outstanding during a period, (b) weighted average common units outstanding during a period and (c) weighted average number of potential additional common shares that would have been outstanding during a period if other securities that are convertible or exchangeable into common shares were converted or exchanged. The computation of Diluted FFO per share assumes the conversion of common units but does not assume the conversion of other securities that are convertible into common shares if the conversion of those securities would increase Diluted FFO per share in a given period. We believe that Diluted FFO per share is useful to investors because it provides investors with a further context for evaluating our FFO results in the same manner that investors use earnings per share (“EPS”) in evaluating net income available to common shareholders. We believe that diluted EPS is the most directly comparable GAAP measure to this non-GAAP measure.
Diluted FFO per share, as adjusted for comparability
Defined as (1) Diluted FFO available to common share and common unit holders, as adjusted for comparability divided by (2) the sum of the (a) weighted average common shares outstanding during a period, (b) weighted average common units outstanding during a period and (c) weighted average number of potential additional common shares that would have been outstanding during a period if other securities that are convertible or exchangeable into common shares were converted or exchanged. The computation of this measure assumes the conversion of common units but does not assume the conversion of other securities that are convertible into common shares if the conversion of those securities would increase the per share measure in a given period. We believe this to be a useful supplemental measure alongside Diluted FFO per share as it excludes gains and losses from investing and financing activities and certain other items that we believe are not closely correlated to (or associated with) our operating performance. We believe that diluted EPS is the most directly comparable GAAP measure to this non-GAAP measure.
Earnings before interest, income taxes, depreciation and amortization for real estate (“EBITDAre”)
Defined as net income adjusted for the effects of interest expense, depreciation and amortization, gains on sales and impairment losses of real estate and income taxes. EBITDAre also includes adjustments to net income for the effects of the items noted above pertaining to unconsolidated real estate JVs that were allocable to our ownership interest in the JVs. While EBITDA (earnings before interest, taxes, depreciation and amortization) is a universally-defined supplemental measure, EBITDAre incorporates additional adjustments for gains and losses from investing activities related to our investments in operating properties. We believe that EBITDAre is a useful supplemental measure for assessing our un-levered performance. We believe that net income is the most directly comparable GAAP measure to this non-GAAP measure.
40
Corporate Office Properties Trust
Definitions
Funds from operations (“FFO” or “FFO per Nareit”)
Defined as net income computed using GAAP, excluding gains on sales and impairment losses of real estate (net of associated income tax) and real estate-related depreciation and amortization. FFO also includes adjustments to net income for the effects of the items noted above pertaining to unconsolidated real estate JVs that were allocable to our ownership interest in the JVs. We believe that we use the National Association of Real Estate Investment Trust’s (“Nareit”) definition of FFO, although others may interpret the definition differently and, accordingly, our presentation of FFO may differ from those of other REITs. We believe that FFO is useful to management and investors as a supplemental measure of operating performance because, by excluding gains on sales and impairment losses of real estate (net of associated income tax) and real estate-related depreciation and amortization, FFO can help one compare our operating performance between periods. We believe that net income is the most directly comparable GAAP measure to this non-GAAP measure.
Gross debt
Defined as total consolidated outstanding debt, which is debt reported per our balance sheet adjusted to exclude net discounts and premiums and deferred financing costs, as further adjusted to include outstanding debt of unconsolidated real estate JVs that were allocable to our ownership interest in the JVs.
In-place adjusted EBITDA
Defined as Adjusted EBITDA, as further adjusted for: (1) the removal of NOI pertaining to properties in the quarterly periods in which such properties were disposed or removed from service; (2) the addition of pro forma adjustments to NOI for (a) properties acquired or placed in service subsequent to the commencement of a quarter made in order to reflect a full quarter of ownership/operations and (b) significant mid-quarter occupancy changes associated with properties recently placed in service with no occupancy; and (3) certain adjustments to deferred rental revenue associated with changes in our assessment of collectability that we believe are not closely correlated with our operating performance. The measure also includes adjustments to Adjusted EBITDA for the effects of the items noted above pertaining to unconsolidated real estate JVs that were allocable to our ownership interest in the JVs. We believe that in-place adjusted EBITDA is a useful supplemental measure of performance for assessing our un-levered performance, as further adjusted for changes in operating properties subsequent to the commencement of a quarter. We believe that net income is the most directly comparable GAAP measure to this non-GAAP measure.
Net debt
Defined as Gross debt (total outstanding debt reported per our balance sheet as adjusted to exclude net discounts and premiums and deferred financing costs), as adjusted to subtract cash and cash equivalents as of the end of the period and debt in default that was extinguished via conveyance of properties. The measure also includes adjustments to Gross debt for the effects of the items noted above pertaining to unconsolidated real estate JVs that were allocable to our ownership interest in the JVs.
Net debt plus preferred equity
Defined as Net debt plus the total liquidation preference of our outstanding preferred equity.
Net debt to Adjusted book and Net debt plus preferred equity to Adjusted book
These measures divide either Net debt or Net debt plus preferred equity (defined above) by Adjusted book (defined above).
Net debt to in-place adjusted EBITDA ratio and Net debt plus preferred equity to in-place adjusted EBITDA ratio
Defined as Net debt or Net debt plus preferred equity (as defined above) divided by in-place adjusted EBITDA (defined above) for the three month period that is annualized by multiplying by four.
41
Corporate Office Properties Trust
Definitions
Net operating income from real estate operations (“NOI”)
NOI, which is our segment performance measure, includes: consolidated real estate revenues; consolidated property operating expenses; and the net of revenues and property operating expenses of real estate operations owned through unconsolidated real estate JVs that are allocable to COPT’s ownership interest in the JVs. We believe that NOI is an important supplemental measure of operating performance for a REIT’s operating real estate because it provides a measure of the core real estate operations that is unaffected by depreciation, amortization, financing and general, administrative and leasing expenses; we believe this measure is particularly useful in evaluating the performance of geographic segments, Same Properties groupings and individual properties.
NOI debt service coverage ratio and Adjusted EBITDA debt service coverage ratio
These measures divide either NOI from real estate operations or Adjusted EBITDA by the sum of interest expense (excluding amortization of deferred financing costs and amortization of debt discounts and premiums, net of amounts capitalized, gains or losses on interest rate derivatives and interest expense on debt in default to be extinguished via conveyance of properties) and scheduled principal amortization on mortgage loans.
NOI fixed charge coverage ratio and Adjusted EBITDA fixed charge coverage ratio
These measures divide either NOI from real estate operations or Adjusted EBITDA by the sum of (1) interest expense (excluding amortization of deferred financing costs and amortization of debt discounts and premiums, net of amounts capitalized, gains or losses on interest rate derivatives and interest expense on debt in default to be extinguished via conveyance of properties), (2) scheduled principal amortization on mortgage loans, (3) capitalized interest, (4) dividends on preferred shares and (5) distributions on preferred units in the Operating Partnership not owned by us.
NOI interest coverage ratio and Adjusted EBITDA interest coverage ratio
These measures divide either NOI from real estate operations or Adjusted EBITDA by interest expense (excluding amortization of deferred financing costs and amortization of debt discounts and premiums, net of amounts capitalized, gains on losses on interest rate derivatives and interest expense on debt in default to be extinguished via conveyance of properties).
Payout ratios based on: Diluted FFO; Diluted FFO, as adjusted for comparability; and Diluted AFFO
These payout ratios are defined as (1) the sum of dividends on unrestricted common shares and distributions to holders of interests in the Operating Partnership (excluding unvested share-based compensation awards) and dividends on convertible preferred shares when such distributions and dividends are included in Diluted FFO divided by (2) the respective non-GAAP measures on which the payout ratios are based.
Replacement capital expenditures
Replacement capital expenditures are defined as tenant improvements and incentives, building improvements and leasing costs incurred during the period for operating properties that are not (1) items contemplated prior to the acquisition of a property, (2) improvements associated with the expansion of a building or its improvements, (3) renovations to a building which change the underlying classification of the building (for example, from industrial to office or Class C office to Class B office), (4) capital improvements that represent the addition of something new to the property rather than the replacement of something (for example, the addition of a new heating and air conditioning unit that is not replacing one that was previously there) or (5) replacements of significant components of a building after the building has reached the end of its original useful life. Replacement capital expenditures excludes expenditures of operating properties included in disposition plans during the period that were already sold or are held for future disposition. For cash tenant incentives not due to the tenant for a period exceeding three months past the date on which such incentives were incurred, we recognize such incentives as replacement capital expenditures in the periods such incentives are due to the tenant. Replacement capital expenditures, which is included in the computation of Diluted AFFO, is intended to represent non-transformative capital expenditures of existing properties held for long-term investment. We believe that the excluded expenditures are more closely associated with our investing activities than the performance of our operating portfolio.
42
Corporate Office Properties Trust
Definitions
Same Properties NOI and Same Properties cash NOI
Defined as NOI, or Cash NOI, from real estate operations of Same Properties. We believe that these are important supplemental measures of operating performance of Same Properties for the same reasons discussed above for NOI from real estate operations and Cash NOI.
Other Definitions
Acquisition Costs — Transaction costs expensed in connection with executed or anticipated acquisitions of operating properties.
Annualized Rental Revenue — The monthly contractual base rent as of the reporting date multiplied by 12, plus the estimated annualized expense reimbursements under existing leases for occupied space. With regard to properties owned through unconsolidated real estate JVs, we include the portion of Annualized Rental Revenue allocable to COPT’s ownership interest.
Average escalations — Leasing statistic used to report average increase in rental rates over lease terms for leases with a term of greater than one-year.
Development Properties — Properties under, or contractually committed for, development.
Core Portfolio — Represents Defense/IT Locations and Regional Office properties.
Defense/IT Locations — Represents properties in locations that support the United States Government and its contractors, most of whom are engaged in national security, defense and IT related activities servicing what we believe are growing, durable, priority missions.
First Generation Space — Newly-developed or redeveloped space that has never been occupied.
Operational Space — The portion of a property in operations (excludes portion under development or redevelopment).
Redevelopment Properties — Properties previously in operations on which activities to substantially renovate such properties were underway or approved.
Regional Office Properties — Includes office properties located in select urban/urban-like submarkets in the Greater Washington, DC/Baltimore region with durable Class-A office fundamentals and characteristics.
Same Properties — Operating office and data center shell properties stably owned and 100% operational since at least 1/1/18.
Second Generation Space — Space leased that has been previously occupied.
Total Portfolio — Operating properties, including ones owned through unconsolidated real estate JVs.
43
 | 6711 Columbia Gateway Drive, Suite 300 | |
Columbia, Maryland 21046 | ||
Telephone 443-285-5400 | ||
Facsimile 443-285-7650 | ||
www.copt.com | ||
NYSE: OFC | ||
NEWS RELEASE | ||
FOR IMMEDIATE RELEASE | IR Contacts: | |
Stephanie Krewson-Kelly | Michelle Layne | |
443-285-5453 | 443-285-5452 | |
stephanie.kelly@copt.com | michelle.layne@copt.com | |
COPT Reports Fourth Quarter and Full Year 2019 Results
__________________________________________________________________________
EPS Exceeded Guidance; FFO per Share Achieved Mid-Point of Updated Guidance
Same-Property Cash NOI Growth of 6.2% in 4Q19 and 3.9% for the Full Year Exceeded Guidance
Core Portfolio 93.1% Occupied & 94.6% Leased
1.2 Million SF of 100% Leased Developments Placed into Service During 2019
2.3 Million SF Under Development are 79% Leased
__________________________________________________________________________
Record Leasing Volumes
Total Leasing of 659,000 SF in 4Q and
Record Total Leasing of 4.9 Million SF for the Full Year - 600,000 SF Higher than Prior Record Set in 2010
Development Leasing of 158,000 SF in 4Q19; Record 2.2 Million SF for the Year
U.S. Government Total New Leasing Volume of 586,000 SF During 2019,
Including 164,000 SF of Vacancy Leasing
Strong Vacancy Leasing of 784,000 SF During the Year
Strong Tenant Retention of 84% in 4Q19 Exceeded Guidance; 77% for the Year Met Expectations
__________________________________________________________________________
COLUMBIA, MD February 6, 2020 - Corporate Office Properties Trust (“COPT” or the “Company”) (NYSE: OFC) announced financial and operating results for the fourth quarter and full year ended December 31, 2019.
Management Comments
Stephen E. Budorick, COPT’s President & Chief Executive Officer, commented, “Fourth quarter and full year FFO per share met the mid-points of our updated guidance ranges, and strong demand throughout our Defense/IT Locations translated into record leasing for new developments, strong vacancy leasing, and near-record leasing with the U.S. Government. Our 2.2 million square feet of development leasing exceeded our prior annual record set in 2012 by 1 million square feet, and we executed 586,000 square feet of development and vacancy leasing with the U.S. Government, our second-best year ever.” He continued, “We believe that this strong leasing achievement, combined with the $357 million of equity raised and the 1.2 million square feet of 100% leased developments placed into service during 2019, position our Company to deliver 1.5%-3.5% FFO per share growth in 2020, and robust FFO growth in 2021.”
i
Financial Highlights
4th Quarter Financial Results:
• | Diluted earnings per share (“EPS”) was $0.38 for the quarter ended December 31, 2019 as compared to $0.16 for the fourth quarter of 2018. |
• | Diluted funds from operations per share (“FFOPS”), as calculated in accordance with Nareit’s definition, of $0.49 for the fourth quarter of 2019 equaled fourth quarter 2018 results. |
• | FFOPS, as adjusted for comparability, was $0.50 for the fourth quarter of 2019, equal to fourth quarter 2018 results. |
Full Year 2019 Financial Results:
• | EPS for the year ended December 31, 2019 was $1.71, which included $105.2 million of gains on the sale of a 90% interest in nine data center shell properties during the year as compared to 2018 EPS of $0.69. |
• | Per Nareit’s definition, FFOPS for 2019 was $2.02 as compared to $1.99 for 2018. |
• | FFOPS, as adjusted for comparability, for 2019 was $2.03 as compared to $2.01 for 2018. |
Adjustments for comparability encompass items such as demolition costs of redevelopment, executive transition costs, and non-comparable professional and legal expenses.
Operating Performance Highlights
Operating Portfolio Summary:
• | At December 31, 2019, the Company’s core portfolio of 168 operating office and data center shell properties was 93.1% occupied and 94.6% leased. |
• | During the quarter and the year, the Company placed into service 375,000 and 1.2 million respective square feet that were 100% leased. |
Same-Property Performance:
• | At December 31, 2019, COPT’s same-property portfolio of 147 buildings was 91.9% occupied and 93.7% leased. |
• | For the quarter and year ended December 31, 2019, the Company’s same-property cash NOI increased 6.2% and 3.9%, respectively, over the prior year’s comparable periods. |
Leasing:
• | Total Square Feet Leased: For the quarter ended December 31, 2019, the Company leased 659,000 total square feet, including 339,000 square feet of renewals, 162,000 square feet of new leases on vacant space, and 158,000 square feet in development projects. |
For the year ended December 31, 2019, the Company leased 4.9 million total square feet, including 1.9 million square feet of renewals, 784,000 square feet of new leases on vacant space, and 2.2 million square feet in development projects.
• | Renewal Rates: During the quarter and year ended December 31, 2019, the Company respectively renewed 84% and 77% of total expiring square feet. |
• | Cash Rent Spreads & Average Escalations on Renewing Leases: For the quarter and year ended December 31, 2019, cash rents on renewed space decreased 8.4% and 5.8%, respectively. For the same time periods, average annual escalations on renewing leases were 2.3% and 2.4%, respectively. |
ii
• | Lease Terms: In the fourth quarter, lease terms averaged 6.1 years on renewing leases, 6.6 years on new leasing of vacant space, and 12.1 years on development leasing. For the year, lease terms averaged 4.1 years on renewing leases, 6.4 years on new leasing of vacant space, and 12.6 years on development leasing. |
Investment Activity Highlights
Development & Redevelopment Projects:
• | Development Pipeline: At January 31, 2020, the Company’s development pipeline consisted of 13 properties totaling 2.3 million square feet that were 79% leased. These projects have a total estimated cost of $683.4 million, of which $326.6 million has been incurred. |
• | Redevelopment: At December 31, 2019, one project was under redevelopment totaling 106,000 square feet that was 80% leased. The Company has invested $23.3 million of the $25.6 million anticipated total cost. |
Balance Sheet and Capital Transaction Highlights
• | As of December 31, 2019, the Company’s net debt plus preferred equity to adjusted book ratio was 37.0% and its net debt plus preferred equity to in-place adjusted EBITDA ratio was 6.1x. For the quarter and year ended December 31, 2019, the Company’s adjusted EBITDA fixed charge coverage ratio was 3.7x. |
• | As of December 31, 2019, and including the effect of interest rate swaps, the Company’s weighted average effective interest rate was 4.07%; additionally, 87.8% of the Company’s debt was subject to fixed interest rates and the consolidated debt portfolio had a weighted average maturity of 3.5 years. |
• | During the quarter ended March 31, 2019, the Company issued the remaining 1.6 million common shares under its 2017 forward equity sale agreements for net proceeds of $46.5 million. |
• | During the year, the Company sold a 90% interest in nine single-tenant data center shell properties through the Blackstone Real Estate Income Trust, Inc. (“BREIT”)-COPT joint venture formed in June 2019. The Company received a total of $310.6 million of proceeds in 2019, plus an additional $20.1 million in net proceeds associated with the joint venture entering into non-recourse mortgage loans on the properties. |
Associated Supplemental Presentation
Prior to the call, the Company will post a slide presentation to accompany management’s prepared remarks for its fourth quarter and year end 2019 conference call, the details of which are provided below. The accompanying slide presentation can be viewed on and downloaded from the ‘Latest Updates’ section of COPT’s Investors website: https://investors.copt.com/
Conference Call Information
Management will discuss fourth quarter and year end 2019 results on its conference call tomorrow at 12:00 p.m. Eastern Time, details of which are listed below:
Conference Call Date: Friday, February 7, 2020
Time: 12:00 p.m. Eastern Time
Telephone Number: (within the U.S.) 855-463-9057
Telephone Number: (outside the U.S.) 661-378-9894
Passcode: 8794749
The conference call will also be available via live webcast in the ‘Latest Updates’ section of COPT’s Investors website: https://investors.copt.com/
Replay Information
A replay of the conference call will be immediately available via webcast on the Investors website. Additionally, a telephonic replay of this call will be available beginning at 3:00 p.m. Eastern Time on Friday, February 7, through 3:00
iii
p.m. Eastern Time on Friday, February 21. To access the replay within the United States, please call 855-859-2056; to access it from outside the United States, please call 404-537-3406. In either case, use passcode 8794749.
Definitions
For definitions of certain terms used in this press release, please refer to the information furnished in the Company’s Supplemental Information Package furnished on a Form 8-K which can be found on its website (www.copt.com). Reconciliations of non-GAAP measures to the most directly comparable GAAP measures are included in the attached tables.
About COPT
COPT is a REIT that owns, manages, leases, develops and selectively acquires office and data center properties. The majority of its portfolio is in locations that support the United States Government and its contractors, most of whom are engaged in national security, defense and information technology (“IT”) related activities servicing what it believes are growing, durable, priority missions (“Defense/IT Locations”). The Company also owns a portfolio of office properties located in select urban/urban-like submarkets in the Greater Washington, DC/Baltimore region with durable Class-A office fundamentals and characteristics (“Regional Office Properties”). As of December 31, 2019, the Company derived 88% of its core portfolio annualized rental revenue from Defense/IT Locations and 12% from its Regional Office Properties. As of the same date and including 15 buildings owned through unconsolidated joint ventures, COPT’s core portfolio of 168 office and data center shell properties encompassed 19.0 million square feet and was 94.6% leased; the Company also owned one wholesale data center with a critical load of 19.25 megawatts that was 76.9% leased.
Forward-Looking Information
This press release may contain “forward-looking” statements, as defined in Section 27A of the Securities Act of 1933 and Section 21E of the Securities Exchange Act of 1934, that are based on the Company’s current expectations, estimates and projections about future events and financial trends affecting the Company. Forward-looking statements can be identified by the use of words such as “may,” “will,” “should,” “could,” “believe,” “anticipate,” “expect,” “estimate,” “plan” or other comparable terminology. Forward-looking statements are inherently subject to risks and uncertainties, many of which the Company cannot predict with accuracy and some of which the Company might not even anticipate. Although the Company believes that the expectations, estimates and projections reflected in such forward-looking statements are based on reasonable assumptions at the time made, the Company can give no assurance that these expectations, estimates and projections will be achieved. Future events and actual results may differ materially from those discussed in the forward-looking statements and the Company undertakes no obligation to update or supplement any forward-looking statements.
The areas of risk that may affect these expectations, estimates and projections include, but are not limited to, those risks described in Item 1A of the Company’s Annual Report on Form 10-K for the year ended December 31, 2018 and Quarterly Report on Form 10-Q for the quarter ended June 30, 2019.
iv
Corporate Office Properties Trust
Summary Financial Data
(unaudited)
(in thousands, except per share data)
For the Three Months Ended December 31, | For the Years Ended December 31, | ||||||||||||||
2019 | 2018 | 2019 | 2018 | ||||||||||||
Revenues | |||||||||||||||
Revenues from real estate operations | $ | 131,968 | $ | 130,825 | $ | 527,463 | $ | 517,253 | |||||||
Construction contract and other service revenues | 25,817 | 7,657 | 113,763 | 60,859 | |||||||||||
Total revenues | 157,785 | 138,482 | 641,226 | 578,112 | |||||||||||
Operating expenses | |||||||||||||||
Property operating expenses | 51,098 | 51,298 | 198,143 | 201,035 | |||||||||||
Depreciation and amortization associated with real estate operations | 32,779 | 36,219 | 137,069 | 137,116 | |||||||||||
Construction contract and other service expenses | 24,832 | 7,111 | 109,962 | 58,326 | |||||||||||
Impairment losses | 2 | 2,367 | 329 | 2,367 | |||||||||||
General and administrative expenses | 7,043 | 5,105 | 27,517 | 22,829 | |||||||||||
Leasing expenses | 2,293 | 1,976 | 7,885 | 6,071 | |||||||||||
Business development expenses and land carry costs | 1,292 | 1,425 | 4,239 | 5,840 | |||||||||||
Total operating expenses | 119,339 | 105,501 | 485,144 | 433,584 | |||||||||||
Interest expense | (16,777 | ) | (18,475 | ) | (71,052 | ) | (75,385 | ) | |||||||
Interest and other income | 1,917 | 74 | 7,894 | 4,358 | |||||||||||
Gain on sales of real estate | 20,761 | 2,367 | 105,230 | 2,340 | |||||||||||
Loss on early extinguishment of debt | — | (258 | ) | — | (258 | ) | |||||||||
Income before equity in income of unconsolidated entities and income taxes | 44,347 | 16,689 | 198,154 | 75,583 | |||||||||||
Equity in income of unconsolidated entities | 426 | 1,577 | 1,633 | 2,697 | |||||||||||
Income tax benefit | 104 | 190 | 217 | 363 | |||||||||||
Net income | 44,877 | 18,456 | 200,004 | 78,643 | |||||||||||
Net income attributable to noncontrolling interests: | |||||||||||||||
Common units in the Operating Partnership (“OP”) | (500 | ) | (210 | ) | (2,363 | ) | (1,742 | ) | |||||||
Preferred units in the OP | (77 | ) | (165 | ) | (564 | ) | (660 | ) | |||||||
Other consolidated entities | (1,515 | ) | (1,061 | ) | (5,385 | ) | (3,940 | ) | |||||||
Net income attributable to COPT common shareholders | $ | 42,785 | $ | 17,020 | $ | 191,692 | $ | 72,301 | |||||||
Earnings per share (“EPS”) computation: | |||||||||||||||
Numerator for diluted EPS: | |||||||||||||||
Net income attributable to COPT common shareholders | $ | 42,785 | $ | 17,020 | $ | 191,692 | $ | 72,301 | |||||||
Redeemable noncontrolling interests | 33 | — | 132 | — | |||||||||||
Amount allocable to share-based compensation awards | (154 | ) | (114 | ) | (623 | ) | (462 | ) | |||||||
Numerator for diluted EPS | $ | 42,664 | $ | 16,906 | $ | 191,201 | $ | 71,839 | |||||||
Denominator: | |||||||||||||||
Weighted average common shares - basic | 111,670 | 108,528 | 111,196 | 103,946 | |||||||||||
Dilutive effect of share-based compensation awards | 293 | 45 | 308 | 134 | |||||||||||
Dilutive effect of redeemable noncontrolling interests | 108 | — | 119 | — | |||||||||||
Dilutive effect of forward equity sale agreements | — | — | — | 45 | |||||||||||
Weighted average common shares - diluted | 112,071 | 108,573 | 111,623 | 104,125 | |||||||||||
Diluted EPS | $ | 0.38 | $ | 0.16 | $ | 1.71 | $ | 0.69 | |||||||
v
Corporate Office Properties Trust
Summary Financial Data
(unaudited)
(in thousands, except per share data)
For the Three Months Ended December 31, | For the Years Ended December 31, | ||||||||||||||
2019 | 2018 | 2019 | 2018 | ||||||||||||
Net income | $ | 44,877 | $ | 18,456 | $ | 200,004 | $ | 78,643 | |||||||
Real estate-related depreciation and amortization | 32,779 | 36,219 | 137,069 | 137,116 | |||||||||||
Impairment losses on real estate | 2 | 2,367 | 329 | 2,367 | |||||||||||
Gain on sales of real estate | (20,761 | ) | (2,367 | ) | (105,230 | ) | (2,340 | ) | |||||||
Depreciation and amortization on unconsolidated real estate JVs | 781 | 565 | 2,703 | 2,256 | |||||||||||
Funds from operations (“FFO”) | 57,678 | 55,240 | 234,875 | 218,042 | |||||||||||
Noncontrolling interests - preferred units in the OP | (77 | ) | (165 | ) | (564 | ) | (660 | ) | |||||||
FFO allocable to other noncontrolling interests | (1,436 | ) | (1,011 | ) | (5,024 | ) | (3,768 | ) | |||||||
Basic and diluted FFO allocable to share-based compensation awards | (243 | ) | (200 | ) | (905 | ) | (851 | ) | |||||||
Basic FFO available to common share and common unit holders (“Basic FFO”) | 55,922 | 53,864 | 228,382 | 212,763 | |||||||||||
Distributions on dilutive preferred units in the OP | 77 | — | — | — | |||||||||||
Redeemable noncontrolling interests | 33 | 331 | 132 | 1,540 | |||||||||||
Diluted FFO available to common share and common unit holders (“Diluted FFO”) | 56,032 | 54,195 | 228,514 | 214,303 | |||||||||||
Loss on early extinguishment of debt | — | 258 | — | 258 | |||||||||||
Demolition costs on redevelopment and nonrecurring improvements | 104 | 163 | 148 | 462 | |||||||||||
Executive transition costs | — | 371 | 4 | 793 | |||||||||||
Non-comparable professional and legal expenses | 195 | — | 681 | — | |||||||||||
Diluted FFO comparability adjustments allocable to share-based compensation awards | (1 | ) | (13 | ) | (3 | ) | (16 | ) | |||||||
Diluted FFO available to common share and common unit holders, as adjusted for comparability | 56,330 | 54,974 | 229,344 | 215,800 | |||||||||||
Straight line rent adjustments and lease incentive amortization | 1,386 | (46 | ) | 255 | (1,487 | ) | |||||||||
Amortization of intangibles included in net operating income | (174 | ) | 153 | (221 | ) | 893 | |||||||||
Share-based compensation, net of amounts capitalized | 1,735 | 1,601 | 6,728 | 6,193 | |||||||||||
Amortization of deferred financing costs | 541 | 550 | 2,136 | 1,954 | |||||||||||
Amortization of net debt discounts, net of amounts capitalized | 382 | 365 | 1,503 | 1,439 | |||||||||||
Accum. other comprehensive loss on derivatives amortized to expense | — | 34 | 79 | 135 | |||||||||||
Replacement capital expenditures | (19,862 | ) | (14,848 | ) | (63,789 | ) | (64,784 | ) | |||||||
Other diluted AFFO adjustments associated with real estate JVs | (68 | ) | (28 | ) | 212 | 121 | |||||||||
Diluted adjusted funds from operations available to common share and common unit holders (“Diluted AFFO”) | $ | 40,270 | $ | 42,755 | $ | 176,247 | $ | 160,264 | |||||||
Diluted FFO per share | $ | 0.49 | $ | 0.49 | $ | 2.02 | $ | 1.99 | |||||||
Diluted FFO per share, as adjusted for comparability | $ | 0.50 | $ | 0.50 | $ | 2.03 | $ | 2.01 | |||||||
Dividends/distributions per common share/unit | $ | 0.275 | $ | 0.275 | $ | 1.100 | $ | 1.100 | |||||||
vi
Corporate Office Properties Trust
Summary Financial Data
(unaudited)
(Dollars and shares in thousands, except per share data)
December 31, 2019 | December 31, 2018 | ||||||
Balance Sheet Data | |||||||
Properties, net of accumulated depreciation | $ | 3,340,886 | $ | 3,250,626 | |||
Total assets | 3,854,453 | 3,656,005 | |||||
Debt, per balance sheet | 1,831,139 | 1,823,909 | |||||
Total liabilities | 2,105,777 | 2,002,697 | |||||
Redeemable noncontrolling interest | 29,431 | 26,260 | |||||
Equity | 1,719,245 | 1,627,048 | |||||
Net debt to adjusted book | 36.8 | % | 38.9 | % | |||
Core Portfolio Data (as of period end) (1) | |||||||
Number of operating properties | 168 | 161 | |||||
Total net rentable square feet owned (in thousands) | 19,016 | 17,937 | |||||
% Occupied | 93.1 | % | 93.1 | % | |||
% Leased | 94.6 | % | 94.0 | % | |||
For the Three Months Ended December 31, | For the Years Ended December 31, | ||||||||||
2019 | 2018 | 2019 | 2018 | ||||||||
Payout ratios | |||||||||||
Diluted FFO | 55.6 | % | 56.4 | % | 54.4 | % | 55.4 | % | |||
Diluted FFO, as adjusted for comparability | 55.3 | % | 55.6 | % | 54.2 | % | 55.0 | % | |||
Diluted AFFO | 77.3 | % | 71.5 | % | 70.5 | % | 74.1 | % | |||
Adjusted EBITDA fixed charge coverage ratio | 3.7 | x | 3.6 | x | 3.7 | x | 3.6 | x | |||
Net debt to in-place adjusted EBITDA ratio (2) | 6.1 | x | 6.0 | x | N/A | N/A | |||||
Net debt plus preferred equity to in-place adjusted EBITDA ratio (3) | 6.1 | x | 6.0 | x | N/A | N/A | |||||
Reconciliation of denominators for per share measures | |||||||||||
Denominator for diluted EPS | 112,071 | 108,573 | 111,623 | 104,125 | |||||||
Weighted average common units | 1,228 | 1,345 | 1,299 | 2,468 | |||||||
Redeemable noncontrolling interests | — | 1,126 | — | 936 | |||||||
Dilutive convertible preferred units | 176 | — | — | — | |||||||
Denominator for diluted FFO per share and as adjusted for comparability | 113,475 | 111,044 | 112,922 | 107,529 | |||||||
(1) | Represents Defense/IT Locations and Regional Office properties. |
(2) | Represents net debt as of period end divided by in-place adjusted EBITDA for the period, as annualized (i.e. three month periods are multiplied by four). |
(3) | Represents net debt plus the total liquidation preference of preferred equity as of period end divided by in-place adjusted EBITDA for the period, as annualized (i.e. three month periods are multiplied by four). |
vii
Corporate Office Properties Trust
Summary Financial Data
(unaudited)
(Dollars in thousands)
For the Three Months Ended December 31, | For the Years Ended December 31, | ||||||||||||||
2019 | 2018 | 2019 | 2018 | ||||||||||||
Reconciliation of common share dividends to dividends and distributions for payout ratios | |||||||||||||||
Common share dividends - unrestricted shares and deferred shares | $ | 30,724 | $ | 30,206 | $ | 122,823 | $ | 116,285 | |||||||
Common unit distributions - unrestricted units | 337 | 367 | 1,405 | 2,498 | |||||||||||
Distributions on dilutive preferred units | $ | 77 | $ | — | $ | — | $ | — | |||||||
Dividends and distributions for payout ratios | $ | 31,138 | $ | 30,573 | $ | 124,228 | $ | 118,783 | |||||||
Reconciliation of GAAP net income to earnings before interest, income taxes, depreciation and amortization for real estate (“EBITDAre”), adjusted EBITDA and in-place adjusted EBITDA | |||||||||||||||
Net income | $ | 44,877 | $ | 18,456 | $ | 200,004 | $ | 78,643 | |||||||
Interest expense | 16,777 | 18,475 | 71,052 | 75,385 | |||||||||||
Income tax benefit | (104 | ) | (190 | ) | (217 | ) | (363 | ) | |||||||
Depreciation of furniture, fixtures and equipment | 438 | 404 | 1,834 | 1,947 | |||||||||||
Real estate-related depreciation and amortization | 32,779 | 36,219 | 137,069 | 137,116 | |||||||||||
Impairment losses on real estate | 2 | 2,367 | 329 | 2,367 | |||||||||||
Gain on sales of real estate | (20,761 | ) | (2,367 | ) | (105,230 | ) | (2,340 | ) | |||||||
Adjustments from unconsolidated real estate JVs | 1,206 | 832 | 4,065 | 3,314 | |||||||||||
EBITDAre | 75,214 | 74,196 | 308,906 | 296,069 | |||||||||||
Loss on early extinguishment of debt | — | 258 | — | 258 | |||||||||||
Net gain on other investments | (1 | ) | (449 | ) | (401 | ) | (449 | ) | |||||||
Business development expenses | 512 | 661 | 1,939 | 3,114 | |||||||||||
Non-comparable professional and legal expenses | 195 | — | 681 | — | |||||||||||
Demolition costs on redevelopment and nonrecurring improvements | 104 | 163 | 148 | 462 | |||||||||||
Executive transition costs | — | 371 | 4 | 793 | |||||||||||
Adjusted EBITDA | 76,024 | 75,200 | $ | 311,277 | $ | 300,247 | |||||||||
Proforma net operating income adjustment for property changes within period | 463 | 2,052 | |||||||||||||
Change in collectability of deferred rental revenue | 928 | — | |||||||||||||
In-place adjusted EBITDA | $ | 77,415 | $ | 77,252 | |||||||||||
Reconciliation of interest expense to the denominators for fixed charge coverage-Adjusted EBITDA | |||||||||||||||
Interest expense | $ | 16,777 | $ | 18,475 | $ | 71,052 | $ | 75,385 | |||||||
Less: Amortization of deferred financing costs | (541 | ) | (550 | ) | (2,136 | ) | (1,954 | ) | |||||||
Less: Amortization of net debt discounts, net of amounts capitalized | (382 | ) | (365 | ) | (1,503 | ) | (1,439 | ) | |||||||
Less: Accum. other comprehensive loss on derivatives amortized to expense | — | (34 | ) | (79 | ) | (135 | ) | ||||||||
COPT’s share of interest expense of unconsolidated real estate JVs, excluding deferred financing costs | 416 | 260 | 1,332 | 1,034 | |||||||||||
Scheduled principal amortization | 1,010 | 1,079 | 4,310 | 4,240 | |||||||||||
Capitalized interest | 3,467 | 1,748 | 10,786 | 5,929 | |||||||||||
Preferred unit distributions | 77 | 165 | 564 | 660 | |||||||||||
Denominator for fixed charge coverage-Adjusted EBITDA | $ | 20,824 | $ | 20,778 | $ | 84,326 | $ | 83,720 | |||||||
viii
Corporate Office Properties Trust
Summary Financial Data
(unaudited)
(Dollars in thousands)
For the Three Months Ended December 31, | For the Years Ended December 31, | ||||||||||||||
2019 | 2018 | 2019 | 2018 | ||||||||||||
Reconciliations of tenant improvements and incentives, building improvements and leasing costs for operating properties to replacement capital expenditures | |||||||||||||||
Tenant improvements and incentives | $ | 11,447 | $ | 7,876 | $ | 38,047 | $ | 37,502 | |||||||
Building improvements | 8,826 | 9,306 | 26,598 | 22,977 | |||||||||||
Leasing costs | 2,998 | 3,800 | 11,663 | 9,847 | |||||||||||
Net (exclusions from) additions to tenant improvements and incentives | (426 | ) | (2,131 | ) | (2,292 | ) | 1,577 | ||||||||
Excluded building improvements | (2,983 | ) | (3,984 | ) | (10,227 | ) | (7,073 | ) | |||||||
Excluded leasing costs | — | (19 | ) | — | (46 | ) | |||||||||
Replacement capital expenditures | $ | 19,862 | $ | 14,848 | $ | 63,789 | $ | 64,784 | |||||||
Same Properties cash NOI | $ | 73,708 | $ | 69,377 | $ | 285,944 | $ | 275,094 | |||||||
Straight line rent adjustments and lease incentive amortization | (2,838 | ) | (907 | ) | (5,004 | ) | (3,111 | ) | |||||||
Amortization of acquired above- and below-market rents | 197 | (97 | ) | 312 | (671 | ) | |||||||||
Amortization of below-market cost arrangements | (23 | ) | (56 | ) | (92 | ) | (222 | ) | |||||||
Lease termination fees, gross | 417 | 906 | 2,046 | 3,231 | |||||||||||
Tenant funded landlord assets and lease incentives | 748 | 409 | 2,177 | 3,421 | |||||||||||
Cash NOI adjustments in unconsolidated real estate JV | 34 | 57 | 181 | 254 | |||||||||||
Same Properties NOI | $ | 72,243 | $ | 69,689 | $ | 285,564 | $ | 277,996 | |||||||
December 31, 2019 | December 31, 2018 | ||||||
Reconciliation of total assets to adjusted book | |||||||
Total assets | $ | 3,854,453 | $ | 3,656,005 | |||
Accumulated depreciation | 1,007,120 | 897,903 | |||||
Accumulated amortization of real estate intangibles and deferred leasing costs | 212,547 | 204,882 | |||||
COPT’s share of liabilities of unconsolidated real estate JVs | 50,734 | 29,917 | |||||
COPT’s share of accumulated depreciation and amortization of unconsolidated real estate JVs | 8,164 | 5,446 | |||||
Less: Property - operating lease liabilities | (17,317 | ) | — | ||||
Less: Property - finance lease liabilities | (702 | ) | (660 | ) | |||
Less: Cash and cash equivalents | (14,733 | ) | (8,066 | ) | |||
Less: COPT’s share of cash of unconsolidated real estate JVs | (498 | ) | (293 | ) | |||
Adjusted book | $ | 5,099,768 | $ | 4,785,134 | |||
Reconciliation of debt outstanding to net debt and net debt plus preferred equity | |||||||
Debt outstanding (excluding net debt discounts and deferred financing costs) | $ | 1,893,057 | $ | 1,868,504 | |||
Less: Cash and cash equivalents | (14,733 | ) | (8,066 | ) | |||
Less: COPT’s share of cash of unconsolidated real estate JVs | (498 | ) | (293 | ) | |||
Net debt | $ | 1,877,826 | $ | 1,860,145 | |||
Preferred equity | 8,800 | 8,800 | |||||
Net debt plus preferred equity | $ | 1,886,626 | $ | 1,868,945 | |||
ix