Attached files
| file | filename |
|---|---|
| 8-K - 8-K - Meridian Corp | f8-k.htm |
Exhibit 99.1
| Investor Presentation February 2020 NASDAQ: MRBK ® |
| 2 Meridian Corporation Forward-Looking Statements Meridian Corporation (the “Company”) may from time to time make written or oral “forward-looking statements,” including statements contained in this presentation as well as the Company’s filings with the SEC, in its reports to stockholders and in other communications by the Company, which are made in good faith by the Company pursuant to the “safe harbor” provisions of Section 21E of the Securities Exchange Act of 1934, as amended (referred to as the “Exchange Act”). These forward-looking statements include statements with respect to the Company’s strategies, goals, beliefs, expectations, estimates, intentions, capital raising efforts, financial condition and results of operations, future performance and business. Statements preceded by, followed by, or that include the words “may,” “could,” “should,” “pro forma,” “looking forward,” “would,” “believe,” “expect,” “anticipate,” “estimate,” “intend,” “plan,” or similar expressions generally indicate a forward-looking statement. These forward-looking statements involve risks and uncertainties that are subject to change based on various important factors (some of which, in whole or in part, are beyond Meridian Corporation’s control). Numerous competitive, economic, regulatory, legal and technological factors, among others, could cause the Company’s financial performance to differ materially from the goals, plans, objectives, intentions and expectations expressed in such forward-looking statements. The Company cautions that the foregoing factors are not exclusive, and neither such factors nor any such forward-looking statement takes into account the impact of any future events. All forward-looking statements and information set forth herein are based on management’s current beliefs and assumptions as of the date hereof and speak only as of the date they are made. For a more complete discussion of the assumptions, risks and uncertainties related to our business, you are encouraged to review the Company’s filings with the Securities and Exchange Commission (including our Annual Report on Form 10-K for the year ended December 31, 2018) and, for periods prior to the completion of the holding company reorganization, Meridian Bank’s filings with the FDIC, including Meridian Bank’s Annual Report on Form 10-K for the year ended December 31, 2017, subsequently filed quarterly reports on Form 10-Q and current reports on Form 8-K that update or provide information in addition to the information included in the Form 10-K and Form 10-Q filings, if any. The Company does not undertake to update any forward-looking statement whether written or oral, that may be made from time to time by the Company or by or on behalf of Meridian Bank. Throughout this document, references to “we,” “us,” or “our” refer to the Company, Meridian Bank, its wholly owned Pennsylvania – chartered commercial bank (“the “Bank”) and its other consolidated subsidiaries. |
| 3 Meridian Corporation Company Highlights Demonstrated organic growth engine in diversified loan segments, capitalizing on market disruption in the Delaware Valley tri-state market Financial services business model with significant noninterest income streams in Meridian Mortgage, SBA Lending and Meridian Wealth Partners Significant market opportunity in the 6-county greater Philadelphia metropolitan market driven by a "branch-lite," technology-focused and high-touch banking strategy Strong management team with long-tenured, in-market experience Existing corporate infrastructure and key personnel in place to support future growth in the Bank and to maximize profitability from additional capital inflow Pristine asset quality Attractive economic footprint, providing opportunities to grow non-interest bearing deposits Low commercial real estate (CRE) concentration allows for significant capacity for growth ® ® |
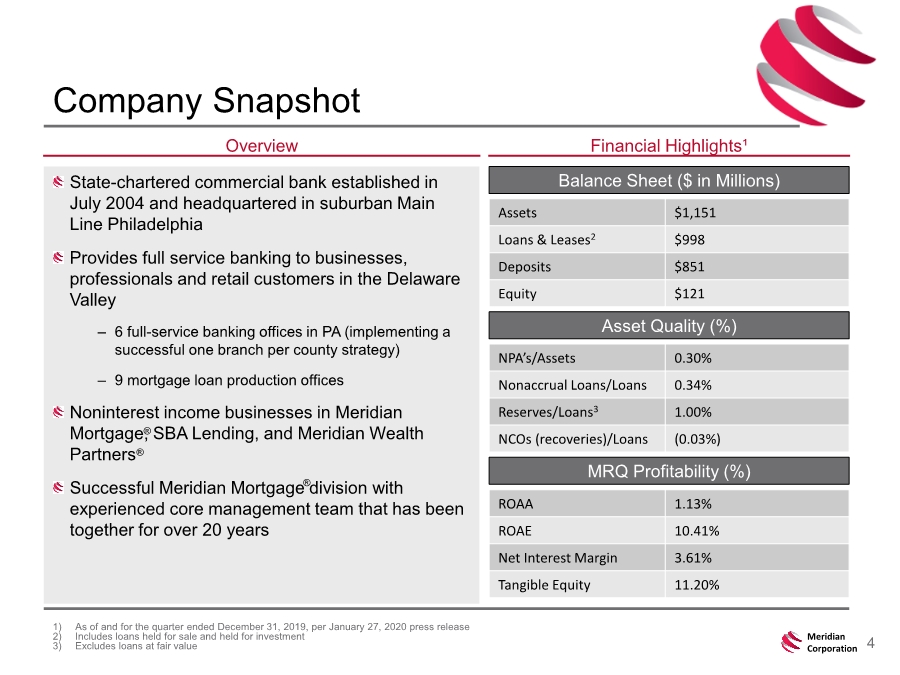
| 4 Meridian Corporation Company Snapshot 1) As of and for the quarter ended December 31, 2019, per January 27, 2020 press release 2) Includes loans held for sale and held for investment 3) Excludes loans at fair value Overview Financial Highlights¹ Balance Sheet ($ in Millions) Asset Quality (%) MRQ Profitability (%) Assets $1,151 Loans & Leases2 $998 Deposits $851 Equity $121 NPA’s/Assets 0.30% Nonaccrual Loans/Loans 0.34% Reserves/Loans3 1.00% NCOs (recoveries)/Loans (0.03%) ROAA 1.13% ROAE 10.41% Net Interest Margin 3.61% Tangible Equity 11.20% State-chartered commercial bank established in July 2004 and headquartered in suburban Main Line Philadelphia Provides full service banking to businesses, professionals and retail customers in the Delaware Valley – 6 full-service banking offices in PA (implementing a successful one branch per county strategy) – 9 mortgage loan production offices Noninterest income businesses in Meridian Mortgage, SBA Lending, and Meridian Wealth Partners Successful Meridian Mortgage division with experienced core management team that has been together for over 20 years ® ® ® |
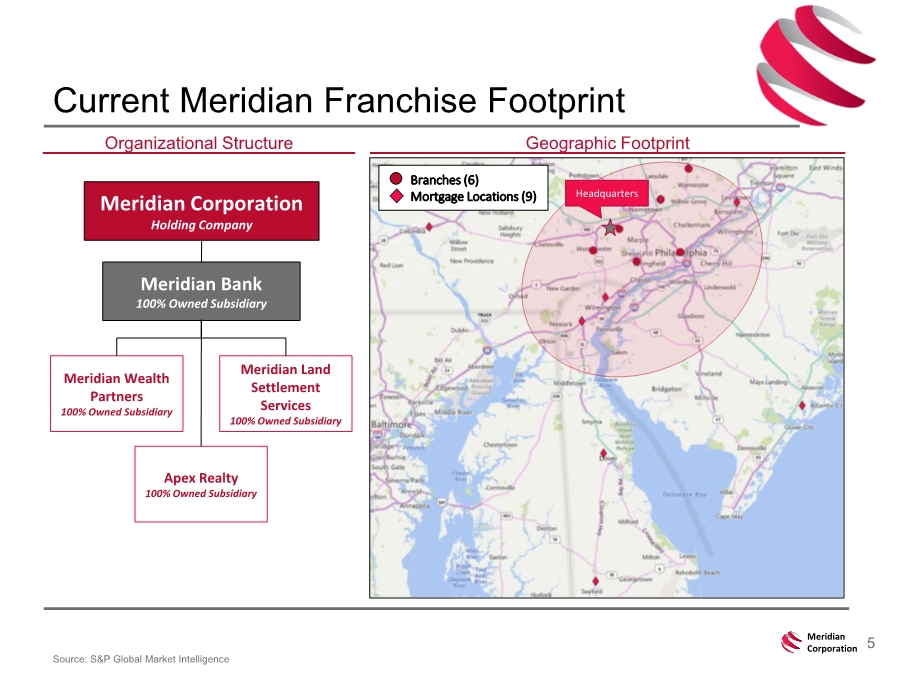
| 5 Meridian Corporation Current Meridian Franchise Footprint Source: S&P Global Market Intelligence Geographic Footprint Meridian Corporation Holding Company Meridian Bank 100% Owned Subsidiary Organizational Structure Meridian Wealth Partners 100% Owned Subsidiary Apex Realty 100% Owned Subsidiary Meridian Land Settlement Services 100% Owned Subsidiary Headquarters Branches (6) Mortgage Locations (9) |
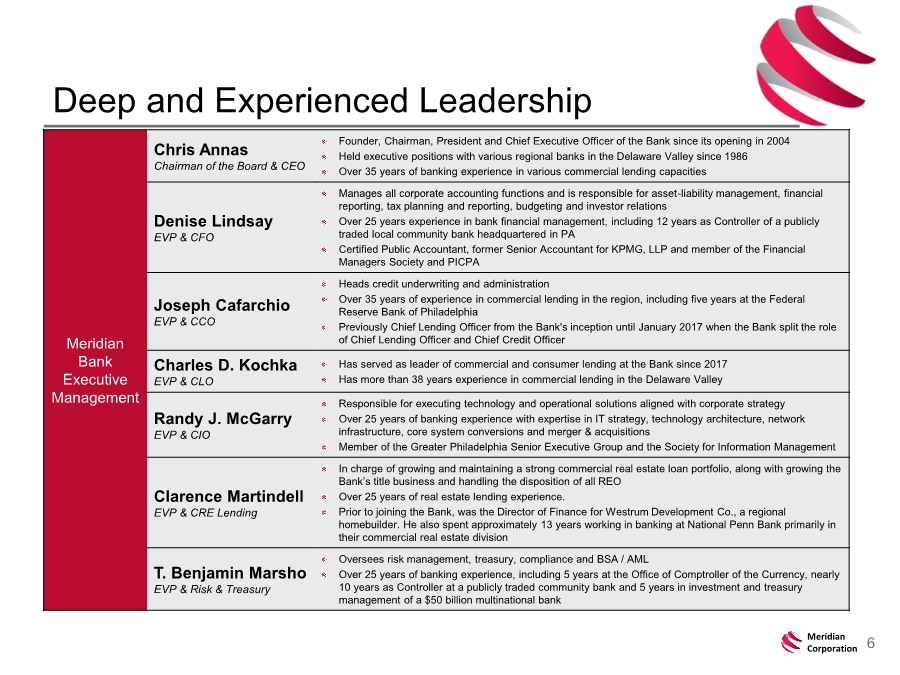
| 6 Meridian Corporation Deep and Experienced Leadership Meridian Bank Executive Management Chris Annas Chairman of the Board & CEO Founder, Chairman, President and Chief Executive Officer of the Bank since its opening in 2004 Held executive positions with various regional banks in the Delaware Valley since 1986 Over 35 years of banking experience in various commercial lending capacities Denise Lindsay EVP & CFO Manages all corporate accounting functions and is responsible for asset-liability management, financial reporting, tax planning and reporting, budgeting and investor relations Over 25 years experience in bank financial management, including 12 years as Controller of a publicly traded local community bank headquartered in PA Certified Public Accountant, former Senior Accountant for KPMG, LLP and member of the Financial Managers Society and PICPA Joseph Cafarchio EVP & CCO Heads credit underwriting and administration Over 35 years of experience in commercial lending in the region, including five years at the Federal Reserve Bank of Philadelphia Previously Chief Lending Officer from the Bank's inception until January 2017 when the Bank split the role of Chief Lending Officer and Chief Credit Officer Charles D. Kochka EVP & CLO Has served as leader of commercial and consumer lending at the Bank since 2017 Has more than 38 years experience in commercial lending in the Delaware Valley Randy J. McGarry EVP & CIO Responsible for executing technology and operational solutions aligned with corporate strategy Over 25 years of banking experience with expertise in IT strategy, technology architecture, network infrastructure, core system conversions and merger & acquisitions Member of the Greater Philadelphia Senior Executive Group and the Society for Information Management Clarence Martindell EVP & CRE Lending In charge of growing and maintaining a strong commercial real estate loan portfolio, along with growing the Bank’s title business and handling the disposition of all REO Over 25 years of real estate lending experience. Prior to joining the Bank, was the Director of Finance for Westrum Development Co., a regional homebuilder. He also spent approximately 13 years working in banking at National Penn Bank primarily in their commercial real estate division T. Benjamin Marsho EVP & Risk & Treasury Oversees risk management, treasury, compliance and BSA / AML Over 25 years of banking experience, including 5 years at the Office of Comptroller of the Currency, nearly 10 years as Controller at a publicly traded community bank and 5 years in investment and treasury management of a $50 billion multinational bank |
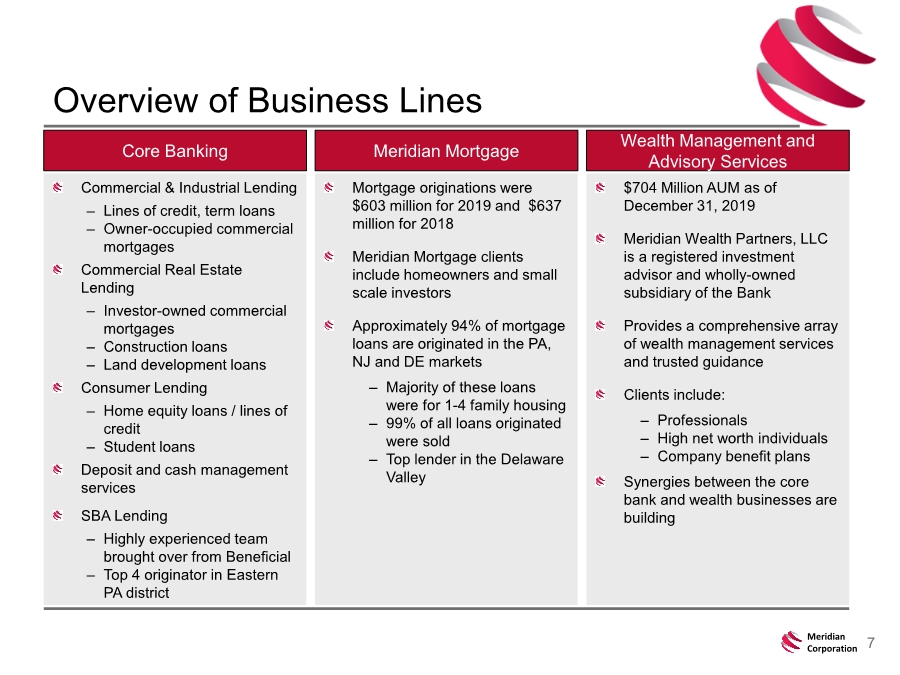
| 7 Meridian Corporation Overview of Business Lines Commercial & Industrial Lending – Lines of credit, term loans – Owner-occupied commercial mortgages Commercial Real Estate Lending – Investor-owned commercial mortgages – Construction loans – Land development loans Consumer Lending – Home equity loans / lines of credit – Student loans Deposit and cash management services SBA Lending – Highly experienced team brought over from Beneficial – Top 4 originator in Eastern PA district Core Banking Meridian Mortgage Wealth Management and Advisory Services Mortgage originations were $603 million for 2019 and $637 million for 2018 Meridian Mortgage clients include homeowners and small scale investors Approximately 94% of mortgage loans are originated in the PA, NJ and DE markets – Majority of these loans were for 1-4 family housing – 99% of all loans originated were sold – Top lender in the Delaware Valley $704 Million AUM as of December 31, 2019 Meridian Wealth Partners, LLC is a registered investment advisor and wholly-owned subsidiary of the Bank Provides a comprehensive array of wealth management services and trusted guidance Clients include: – Professionals – High net worth individuals – Company benefit plans Synergies between the core bank and wealth businesses are building |
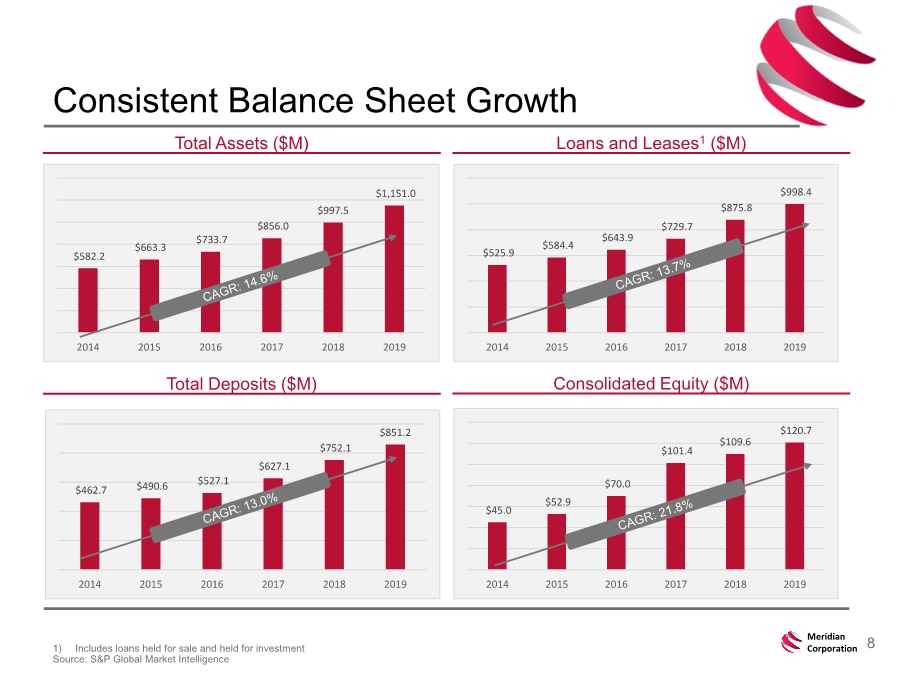
| 8 Meridian Corporation $45.0 $52.9 $70.0 $101.4 $109.6 $120.7 2014 2015 2016 2017 2018 2019 $462.7 $490.6 $527.1 $627.1 $752.1 $851.2 2014 2015 2016 2017 2018 2019 $525.9 $584.4 $643.9 $729.7 $875.8 $998.4 2014 2015 2016 2017 2018 2019 $582.2 $663.3 $733.7 $856.0 $997.5 $1,151.0 2014 2015 2016 2017 2018 2019 Consistent Balance Sheet Growth 1) Includes loans held for sale and held for investment Source: S&P Global Market Intelligence Total Assets ($M) Loans and Leases1 ($M) Total Deposits ($M) Consolidated Equity ($M) |
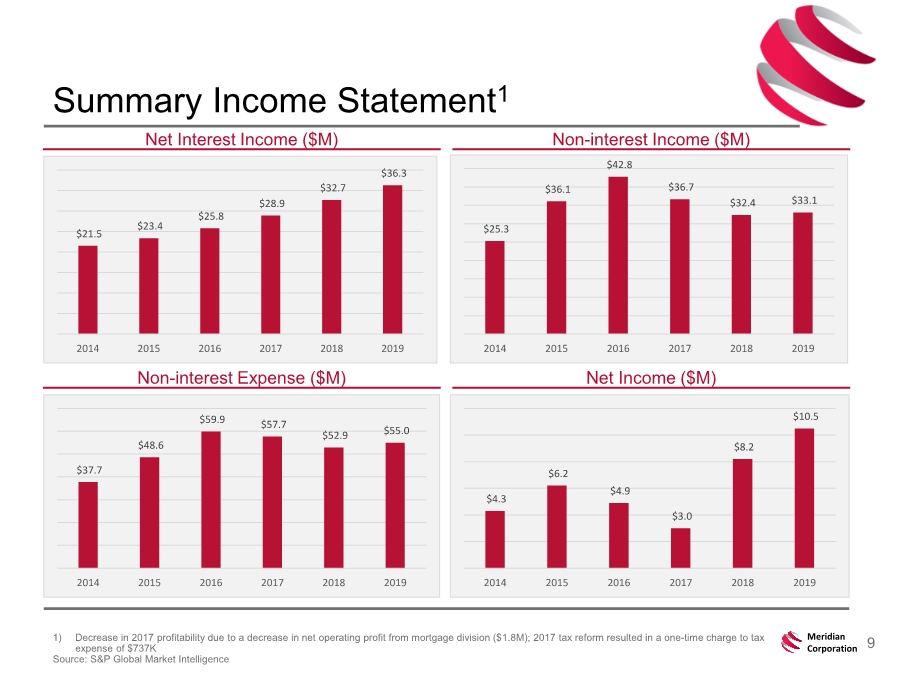
| 9 Meridian Corporation Summary Income Statement1 1) Decrease in 2017 profitability due to a decrease in net operating profit from mortgage division ($1.8M); 2017 tax reform resulted in a one-time charge to tax expense of $737K Source: S&P Global Market Intelligence Net Interest Income ($M) Non-interest Income ($M) Non-interest Expense ($M) Net Income ($M) $21.5 $23.4 $25.8 $28.9 $32.7 $36.3 2014 2015 2016 2017 2018 2019 $25.3 $36.1 $42.8 $36.7 $32.4 $33.1 2014 2015 2016 2017 2018 2019 $37.7 $48.6 $59.9 $57.7 $52.9 $55.0 2014 2015 2016 2017 2018 2019 $4.3 $6.2 $4.9 $3.0 $8.2 $10.5 2014 2015 2016 2017 2018 2019 |
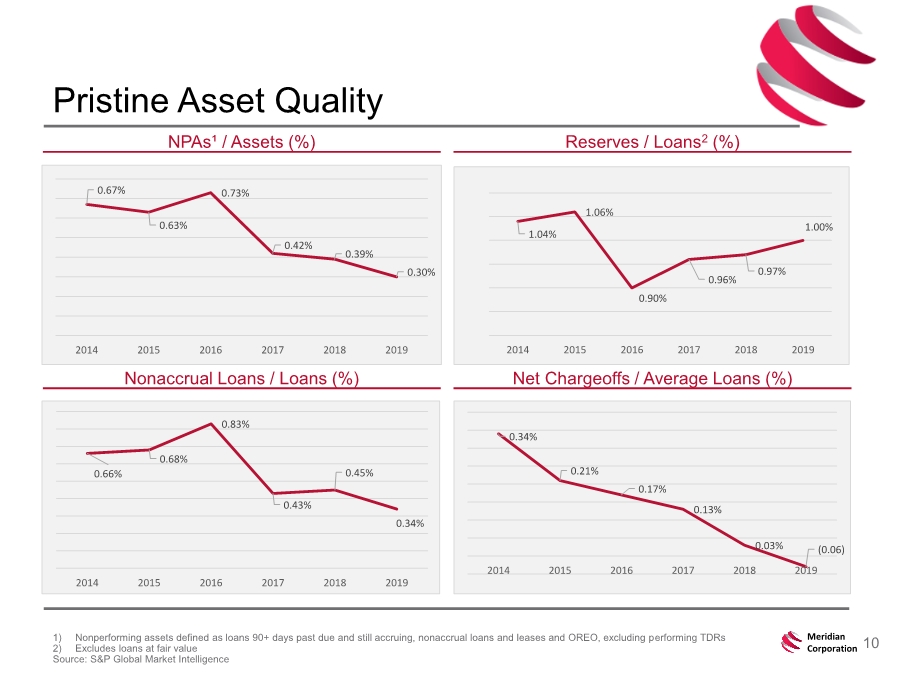
| 10 Meridian Corporation Pristine Asset Quality 1) Nonperforming assets defined as loans 90+ days past due and still accruing, nonaccrual loans and leases and OREO, excluding performing TDRs 2) Excludes loans at fair value Source: S&P Global Market Intelligence NPAs¹ / Assets (%) Reserves / Loans2 (%) Nonaccrual Loans / Loans (%) Net Chargeoffs / Average Loans (%) 0.67% 0.63% 0.73% 0.42% 0.39% 0.30% 2014 2015 2016 2017 2018 2019 1.04% 1.06% 0.90% 0.96% 0.97% 1.00% 2014 2015 2016 2017 2018 2019 0.66% 0.68% 0.83% 0.43% 0.45% 0.34% 2014 2015 2016 2017 2018 2019 0.34% 0.21% 0.17% 0.13% 0.03% (0.06) 2014 2015 2016 2017 2018 2019 |
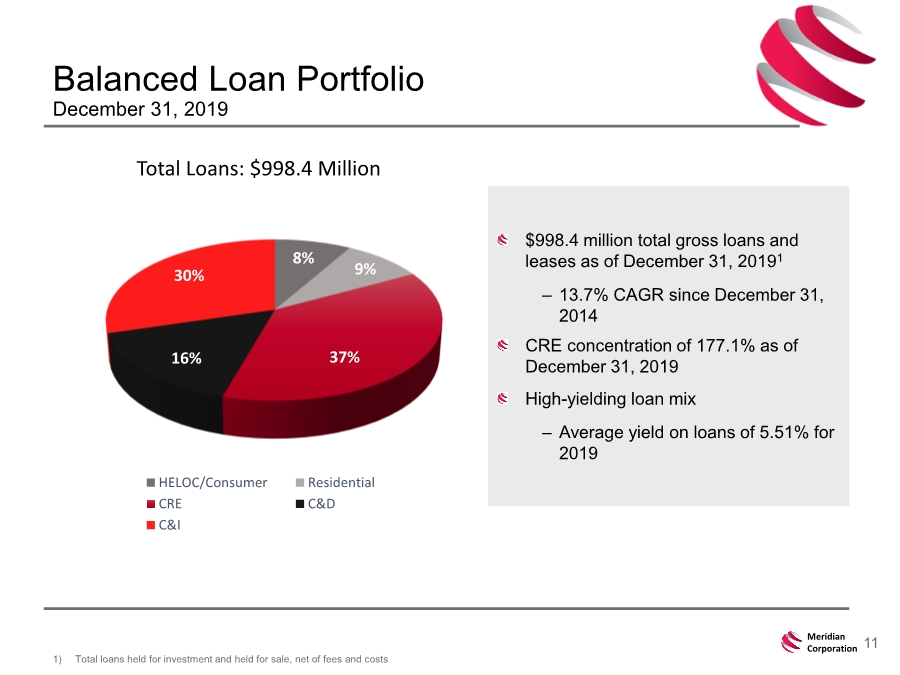
| 11 Meridian Corporation $998.4 million total gross loans and leases as of December 31, 20191 – 13.7% CAGR since December 31, 2014 CRE concentration of 177.1% as of December 31, 2019 High-yielding loan mix – Average yield on loans of 5.51% for 2019 Balanced Loan Portfolio December 31, 2019 1) Total loans held for investment and held for sale, net of fees and costs Total Loans: $998.4 Million 8% 9% 37% 16% 30% HELOC/Consumer Residential CRE C&D C&I |
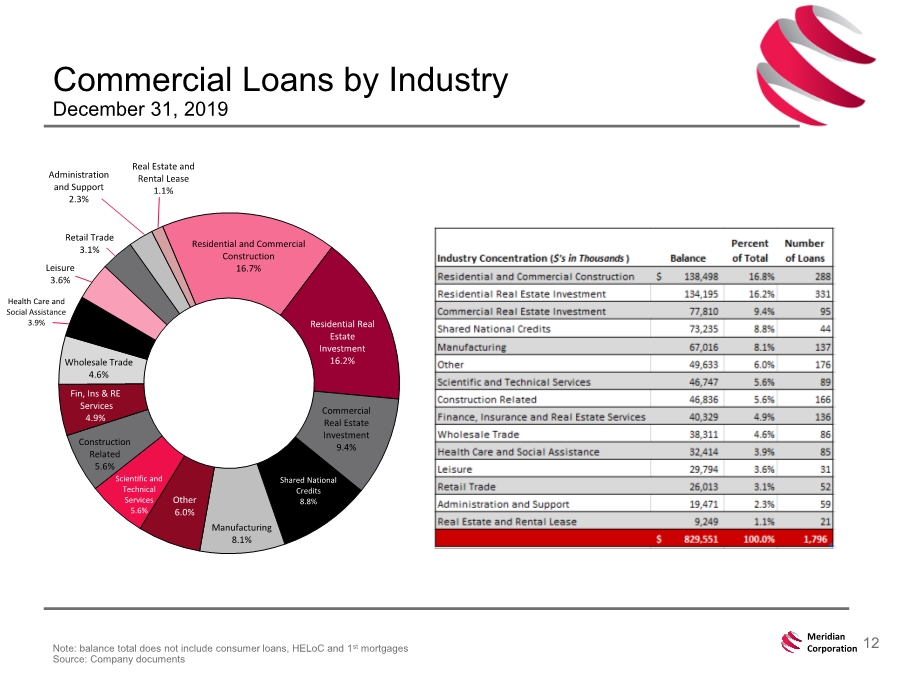
| 12 Meridian Corporation Commercial Loans by Industry December 31, 2019 Note: balance total does not include consumer loans, HELoC and 1st mortgages Source: Company documents Residential and Commercial Construction 16.7% Residential Real Estate Investment 16.2% Commercial Real Estate Investment 9.4% Shared National Credits 8.8% Manufacturing 8.1% Other 6.0% Scientific and Technical Services 5.6% Construction Related 5.6% Fin, Ins & RE Services 4.9% Wholesale Trade 4.6% Health Care and Social Assistance 3.9% Leisure 3.6% Retail Trade 3.1% Administration and Support 2.3% Real Estate and Rental Lease 1.1% |
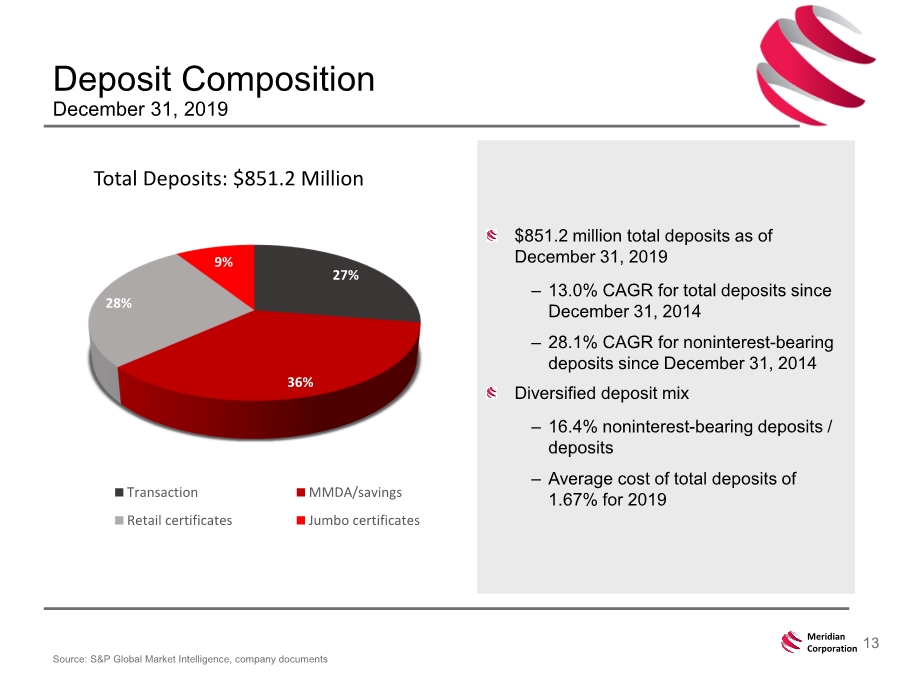
| 13 Meridian Corporation $851.2 million total deposits as of December 31, 2019 – 13.0% CAGR for total deposits since December 31, 2014 – 28.1% CAGR for noninterest-bearing deposits since December 31, 2014 Diversified deposit mix – 16.4% noninterest-bearing deposits / deposits – Average cost of total deposits of 1.67% for 2019 Deposit Composition December 31, 2019 Source: S&P Global Market Intelligence, company documents Total Deposits: $851.2 Million 27% 36% 28% 9% Transaction MMDA/savings Retail certificates Jumbo certificates |
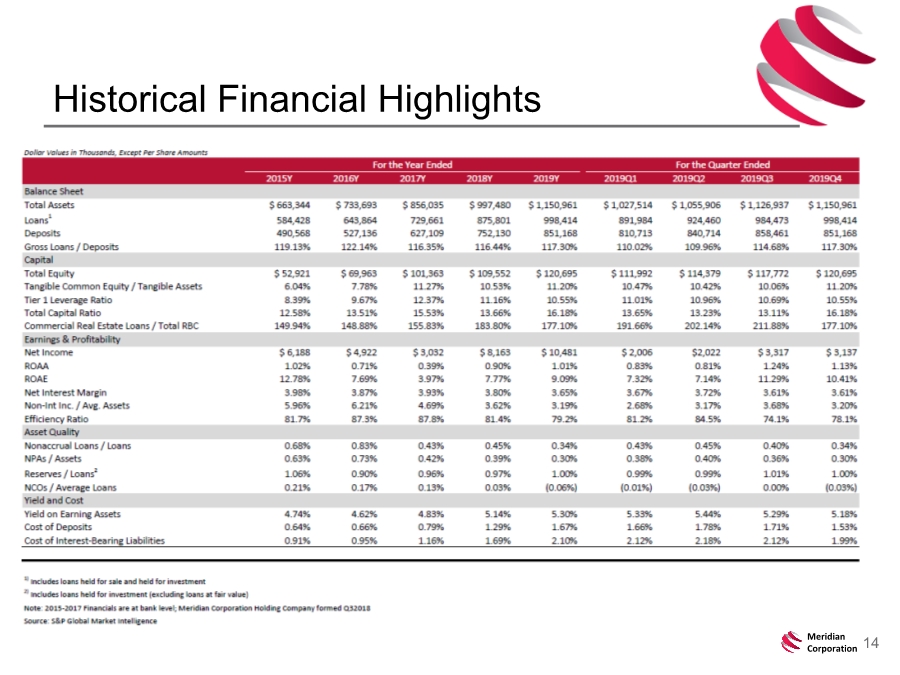
| 14 Meridian Corporation Historical Financial Highlights |