Attached files
| file | filename |
|---|---|
| 8-K - 8-K - AZZ INC | investorpresentationfo.htm |

AZZ Inc. Investor Presentation February, 2020

FEBRUARY 2020 INVESTOR PRESENTATION Forward Looking Statement Disclosure Certain statements herein about our expectations of future events or results constitute forward-looking statements for purposes of the safe harbor provisions of The Private Securities Litigation Reform Act of 1995. You can identify forward- looking statements by terminology such as, “may,” “should,” “expects,” “plans,” “anticipates,” “believes,” “estimates,” “predicts,” “potential,” “continue,” or the negative of these terms or other comparable terminology. Such forward-looking statements are based on currently available competitive, financial and economic data and management’s views and assumptions regarding future events. Such forward-looking statements are inherently uncertain, and investors must recognize that actual results may differ from those expressed or implied in the forward-looking statements. This presentation may contain forward-looking statements that involve risks and uncertainties including, but not limited to, changes in customer demand and response to products and services offered by AZZ, including demand by the power generation markets, electrical transmission and distribution markets, the industrial markets, and the metal coatings markets; prices and raw material cost, including zinc and natural gas which are used in the hot dip galvanizing process; changes in the political stability and economic conditions of the various markets that AZZ serves, foreign and domestic, customer requested delays of shipments, acquisition opportunities, currency exchange rates, adequacy of financing, and availability of experienced management and employees to implement AZZ’s growth strategies. AZZ has provided additional information regarding risks associated with the business in AZZ’s Annual Report on Form 10-K for the fiscal year ended February 28, 2019 and other filings with the SEC, available for viewing on AZZ’s website at www.azz.com and on the SEC’s website at www.sec.gov. You are urged to consider these factors carefully in evaluating the forward-looking statements herein and are cautioned not to place undue reliance on such forward-looking statements, which are qualified in their entirety by this cautionary statement. These statements are based on information as of the date hereof and AZZ assumes no obligation to update any forward-looking statements, whether as a result of new information, future events, or otherwise. 2

FEBRUARY 2020 INVESTOR PRESENTATION About AZZ We are a global provider of galvanizing and metal coating services, welding Overview solutions, specialty electrical equipment and highly engineered services to the power generation, transmission, distribution, refining and industrial markets. We envision a world where AZZ’s innovation, quality and service minded people Vision enable a safer and more sustainable infrastructure while providing superior returns for shareholders 3

FEBRUARY 2020 INVESTOR PRESENTATION AZZ at a Glance As of February 28, 2019 FY2019 Mix By Sales By Operating Income Company Profile (in millions) (in millions) Headquarters Ft. Worth, Texas $31.3 27% $486.8 $440.3 FY2019 Sales 53% 47% $927.1 Million $83.6 73% Market Cap $1.13 Billion Metal Coatings Energy Metal Coatings Energy Facilities 69 EBITDA FY 2019 Operating Margin FY 2019 $ millions % of Sales $ millions % of Sales Total 3,884 Employees Metal Coatings $114.6 26.0% Metal Coatings $83.6 19.0% Energy $49.8 10.2% Energy $31.3 6.4% 4

FEBRUARY 2020 INVESTOR PRESENTATION Solutions Supporting Infrastructure Growth and Corrosion Protection Metal Coatings Industrial Electrical • Hot Dip Galvanizing • Coke drum, boiler, waterwall, • Factory fabricated electrical • Spin Galvanizing superheater, reheater, economizer, enclosures, panels and skids (e- digester, pressure vessel, nozzle, and houses, battery storage, solar skids). • Continuous Galvanized Rebar pipe maintenance solutions through the (“Galvabar”) • Manufacturer of Medium Voltage use of highly engineered, innovative, Switchgear and Bus Duct • Applied Coatings: anodizing, electro- automated weld overlay and cladding • High Voltage SF6 Bus Duct deposition (e-coat), plating, powder technologies. coat, liquid, and duplex coating • Third party supplier of equipment to the • Hazardous Duty Lighting Solutions • Value-added services: Digital nuclear industry. Reverse engineering, • Oil Country Tubular Goods (OCTG) Galvanizing System (“DGS”), qualification, dedication, transportation, and storage repair/overhaul of electrical and mechanical equipment provided. Extending the life, value and aesthetic Extending the life and value of critical Manufacturing electrical products properties of fabricated metal products assets in refining, nuclear, waste to essential for the safe transmission and energy, and industrial markets distribution of power 5

FEBRUARY 2020 INVESTOR PRESENTATION Strategic Direction Market Position Priorities • We operate the largest integrated network of • Organic growth and incremental acquisitions in Metal Coatings hot-dip galvanizing plants (41) as well as powder hot-dip galvanizing; platform expansion in coating, anodizing, plating plants (8) located surface technologies; and rebar market throughout North America. penetration for Galvabar. Margin profile of 25- 30% EBITDA. • Our Electrical Products group is a market • Organic growth in enclosures and switchgear leading manufacturer of e-houses, switchgear, while driving margin improvement through medium and high voltage bus duct, lighting and improved operations. Bus businesses divested tubular products for markets globally. or restructured. International risk mitigated and no longer subject to China trade issues. Margin Energy profile of >12% EBITDA • Our Industrial Services group is the largest • International expansion and improving provider of highly automated weld overlay profitability by acquiring adjacent services to solutions to refining, waste-to-energy, and boiler leverage IPG overhead structure. Margin Profile markets as well as niche high-end applications of >15% EBITDA. globally. 6

FEBRUARY 2020 INVESTOR PRESENTATION Secular Growth Trends Renewable Energy Modular Industrial and Energy Storage Solutions Secular Growth Trends Grid Hardening and Resilient Sustainable Metal Energy Transmission and Coatings Solutions Distribution 7

FEBRUARY 2020 INVESTOR PRESENTATION Galvanizing Locations 8

FEBRUARY 2020 INVESTOR PRESENTATION Select Financial Information Net Sales Net Income (in $millions) (in $millions) 76 1,019 68 927 61 889 864 810 51 45 FY2016 FY2017 FY2018 FY2019 LTM Q3 2020 FY2016 FY2017 FY2018 FY2019 LTM Q32020 Backlog Cash Provided by Operations (in $millions) (in $millions) 333 311 318 144 140 265 275 111 115 79 FY2016 FY2017 FY2018 FY2019 LTM Q3 FY2020 FY2016 FY2017 FY2018 FY2019 LTM Q3 FY2020 9

FEBRUARY 2020 INVESTOR PRESENTATION Strategic Direction • Continue to grow Metal Coatings organically and with a robust acquisition program, while targeting 21-23% Operating Margins • Focus on operating excellence and providing outstanding customer service • Assumes continued inorganic growth in Surface Technologies • Energy will focus on operational excellence and profitable growth in its core businesses while divesting, exiting the non-core • Specialty welding will grow through international expansion, offering the best customized welding technology, and reducing dependence on the nuclear market space • Electrical businesses will focus on improving profitability and focus more on domestic market growth 10

FEBRUARY 2020 INVESTOR PRESENTATION Capital Allocation Focused on Growth In millions FY 2020 Q3YTD Capital Deployment • New business and product lines $60.6 Capital • Systems and technology Expenditures • Strategic fit Growth • Accretive within the first year Acquisitions • North American market focus $22.5 Share • No share repurchases to date Repurchases $13.4 Dividends • YTD payout ratio 22.8% Shareholder Shareholder Return Capital Expenditures Acquisitions Share Repurchases Dividends 11

FEBRUARY 2020 INVESTOR PRESENTATION Capital Allocation Focused on Growth In millions FY2015 - FY2019 Capital Deployment • New business and product lines • Systems and technology $165.9 Capital Expenditures $147.6 • Strategic fit Growth • Accretive within the first year Acquisitions • North American market focus $82.4 Share • Currently active program Repurchases $12.8 Dividends Shareholder Shareholder Return Capital Expenditures Acquisitions Share Repurchases Dividends 12
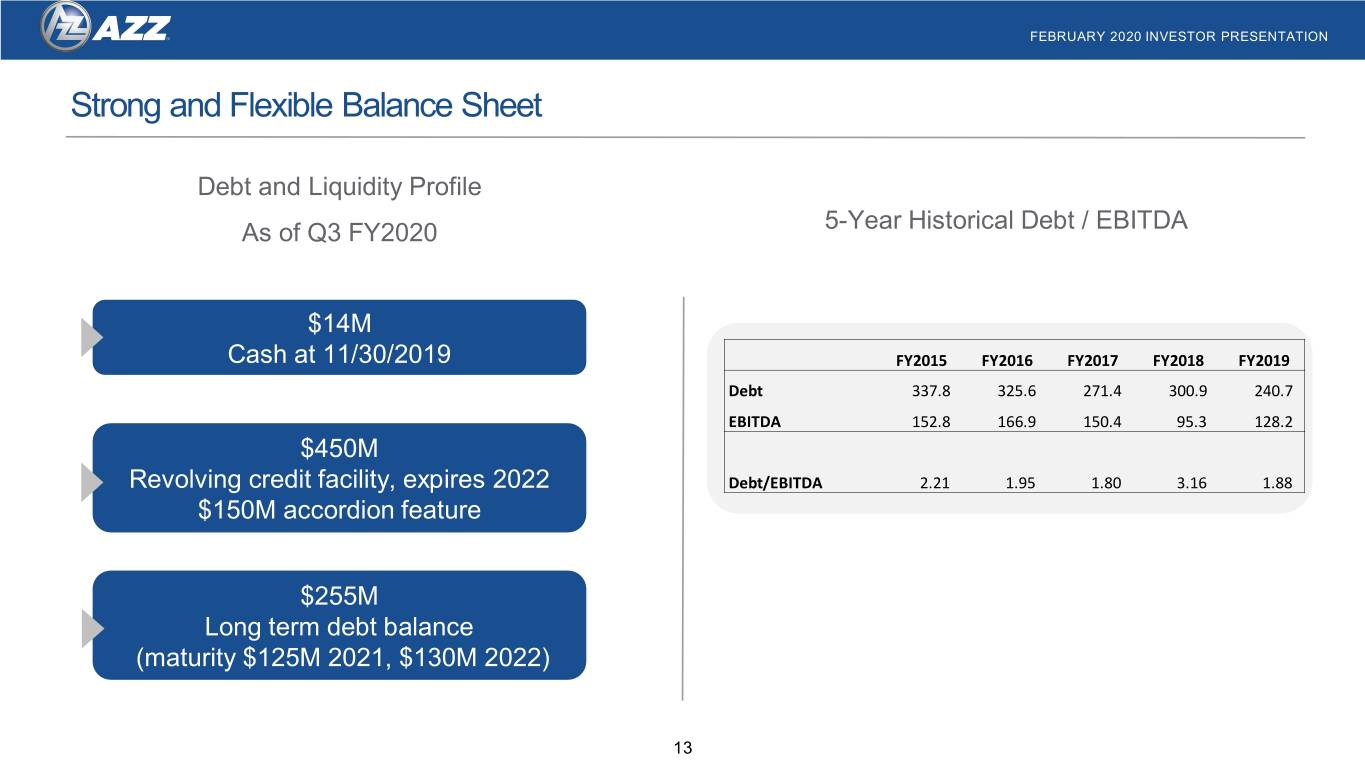
FEBRUARY 2020 INVESTOR PRESENTATION Strong and Flexible Balance Sheet Debt and Liquidity Profile As of Q3 FY2020 5-Year Historical Debt / EBITDA $14M Cash at 11/30/2019 FY2015 FY2016 FY2017 FY2018 FY2019 Debt 337.8 325.6 271.4 300.9 240.7 EBITDA 152.8 166.9 150.4 95.3 128.2 $450M Revolving credit facility, expires 2022 Debt/EBITDA 2.21 1.95 1.80 3.16 1.88 $150M accordion feature $255M Long term debt balance (maturity $125M 2021, $130M 2022) 13

FEBRUARY 2020 INVESTOR PRESENTATION FY 2020 Financial Guidance and Key Assumptions Guidance based on January 9, 2020 affirmation Key Assumptions: In millions , except for EPS Current Metal Coatings: Continued operational execution No significant winter weather disruptions Revenue $1,020-$1,060 Energy Electrical Platform operational execution Earnings Per Share $2.60-$2.90 No China trade disruptions 14

FEBRUARY 2020 INVESTOR PRESENTATION Why AZZ? √ Market leader focused on growth, margin improvement and customer satisfaction √ 31 consecutive years of profitable operations √ Management team has reshaped the organization √ Consistently strong cash generation √ Sensible capital allocation and ROIC 15

FEBRUARY 2020 INVESTOR PRESENTATION 21 Acquisitions since 1990 $759 mil Capital Deployed since 2010 U.S. Galvanizing LLC Olsen Enterprises K2 Partners NuZinc Preferred Industries North American Galvanizing Enhanced Powder Coating Powergrid Electronics Tennessee Galvanizing 2012- 1990’s 2013 2016 2018 2010 2015 2017 2019 Calvert Power Electronics Rogers Brothers Rig-a-lite Galvcast Galvanizing Central Electric GE Galvanizing Atkinson Galvan Metal CGIT Nuclear Logistics Welding Solutions 16

FEBRUARY 2020 INVESTOR PRESENTATION We are Well Positioned for Future Growth • AZZ’s foundation is solid • Our culture is strong Strategic Acquisitions • Our Model is proven and scalable • We have an excellent set of niche, Cash Flow Operational differentiated businesses Generation Excellence • Our historical success provides the framework for future growth • We generate tremendous cash flow and have a Market New Product strong balance sheet Expansion Development • We are well positioned to significantly grow EPS over the next five years 17

Appendix 18

FEBRUARY 2020 INVESTOR PRESENTATION 3rd Quarter Segment Revenue and Market Drivers Total 3Q FY2020 Revenue: $291.1 million Metal Coatings Energy Segment Segment $129.2 $161.9 +20.2% vs. prior year +22.7% vs. prior year Market Drivers • Strong solar and petrochemical market activity • Strong North American turnaround season • Growing contribution from Surface Technologies • Shipped China HV Bus; Booked large domestic order • Maintaining price/value realization • Domestic nuclear market remains stable at a low level 19

FEBRUARY 2020 INVESTOR PRESENTATION 3rd Quarter Segment Results – Metal Coatings In millions $ except percentages Revenue Operating Income Operating Margin Key Statistics +20.2% +48.8% +410 bps $129.2 $107.5 FY2019 Revenue $107.5 $27.3 21.1% Organic $13.1 17.0% $18.3 Acquisitions $8.6 FY2020 Revenue $129.2 FY2019 FY2020 FY2019 FY2020 FY2019 FY2020 Segment Summary: • Record quarterly revenue driven by improved demand within solar and petrochemical markets. • Sales traction within our new business units – Surface Technologies and Galvabar • Lower zinc costs in Galvanizing offsetting higher wage expense • Improved labor productivity and operational efficiency driven by Digital Galvanizing System (DGS) • Operating Margins of 21.1%, compared to 17.0% for the same quarter last year • EBITDA of $34.9 million versus $25.5 million in same quarter last year 20

FEBRUARY 2020 INVESTOR PRESENTATION 3rd Quarter Segment Results – Energy In millions $ except percentages Revenue Operating Income Operating Margin Key Statistics +22.7% +51.1% +210 bps 10.8% $161.9 $17.4 FY19 Revenue $132.0 $132.0 8.7% FY19 Book to Ship 0.79 to 1 $11.5 FY20 Revenue $161.9 FY20 Book to Ship 0.83 to 1 FY2019 FY2020 FY2019 FY2020 FY2019 FY2020 Segment Summary: • Strong refinery turnaround business in 3Q FY2020 • Recognizing revenue and shipping Chinese orders; backlog down from prior year due to large China shipments • Improved Electrical operational execution and customer service • Operating Margin of 10.8% in Q3 FY2020, versus 8.7% same quarter last year • EBITDA of $22.5 million versus $15.9 million in same quarter last year 21

FEBRUARY 2020 INVESTOR PRESENTATION YTD Segment Results In $ millions except percentages Revenue Operating Income Operating Margin +11.0% +30.1% +340 bps $376.2 $85.3 $339.0 22.7% $65.6 19.3% Metal Coatings FY2019 FY2020 FY2019 FY2020 FY2019 FY2020 Revenue Operating Income Operating Margin +14.2% +32.9% +110 bps $440.3 $34.2 7.8% $385.5 6.7% $25.8 Energy FY2019 FY2020 FY2019 FY2020 FY2019 FY2020 6
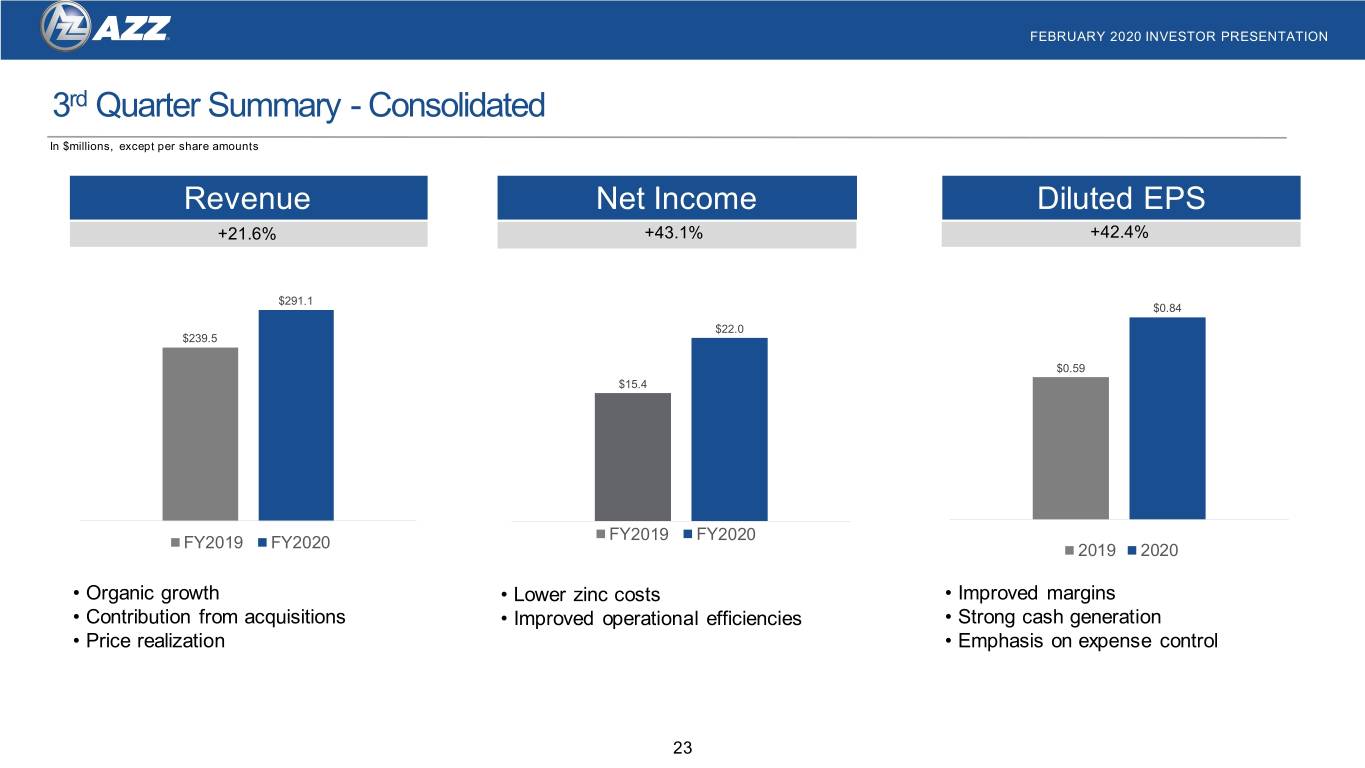
FEBRUARY 2020 INVESTOR PRESENTATION 3rd Quarter Summary - Consolidated In $millions, except per share amounts Revenue Net Income Diluted EPS +21.6% +43.1% +42.4% $291.1 $0.84 $22.0 $239.5 $0.59 $15.4 FY2019 FY2020 FY2019 FY2020 2019 2020 • Organic growth • Lower zinc costs • Improved margins • Contribution from acquisitions • Improved operational efficiencies • Strong cash generation • Price realization • Emphasis on expense control 23

FEBRUARY 2020 INVESTOR PRESENTATION Q3 FY2020 Consolidated Results In millions, except for EPS and percentages Q3 FY 20 Q3 FY 19 % Change Revenue $291.1 $239.5 21.6% Gross Profit $67.3 $49.8 35.3% Gross Margin 23.1% 20.8% Operating Profit $33.4 $22.8 46.8% Operating Margin 11.5% 9.5% EBITDA $46.8 $34.8 34.4% Net Income (loss) $22.0 $15.4 43.1% Diluted EPS $0.84 $0.59 42.4% Diluted Shares Outstanding 26.263 26.151 0.4% 24
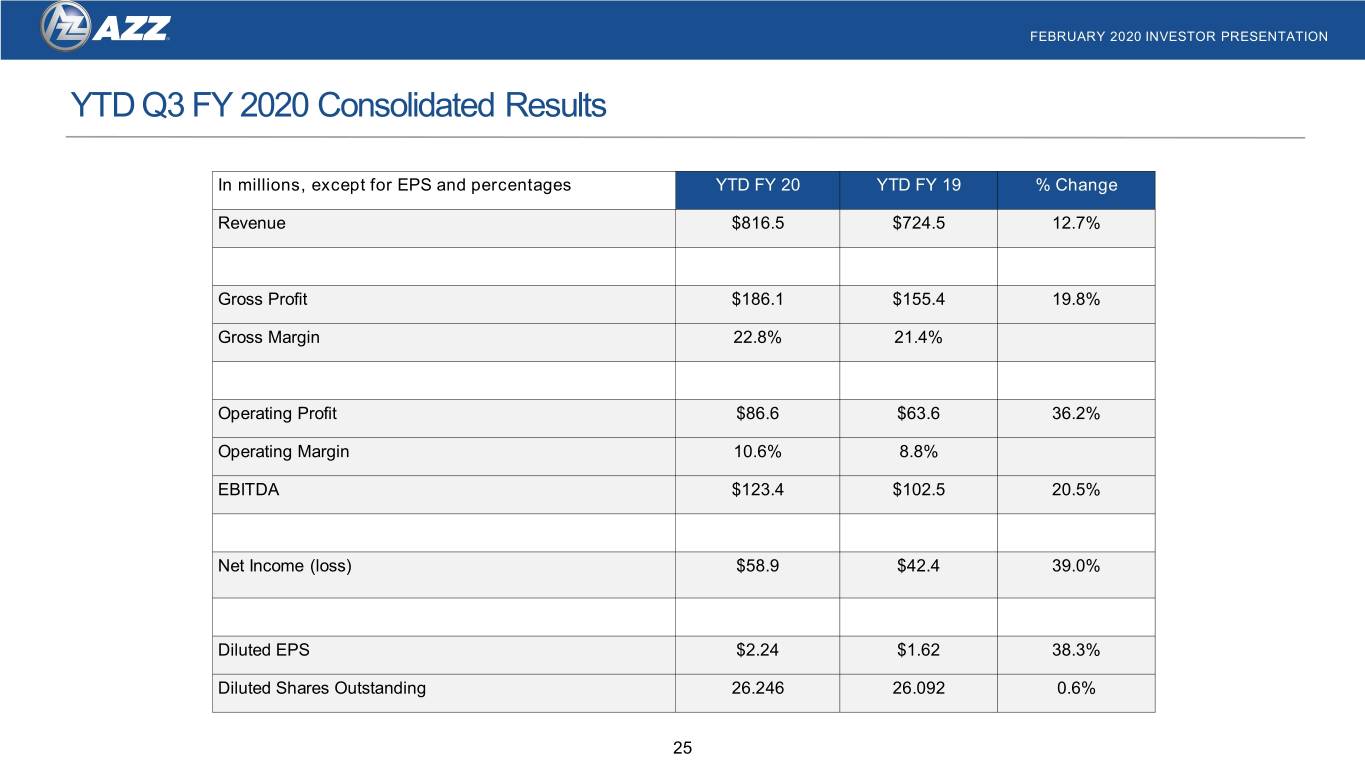
FEBRUARY 2020 INVESTOR PRESENTATION YTD Q3 FY 2020 Consolidated Results In millions, except for EPS and percentages YTD FY 20 YTD FY 19 % Change Revenue $816.5 $724.5 12.7% Gross Profit $186.1 $155.4 19.8% Gross Margin 22.8% 21.4% Operating Profit $86.6 $63.6 36.2% Operating Margin 10.6% 8.8% EBITDA $123.4 $102.5 20.5% Net Income (loss) $58.9 $42.4 39.0% Diluted EPS $2.24 $1.62 38.3% Diluted Shares Outstanding 26.246 26.092 0.6% 25
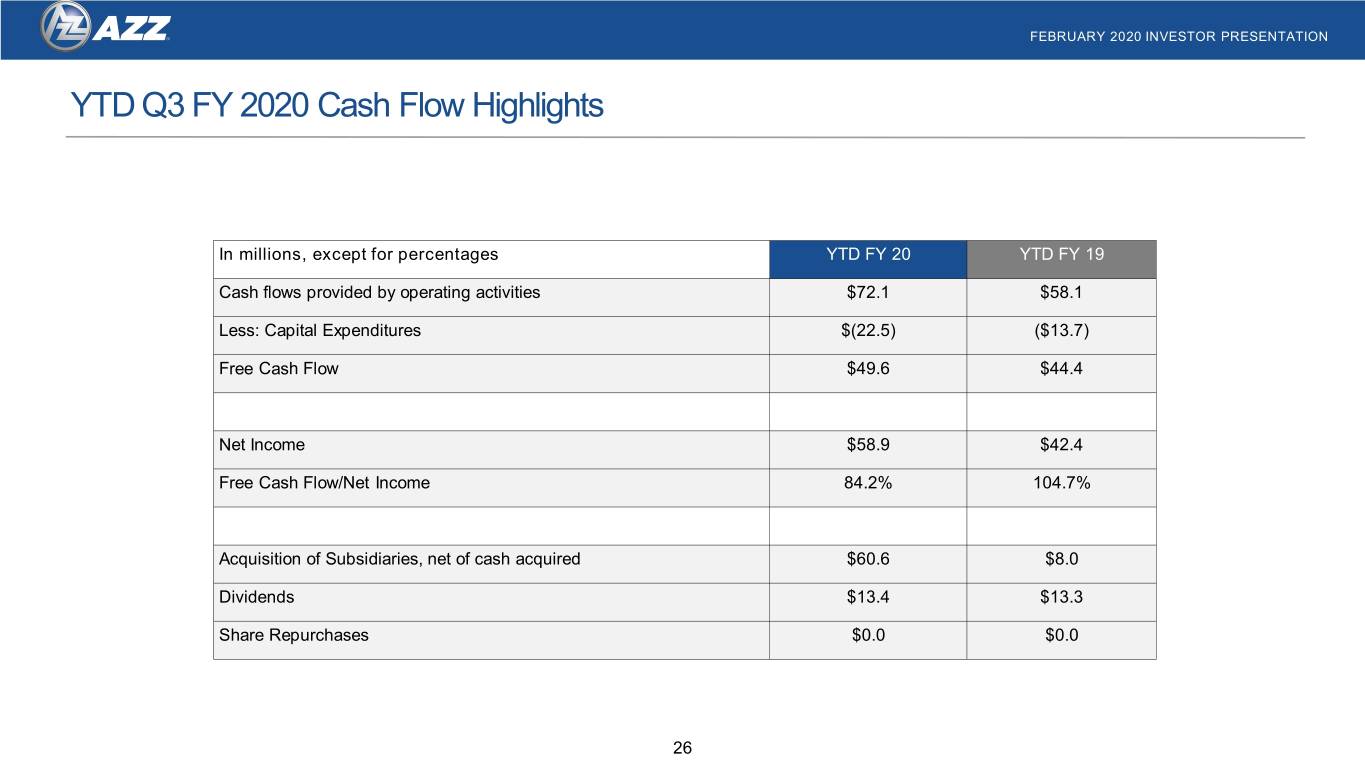
FEBRUARY 2020 INVESTOR PRESENTATION YTD Q3 FY 2020 Cash Flow Highlights In millions, except for percentages YTD FY 20 YTD FY 19 Cash flows provided by operating activities $72.1 $58.1 Less: Capital Expenditures $(22.5) ($13.7) Free Cash Flow $49.6 $44.4 Net Income $58.9 $42.4 Free Cash Flow/Net Income 84.2% 104.7% Acquisition of Subsidiaries, net of cash acquired $60.6 $8.0 Dividends $13.4 $13.3 Share Repurchases $0.0 $0.0 26

Reg G Tables

FEBRUARY 2020 INVESTOR PRESENTATION Non-GAAP Disclosure of EBITDA • In addition to reporting financial results in accordance with Generally Accepted Accounting Principles in the United States ("GAAP"), AZZ has provided EBITDA, which are non-GAAP measures. Management believes that the presentation of these measures provides investors with a greater transparency comparison of operating results across a broad spectrum of companies, which provides a more complete understanding of AZZ’s financial performance, competitive position and prospects for the future. Management also believes that investors regularly rely on non-GAAP financial measures, such as EBITDA, to assess operating performance and that such measures may highlight trends in the Company’s business that may not otherwise be apparent when relying on financial measures calculated in accordance with GAAP. 28

FEBRUARY 2020 INVESTOR PRESENTATION Non-GAAP Disclosure of Consolidated EBITDA In millions Consolidated Consolidated Consolidated Consolidated YTD FY 20 YTD FY 19 Q3 FY 20 Q3 FY 20 GAAP Net Income $58.9 $42.4 $22.0 $15.4 Adjustments to reconcile GAAP to non-GAAP Financial Measures Interest Expense $10.4 $11.5 $3.3 $3.7 Income Tax Expense $16.9 $10.5 $8.8 $3.3 Depreciation and Amortization $37.2 $38.1 $12.7 $12.4 Expense Total GAAP adjustments $64.5 $60.1 $24.8 $19.4 Non-GAAP EBITDA $123.4 $102.5 $46.8 $34.8 29
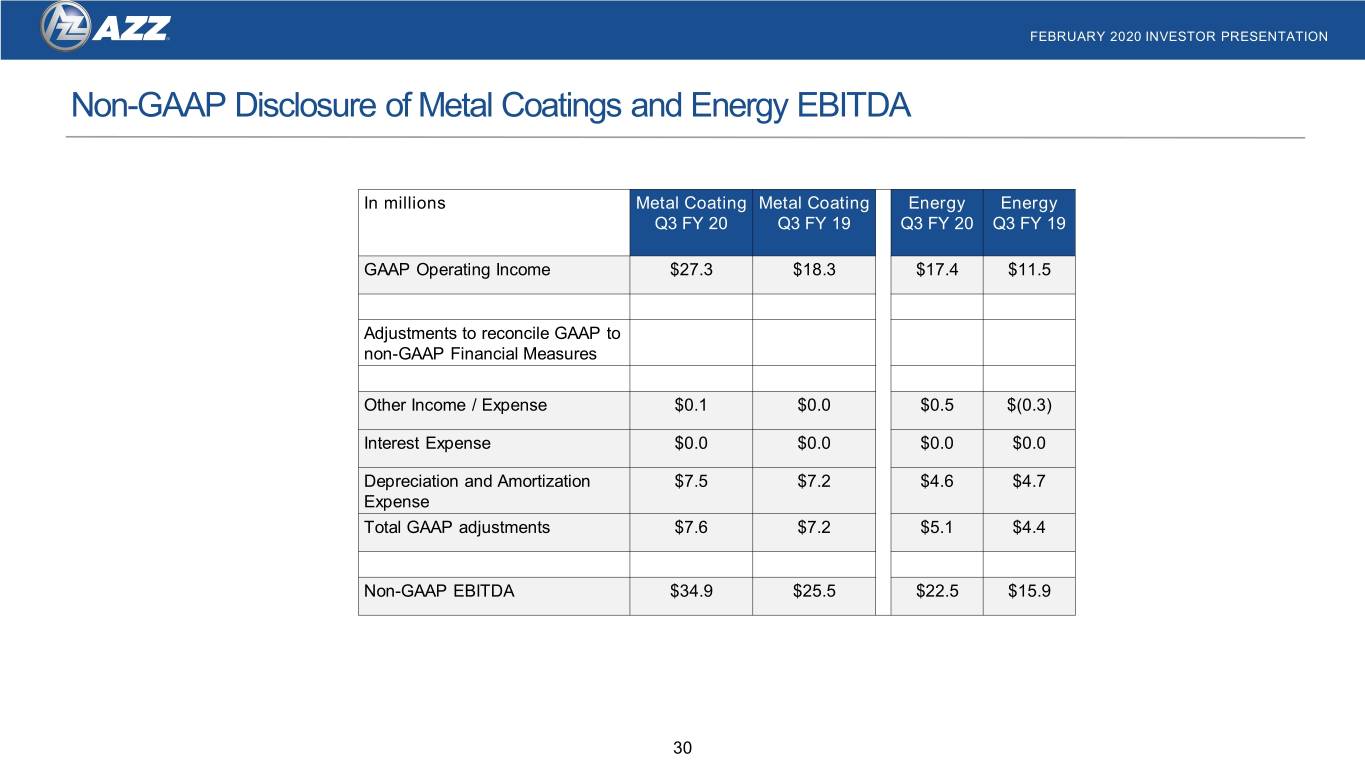
FEBRUARY 2020 INVESTOR PRESENTATION Non-GAAP Disclosure of Metal Coatings and Energy EBITDA In millions Metal Coating Metal Coating Energy Energy Q3 FY 20 Q3 FY 19 Q3 FY 20 Q3 FY 19 GAAP Operating Income $27.3 $18.3 $17.4 $11.5 Adjustments to reconcile GAAP to non-GAAP Financial Measures Other Income / Expense $0.1 $0.0 $0.5 $(0.3) Interest Expense $0.0 $0.0 $0.0 $0.0 Depreciation and Amortization $7.5 $7.2 $4.6 $4.7 Expense Total GAAP adjustments $7.6 $7.2 $5.1 $4.4 Non-GAAP EBITDA $34.9 $25.5 $22.5 $15.9 30
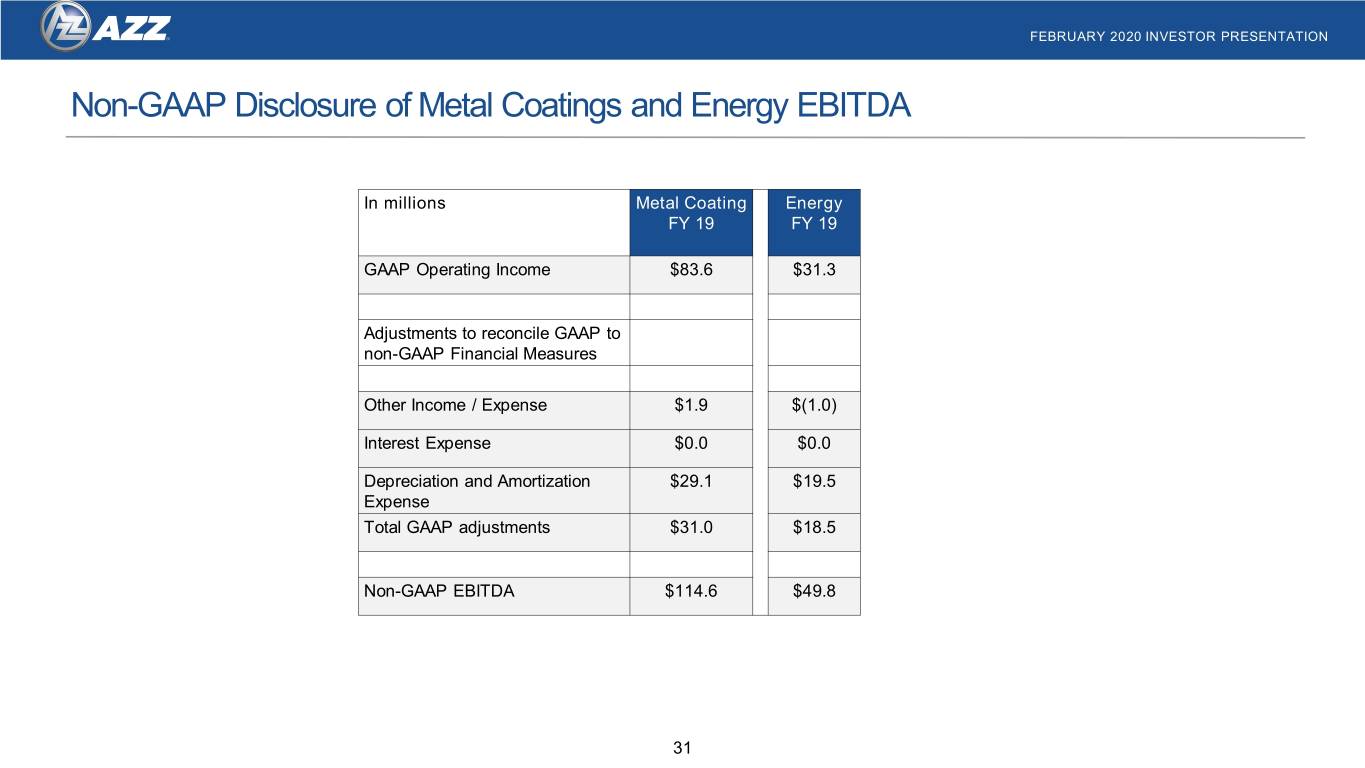
FEBRUARY 2020 INVESTOR PRESENTATION Non-GAAP Disclosure of Metal Coatings and Energy EBITDA In millions Metal Coating Energy FY 19 FY 19 GAAP Operating Income $83.6 $31.3 Adjustments to reconcile GAAP to non-GAAP Financial Measures Other Income / Expense $1.9 $(1.0) Interest Expense $0.0 $0.0 Depreciation and Amortization $29.1 $19.5 Expense Total GAAP adjustments $31.0 $18.5 Non-GAAP EBITDA $114.6 $49.8 31

FEBRUARY 2020 INVESTOR PRESENTATION Non-GAAP Disclosure of Consolidated EBITDA In millions Consolidated Consolidated Consolidated Consolidated Consolidated FY 15 FY 16 FY 17 FY 18 FY 19 GAAP Net Income $64.9 $74.9 $61.3 $45.2 $51.2 Adjustments to reconcile GAAP to non-GAAP Financial Measures Interest Expense $16.6 $15.2 $14.7 $13.9 $15.0 Income Tax Expense $25.2 $29.5 $24.0 $(14.3) $11.8 Depreciation and $46.1 $47.3 $50.4 $50.5 $50.2 Amortization Expense Total GAAP adjustments $87.9 $92.0 $89.1 $50.1 $77.0 Non-GAAP EBITDA $152.8 $166.9 $150.4 $95.3 $128.2 32
