Attached files
| file | filename |
|---|---|
| EX-99.4 - EX-99.4 - ASBURY AUTOMOTIVE GROUP INC | d855100dex994.htm |
| EX-99.3 - EX-99.3 - ASBURY AUTOMOTIVE GROUP INC | d855100dex993.htm |
| EX-99.2 - EX-99.2 - ASBURY AUTOMOTIVE GROUP INC | d855100dex992.htm |
| 8-K - FORM 8-K - ASBURY AUTOMOTIVE GROUP INC | d855100d8k.htm |
Exhibit 99.1
Certain Information Excerpted from the Company’s Preliminary Offering Memorandum and Disclosed Pursuant to Regulation FD
Disclosure Regarding Forward-Looking Statements
Certain of the discussions and information included in various places herein may constitute “forward-looking statements” within the meaning of the United States federal securities laws. Forward-looking statements are statements that are not historical in nature and may include statements relating to our goals, plans and projections regarding industry and general economic trends, our expected financial position, the expected terms or timeline of the currently contemplated Acquisition (as defined below), the anticipated cost savings, run-rate synergies, revenue enhancement strategies, operational improvements and other benefits from the Acquisition, results of operations or market position and our business strategy. Such statements can generally be identified by words such as “may,” “target,” “could,” “would,” “will,” “should,” “believe,” “expect,” “anticipate,” “plan,” “intend,” “foresee” and other similar words or phrases. Forward-looking statements may also relate to our expectations and assumptions with respect to, among other things:
| • | the expected financial and operational performance of Park Place; |
| • | our estimated future capital expenditures, including with respect to the operations of Park Place following the consummation of the Acquisition; |
| • | sales fluctuations to and changes in our relationships with key customers, including the customers of Park Place following the consummation of the Acquisition; |
| • | the seasonally adjusted annual rate of new vehicle sales in the United States; |
| • | our estimated future capital expenditures; |
| • | general economic conditions and its expected impact on our revenue and expenses; |
| • | our expected parts and service revenue due to, among other things, improvements in vehicle technology; |
| • | our ability to limit our exposure to regional economic downturns due to our geographic diversity and brand mix, which limits exposure to regional economic downturn; |
| • | our capital allocation strategy, including as it relates to acquisitions and divestitures, stock repurchases, dividends and capital expenditures; |
| • | the growth of the brands that comprise our portfolio over the long-term. |
Forward-looking statements involve known and unknown risks, uncertainties and other factors that may cause our actual future results, performance or achievements to be materially different from any future results, performance or achievements expressed or implied by the forward-looking statements. Such factors include, but are not limited to:
| • | the occurrence of any event, change or other circumstance that could give rise to the termination of the Asset Purchase Agreement, including the risk that the necessary manufacturer approvals may not be obtained; |
| • | the ability to consummate the Acquisition and the other transactions |
| constituting the Transactions on the terms or timeline currently contemplated or at all, successfully integrate the operations of Park Place into our existing operations and the diversion of management’s attention from ongoing business and regular business responsibilities to effect such integration; |
| • | the effects of increased expenses or unanticipated liabilities incurred as a result of, or due to activities related to, the Acquisition; |
| • | disruption from the Acquisition, making it more difficult to maintain relationships with customers or suppliers of Park Place; |
| • | changes in general economic and business conditions, including changes in employment levels, consumer demand, preferences and confidence levels, the availability and cost of credit in a rising interest rate environment, fuel prices, levels of discretionary personal income and interest rates; |
| • | our ability to execute our balanced automotive retailing and service business strategy; |
| • | our ability to attract and retain skilled employees; |
| • | adverse conditions affecting the vehicle manufacturers whose brands we sell, and their ability to design, manufacture, deliver and market their vehicles successfully; |
| • | changes in the mix, and total number, of vehicles we are able to sell; |
| • | our outstanding indebtedness and our continued ability to comply with applicable covenants in our various financing and lease agreements, or to obtain waivers of these covenants as necessary; |
| • | high levels of competition in our industry, which may create pricing and margin pressures on our products and services; |
| • | our relationships with manufacturers of the vehicles we sell and our ability to renew, and enter into new framework and dealer agreements with vehicle manufacturers whose brands we sell, on terms acceptable to us; |
| • | the availability of manufacturer incentive programs and our ability to earn these incentives; |
| • | failure of our management information systems or any security breaches; |
| • | changes in laws and regulations governing the operation of automobile franchises, including trade restrictions, consumer protections, accounting standards, taxation requirements and environmental laws; |
| • | changes in, or the imposition of, new tariffs or trade restrictions on imported vehicles or parts; |
| • | adverse results from litigation or other similar proceedings involving us; |
| • | our ability to generate sufficient cash flows, maintain our liquidity and obtain any necessary additional funds for working capital, capital expenditures, acquisitions, stock repurchases, debt maturity payments and other corporate purposes, if necessary or desirable; |
| • | our ability to consummate planned mergers, acquisitions and dispositions; |
| • | any disruptions in the financial markets, which may impact our ability to access capital; |
| • | our relationships with, and the financial stability of, our lenders and lessors; |
| • | significant disruptions in the production and delivery of vehicles and parts for any reason, including natural disasters, product recalls, work stoppages or other occurrences that are outside of our control; |
| • | our ability to execute our initiatives and other strategies; |
| • | our ability to leverage gains from our dealership portfolio; and |
| • | in addition to the Acquisition, our ability to successfully integrate businesses we may acquire, or that any business we acquire may not perform as we expected at the time we acquired it. |
Many of these factors are beyond our ability to control or predict, and their ultimate impact could be material. Forward-looking statements also include, but are not limited to, those described in Risks related to the Business” and “Risks Related to the Acquisition” herein. Forward-looking statements contained herein are made only as of the date they are made, and we assume no obligation to update any forward-looking statements.
Certain Terms Used Herein
When used herein, unless the context requires otherwise, or as specifically described below:
| • | The term “2013 BofA Real Estate Credit Agreement” means the real estate term loan credit agreement (as amended, restated or supplemented from time to time), dated as of September 26, 2013, between the Company, certain of its subsidiaries, as borrowers, and Bank of America, as lender. |
| • | The term “2013 BofA Real Estate Facility” means the 2013 BofA Real Estate Credit Agreement providing for term loans in an aggregate amount not to exceed $75.0 million. |
| • | The term “2015 Wells Fargo Master Loan Agreement” means the amended and restated master loan agreement (as amended, restated or supplemented from time to time), dated as of February 13, 2015, between certain of the Company’s subsidiaries and Wells Fargo Bank, National Association, as lender. |
| • | The term “2015 Wells Fargo Master Loan Facility” means the 2015 Wells Fargo Master Loan Agreement providing term loans to certain of the Company’s subsidiaries that are borrowers in an aggregate amount not to exceed $100.0 million. |
| • | The term “2018 BofA Real Estate Credit Agreement” means the real estate term loan credit agreement (as amended, restated or supplemented from time to time), dated as of November 13, 2018, between the Company, certain of its subsidiaries, as borrowers, and Bank of America, as lender. |
| • | The term “2018 BofA Real Estate Facility” means the 2018 BofA Real Estate Credit Agreement providing for term loans in an aggregate amount not to exceed $128.1 million. |
| • | The term “2018 Wells Fargo Master Loan Agreement” means the master loan agreement (as amended, restated or supplemented from time to time), dated as of November 16, 2018, between certain of the Company’s subsidiaries and Wells Fargo Bank, National Association, as lender, which provides form term loans to certain of our subsidiaries that are in an aggregate amount not to exceed $100.0 million. |
| • | The term “2018 Wells Fargo Master Loan Facility” means the agreement which provides for term loans to certain of the Company’s subsidiaries that are borrowers under the Wells Fargo Master Loan Agreement in an aggregate not to exceed $100.0 million. |
| • | The term “2019 Senior Credit Agreement” means collectively the Third Amended and Restated Credit Agreement, dated as of September 25, 2019, by and among the Company, as borrower, certain of its subsidiaries, as vehicle borrowers, Bank of America, as administrative agent, revolving swing line lender, new vehicle floorplan swing line lender, used vehicle floorplan swingline lender and an L/C issuer, and the other lenders party thereto, JPMorgan Chase Bank, N.A. and Wells Fargo Bank, N.A., as co-syndication agents, Mercedes- Benz Financial Services USA LLC and Toyota Motor Credit Corporation, as co-documentation agents, and BofA Securities, Inc., as sole lead arranger and sole book manager, as further amended, modified, renewed, refunded, replaced or refinanced or otherwise restructured in whole or in part from time to time, whether by the same or any other agent, lender or group of lenders. |
| • | The term “2019 Senior Credit Facility” means the 2019 Senior Credit Agreement providing for the Revolving Credit Facility, the New Vehicle Used Floor Plan Facility and the Used Vehicle Floor Plan Facility. |
| • | The term “Asbury,” the “Company,” “we,” “us” or “our” means Asbury Automotive Group, Inc. and its subsidiaries, prior to the Acquisition |
| • | The term “Bank of America” means Bank of America, N.A. |
| • | The term “Borrowers” means the Company and the Company’s dealership subsidiaries that are borrowers under the 2019 Senior Credit Facility. |
| • | The term “Bridge Commitment Letter” means the bridge commitment letter with the Bank of America as amended, restated or supplemented from time to time. |
| • | The term “Bridge Credit Facility” means the $650.0 million senior unsecured bridge credit facility in connection with the bridge debt financing for the Acquisition. |
| • | The term “Bridge lenders” means the Bank of America and a syndicate of lenders. |
| • | The term the “Combined Company” means Asbury Automotive Group, Inc. and its subsidiaries, after giving effect to the Acquisition. |
| • | The term “Elway Dealership” means the John Elway Chrysler, Dodge, Jeep dealership operating in Denver, Colorado. |
| • | The term “Existing Notes” means the 6.0% Senior Subordinated Notes due 2024 issued under the indenture dated as of December 4, 2014, among Asbury, as issuer, each of the guarantors party thereto and U.S. Bank National Association, as trustee, as amended and supplemented from time to time. |
| • | The term “Existing Real Estate Credit Agreements” means the 2013 BofA Real Estate Credit Agreement, the 2015 Wells Fargo Master Loan Agreement, the 2018 Wells Fargo Master Loan Agreement and the 2018 BofA Real Estate Credit Agreement. |
| • | The term “Existing Real Estate Facilities” means the 2013 BofA Real Estate Facility, the 2015 Wells Fargo Master Loan Facility, the 2018 Wells Fargo Master Loan Facility and the 2018 BofA Real Estate Facility. |
| • | The term “F&I” means finance and insurance products. |
| • | The term “Gray Daniels Dealerships” means the Company’s five Gray Daniels dealerships operating in the Jackson, Mississippi area. |
| • | The term “LIBOR” means the London Interbank Offered Rate. |
| • | The term “LTM Period” means the twelve months ended September 30, 2019. |
| • | The term “Nalley Nissan Dealership” means the Company’s Nalley Nissan dealership operating in metropolitan Atlanta. |
| • | The term “New BofA Real Estate Credit Agreement” means a new real estate term loan credit agreement (as amended, restated or supplemented from time to time), to be entered into in connection with the Acquisition, the Company, certain of our subsidiaries that own or lease the real estate financed thereunder, as borrowers, the various financial institutions party thereto, as lenders, and Bank of America, as lender. |
| • | The term “New BofA Real Estate Facility” means the New BofA Real Estate Credit Agreement providing for term loans in an aggregate amount not to exceed approximately $300 million. |
| • | The term “New Vehicle Floor Plan Facility” means the new vehicle floor plan facility under the 2019 Senior Credit Agreement providing for $1.04 billion of aggregate commitments as of the date hereof and $1.35 billion of aggregate commitments upon the consummation of the Acquisition. |
| • | The term “P&S” means replacement parts and collision repair services. |
| • | The term “Real Estate Purchase Agreement” means the Real Estate Purchase Agreement, dated as of December 11, 2019, among the Company and the Sellers. |
| • | The term “Revolving Credit Facility” means the revolving credit facility under the 2019 Senior Credit Agreement providing for $250 million of aggregate comments as of the date hereof and $350 million of aggregate commitments upon the consummation of the Acquisition. |
| • | The term “Sellers” means Park Place and the other parties to the Asset Purchase Agreement and the Real Estate Purchase Agreement. |
| • | The “Shaw Dealership” means the Mike Shaw Subaru dealership operating in Thornton, Colorado. |
| • | The term “Special Mandatory Redemption” means the required redemption by the Company if (i) the consummation of the Acquisition does not occur on or before the End Date or (ii) the Company notifies the |
| Trustee of its abandonment or termination of the Asset Purchase Agreement or its determination that the consummation of the Acquisition will not occur on or before the End Date. |
| • | The term “Transaction Agreements” means the Asset Purchase Agreement and the Real Estate Purchase Agreement, together. |
| • | The term “Transactions” means the Acquisition and the financing transactions (including the redemption of the Existing Notes), collectively. |
| • | The term “Used Vehicle Floor Plan Facility” means the used vehicle floor plan facility under the 2019 Senior Credit Agreement providing for $160 million of aggregate commitments as of the date hereof and $200 million of aggregate commitments upon the consummation of the Acquisition. |
| • | The term “Wells Fargo” means Wells Fargo Bank, National Association. |
UNAUDITED PRO FORMA CONDENSED COMBINED FINANCIAL INFORMATION OF THE COMBINED COMPANY
The unaudited pro forma condensed combined financial statements (referred to as the “pro forma financial statements”) presented below are derived from the historical consolidated financial statements of the Company and Park Place, as adjusted to reflect the issuance of $525.0 million of the Notes hereby and the other financing transactions expected to fund the purchase price for the Acquisition (the “Financing”) and the Acquisition. For summaries of the Financing and Acquisition, see the section of this offering memorandum entitled “Summary–Acquisition of Park Place.”
The unaudited pro forma condensed combined balance sheet as of September 30, 2019, assumes that the Acquisition and Financing occurred on September 30, 2019.
The unaudited pro forma condensed combined statements of income for the twelve months ended September 30, 2019 and the nine months ended September 30, 2019, assume that the Acquisition and Financing occurred on October 1, 2018.
The following unaudited pro forma condensed combined financial information should be read in conjunction with the following financial statements, all of which are included in this offering memorandum:
| • | the audited consolidated financial statements of Asbury as of December 31, 2018 and for the three years ended December 31, 2018; |
| • | the unaudited consolidated financial statements of Asbury as of and for the nine months ended September 30, 2019; |
| • | the audited combined and consolidated financial statements of Park Place as of and for the two years ended December 31, 2018; |
| • | the audited combined and consolidated financial statements of Park Place as of and for the nine months ended September 30, 2019; and |
| • | the unaudited condensed combined and consolidated financial statements of Park Place as of and for the three months ended December 31, 2018. |
The unaudited pro forma condensed combined financial information of the Combined Company does not give effect to (1) the issuance of $600 million of Notes for which the proceeds will be used to fund the redemption of the Existing Notes, (2) the acquisitions of the Elway Dealership and Shaw Dealership (except with respect to the cash and cash equivalents from the Shaw Dealership which was consummated on September 30, 2019 and accordingly is reflected in the unaudited pro forma condensed combined balance sheet as of September 30, 2019), (3) the anticipated dispositions of the Gray Daniels dealerships and the Nalley Nissan dealership, (4) the repayment of $25.0 million of mortgage notes payable at maturity during the three months ended December 31, 2019 and (5) the repayment of $25.0 million under the Used Vehicle Floor Plan Facility during the three months ended December 31, 2019. The consummation of the Financing and Acquisition is subject to the satisfaction of customary closing conditions, including the absence of a material adverse change in Park Place and the receipt of competition clearances in certain jurisdictions. If the Acquisition is consummated, our post-closing recourse is limited. See “Risk Factors—Risks Related to the Acquisition—If the Acquisition is consummated, our post-closing recourse for liabilities related to Park Place is limited.”
The pro forma adjustments reported in these financial statements are based upon available information and certain assumptions that the Company’s management believes are reasonable. The unaudited pro forma condensed combined financial information of the Combined Company is presented for informational purposes only and is not intended to represent or be indicative of what the results of operations or financial condition would have been had the Financing and Acquisition actually occurred on the dates indicated, nor is it meant to be
6
indicative of future results of operations or financial condition for any future period or as of any future date. The unaudited pro forma condensed combined financial information of the Combined Company should be read in conjunction with “Summary—Acquisition of Park Place,” “Risk Factors,” “Use of Proceeds,” “Summary—Summary Historical Consolidated Financial Information of Asbury and Unaudited Pro Forma Condensed Combined Financial Information of the Combined Company,” “Summary—Summary Historical Combined Financial Information of Park Place,” “Management’s Discussion and Analysis of Financial Condition and Results of Operations of the Company,” as well as the audited and unaudited historical financial statements and related notes of the Company and Park Place included in this offering memorandum.
Assumptions underlying the pro forma adjustments are described in the accompanying notes, which should be read in conjunction with the unaudited pro forma condensed combined financial information of the Combined Company.
7
COMBINED COMPANY
Pro Forma Condensed Combined Balance Sheet
As of September 30, 2019
(In millions)
(Unaudited)
| Asbury | Park Place |
Pro Forma Adjustments |
Pro Forma Combined |
|||||||||||||||
| ASSETS | ||||||||||||||||||
| Current assets: |
||||||||||||||||||
| Cash and cash equivalents |
$ | 1.8 | $ | 16.5 | $ | (16.5 | ) | a | $ | 1.8 | ||||||||
|
Contracts-in-transit, net |
148.6 | 20.0 | (20.0 | ) | a | 148.6 | ||||||||||||
| Accounts receivable, net |
112.5 | 35.6 | (35.6 | ) | a | 112.5 | ||||||||||||
| Inventories, net |
1,030.1 | 231.3 | (2.4 | ) | a, b | 1,259.0 | ||||||||||||
| Assets held for sale |
26.1 | — | — | 26.1 | ||||||||||||||
| Other current assets |
128.9 | 84.2 | (6.5 | ) | a | 206.6 | ||||||||||||
|
|
|
|
|
|
|
|
|
|||||||||||
| Total current assets |
1,448.0 | 387.6 | (81.0 | ) | 1,754.6 | |||||||||||||
| Property and equipment, net |
943.4 | 186.3 | 50.9 | a, c | 1,180.6 | |||||||||||||
| Operating lease right-of-use-assets |
77.1 | 49.7 | 83.0 | d | 209.8 | |||||||||||||
| Goodwill |
272.1 | 0.5 | 784.5 | e | 1,057.1 | |||||||||||||
| Intangible franchise rights |
65.8 | 11.4 | (11.4 | ) | e | 65.8 | ||||||||||||
| Other long-term assets |
10.1 | 6.7 | (5.7 | ) | a | 11.1 | ||||||||||||
|
|
|
|
|
|
|
|
|
|||||||||||
| Total assets |
$ | 2,816.5 | $ | 642.2 | $ | 820.3 | $ | 4,279.0 | ||||||||||
|
|
|
|
|
|
|
|
|
|||||||||||
| LIABILITIES AND SHAREHOLDERS’ EQUITY | ||||||||||||||||||
| Current liabilities: |
||||||||||||||||||
| Floor plan notes payable—trade, net |
$ | 122.1 | $ | 74.3 | $ | (66.4 | ) | a, g | $ | 130.0 | ||||||||
| Floor plan notes payable—non-trade, net |
738.9 | 83.5 | 261.3 | a, g | 1,083.7 | |||||||||||||
| Current maturities of long-term debt |
38.1 | 12.7 | 4.1 | a, g | 54.9 | |||||||||||||
| Current maturities of operating leases |
21.0 | 10.9 | (0.3 | ) | d | 31.6 | ||||||||||||
| Accounts payable and accrued liabilities |
315.0 | 136.0 | (60.4 | ) | a | 390.6 | ||||||||||||
|
|
|
|
|
|
|
|
|
|||||||||||
| Total current liabilities |
1,235.1 | 317.4 | 138.3 | 1,690.8 | ||||||||||||||
| Long-term debt |
867.8 | 90.4 | 792.6 | a, g | 1,750.8 | |||||||||||||
| Operating lease liability |
60.3 | 39.5 | 82.6 | d | 182.4 | |||||||||||||
| Deferred income taxes |
20.4 | — | — | 20.4 | ||||||||||||||
| Other long-term liabilities |
32.9 | 7.2 | (5.5 | ) | a | 34.6 | ||||||||||||
| Commitments and contingencies |
||||||||||||||||||
| Shareholders’ equity: |
||||||||||||||||||
| Total shareholders’ equity |
600.0 | 187.7 | (187.7 | ) | h | 600.0 | ||||||||||||
|
|
|
|
|
|
|
|
|
|||||||||||
| Total liabilities and shareholders’ equity |
$ | 2,816.5 | $ | 642.2 | $ | 820.3 | $ | 4,279.0 | ||||||||||
|
|
|
|
|
|
|
|
|
|||||||||||
8
COMBINED COMPANY
Pro Forma Condensed Combined Statements of Income
For the Twelve Months Ended September 30, 2019
(In millions, except share and per share data)
(Unaudited)
| Asbury | Park Place | Pro Forma Adjustments |
Pro Forma Combined |
|||||||||||||||||||||||||
| For the Nine Months Ended September 30, 2019 |
For the Three Months Ended December 31, 2018 |
For the Nine Months Ended September 30, 2019 |
For the Three Months Ended December 31, 2018 |
|||||||||||||||||||||||||
| Revenue: |
||||||||||||||||||||||||||||
| New vehicle |
$ | 2,823.9 | $ | 1,022.4 | $ | 620.2 | $ | 271.8 | $ | — | $ | 4,738.3 | ||||||||||||||||
| Used vehicle |
1,590.4 | 473.4 | 474.1 | 149.1 | — | 2,687.0 | ||||||||||||||||||||||
| Parts and service |
669.7 | 211.1 | 206.4 | 66.4 | — | 1,153.6 | ||||||||||||||||||||||
| Finance and insurance, net |
232.3 | 77.3 | 21.9 | 8.3 | — | 339.8 | ||||||||||||||||||||||
| Other |
— | — | 7.2 | 2.4 | — | 9.6 | ||||||||||||||||||||||
|
|
|
|
|
|
|
|
|
|
|
|
|
|||||||||||||||||
| Total revenue |
5,316.3 | 1,784.2 | 1,329.8 | 498.0 | — | 8,928.3 | ||||||||||||||||||||||
| Cost of sales: |
||||||||||||||||||||||||||||
| New vehicle |
2,709.1 | 978.5 | 574.9 | 252.4 | — | 4,514.9 | ||||||||||||||||||||||
| Used vehicle |
1,487.6 | 444.1 | 447.9 | 141.8 | — | 2,521.4 | ||||||||||||||||||||||
| Parts and service |
252.3 | 79.8 | 91.1 | 29.9 | — | 453.1 | ||||||||||||||||||||||
| Other |
— | — | 0.5 | 0.1 | — | 0.6 | ||||||||||||||||||||||
|
|
|
|
|
|
|
|
|
|
|
|
|
|||||||||||||||||
| Total cost of sales |
4,449.0 | 1,502.4 | 1,114.4 | 424.2 | — | 7,490.0 | ||||||||||||||||||||||
|
|
|
|
|
|
|
|
|
|
|
|
|
|||||||||||||||||
| Gross profit |
867.3 | 281.8 | 215.4 | 73.8 | — | 1,438.3 | ||||||||||||||||||||||
| Operating expenses: |
||||||||||||||||||||||||||||
| Selling, general, and administrative |
593.7 | 192.2 | 151.8 | 50.0 | — | 987.7 | ||||||||||||||||||||||
| Depreciation and amortization |
26.7 | 8.5 | 11.5 | 3.7 | (4.7 | ) | c | 45.7 | ||||||||||||||||||||
| Franchise rights impairment |
— | 3.7 | — | — | — | 3.7 | ||||||||||||||||||||||
| Other operating (income) expense, net |
1.0 | 0.1 | (0.2 | ) | — | — | 0.9 | |||||||||||||||||||||
|
|
|
|
|
|
|
|
|
|
|
|
|
|||||||||||||||||
| Income from operations |
245.9 | 77.3 | 52.3 | 20.1 | 4.7 | 400.3 | ||||||||||||||||||||||
| Other expenses (income): |
||||||||||||||||||||||||||||
| Floor plan interest expense |
29.7 | 9.5 | 5.6 | 1.9 | 2.6 | i | 49.3 | |||||||||||||||||||||
| Other interest expense, net |
41.2 | 13.7 | 5.6 | 1.9 | 39.0 | i | 101.4 | |||||||||||||||||||||
| Gain on divestiture |
(11.7 | ) | — | — | — | — | (11.7 | ) | ||||||||||||||||||||
|
|
|
|
|
|
|
|
|
|
|
|
|
|||||||||||||||||
| Total other expenses, net |
59.2 | 23.2 | 11.2 | 3.8 | 41.6 | 139.0 | ||||||||||||||||||||||
|
|
|
|
|
|
|
|
|
|
|
|
|
|||||||||||||||||
| Income before income taxes |
186.7 | 54.1 | 41.1 | 16.3 | (36.9 | ) | 261.3 | |||||||||||||||||||||
| Income tax expense |
45.9 | 13.7 | 1.2 | 0.4 | (5.9 | ) | f | 55.3 | ||||||||||||||||||||
|
|
|
|
|
|
|
|
|
|
|
|
|
|||||||||||||||||
| Net income |
$ | 140.8 | $ | 40.4 | $ | 39.9 | $ | 15.9 | $ | (31.0 | ) | $ | 206.0 | |||||||||||||||
|
|
|
|
|
|
|
|
|
|
|
|
|
|||||||||||||||||
| Earnings per share: |
||||||||||||||||||||||||||||
| Basic— |
||||||||||||||||||||||||||||
| Net income |
$ | 7.37 | $ | 2.09 | $ | 10.79 | ||||||||||||||||||||||
|
|
|
|
|
|
|
|||||||||||||||||||||||
| Diluted— |
||||||||||||||||||||||||||||
| Net income |
$ | 7.30 | $ | 2.06 | $ | 10.67 | ||||||||||||||||||||||
|
|
|
|
|
|
|
|||||||||||||||||||||||
| Weighted average shares outstanding: |
||||||||||||||||||||||||||||
| Basic |
19.1 | 19.3 | 19.1 | |||||||||||||||||||||||||
| Restricted stock |
0.1 | 0.1 | 0.1 | |||||||||||||||||||||||||
| Performance share units |
0.1 | 0.2 | 0.1 | |||||||||||||||||||||||||
|
|
|
|
|
|
|
|||||||||||||||||||||||
| Diluted |
$ | 19.3 | $ | 19.6 | $ | 19.3 | ||||||||||||||||||||||
|
|
|
|
|
|
|
|||||||||||||||||||||||
9
COMBINED COMPANY
Pro Forma Condensed Combined Statements of Income
For the Nine Months Ended September 30, 2019
(In millions, except share and per share data) (Unaudited)
| Asbury | Park Place | Pro Forma Adjustments |
Pro Forma Combined |
|||||||||||||||||
| For the Nine Months Ended September 30, 2019 |
For the Nine Months Ended September 30, 2019 |
|||||||||||||||||||
| Revenue: |
||||||||||||||||||||
| New vehicle |
$ | 2,823.9 | $ | 620.2 | $ | — | $ | 3,444.1 | ||||||||||||
| Used vehicle |
1,590.4 | 474.1 | — | 2,064.5 | ||||||||||||||||
| Parts and service |
669.7 | 206.4 | — | 876.1 | ||||||||||||||||
| Finance and insurance, net |
232.3 | 21.9 | — | 254.2 | ||||||||||||||||
| Other |
— | 7.2 | — | 7.2 | ||||||||||||||||
|
|
|
|
|
|
|
|
|
|||||||||||||
| Total Revenue |
5,316.3 | 1,329.8 | — | 6,646.1 | ||||||||||||||||
| Cost of Sales: |
||||||||||||||||||||
| New vehicle |
2,709.1 | 574.9 | — | 3,284.0 | ||||||||||||||||
| Used vehicle |
1,487.6 | 447.9 | — | 1,935.5 | ||||||||||||||||
| Parts and service |
252.3 | 91.1 | — | 343.4 | ||||||||||||||||
| Other |
— | 0.5 | — | 0.5 | ||||||||||||||||
|
|
|
|
|
|
|
|
|
|||||||||||||
| Total Cost of Sales |
4,449.0 | 1,114.4 | — | 5,563.4 | ||||||||||||||||
|
|
|
|
|
|
|
|
|
|||||||||||||
| Gross Profit |
867.3 | 215.4 | — | 1,082.7 | ||||||||||||||||
| Operating Expenses: |
||||||||||||||||||||
| Selling, general, and administrative |
593.7 | 151.8 | — | 745.5 | ||||||||||||||||
| Depreciation and amortization |
26.7 | 11.5 | (3.6 | ) | c | 34.6 | ||||||||||||||
| Franchise rights impairment |
— | — | — | — | ||||||||||||||||
| Other operating (income) expense, net |
1.0 | (0.2 | ) | — | 0.8 | |||||||||||||||
|
|
|
|
|
|
|
|
|
|||||||||||||
| Income from Operations |
245.9 | 52.3 | 3.6 | 301.8 | ||||||||||||||||
| Other Expenses (Income): |
||||||||||||||||||||
| Floor plan interest expense |
29.7 | 5.6 | 2.0 | i | 37.3 | |||||||||||||||
| Other interest expense, net |
41.2 | 5.6 | 29.2 | i | 76.0 | |||||||||||||||
| Gain on divestiture |
(11.7 | ) | — | — | (11.7 | ) | ||||||||||||||
|
|
|
|
|
|
|
|
|
|||||||||||||
| Total other expenses, net |
59.2 | 11.2 | 31.2 | 101.6 | ||||||||||||||||
|
|
|
|
|
|
|
|
|
|||||||||||||
| Income Before Income Taxes |
186.7 | 41.1 | (27.6 | ) | 200.2 | |||||||||||||||
| Income tax expense |
45.9 | 1.2 | (4.7 | ) | f | 42.4 | ||||||||||||||
|
|
|
|
|
|
|
|
|
|||||||||||||
| Net Income |
$ | 140.8 | $ | 39.9 | $ | (22.9 | ) | $ | 157.8 | |||||||||||
|
|
|
|
|
|
|
|
|
|||||||||||||
| Earnings Per Share: |
||||||||||||||||||||
| Basic— |
||||||||||||||||||||
| Net income |
$ | 7.37 | $ | 8.26 | ||||||||||||||||
|
|
|
|
|
|||||||||||||||||
| Diluted— |
||||||||||||||||||||
| Net income |
$ | 7.30 | $ | 8.18 | ||||||||||||||||
|
|
|
|
|
|||||||||||||||||
| Weighted Average Shares Outstanding: |
||||||||||||||||||||
| Basic |
19.1 | 19.1 | ||||||||||||||||||
| Restricted stock |
0.1 | 0.1 | ||||||||||||||||||
| Performance share units |
0.1 | 0.1 | ||||||||||||||||||
|
|
|
|
|
|||||||||||||||||
| Diluted |
$ | 19.3 | $ | 19.3 | ||||||||||||||||
|
|
|
|
|
|||||||||||||||||
10
1. Basis of Presentation
The unaudited pro forma condensed combined financial information includes pro forma adjustments that are (1) directly attributable to the Financing and Transactions, (2) factually supportable and (3) with respect to the unaudited pro forma condensed combined statements of income, expected to have a continuing impact on the operating results of the combined company.
The acquisition of the Park Place Business is accounted for as a business combination using the acquisition method of accounting under ASC Topic 805, Business Combinations. Under the acquisition method of accounting, the purchase price is allocated to the underlying tangible and intangible assets acquired and liabilities assumed based on their respective fair values at the date of acquisition, with any excess purchase price allocated to goodwill. To date, the Company has estimated a preliminary allocation of the purchase price to the assets acquired and liabilities assumed in the Acquisition, and upon consummation of the Acquisition will complete the allocation of such purchase price as further information becomes available. The final purchase price allocation may differ from that reflected in the following unaudited pro forma condensed combined financial statements, and these differences may be material.
The unaudited pro forma condensed combined consolidated balance sheet as of September 30, 2019, assumes that the Transactions occurred on September 30, 2019.
The unaudited pro forma condensed combined statements of income for the twelve months ended September 30, 2019 and the nine months ended September 30, 2019, assume that the Transactions occurred on October 1, 2018.
The pro forma adjustments reported in these financial statements are based upon available information and certain assumptions that the Company’s management believes are reasonable. The unaudited pro forma condensed combined financial information is presented for informational purposes only and is not intended to represent or be indicative of what the results of operations or financial condition would have been had the Financing and Transactions actually occurred on the dates indicated, nor is it meant to be indicative of future results of operations or financial condition for any future period or as of any future date. The unaudited pro forma condensed combined financial information of the Combined Company should be read in conjunction with “Summary—The Transactions,” “Summary—Recent Developments,” “Summary—Summary Historical Consolidated Financial Information of Asbury and Unaudited Pro Forma Condensed Combined Financial Information of the Combined Company,” “Summary—Summary Historical Combined and Consolidated Financial Information of Park Place,” “Risk Factors,” “Use of Proceeds,” “Management’s Discussion and Analysis of Financial Condition and Results of Operations of the Company” as well as the audited and unaudited historical financial statements and related notes of the Company and the Park Place Business included in this offering memorandum.
Assumptions underlying the pro forma adjustments are described in the accompanying notes, which should be read in conjunction with the unaudited pro forma condensed combined financial information.
11
2. Sources of Purchase Price
The Company will acquire substantially all of the assets of, and certain real property related to, Park Place including goodwill and franchise rights intangible assets, real estate and leaseholds, and parts and fixed assets, in each case subject to certain adjustments described in the Acquisition Agreements. We anticipate that approximately $1.4 billion will be required to fund the purchase consideration (including vehicle inventory that we will acquire) and to pay approximately $20 million in estimated transaction fees and expenses related to the Acquisition. We intend to finance the Acquisition from the following sources:
| (In millions) |
||||
| Cash |
$ | 38.9 | ||
| Portion of the proceeds of Notes offered hereby |
525.0 | |||
| 2019 Senior Credit Facility |
386.9 | |||
| 2018 Wells Fargo Master Loan Facility |
69.0 | |||
| 2018 BofA Real Estate Facility |
97.2 | |||
| New BofA Real Estate Facility |
216.0 | |||
| Less: Capitalized deferred financing issuance costs |
(8.4 | ) | ||
|
|
|
|||
| $ | 1,324.6 | |||
|
|
|
|||
3. Purchase Price Allocation
Under the acquisition method of accounting, the purchase price is allocated to the tangible and intangible assets acquired and liabilities assumed based on information currently available. The following table summarizes the allocation of the estimated purchase price based on preliminary estimates of fair value:
| (In millions) |
||||
| Assets Acquired and Liabilities assumed |
||||
| Inventories |
$ | 228.9 | ||
| Other current assets |
77.7 | |||
| Property and equipment |
237.2 | |||
| Goodwill and intangible franchise rights |
785.0 | |||
| Operating lease right-of-use assets |
132.7 | |||
|
|
|
|||
| Total assets acquired |
1,461.5 | |||
|
|
|
|||
| Operating lease liabilities |
(132.7 | ) | ||
| Other liabilities |
(4.2 | ) | ||
|
|
|
|||
| Total liabilities assumed |
(136.9 | ) | ||
|
|
|
|||
| Net assets acquired |
$ | 1,324.6 | ||
|
|
|
|||
The fair value of property, plant and equipment acquired is summarized below:
| Fair
value |
Estimated useful life |
|||||||
| Land |
$ | 55.2 | N/A | |||||
| Buildings |
139.7 | 30-40 years | ||||||
| Leasehold improvements |
25.2 | |
Lesser of lease life or life of asset |
| ||||
| Furniture, fixtures and equipment |
17.1 | 3-10 years | ||||||
|
|
|
|||||||
| $ | 237.2 | |||||||
|
|
|
|||||||
The final purchase price allocation will be determined once the Company has completed the detailed valuations and necessary calculations, subject to consummation of the Acquisition. New and used vehicle
12
inventories at the Park Place dealerships vary significantly from time to time, and the actual value of vehicle inventories acquired will depend on the actual new and used vehicle inventories at the Park Place dealerships on the closing date of the Acquisition. If the acquired used vehicle inventory and/or new vehicle inventory, and accordingly, the purchase price for the Acquisition, increases significantly from the used vehicle inventory and/or new vehicle inventory as of September 30, 2019, the Company intends to use, with respect to new vehicle inventory, borrowings under the New Vehicle Floor Plan Facility to pay the additional purchase price of, if any, such new vehicle inventory and, with respect to used vehicle inventory, a combination of all or any of cash on hand, borrowings under the Used Vehicle Floor Plan Facility and borrowings under the Revolving Credit Facility to fund the additional purchase price of, if any, such used vehicle inventory.
The estimated fair values of assets acquired and liabilities assumed were based upon preliminary analysis performed for the preparation of the pro forma financial information and are subject to the final valuations that will be completed after consummation of the Acquisition. These estimates and assumptions are subject to change within the measurement period as additional information is obtained. A decrease in the fair value of the assets acquired or liabilities assumed in the Acquisition from the preliminary valuations presented would result in a dollar-for-dollar corresponding increase in the amount of goodwill resulting from the Acquisition. In addition, if the value of the property and equipment and other intangible assets is higher than the amount included in these unaudited pro forma condensed combined financial statements, it may result in higher depreciation and amortization expense than is presented herein. Any such increases could be material, and could result in the Company’s actual future financial condition or results of operations differing materially from that presented herein. As a result, the final purchase price allocation may differ materially from the preliminary purchase price allocation.
4. Reclassifications
Upon consummation of the Acquisition, the accounting policies applicable to Park Place will be conformed to those of the Company. The Company has identified preliminary adjustments to the presentation of the historical financial statements of Park Place to those of the Company based upon currently available information and assumptions management believes to be reasonable. The following reclassifications were made in order to conform with the corresponding treatment for the Company’s financial reporting:
| • | Courtesy vehicles, net of $64.0 million and subscription rental vehicles, net of $9.1 million, as of September 30, 2019, were reclassified to other current assets. |
| • | Floor plan notes payable-trade, and floor plan notes payable-non-trade, related to courtesy vehicles and subscription vehicles, of $44.3 million and $39.9 million, respectively, as of September 30, 2019, were reclassified to accounts payable and accrued liabilities. |
13
| • | The following amounts of sales and cost of sales are presented in the categories shown below to align with the Company’s presentation: |
| Nine Months Ended September 30, 2019 |
Three Months Ended December 31, 2018 |
LTM Period | ||||||||||
| (In millions) | ||||||||||||
| Revenue |
||||||||||||
| New vehicle |
$ | 620.2 | $ | 271.8 | $ | 892.0 | ||||||
| Used vehicle |
474.1 | 149.1 | 623.2 | |||||||||
| Parts and service |
206.4 | 66.4 | 272.8 | |||||||||
| Finance and insurance, net |
21.9 | 8.3 | 30.2 | |||||||||
| Other |
7.2 | 2.4 | 9.6 | |||||||||
| Cost of Sales |
||||||||||||
| New vehicle |
$ | 574.9 | $ | 252.4 | $ | 827.3 | ||||||
| Used vehicle |
447.9 | 141.8 | 589.7 | |||||||||
| Parts and service |
91.1 | 29.9 | 121.0 | |||||||||
| Other |
0.5 | 0.1 | 0.6 | |||||||||
| • | The following line items were reclassified to selling, general and administrative expenses for the nine months ended September 30, 2019, and the three months ended December 31, 2018: variable selling expense, advertising expense, personnel expense, management fee expense, deferred compensation expense, profits interest obligation expense, fixed expense (excluding the amounts reclassified to depreciation and amortization described below), and semi-fixed expense (excluding the amounts reclassified to other interest expense, net described below). |
| • | Interest income on the floor plan offset facility for the nine months ended September 30, 2019 and the three months ended December 31, 2018, respectively, was reclassified to floor plan interest expense. |
| • | Floor plan interest expense on subscription vehicles of $0.3 million and $0.1 million for the nine months ended September 30, 2019 and the three months ended December 31, 2018, respectively, was reclassified from floor plan interest expense to other interest expense, net. |
| • | Floor plan interest expense on courtesy vehicles of $2.1 million and $0.7 million for the nine months ended September 30, 2019 and the three months ended December 31, 2018, respectively, was reclassified from semi-fixed expense to other interest expense, net. |
| • | $11.5 million and $3.7 million was reclassified from fixed expenses to depreciation and amortization for the nine months ended September 30, 2019, and the three months ended December 31, 2018, respectively. |
Management of the Company is currently in the process of conducting a more detailed review of accounting policies used in the historical financial statements of Park Place to determine if differences in accounting policies require any further reclassification to conform to the Company’s accounting policies and classifications. As a result, we may identify additional differences between the accounting policies of the two companies that, when conformed, could have a material impact on these unaudited pro forma condensed combined financial statements.
5. Pro forma adjustments
The pro forma adjustments set forth in the unaudited pro forma condensed combined financial information reflect the following:
| a. | The elimination of assets and liabilities not assumed in connection with the Transaction. |
14
| b. | The elimination of inventory not assumed in the Transaction and recording the preliminary fair value estimate of inventory acquired. |
| c. | The preliminary estimated fair value of property and equipment acquired and related depreciation expense. |
| d. | The right-of-use asset and lease liabilities for operating leases entered into and assumed in the Acquisition. |
| e. | The preliminary estimate of fair value of intangible assets and goodwill arising from the Acquisition less the adjustment to remove Park Place’s historical goodwill and intangible assets. |
| f. | The income tax effect of the pro forma adjustments reflected in the Condensed Combined Statements of Income. |
| g. | Changes in indebtedness incurred in connection with the Financing, and resulting from the indebtedness of Park Place to be repaid at the consummation of the Acquisition, and not assumed by the Company in the Acquisition. |
| h. | The equity impact of the elimination of historical equity balances of Park Place. |
| i. | Changes in interest expense resulting from the Financing, including amortization of estimated debt issuance costs, and resulting interest expense that were not incurred on the indebtedness of Park Place, which were not assumed by the Company in the Transactions. |
| The $1,294.1 million of indebtedness the Company expects to incur in connection with the Financing includes $525.0 million borrowings with respect to the Notes offered hereby (which is less than the $1,125.0 million of Notes being offered hereby), as well as additional borrowings under the 2019 Credit Facility, the 2018 Wells Fargo Master Loan Facility, the 2018 BofA Real Estate Facility and the New BofA Real Estate Facility, and assumes a weighted average estimated interest rate of 4.3% per annum. A change of 0.125% per annum in the assumed interest rate for the variable interest rate Financings would increase or decrease interest expense on a pro forma basis by $0.9 million. In addition, if the Company does not obtain financing on the terms as anticipated in the unaudited pro forma condensed combined statements of income and borrows under the Bridge Loan Facility contemplated by the Commitment Letter, it would be subject to interest expense and costs at rates higher than those assumed. Any borrowings under the Bridge Credit Facility would be classified as short-term debt in current liabilities. See “Summary—The Transactions” and “Description of Other Indebtedness.” |
15
OFFERING MEMORANDUM SUMMARY
This summary highlights selected information included in this offering memorandum. The following summary does not contain all of the information that you should consider before deciding whether to invest in any series of Notes and is qualified in its entirety by the more detailed information appearing elsewhere in the offering memorandum. You should carefully read the entire offering memorandum, including the sections titled “Risk Factors,” “Management’s Discussion and Analysis of the Financial Condition and Results of Operations of the Company” and “Unaudited Pro Forma Condensed Combined Financial Information of the Combined Company” before investing in any series of Notes. All references to the “Acquisition” refer to the acquisition of substantially all of the assets of the businesses of the Park Place Dealership family of entities (collectively, “Park Place”) pursuant to that certain Asset Purchase Agreement, dated as of December 11, 2019 (the “Asset Purchase Agreement”), among the Company, Park Place, and the other parties thereto (collectively, the “Sellers”) and to related agreements and transactions. Additionally, except as otherwise indicated or as the context otherwise requires, all references in this offering memorandum to (i) “Asbury,” the “Company,” “we,” “us” or “our” refer to Asbury Automotive Group, Inc. and its subsidiaries, prior to the Acquisition and (ii) the “Combined Company” refer to Asbury Automotive Group, Inc. and its subsidiaries, after giving effect to the Acquisition.
Overview
Asbury Automotive Group, Inc., headquartered in Duluth, Georgia, is the 7th largest U.S.-based franchised automotive retailer, operating 107 franchises (88 dealership locations) representing 31 brands of automobiles and 25 collision repair centers in 17 metropolitan markets within 10 states as of September 30, 2019. We offer an extensive range of automotive products and services, including new and used vehicles; vehicle repair and maintenance services, replacement parts and collision repair services (collectively referred to as “parts and services” or “P&S”); and finance and insurance products (“F&I”).
Park Place, based in Dallas, Texas, is one of the country’s largest luxury dealer groups, with an attractive portfolio of high volume, award-winning, luxury dealerships and high-quality real estate. Park Place is estimated to be the #2 dealer group in the U.S. based on revenue per dealership in 2019. Park Place consists of a collection of:
| • | ten luxury dealerships, including one dealership scheduled to open in the first quarter of 2020; |
| • | an auto auction business for wholesaling used cars; and |
| • | a subscription service platform that offers customers access to a range of luxury vehicles for a monthly fee. |
The operating assets expected to be acquired include 20 new vehicle franchises, 18 of which are located in the Dallas/Fort Worth market: 3 Mercedes-Benz, 2 Lexus, 1 Jaguar, 1 Land Rover, 1 Porsche, 1 Volvo, 1 Bentley, 1 Rolls Royce, 1 McLaren, 1 Maserati, 1 Karma, 1 Koenigsegg and 3 Sprinter. In addition to these 18 new vehicle franchises, Park Place has rights to 1 Jaguar and 1 Land Rover open point in Austin, Texas that are both expected to open under a single dealership facility late in the first quarter of 2020.
As of September 30, 2019, three of Park Place’s franchises are ranked among the top 10 stores in volume in the country among their franchise: Mercedes-Benz Dallas, Porsche Dallas and Bentley Dallas. In addition, the Jaguar/Land Rover Dallas and both Lexus franchises are ranked among the top 15, and the Volvo franchise is ranked among the top 20 stores in volume.
16
We believe that the Acquisition will create a substantially larger and more diversified enterprise with enhanced profitable growth opportunities and a larger base of stable, recurring revenue from the high margin parts and service business. For the twelve months ended September 30, 2019 (the “LTM Period”), the Combined Company generated pro forma revenue of $8.9 billion, pro forma net income of $206.0 million and Pro Forma Adjusted EBITDA of $447.1 million, inclusive of an estimated $20 million of run-rate synergies and operational improvements.
Combination Rationale
We believe the Acquisition strengthens our dual strategy of driving operational excellence and deploying capital to its highest return. We believe Park Place is a highly efficient operator of luxury stores, with a strong base of loyal clients and approximately 2,100 team members throughout the growing Dallas/Fort Worth market. We expect that our demonstrated success acquiring and integrating well-run businesses will provide us the opportunity to leverage the best practices of both businesses going forward.
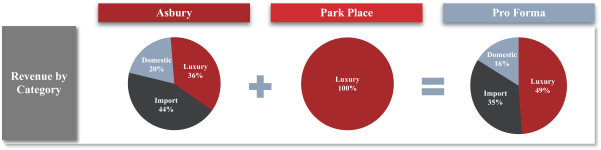
After giving effect to the Acquisition, the Combined Company’s pro forma revenue mix for the LTM Period will be enhanced, with approximately 30% exposure to the Texas market and 50% from luxury brands. The luxury segment has historically delivered strong and stable margins that are significantly above those achieved by mid-line import and domestic brands. Luxury stores have historically been more resilient in economic downturns, have fewer dealers nationwide and derive a higher portion of gross profit from parts and service. According to IHS Markit and MotorIntelligence, the Dallas/Fort Worth market had a 30% higher penetration of luxury new vehicle sales than the national average in 2019. Additionally, the Dallas/Fort Worth market is expected to experience population growth significantly higher than the national forecast through 2023 according to IHS Markit.
17
The below figure summarizes the highly complementary scale and brand diversity benefits of the Acquisition:
Brand and Category Mix
For the LTM Period ended September 30, 2019
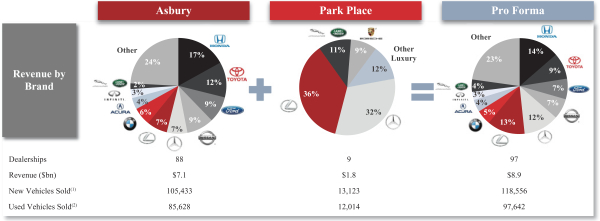
| (1) | Including fleet. |
| (2) | Retail units only. |
We believe that we can achieve meaningful run-rate synergies and operational improvements of at least $20 million within three years following the closing of the Transactions, consisting of (1) a reduction in corporate costs, (2) lower servicing costs by maintaining key store-level accounting and administrative activities in our shared service centers, (3) the ability to leverage our scale to reduce costs related to purchasing certain equipment, supplies, and services through national vendor relationships and (4) expected operational improvements primarily with respect to F&I and to a lesser extent P&S. See “Risk Factors—Risks Related to the Acquisition—The Acquisition, if consummated, will create numerous risks and uncertainties which could adversely affect our business and results of operations.”
Asbury Automotive
We are one of the largest automotive retailers in the United States by revenue. As of September 30, 2019, we owned and operated 107 new vehicle franchises (88 dealership locations) representing 31 brands of automobiles and 25 collision repair centers in 17 metropolitan markets within 10 states. Our stores offer an extensive range of automotive products and services, including new and used vehicles, P&S and F&I. For the LTM Period, our total revenue brand mix consisted of 44% imports, 36% luxury and 20% domestic.
18
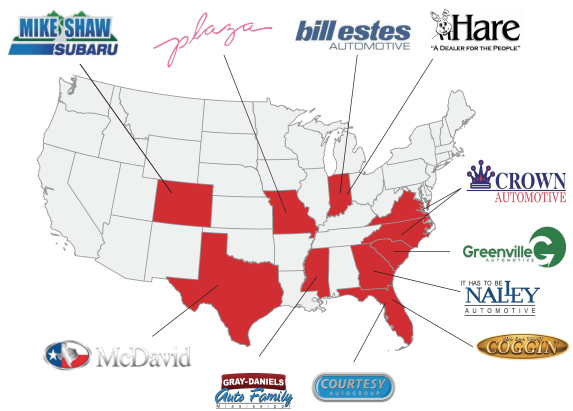
Our retail network is made up of dealerships operating primarily under the following locally-branded dealership groups.
Our operations provide a diverse revenue base that we believe mitigates the impact of fluctuations in new vehicle sales volumes and gross profit margins. In addition, our geographic footprint decreases our exposure to regional economic conditions and our brand diversification decreases our exposure to manufacturer-specific risks, such as brand perception or production disruptions. For the nine months ended September 30, 2019, 48% of our gross profit was derived from our parts and service business, which historically has been more stable throughout economic cycles.
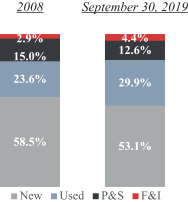
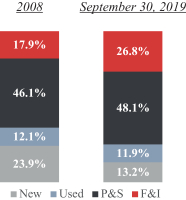
| • | New Vehicle Sales. As of September 30, 2019, our dealerships represented a diverse portfolio of 31 brands. In the nine months ended September 30, 2019, we sold 77,636 new vehicles through our dealerships. Our new vehicle revenue represented 53% of our total revenue and 13% of our total gross profit for the nine months ended September 30, 2019. |
| • | Used Vehicle Sales. We sell used vehicles at all of our dealership locations. In the nine months ended September 30, 2019, we sold 66,330 used vehicles through our dealership network. Our used vehicle business, which generally has higher gross margins than our new vehicle business, accounted for approximately 30% of our total revenue and 12% of our total gross profit for the nine months ended September 30, 2019. |
| • | Parts and Service. We provide vehicle maintenance and repair services in the markets of all of our franchised dealerships, primarily for the vehicle brands sold at those dealerships, and sell replacement parts. In addition, we maintained 25 free-standing collision repair centers either on the |
19
| premises of, or in close proximity to, our dealerships as of September 30, 2019. Our parts and service business accounted for approximately 13% of our total revenue and 48% of our total gross profit for the nine months ended September 30, 2019. |
| • | Finance and Insurance. Through our F&I business, we arrange, and receive commissions for, third-party financing of the sale or lease of new and used vehicles to customers, as well as offer a number of aftermarket products. We also generate F&I revenue from the receipt of certain fees paid to us under agreements with preferred lenders. Our F&I business generated approximately 4% of our total revenue and 27% of our total gross profit for the nine months ended September 30, 2019. |
For the LTM Period, the Company generated revenue of $7.1 billion and Adjusted EBITDA of $337.7 million. For a reconciliation of the Company’s Adjusted EBITDA to net income, which is the most directly comparable GAAP financial measure, please see “Summary Historical Consolidated of Asbury and Unaudited Pro Forma Condensed Combined Financial Information of the Combined Company.”
Park Place
Founded in 1987, Park Place is a founder-owned business that has become one of the country’s largest and most prominent luxury dealer groups. Park Place engages in the retail and wholesale of new and used automobiles of multiple manufacturers, and also provides financing, auto parts, repair and maintenance services.
Park Place consists of 9 dealerships concentrated in the Dallas-Fort Worth-Arlington metroplex (“Dallas Metro”), and will expand into the Austin, Texas market with a new Jaguar-Land Rover dealership expected to open in the first quarter of 2020. Park Place includes a vehicle subscription service, known as the “Select Subscription Service,” and an auto auction business, known as the “Auto Auction.”
The Dallas Metro market has a population of 7.4 million, which is the 4th largest in the United States. According to Urban Science, the Dallas Metro market is expected to experience sustained continued market growth above the national average, including with respect to population growth, household annual income growth and household income distribution.
Additionally, we believe Park Place has a track record of having superior customer service and well-maintained dealerships which make the business well positioned to capture market share in a metro area that historically has a higher concentration of luxury new vehicle sales as compared to the national average.
For the LTM Period, Park Place generated revenue of $1.8 billion and Adjusted EBITDA of $75.0 million. For a reconciliation of Park Place’s Adjusted EBITDA to net income, which is the most directly comparable GAAP financial measure, please see “Summary Historical Consolidated Financial Information of Park Place.”
Industry Overview
In the United States, the franchised automotive dealer industry is the largest retail sector by revenue, where nearly all new cars and light trucks are purchased in the United States. According to Edmunds.com and NADA DATA 2019, the total addressable market for new and used vehicle sales in 2018 was $1.4 trillion on 57 million units, with new vehicles representing $0.6 trillion and 17 million units, and used vehicles representing $0.8 trillion and 40 million units. The U.S. franchised automotive retail market is highly fragmented, with no single dealership group accounting for more than 2% of industry revenue. Key trends that we expect to continue to impact our industry include:
| • | Moderately declining new vehicle unit sales—The seasonally adjusted annual rate (“SAAR”) of new vehicle sales in the United States hit a record peak of 17.5 million units in 2016 and reached |
20
| 17.0 million units in 2019. In contrast to other business models in the automotive supply chain, such as part suppliers and original equipment manufacturers (“OEMs”), new vehicle sales are not the primary driver of profits for franchised dealerships. However, the volume of new vehicle sales over time is a critical driver of dealership profitablity from higher margin revenue streams such as sales of certified pre-owned used vehicles, P&S, and F&I products. New vehicle sales are driven by a variety of economic factors such as availability and cost of financing, disposable income, unemployment rates and exchange rates. Additionally, improvements in product quality, safety and technology features drive demand. We believe that our exposure to brands with higher than average new product introductions expected over the next five years, such as Ford, Mercedes-Benz, BMW and Toyota, will postively impact our new vehicle sales compared to national averages. |
| • | Rapidly growing used car market—According to Factbook 2020, the number of vehicles in operation in the United States grew every year during the 2012 to 2018 time period from 249 million to 278 million, representing an increase of approximately 12% in the aggregate and a compound annual growth rate of 1.8%. A larger number of vehicles in operation increases the market for high margin P&S revenue. In addition, used vehicles represented approximately 70% of unit sales in 2018 with a total addressable market of $830 billion.1 Used vehicle unit sales have historically been less volatile and less sensitive to economic cycles than new vehicle unit sales (other than the sale of new luxury vehicles). Used vehicle sales generate higher gross margins than new vehicles and have consistently contributed a higher portion of gross profits than new vehicles to overall dealership profitability. |
| • | Investments in P&S operations enhance franchised dealership business model—Since the 2008-2009 recession, we believe franchised automotive retailers have made substantial investments in the high margin parts and service business to take market share from independent providers by focusing on increasing capacity, improving customer service and leveraging their scale and OEM relationships to invest in the capital equipment and training required to service vehicles with increasingly more technology. |
| • | Growth in F&I income per vehicle has more than offset the decline in gross profit per new vehicle over the last decade—Dealer groups have experienced growing F&I revenue per vehicle in the last decade. Improvement in employee training, inflation in vehicle pricing, as well as the renegotiation of contribution to insurance underwriters, has helped improve our F&I income per vehicle. |
| • | Luxury dealerships outperform import and domestic dealerships—Luxury dealerships tend to have higher and more stable vehicle gross margins, fewer dealerships per capita and a greater portion of revenue derived from P&S. Additionally, we believe luxury brands benefit from higher customer loyalty and a customer demographic that is less price-sensitive, which we believe was reflected in our operations during the 2008-2009 recession. In 2008, our pre-tax store level income for our luxury dealerships declined by 23%, compared to 46% and 47% for our import and domestic dealerships, respectively. In 2009, our pre-tax store level income for our luxury dealerships increased by 3%, compared to 1% growth in import dealerships and a 12% decline in our domestic dealerships. |
| 1 | Edmunds.com Inc. 2019 Used Vehicle Outlook report for number of used vehicles sold and NADA DATA 2019 report for average vehicle price. |
21
Our Competitive Strengths
Leading dealership group with growing scale in the fragmented auto retail sector. We are the 7th largest franchised dealership group in the United States based on revenue for the year ended December 31, 2018. Our size and scale enhances our relationships with OEMs and key finance partners, leverages our investments in new technologies/systems and corporate overhead across a larger revenue base and maximizes the benefits of implementing best practices within our dealership group. Additionally, the concentration of our dealerships in certain markets and geographies increases operational and personnel efficiencies.
Top 10 U.S. Based Franchised Dealership Groups by Revenue for the Year Ended December 31, 2018
($ in millions)
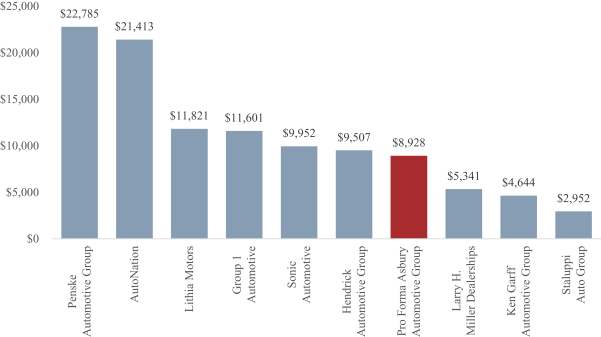
Source: Automotive News.
Our gross profit is increasingly driven by more stable, higher-margin revenue streams. Since the last recession in 2008-2009, we have made significant investments in our fixed operations and implemented strategic initiatives that have created a more resilient, higher-margin business model that is less reliant on vehicle sales. In our P&S business, we have added capacity, increased throughput and invested in technology to improve customer satisfaction, which has allowed us to expand our margins and take market share from independent service providers. In our F&I business, we have added headcount at the dealership level, increased the quality of our training programs and invested in consumer-friendly technologies, which have resulted in higher F&I income per vehicle. The figure below illustrates the transformation of our revenue and gross profit mix from 2008 as compared to the nine months ended September 30, 2019.
22
Asbury Revenue and Gross Profit Contribution (2008 vs Nine Months Ended September 30, 2019)
| Revenue Mix | Gross Profit Mix | |
|
| |
Strong margin profile. We strive to drive operational excellence across our dealership platform to consistently deliver above industry average profit margins, and we have expanded our Adjusted EBITDA margins from below 3% in 2007 to 4.8% for the LTM Period. The Acquisition is expected to further expand our Adjusted EBITDA margins as a Combined Company. We believe that our Adjusted EBITDA margins will continue to expand from the sharing of best practices between companies, the realization of identified run-rate synergies from duplicative corporate overhead functions and the implementation of Asbury’s products and processes within Park Place’s dealerships to increase the F&I income per vehicle sold. We have confidence in the success of these initiatives based on our track record of acquiring and integrating similar dealerships.
Highly variable cost structure and significant fixed cost absorption from stable P&S revenue. Our cost structure is highly variable at the dealership and corporate level, which minimizes the profit margin impact from any decline in vehicle sales. From 2008 to 2018, our selling, general and administrative expenses (“SG&A”) as a percentage of gross profit have declined from approximately 81% to approximately 69%, and the profits we generate from our P&S business cover an increasing portion of our fixed costs. We estimate that over 70% of our SG&A is variable. We have created a hybrid strategy to leverage fixed costs across our dealership portfolio that (1) allows our higher volume stores the flexibility to add headcount for improved local customer service and (2) offers our lower volume stores access to a high quality shared service center to maintain dealership-level profitability.
Strong free cash flow generation to reduce our leverage and support our strong credit profile. Our goal is to generate cash flow that will allow us to achieve a total net leverage target of less than 3.0x. Our financial policy and capital allocation strategy is focused on reducing funded debt. We expect our continued focus on operational excellence and on a well-defined integration plan for the Acquisition to further reduce our net leverage ratio. In addition, we will continue to monitor and manage working capital to maintain a strong liquidity profile.
23
Business Strategy
We seek to create long-term value in our business by striving to drive operational excellence and deploy capital to its highest risk adjusted returns. To achieve these objectives, we employ the strategies described below.
Invest in and attract top talent to improve backend operations and front-line service. We believe the core of our business success lies in our talent pool, so we are focused on obtaining and retaining the best people. Our executive management team has extensive experience in the auto retail sector, and is able to leverage experience from all positions throughout the Company. In addition, we believe that local management of dealership operations enables our retail network to provide market specific responses to sales, customer service and inventory requirements. The general manager of each of our dealerships is responsible for the operations, personnel and financial performance of that dealership as well as other day-to-day operations.
Implement best practices and improve productivity. We have discipline-specific executives who focus on increasing the penetration of current services and expanding the breadth of our offerings to customers through the implementation of best practices and continuous training on our technology solutions throughout our dealership network. In addition, we have marketing initiatives designed to attract customers to our online channels and mobile applications.
We tie management and employee compensation at various operational levels to performance through incentive-based pay systems based on various metrics, including dealership profitability, departmental profitability, customer satisfaction and individual performance, as appropriate. In addition, a portion of management’s compensation is variable-based in nature, including an annual cash bonus based on achieving certain EBITDA targets and a component of equity compensation tied to our financial performance in comparison to our peer group.
Provide an exceptional guest experience. We are focused on providing a high level of customer service and have designed our dealerships’ services to meet the needs of an increasingly sophisticated and demanding automotive consumer. We endeavor to establish relationships that we believe will result in both repeat business and additional business through customer referrals. Furthermore, we provide our dealership managers with appropriate incentives to employ efficient selling approaches, engage in extensive follow-up to develop long-term relationships with customers and extensively train our sales staff to meet customer needs.
Centralize, streamline and automate processes. Our Dealership Support Center (“DSC”) management is responsible for our capital expenditure and operating strategy, while the implementation of our operating strategy rests with our market-based management teams and each dealership management team based on the policies and procedures established by DSC management. DSC management and our market-based management teams continuously evaluate the financial and operating results of our dealerships, as well as each dealership’s geographical location, and from time to time, make decisions to evaluate new technologies and/or processes to further refine our operational processes.
Leverage our scale and cost structure to improve our operating efficiencies. We are positioned to leverage our significant scale so that we are able to achieve competitive operating margins by centralizing and streamlining various back-office functions. We are able to improve financial controls and lower servicing costs by maintaining key store-level accounting and administrative activities in our shared service centers, and we leverage our scale to reduce costs related to purchasing certain equipment, supplies and services through national vendor relationships. Similarly, we are able to leverage our scale to implement these best practices when integrating newly acquired dealerships allowing us to continue to improve our operating efficiencies.
24
Successfully integrate Park Place and maximize the benefits of this transformational Acquisition. We have a well-defined integration plan for Park Place. Park Place already performs at a high level and is operated by seasoned general managers, with an average tenure of approximately 20 years, who we expect to retain. Our integration strategy is focused on achieving cost savings at a corporate level from duplicative functions and implementing our training programs and F&I product offerings at Park Place to achieve higher F&I income per vehicle sold. Asbury and Park Place utilize the same operational, human resources and accounting information technology systems, which we expect to support as part of the integration process. Additionally, we have ample internal resources at Asbury to manage the integration process, as the 10 dealership locations (including Jaguar/Land Rover Austin) of Park Place represent an increase of approximately 10% of our existing store count.
Deploy Capital to Highest Returns. Our capital allocation decisions are made within the context of maintaining sufficient liquidity and a prudent capital structure. We target a 2.5x to 3.0x net leverage ratio, and our primary focus for capital allocation will be to decrease our debt levels; however, we believe our cash position and borrowing capacity, combined with our current and expected future cash generation capability, provides us with financial flexibility to enhance shareholder value through capital deployment by reinvesting in our business, acquiring dealerships as well as repurchasing shares, when prudent.
Continue to invest in our business. We continually evaluate our existing dealership network and seek to make strategic investments that will increase the capacity of our dealerships and improve the customer experience. In addition, we continue to execute on our strategy of selectively acquiring our leased properties where financing rates make it attractive to be an owner and provide us a further means to finance our business.
Evaluate opportunities to refine our dealership portfolio. We continually evaluate the financial and operating results of our dealerships, as well as each dealership’s geographical location and, based on various financial and strategic rationales, may make decisions to dispose of dealerships to refine our dealership and real estate portfolio. We also evaluate dealership acquisition opportunities based on market position and geography, brand representation and availability, key personnel and other factors.
25
Recent Developments
Unaudited Quarterly Results of Operations
Set forth below are unaudited financial results and other data for the Company and preliminary estimated financial results and other data for Park Place that have been prepared by management of the Company and Park Place based on currently available information.
The following table presents selected preliminary unaudited financial results as of, and for, the three months ended December 31, 2019. The unaudited financial results reflects the Company’s preliminary estimates based on currently available information. The Company’s financial closing procedures for the three months ended December 31, 2019, are not yet complete and, as a result, the Company’s final results upon completion of the Company’s closing procedures may vary from the preliminary estimates. The estimates were prepared by the Company’s management, based upon a number of assumptions, in connection with preparation of the Company’s
26
financial statements and completion of the Company’s preliminary review for the quarter ended December 31, 2019. Additional items that would require material adjustments to the preliminary financial information may be identified. Estimates of results are inherently uncertain and subject to change, and the Company undertakes no obligation to update this information. These estimates should not be viewed as a substitute for interim financial statements prepared in accordance with U.S. GAAP. In addition, the preliminary results are not necessarily indicative of the actual results that may be reported. The Company’s independent registered public accounting firm has not conducted a review of and does not express an opinion or any other form of assurance with respect to, these preliminary estimates.
The preliminary estimated financial information presented below for Park Place are forward-looking statements, based on internal and unaudited financial reporting and are subject to change. The actual financial results may differ from such preliminary estimates and such differences could be material. Park Place’s actual results may vary from the estimated preliminary results presented here due to the completion of its financial closing procedures, final adjustments and other developments that may arise between now and the time the financial results for the three months ended December 31, 2019 and the year ended December 31, 2019 are finalized. Accordingly, you should not place undue reliance on such preliminary estimated financial information. See the sections titled “Risk Factors,” “Statement Regarding Forward-Looking Information,” “Summary Historical Consolidated Financial Information of Asbury and Unaudited Pro Forma Condensed Combined Financial Information of the Combined Company,” “Summary Historical Consolidated Financial Information of Park Place” and “Management’s Discussion and Analysis of Financial Condition and Results of Operations of the Company” for additional information regarding factors that could result in differences between Park Place’s preliminary estimated financial results and other data presented below and the actual financial and other data we will report for the three months ended December 31, 2019 or the year ended December 31, 2019. For a discussion of our and Park Place’s non-GAAP financial measures, see “Special Note Regarding Non-GAAP Financial Measures.”
Company Financial Results
|
As of and for the Three Months |
||||||||
| 2018 |
2019 |
|||||||
| ($ in millions, except share and per share data or as otherwise noted) |
||||||||
| Revenue: |
||||||||
| New vehicle |
$ | 1,022.4 | $ | 1,039.4 | ||||
| Used vehicle |
473.4 | 541.2 | ||||||
| Parts and service |
211.1 | 229.7 | ||||||
| Finance and insurance, net |
77.3 | 83.7 | ||||||
|
|
|
|
|
|||||
| Total revenue |
$ | 1,784.2 | $ | 1,894.0 | ||||
| Gross profit: |
||||||||
| New vehicle |
$ | 43.9 | $ | 44.7 | ||||
| Used vehicle |
29.3 | 31.3 | ||||||
| Parts and service |
131.3 | 141.9 | ||||||
| Finance and insurance, net |
77.3 | 83.7 | ||||||
|
|
|
|
|
|||||
| Total gross profit |
$ | 281.8 | $ | 301.6 | ||||
| Average gross profit per unit (in thousands): |
||||||||
| New vehicle |
$ | 1,579 | $ | 1,619 | ||||
| Used vehicle retail |
1,518 | 1,387 | ||||||
| Finance and insurance, net |
1,641 | 1,678 | ||||||
| Adjusted EBITDA(1) |
82.3 | 89.6 | ||||||
| Total current assets |
1,553.0 | 1,602.6 | ||||||
| Income from continuing operations |
77.3 | 79.1 | ||||||
| Net income |
40.4 | 43.6 | ||||||
| Earnings per common share (diluted) |
2.06 | 2.26 | ||||||
| Long-term debt |
905.3 | 939.4 | ||||||
| Shareholders’ equity |
473.2 | 646.3 | ||||||
| Weighted average common shares outstanding (diluted) (in millions) |
19.6 | 19.3 | ||||||
27
| (1) | See below for a reconciliation of Adjusted EBITDA to the most directly comparable measure calculated in accordance with GAAP, net income. |
|
Three Months Ended December 31, |
||||||||
| 2018 |
2019 |
|||||||
| ($ in millions) | ||||||||
| Net income |
$ | 40.4 | $ | 43.6 | ||||
| Adjustments to reconcile certain non-GAAP terms |
||||||||
| Depreciation and amortization |
8.5 | 9.5 | ||||||
| Income tax expense |
13.7 | 13.6 | ||||||
| Swap and non-floor plan interest expense, net |
13.7 | 13.7 | ||||||
|
|
|
|
|
|||||
| EBITDA |
$ | 76.3 | $ | 80.4 | ||||
|
|
|
|
|
|||||
| Stock-based compensation expense |
2.3 | 2.1 | ||||||
| Franchise rights impairment |
3.7 | 7.1 | ||||||
| Real estate related charges |
— | 0.6 | ||||||
| Legal settlements |
— | (0.6 | ) | |||||
|
|
|
|
|
|||||
| Adjusted EBITDA(a) |
$ | 82.3 | $ | 89.6 | ||||
|
|
|
|
|
|||||
| (a) | EBITDA and Adjusted EBITDA are not calculated in accordance with GAAP. See “Special Note Regarding Non-GAAP Financial Measures” and “Summary Historical Consolidated of Asbury and Unaudited Pro Forma Condensed Combined Financial Information of the Combined Company” for more information about EBITDA and Adjusted EBITDA, including their limitations. |
| • | For the three months ended December 31, 2019, revenue for the Company was $1,894.0 million, as compared to revenue of $1,784.2 million for the three months ended December 31, 2018, an increase of 6.2%. The increase in revenue is attributable to increased revenue in all business lines, but primarily used vehicle, which grew 14% compared to the prior year period. |
| • | For the three months ended December 31, 2019, new vehicle revenue for the Company was $1,039.4 million, as compared to new vehicle revenue of $1,022.4 million for the three months ended December 31, 2018, an increase of 1.7%. The increase in new vehicle revenue is primarily attributable to an 11% increase in luxury brand revenues partially offset by decreases in our mid-line import and mid-line domestic brands. |
| • | For the three months ended December 31, 2019, used vehicle revenue for the Company was $541.2 million, as compared to used vehicle revenue of $473.4 million for the three months ended December 31, 2018, an increase of 14.3%. The increase in used vehicle revenue is attributable to a 15% increase in used retail unit sales in addition to a 9% increase in wholesale revenue. |
| • | For the three months ended December 31, 2019, P&S revenue for the Company was $229.7 million, as compared to P&S revenue of $211.1 million for the three months ended December 31, 2018, an increase of 8.8%. The increase in P&S revenue is attributable to a 9% increase in customer pay revenue, a 12% increase in warranty revenue and a 6% increase in wholesale parts revenue. |
| • | For the three months ended December 31, 2019, F&I, net for the Company was $83.7 million, as compared to F&I, net of $77.3 million for the three months ended December 31, 2018, an increase of 8.3%. The increase in F&I, net is attributable to a 6% increase in new and used retail unit sales and a 2% increase in F&I revenue per vehicle sold. |
28
Preliminary Park Place Estimates
Park Place expects total revenue for the three months ended December 31, 2019 to be approximately equal to total revenue for three months ended December 31, 2018, driven by a slight decline in new vehicles revenue and unit volume, offset by slight increases in used vehicle revenue and unit volume, and strong year over year revenue growth in its P&S and F&I business. Park Place expects higher gross margins year over year on its new vehicle, used vehicle and P&S revenues, resulting in an increase of over 100 basis points in its year over year gross margin.
Recent Acquisition and Dispositions
On or since September 30, 2019, we have acquired dealerships or have entered into a number of agreements that are expected to modify the composition of our portfolio of dealerships, including the following:
| • | On September 30, 2019, we acquired the Mike Shaw Subaru dealership operation in Thornton, Colorado (the “Shaw Dealership”). The Shaw Dealership had total revenue for the year ended December 31, 2019 of approximately $104 million. |
| • | On January 27, 2020, we acquired the John Elway Chrysler, Dodge, Jeep dealership operating in Denver, Colorado (the “Elway Dealership”). This dealership had total revenue for the year ended December 31, 2019 of approximately $124 million. |
| • | On December 6, 2019, we signed an agreement to sell our five Gray Daniels dealerships operating in the Jackson, Mississippi area (the “Gray Daniels Dealerships”). We expect to close this transaction in the first quarter of fiscal year 2020, subject to manufacturer approval and satisfaction of other customary closing conditions. These dealerships had total revenue for the year ended December 31, 2019 of approximately $334 million. |
| • | On December 11, 2019, we signed an agreement to sell our Nalley Nissan dealership operating in metropolitan Atlanta (the “Nalley Nissan Dealership”). We expect to close this transaction in the first quarter of fiscal year 2020, subject to manufacturer approval and satisfaction of other customary closing conditions. The dealership had total revenue for the year ended December 31, 2019 of approximately $77 million. |
| • | We expect the combined impact of the purchase price for the acquisition of the Elway Dealership and the net proceeds from the expected dispositions of the Gary Daniels Dealerships and the Nalley Nissan Dealership to generally approximate $44 million of proceeds after paying off associated mortgage debt. |
The “Unaudited Pro Forma Condensed Combined Financial Information of the Combined Company” included elsewhere in this offering memorandum does not give effect to these transactions.
29
New BofA Real Estate Facility
In connection with the Transactions, we intend to enter into the New BofA Real Estate Facility, which will provide for term loans expected to mature seven years from the initial funding of the facility. Borrowings under the New BofA Real Estate Facility are expected to be guaranteed by us and each of our operating dealership subsidiaries that own or lease the real estate being financed under the New BofA Real Estate Facility, and are expected to be collateralized by first priority liens, subject to certain permitted exceptions, on all of the real property financed thereunder. In connection with the Transactions, we intend to borrow approximately $216 million under the New BofA Real Estate Facility, and have the ability to make a single draw of an additional amount up to 80% of the appraised value of the property expected to be acquired at or after the consummation of the Acquisition. See “—The Transactions—Acquisition Financing” and “Description of Other Indebtedness—New BofA Real Estate Facility.”
Amendments to 2019 Senior Credit Facility
In connection with the Acquisition, we have obtained amendments, among other things, to (1) increase the aggregate commitments under the Revolving Credit Facility to $350,000,000, (2) increase the aggregate commitments under the New Vehicle Floorplan Facility to $1,350,000,000 and (3) increase the aggregate commitments under the Used Vehicle Floorplan Facility to $200,000,000. These amendments to increase the aggregate commitments will become effective concurrently with the consummation of the Acquisition. In connection with the consummation of the Acquisition, we intend to borrow approximately $387 million under the 2019 Senior Credit Facility with respect to existing Park Place vehicle inventory, consisting of approximately $237 million under the New Vehicle Floor Plan Facility and approximately $150 million under the Used Vehicle Floor Plan Facility. See “—The Transactions—Acquisition Financing” and “Description of Other Indebtedness—2019 Senior Credit Facility.”
Conditional Redemption Notice for Existing Notes
On February 3, 2020, we are issuing a conditional notice of redemption to the holders of our Existing Notes, notifying such holders that we intend to redeem all of the Existing Notes on March 4, 2020. The redemption of the Existing Notes is conditioned upon the consummation of this offering. If redeemed, the Existing Notes will be redeemed at 103% of par, plus accrued and unpaid interest to, but excluding, the date of redemption. We will pay a redemption premium in connection with the redemption of the Existing Notes of $18.0 million.
30
SUMMARY HISTORICAL CONSOLIDATED FINANCIAL INFORMATION OF ASBURY AND UNAUDITED PRO FORMA CONDENSED COMBINED FINANCIAL INFORMATION OF THE COMBINED COMPANY
The following tables present the (i) summary historical consolidated financial information of Asbury and (ii) unaudited pro forma condensed combined financial information of the Combined Company for the periods indicated. The summary historical consolidated financial information as of and for the years ended December 31, 2016, 2017 and 2018 and as of and for the nine months ended September 30, 2018 and 2019 have been prepared in accordance with GAAP. The balance sheet data and income statement data as of and for the years ended December 31, 2016, 2017 and 2018 is derived from our audited historical consolidated financial statements included elsewhere in this offering memorandum, except that the summary historical balance sheet data as of December 31, 2016 is derived from our audited consolidated financial statements not included elsewhere in this offering memorandum. The balance sheet data and income statement data as of and for the nine months ended September 30, 2018 and 2019 have been derived from our unaudited interim consolidated financial statements included elsewhere in this offering memorandum, except that the summary historical balance sheet data as of September 30, 2018 is derived from our unaudited interim consolidated financial statement not included elsewhere in this document. The summary income statement data for the LTM Period has been derived by taking our historical audited consolidated income statement data for the year ended December 31, 2018, less our historical unaudited consolidated income statement data for the nine months ended September 30, 2018, plus our historical unaudited consolidated income statement data for the nine months ended September 30, 2019.
The summary unaudited pro forma condensed combined financial information of the Combined Company for the LTM Period and as of September 30, 2019 has been derived from the unaudited pro forma condensed combined financial statements included elsewhere in this offering memorandum. The summary unaudited pro forma condensed combined income statement data for the LTM Period has been calculated by adding the unaudited pro forma condensed combined income statement information for the three months ended December 31, 2018 to the unaudited pro forma condensed combined income statement information for the nine months ended September 30, 2019. The summary unaudited pro forma condensed combined statement of income information for the LTM Period has been adjusted to give effect to the Transactions as if each of these events occurred on October 1, 2018. The summary unaudited pro forma condensed combined balance sheet data have been adjusted to give effect to the Transactions as if they occurred as of September 30, 2019. For a further description of the pro forma adjustments, see “Unaudited Pro Forma Condensed Combined Financial Information of the Combined Company.”
The summary unaudited pro forma condensed combined financial information is for informational purposes only and does not purport to present what our results of operations and financial condition would have been had the Transactions actually occurred during such time period, and should not be considered representative of our future results of operations or financial position. The summary unaudited pro forma condensed combined financial information also does not reflect (1) future cost savings or run-rate synergies, restructuring or integration charges or operational improvements that are expected to result from the Acquisition, except as indicated below or (2) the impact of non-recurring items directly related to the Transactions.
31
This information is only a summary and should be read in conjunction with “Special Note Regarding Forward-Looking Statements,” “Special Note Regarding Non-GAAP Financial Measures,” “Summary—The Transactions,” “Risk Factors,” “Capitalization,” “Unaudited Pro Forma Condensed Combined Financial Information,” “Management’s Discussion and Analysis of Financial Condition and Results of Operations of the Company,” our audited and unaudited consolidated financial statements and the accompanying notes included elsewhere in this offering memorandum and the audited and unaudited consolidated financial statements of Park Place and the accompanying notes included elsewhere in this offering memorandum.
| Asbury Year Ended December 31, |
Asbury Nine Months Ended |
Asbury Months Ended |
Combined Pro Forma Last Twelve |
|||||||||||||||||||||||||
| 2016 |
2017 |
2018 |
2018 |
2019 |
2019 |
2019 |
||||||||||||||||||||||
| (dollars in millions) | ||||||||||||||||||||||||||||
| Income Statement Data: |
||||||||||||||||||||||||||||
| Revenue: |
||||||||||||||||||||||||||||
| New vehicle |
$ | 3,611.9 | $ | 3,561.1 | $ | 3,788.7 | $ | 2,766.3 | $ | 2,823.9 | $ | 3,846.3 | $ | 4,738.3 | ||||||||||||||
| Used vehicle |
1,876.4 | 1,834.1 | 1,972.4 | 1,499.0 | 1,590.4 | 2,063.8 | 2,687.0 | |||||||||||||||||||||
| Parts and service |
778.5 | 786.1 | 821.0 | 609.9 | 669.7 | 880.8 | 1,153.6 | |||||||||||||||||||||
| Finance and insurance, net |
261.0 | 275.2 | 292.3 | 215.0 | 232.3 | 309.6 | 339.8 | |||||||||||||||||||||
| Other |
— | — | — | — | — | — | 9.6 | |||||||||||||||||||||
|
|
|
|
|
|
|
|
|
|
|
|
|
|
|
|||||||||||||||
| Total revenue |
6,527.8 | 6,456.5 | 6,874.4 | 5,090.2 | 5,316.3 | 7,100.5 | 8,928.3 | |||||||||||||||||||||
|
|
|
|
|
|
|
|
|
|
|
|
|
|
|
|||||||||||||||
| Total cost of sales |
5,469.1 | 5,400.6 | 5,771.4 | 4,269.0 | 4,449.0 | 5,951.4 | 7,490.0 | |||||||||||||||||||||
|
|
|
|
|
|
|
|
|
|
|
|
|
|
|
|||||||||||||||
| Gross profit |
1,058.7 | 1,055.9 | 1,103.0 | 821.2 | 867.3 | 1,149.1 | 1,438.3 | |||||||||||||||||||||
| Selling, general and administrative expenses |
732.5 | 729.7 | 755.8 | 563.6 | 593.7 | 785.9 | 987.7 | |||||||||||||||||||||
| Depreciation and amortization |
30.7 | 32.1 | 33.7 | 25.2 | 26.7 | 35.2 | 45.7 | |||||||||||||||||||||
| Franchise rights impairment |
— | 5.1 | 3.7 | — | — | 3.7 | 3.7 | |||||||||||||||||||||
| Other operating expense (income), net |
(2.3 | ) | 1.3 | (1.1 | ) | (1.2 | ) | 1.0 | 1.1 | 0.9 | ||||||||||||||||||
|
|
|
|
|
|
|
|
|
|
|
|
|
|
|
|||||||||||||||
| Income from operations |
297.8 | 287.7 | 310.9 | 233.6 | 245.9 | 323.2 | 400.3 | |||||||||||||||||||||
|
|
|
|
|
|
|
|
|
|
|
|
|
|
|
|||||||||||||||
| Other expenses (Income) |
||||||||||||||||||||||||||||
| Floor plan interest expense |
19.3 | 22.7 | 32.5 | 23.0 | 29.7 | 39.2 | 49.3 | |||||||||||||||||||||
| Other interest expense, net. |
53.1 | 53.9 | 53.1 | 39.4 | 41.2 | 54.9 | 101.4 | |||||||||||||||||||||
|
|
|
|
|
|
|
|
|
|
|
|
|
|
|
|||||||||||||||
| Swap interest expense |
3.1 | 2.0 | 0.5 | 0.5 | — | 0.0 | — | |||||||||||||||||||||
| Gain on divestitures |
(45.5 | ) | — | — | — | (11.7 | ) | (11.7 | ) | (11.7 | ) | |||||||||||||||||
|
|
|
|
|
|
|
|
|
|
|
|
|
|
|
|||||||||||||||
| Total other expenses, net |
30.0 | 78.6 | 86.1 | 62.9 | 59.2 | 82.4 | 139.0 | |||||||||||||||||||||
|
|
|
|
|
|
|
|
|
|
|
|
|
|
|
|||||||||||||||
| Income before income taxes |
267.8 | 209.1 | 224.8 | 170.7 | 186.7 | 240.8 | 261.3 | |||||||||||||||||||||
|
|
|
|
|
|
|
|
|
|
|
|
|
|
|
|||||||||||||||
| Income tax expense |
100.6 | 70.0 | 56.8 | 43.1 | 45.9 | 59.6 | 55.3 | |||||||||||||||||||||
|
|
|
|
|
|
|
|
|
|
|
|
|
|
|
|||||||||||||||
| Net income |
$ | 167.2 | $ | 139.1 | $ | 168.0 | $ | 127.6 | $ | 140.8 | $ | 181.2 | $ | 206.0 | ||||||||||||||
|
|
|
|
|
|
|
|
|
|
|
|
|
|
|
|||||||||||||||
| Balance Sheet Data (at period end): |
||||||||||||||||||||||||||||
| Working capital |
$ | 227.5 | $ | 243.9 | $ | 249.7 | $ | 240.0 | $ | 212.9 | $ | 212.9 | $ | 63.8 | ||||||||||||||
| Inventories |
894.9 | 826.0 | 1,067.6 | 962.8 | 1,030.1 | 1,030.1 | 1,259.0 | |||||||||||||||||||||
| Total assets |
2,336.1 | 2,356.7 | 2,695.4 | 2,516.3 | 2,816.5 | 2,816.5 | 4,279.0 | |||||||||||||||||||||
| Floor plan notes payable(1) |
781.8 | 732.1 | 966.1 | 831.1 | 861.0 | 861.0 | 1,213.7 | |||||||||||||||||||||
| Total long-term debt |
926.7 | 875.5 | 905.3 | 865.2 | 905.9 | 905.9 | 1,805.7 | |||||||||||||||||||||
| Total shareholders’ equity |
279.7 | 394.2 | 473.2 | 481.0 | 600.0 | 600.0 | 600.0 | |||||||||||||||||||||
32
| Asbury Year Ended December 31, |
Asbury Nine Months Ended |
Asbury Months Ended |
Combined Pro Forma Last Twelve |
|||||||||||||||||||||||||
| 2016 |
2017 |
2018 |
2018 |
2019 |
2019 |
|||||||||||||||||||||||
| (dollars in millions) | ||||||||||||||||||||||||||||
| Other Selected Data and Credit Statistics: |
||||||||||||||||||||||||||||
| New vehicle unit sales(2) |
102,360 | 99,975 | 105,275 | 77,478 | 77,636 | 105,433 | 118,556 | |||||||||||||||||||||
| Used vehicle retail unit sales(2) |
79,259 | 76,929 | 82,377 | 63,079 | 66,330 | 85,628 | 97,642 | |||||||||||||||||||||
| Number of dealerships at period end(2) |
77 | 80 | 83 | 83 | 88 | 88 | 97 | |||||||||||||||||||||
| Number of franchises at period end(2) |
93 | 94 | 97 | 97 | 107 | 107 | 122 | |||||||||||||||||||||
| Same store revenue:(3) |
||||||||||||||||||||||||||||
| Luxury |
$ | 1,226.5 | $ | 1,200.2 | $ | 1,235.3 | $ | 883.8 | $ | 926.7 | $ | 1,278.2 | $ | 2,170.2 | ||||||||||||||
| Import |
1,557.8 | 1,636.2 | 1,706.7 | 1,284.0 | 1,260.1 | 1,682.8 | 1,682.8 | |||||||||||||||||||||
| Domestic |
698.4 | 722.2 | 740.3 | 563.2 | 512.1 | 689.2 | 689.2 | |||||||||||||||||||||
|
|
|
|
|
|
|
|
|
|
|
|
|
|
|
|||||||||||||||
| Total new vehicle revenue |
3,482.7 | 3,558.6 | 3,682.3 | 2,731.0 | 2,698.9 | 3,650.2 | 4,542.2 | |||||||||||||||||||||
| Net cash provided by operating activities |
142.5 | 266.3 | 10.1 | 106.4 | 347.7 | 251.4 | ||||||||||||||||||||||
| Capital expenditures |
92.0 | 48.1 | 57.9 | 39.1 | 37.9 | 56.7 | ||||||||||||||||||||||
| Adjusted EBITDA(4) |
320.3 | 317.0 | 325.6 | 243.3 | 255.4 | 337.7 | 415.5 | |||||||||||||||||||||
| Adjusted EBITDA Margin(4)(5) |
4.9 | % | 4.9 | % | 4.7 | % | 4.8 | % | 4.8 | % | 4.8 | % | 4.7 | % | ||||||||||||||
| Pro Forma Adjusted EBITDA(4) |
$ | 447.1 | ||||||||||||||||||||||||||
| Pro Forma Adjusted EBITDA Margin(4)(5) |
5.0 | % | ||||||||||||||||||||||||||
| Pro Forma Fixed Charge Coverage(4)(6) |
1.99x | |||||||||||||||||||||||||||
| Ratio of Secured Debt to Pro Forma Adjusted EBITDA(4)(7) |
1.55x | |||||||||||||||||||||||||||
| Ratio of Total Debt to Pro Forma Adjusted EBITDA(4)(8) |
4.04x | |||||||||||||||||||||||||||
| Ratio of Lease Adjusted Leverage to Pro Forma Adjusted EBITDAR(4)(9) |
4.19x | |||||||||||||||||||||||||||
| (1) | Represents the sum of floor plan notes payable—trade, net and floor plan notes payable—non-trade, net in the historical financial statements of Asbury. |
| (2) | New vehicle unit sales, used vehicle retail unit sales, number of dealerships at period end and number of franchises at period end are presented on an actual, combined basis. Excludes the following franchises not reflected in the Park Place financial statements as of September 30, 2019, but to be acquired by the Company in the Acquisition: 1 Karma, 1 Koenigsegg, 1 Sprinter, 1 Jaguar (open point) and 1 Land Rover (open point), none of which had meaningful operations during Park Place’s 2019 fiscal year. |
| (3) | Organic growth of revenue and gross profit are assessed on a same store basis. As such, same store amounts consist of information from dealerships for identical months in each comparative period, commencing with the first month we owned the dealership. Additionally, amounts related to divested dealerships are excluded from each comparative period. |
| (4) | We define EBITDA for the Company as net income plus income tax expense, depreciation and amortization, swap and non-floor plan interest expense. We define Adjusted EBITDA for the Company as EBITDA as adjusted for any (gain) loss on non-recurring or non-core items from time to time such as franchise rights impairment, real estate related charges, legal settlements, investment income, fixed assets write-offs, dealership divestitures and stock-based compensation expense, among others. We define Pro Forma Adjusted EBITDA for the Combined Company as our Adjusted EBITDA combined with Park Place’s Adjusted EBITDA, presented on a pro forma basis to give effect to the Transactions, as further adjusted to reflect certain run-rate synergies and operational improvements resulting from the Acquisition, and the forecasted full-year EBITDA of three recent dealership acquisitions and the removal of EBITDA for six anticipated dealership dispositions. We define Pro Forma Adjusted EBITDAR as Pro Forma Adjusted EBITDA plus rent expense. |
33
We believe the use of EBITDA, Adjusted EBITDA, Pro Forma Adjusted EBITDA and Pro Forma Adjusted EBITDAR along with GAAP financial measures enhances the understanding of our operating results and may be useful to investors in comparing our operating performance with that of our competitors and estimating our enterprise value. EBITDA, Adjusted EBITDA, Pro Forma Adjusted EBITDA and Pro Forma Adjusted EBITDAR are also useful tools in evaluating our core operating results given the significant variation that can result in any period from non-recurring or non-core items.
EBITDA, Adjusted EBITDA, Pro Forma Adjusted EBITDA and Pro Forma Adjusted EBITDAR are not measurements of our financial performance recognized under GAAP. EBITDA, Adjusted EBITDA, Pro Forma Adjusted EBITDA and Pro Forma Adjusted EBITDAR are used in addition to and in conjunction with results presented in accordance with GAAP, and should be considered as a supplement to, and not as a substitute for, net income or any other performance measure calculated or derived in accordance with GAAP. Furthermore, this measure is not necessarily comparable to similarly titled measures employed by other companies. EBITDA, Adjusted EBITDA, Pro Forma Adjusted EBITDA and Pro Forma Adjusted EBITDAR has limitations as an analytical tool as it should not be considered in isolation or as a substitute for analysis of our results of operations as reported under GAAP.
The following provides a numerical reconciliation of EBITDA, Adjusted EBITDA, Pro Forma Adjusted EBITDA and Pro Forma Adjusted EBITDAR to net income, which is the most directly comparable financial measure prepared in accordance with GAAP:
| Asbury Year Ended December 31, |
Asbury Nine Months Ended |
Asbury Months |
Combined Pro Forma Months |
|||||||||||||||||||||||||||||
| 2016 |
2017 |
2018 |
2018 |
2019 |
2019 |
2019 |
||||||||||||||||||||||||||
| (dollars in millions) | ||||||||||||||||||||||||||||||||
| Net income |
|
$ | 167.2 | $ | 139.1 | $ | 168.0 | $ | 127.6 | $ | 140.8 | $ | 181.2 | $ | 206.0 | |||||||||||||||||
| Income tax expense |
|
100.6 | 70.0 | 56.8 | 43.1 | 45.9 | 59.6 | 55.3 | ||||||||||||||||||||||||
|
|
|
|
|
|
|
|
|
|
|
|
|
|
|
|||||||||||||||||||
| Income from continuing operations before income tax |
|
$ | 267.8 | $ | 209.1 | $ | 224.8 | $ | 170.7 | $ | 186.7 | $ | 240.8 | $ | 261.3 | |||||||||||||||||
| Depreciation and amortization |
|
30.7 | 32.1 | 33.7 | 25.2 | 26.7 | 35.2 | 45.7 | ||||||||||||||||||||||||
| Swap interest expense |
|
3.1 | 2.0 | 0.5 | 0.5 | — | — | — | ||||||||||||||||||||||||
| Non-floor plan interest expense, net |
|
53.1 | 53.9 | 53.1 | 39.4 | 41.2 | 54.9 | 101.4 | ||||||||||||||||||||||||
| EBITDA |
|
354.7 | 297.1 | 312.1 | 235.8 | 254.6 | 330.9 | 408.4 | ||||||||||||||||||||||||
| Franchise rights impairment |
|
— | 5.1 | 3.7 | — | — | 3.7 | 3.7 | ||||||||||||||||||||||||
| Real estate related charges |
|
5.7 | 2.9 | — | — | — | — | — | ||||||||||||||||||||||||
| Gain on sale of real estate |
|
— | — | — | — | (0.3 | ) | (0.3 | ) | (0.3 | ) | |||||||||||||||||||||
| Legal settlements |
|
(6.6 | ) | (0.9 | ) | (0.7 | ) | (0.7 | ) | — | — | — | ||||||||||||||||||||
| Investment income |
|
— | (0.8 | ) | — | — | — | — | — | |||||||||||||||||||||||
| Fixed assets write-off |
|
— | — | — | — | 2.4 | 2.4 | 2.4 | ||||||||||||||||||||||||
| Gain on divestitures |
|
(45.5 | ) | — | — | — | (11.7 | ) | (11.7 | ) | (11.7 | ) | ||||||||||||||||||||
| Stock-based compensation expense |
|
12.0 | 13.6 | 10.5 | 8.2 | 10.4 | 12.7 | 12.7 | ||||||||||||||||||||||||
| Management fees |
|
— | — | — | — | — | — | 0.4 | ||||||||||||||||||||||||
| Deferred compensation expense |
|
— | — | — | — | — | — | 0.4 | ||||||||||||||||||||||||
| Profits interest obligation |
|
— | — | — | — | — | — | (0.3 | ) | |||||||||||||||||||||||
| Other income |
|
— | — | — | — | — | — | (0.2 | ) | |||||||||||||||||||||||
|
|
|
|
|
|
|
|
|
|
|
|
|
|
|
|
|
|||||||||||||||||
| Adjusted EBITDA |
|
320.3 | 317.0 | 325.6 | 243.3 | 255.4 | 337.7 | 415.5 | ||||||||||||||||||||||||
| Synergies and operational improvements |
|
20.0 | ||||||||||||||||||||||||||||||
| Closed Acquisitions, net |
|
19.0 | ||||||||||||||||||||||||||||||
| Signed Dispositions, net |
|
(10.8 | ) | |||||||||||||||||||||||||||||
| Rent adjustment(d) |
3.4 | |||||||||||||||||||||||||||||||
| Pro Forma Adjusted EBITDA |
|
447.1 | ||||||||||||||||||||||||||||||
| Rent expense(d) |
|
37.5 | ||||||||||||||||||||||||||||||
|
|
|
|||||||||||||||||||||||||||||||
| Pro Forma Adjusted EBITDAR |
|
$ | 484.6 | |||||||||||||||||||||||||||||
|
|
|
|||||||||||||||||||||||||||||||
34
| (a) | Represents estimated cost savings consisting of (i) a reduction in corporate costs, (ii) lower servicing costs by maintaining key store-level accounting and administrative activities in our shared service centers, (iii) the ability to leverage our scale to reduce costs related to purchasing certain equipment, supplies and services through national vendor relationships, and (iv) expected operational improvements primarily with respect to F&I and to a lesser extent P&S. |
| (b) | Reflects the annualized EBITDA contribution for the LTM Period of (i) an estimated $12.6 million in the aggregate from the acquisition of the Shaw Dealership and the acquisition during the three months ended September 30, 2019 of the Butler Toyota dealership operating in Indianapolis, Indiana and (ii) an estimated $6.4 million from the acquisition of the Elway Dealership. |
| (c) | Reflects the elimination of the annualized EBITDA contribution for the LTM Period of (i) $8.0 million from the anticipated disposition of the Gray Daniel Dealerships and (ii) $2.8 million from the anticipated disposition of the Nalley Nissan Dealership. |
| (d) | For the LTM Period, reflects third party rental expense of approximately $26.9 million for the Company and $14.0 million for Park Place less $3.4 million to adjust the Park Place rent expense to the Company’s expected rent. The $3.4 million is shown as an adjustment to Pro Forma Adjusted EBITDA. |
| (5) | Adjusted EBITDA Margin means Adjusted EBITDA divided by total revenue. Pro Forma Adjusted EBITDA Margin means Pro Forma Adjusted EBITDA divided by pro forma total revenue. |
| (6) | The Pro Forma Fixed Charge Coverage ratio is calculated by dividing Pro Forma EBITDAR less allowable capital expenditures, by the total of the following (a) other interest expense, net, (b) scheduled amortization resulting from increased principal payments from borrowings on the real estate facility, (c) combined pro forma rent expense, and (d) combined pro forma income tax expense. The Pro Forma Fixed Charge Coverage ratio does not include the impact of floor plan interest expense. For the pro forma LTM Period, fixed charges represented $239.1 million. |
| (7) | Secured debt as of September 30, 2019, after giving pro forma effect to the Transactions, is $692.2 million (excluding net floor plan notes payable of $1,177.5 million). |
| (8) | Total debt as of September 30, 2019, after giving pro forma effect to the Transactions, reflects long-term debt, including current portion, of $1,805.7 million (excluding net floor plan notes payable of $1,177.5 million). |
| (9) | The ratio of Lease Adjusted Leverage to Pro Forma Adjusted EBITDAR is calculated by dividing Pro Forma Lease Adjusted Debt by Pro Forma EBITDAR. Pro Forma Lease Adjusted Debt is equal to total indebtedness less floor plan notes payable, and plus an amount equal to six times the pro forma rent expense. |
35
SUMMARY HISTORICAL CONSOLIDATED FINANCIAL INFORMATION OF PARK PLACE
The following tables present the summary historical consolidated financial and operating information of Park Place for the periods indicated. The summary historical consolidated financial information for Park Place as of and for the year ended December 31, 2018 and the nine months ended September 30, 2019 and for the year ended December 31, 2017 and as of and for the three months ended December 31, 2018 have been prepared in accordance with GAAP. The balance sheet data and income statement data for Park Place as of and for the years ended December 31, 2017 and 2018 and for the nine months ended September 30, 2019 is derived from Park Place’s audited historical consolidated financial statements included elsewhere in this offering memorandum. The balance sheet data and income statement data as of and for the three month period ended December 31, 2018 has been derived from Park Place’s unaudited interim consolidated financial statements included elsewhere in this offering memorandum. The summary statements of operations data and other selected data for the LTM Period has been derived by taking the historical audited consolidated statement of operations for Park Place for the nine months ended September 30, 2019, plus the historical unaudited consolidated statement of operations for Park Place for the three months ended December 31, 2018.
This information is only a summary and should be read in conjunction with “Special Note Regarding Non-GAAP Financial Measures,” “Risk Factors,” “Summary—The Transactions,” “Risk Factors,” “Capitalization” and the audited and unaudited consolidated financial statements of Park Place and the accompanying notes included elsewhere in this offering memorandum, as well as the other financial information included herein.
| Park Place Year Ended |
Park Place Three Months December 31, 2018 |
Park Place Nine Months September 30, 2019 |
Park Place Last Twelve |
|||||||||||||||||
| 2017 |
2018 |
2019 |
||||||||||||||||||
| (dollars in millions) | ||||||||||||||||||||
| Income Statement Data: |
||||||||||||||||||||
| Sales |
$ | 1,720.1 | $ | 1,764.9 | $ | 489.7 | $ | 1,307.9 | $ | 1,797.6 | ||||||||||
| Cost of sales |
1,481.7 | 1,513.9 | 424.2 | 1,114.4 | 1,538.6 | |||||||||||||||
|
|
|
|
|
|
|
|
|
|
|
|||||||||||
| Gross profit from sales |
238.4 | 251.0 | 65.5 | 193.5 | 259.0 | |||||||||||||||
| Financing, insurance, service contract and other income, net |
30.4 | 29.8 | 8.3 | 21.9 | 30.2 | |||||||||||||||
|
|
|
|
|
|
|
|
|
|
|
|||||||||||
| Gross profit |
268.8 | 280.8 | 73.8 | 215.4 | 289.2 | |||||||||||||||
|
|
|
|
|
|
|
|
|
|
|
|||||||||||
| Expenses: |
||||||||||||||||||||
| Variable selling |
22.6 | 23.7 | 6.3 | 17.6 | 23.9 | |||||||||||||||
| Advertising |
7.0 | 8.6 | 1.9 | 6.4 | 8.3 | |||||||||||||||
| Floor plan interest |
5.9 | 8.4 | 2.6 | 7.6 | 10.2 | |||||||||||||||
| Personnel |
89.8 | 94.7 | 22.7 | 72.0 | 94.7 | |||||||||||||||
| Semi-fixed |
40.3 | 43.6 | 11.8 | 35.0 | 46.8 | |||||||||||||||
| Fixed |
42.9 | 45.3 | 11.1 | 34.4 | 45.5 | |||||||||||||||
|
|
|
|
|
|
|
|
|
|
|
|||||||||||
| 208.5 | 224.3 | 56.4 | 173.0 | 229.4 | ||||||||||||||||
| Income from operations |
60.3 | 56.5 | 17.4 | 42.4 | 59.8 | |||||||||||||||
|
|
|
|
|
|
|
|
|
|
|
|||||||||||
| Other income (expense): |
||||||||||||||||||||
| Interest expense, other than floor plan |
(4.5 | ) | (4.5 | ) | (1.1 | ) | (3.2 | ) | (4.3 | ) | ||||||||||
| Interest income |
1.5 | 2.2 | 0.5 | 1.7 | 2.2 | |||||||||||||||
| Management fees |
(0.9 | ) | (0.6 | ) | (0.2 | ) | (0.2 | ) | (0.4 | ) | ||||||||||
| Deferred compensation expense |
(0.5 | ) | (0.4 | ) | (0.4 | ) | — | (0.4 | ) | |||||||||||
| Profits interest obligation |
— | 0.2 | 0.1 | 0.2 | 0.3 | |||||||||||||||
| Other |
0.5 | 0.1 | — | 0.2 | 0.2 | |||||||||||||||
|
|
|
|
|
|
|
|
|
|
|
|||||||||||
| (3.9 | ) | (3.0 | ) | (1.1 | ) | (1.3 | ) | (2.4 | ) | |||||||||||
| Income before state income tax expense |
56.4 | 53.5 | 16.3 | 41.1 | 57.4 | |||||||||||||||
| State margin tax expense |
1.3 | 1.2 | 0.4 | 1.2 | 1.6 | |||||||||||||||
|
|
|
|
|
|
|
|
|
|
|
|||||||||||
| Net income |
$ | 55.1 | $ | 52.3 | $ | 15.9 | $ | 39.9 | $ | 55.8 | ||||||||||
|
|
|
|
|
|
|
|
|
|
|
|||||||||||
36
| Park Place Year Ended |
Park Place Three Months December 31, 2018 |
Park Place Nine Months September 30, |
Park Place Last Twelve |
|||||||||||||||||
| 2017 |
2018 |
2019 |
2019 |
|||||||||||||||||
| (dollars in millions) | ||||||||||||||||||||
| Balance Sheet Data: |
||||||||||||||||||||
| Working capital |
$ | 89.2 | $ | 89.2 | $ | 70.3 | $ | 70.3 | ||||||||||||
| Inventories |
270.7 | 270.7 | 231.3 | 231.3 | ||||||||||||||||
| Total assets |
668.7 | 668.7 | 660.1 | 660.1 | ||||||||||||||||
| Floor plan notes payable |
169.1 | 169.1 | 136.6 | 136.6 | ||||||||||||||||
| Floor plan notes payable, other |
144.7 | 144.7 | 123.5 | 123.5 | ||||||||||||||||
| Other Selected Data: |
||||||||||||||||||||
| New vehicle unit sales |
14,017 | 13,615 | 4,006 | 9,117 | 13,123 | |||||||||||||||
| Used vehicle retail unit sales |
11,231 | 11,455 | 2,893 | 9,121 | 12,014 | |||||||||||||||
| Number of dealerships at period end |
9 | 9 | 9 | 9 | 9 | |||||||||||||||
| Number of franchises at period end |
19 | 15 | 15 | 15 | 15 | (4) | ||||||||||||||
| Adjusted EBITDA(1)(3) |
$ | 76.1 | $ | 72.7 | $ | 21.1 | $ | 53.9 | $ | 75.0 | ||||||||||
| Adjusted EBITDA Margin(1)(2) |
4.3 | % | 4.1 | % | 4.2 | % | 4.1 | % | 4.1 | % | ||||||||||
| Net cash provided by operating activities |
27.3 | 50.9 | 84.8 | |||||||||||||||||
| Capital expenditures |
25.3 | 10.5 | 16.5 | |||||||||||||||||
| (1) | EBITDA for Park Place is defined as net income plus state margin tax expense, depreciation and amortization, non-floor plan interest expense and interest income. Adjusted EBITDA for Park Place is defined as EBITDA as adjusted for management fees, deferred compensation expense, profits interest obligations and other income (expense). We believe the use of EBITDA and Adjusted EBITDA along with GAAP financial measures enhances the understanding of Park Place’s operating results and may be useful to investors in comparing Park Place’s operating performance with that of its competitors and estimating Park Place’s enterprise value. EBITDA and Adjusted EBITDA are also useful tools in evaluating Park Place’s core operating results given the significant variation that can result in any period from non-recurring or non-core items. |
EBITDA and Adjusted EBITDA are not measurements of Park Place’s financial performance recognized under GAAP. EBITDA and Adjusted EBITDA are used in addition to and in conjunction with results presented in accordance with GAAP, and should be considered as a supplement to, and not as a substitute for, net income or any other performance measure calculated or derived in accordance with GAAP. Furthermore, this measure is not necessarily comparable to similarly titled measures employed by other companies. EBITDA and Adjusted EBITDA have limitations as analytical tools and should not be considered in isolation or as substitutes for analysis of Park Place’s results of operations as reported under GAAP.
37
The following provides a numerical reconciliation of Adjusted EBITDA to net income, which is the most directly comparable financial measure prepared in accordance with GAAP:
| Park Place Year Ended |
Park Place Three December 31, 2018 |
Park Place Nine Months September 30, 2019 |
Park Place Last Twelve |
|||||||||||||||||
| 2017 |
2018 |
|||||||||||||||||||
| (dollars in millions) | ||||||||||||||||||||
| Net income |
$ | 55.1 | $ | 52.3 | $ | 15.9 | $ | 39.9 | $ | 55.8 | ||||||||||
| State margin tax expense |
1.3 | 1.2 | 0.4 | 1.2 | 1.6 | |||||||||||||||
| Depreciation and amortization |
15.8 | 16.2 | 3.7 | 11.5 | 15.2 | |||||||||||||||
| Interest expense, other than floorplan |
4.5 | 4.5 | 1.1 | 3.2 | 4.3 | |||||||||||||||
| Interest income |
(1.5 | ) | (2.2 | ) | (0.5 | ) | (1.7 | ) | (2.2 | ) | ||||||||||
|
|
|
|
|
|
|
|
|
|
|
|||||||||||
| EBITDA |
75.2 | 72.0 | 20.6 | 54.1 | 74.7 | |||||||||||||||
| Management fees(a) |
0.9 | 0.6 | 0.2 | 0.2 | 0.4 | |||||||||||||||
| Deferred compensation expense(b) |
0.5 | 0.4 | 0.4 | — | 0.4 | |||||||||||||||
| Profits interest obligations(c) |
– | (0.2 | ) | (0.1 | ) | (0.2 | ) | (0.3 | ) | |||||||||||
| Other income |
(0.5 | ) | (0.1 | ) | — | (0.2 | ) | (0.2 | ) | |||||||||||
|
|
|
|
|
|
|
|
|
|
|
|||||||||||
| Adjusted EBITDA(3) |
$ | 76.1 | $ | 72.7 | $ | 21.1 | $ | 53.9 | $ | 75.0 | ||||||||||
| (a) | Management fees reflects payments under an agreement with a related party in respect with the provision of certain management and consulting services. |
| (b) | Deferred compensation expense reflects Compensation expense related to (i) management during the periods with respect to certain deferred compensation arrangements, including vested amounts under an existing separation arrangement and (ii) certain profit participation agreements with certain former members of management. |
| (c) | Profits interest obligations reflect amounts payable pursuant to a profits interest agreement with a limited partner, pursuant to which the Company is required to pay, upon certain triggering events, the limited partner’s vested percentage of predetermined dealership value. |
| (2) | Adjusted EBITDA Margin means Adjusted EBITDA divided by the aggregate of sales and financing, insurance, service contract and other income, net. |
| (3) | For the LTM Period, includes $14.0 million of Park Place rent expense, which is $3.4 million greater than the rent expense payable under the leases that Asbury will assume. |
| (4) | Excludes the following franchises not reflected in the Park Place financial statements as of September 30, 2019, but to be acquired by the Company in the Acquisition: 1 Karma, 1 Koenigsegg, 1 Sprinter, 1 Jaguar (open point) and 1 Land Rover (open point), none of which had meaningful operations during Park Place’s 2019 fiscal year. |
38
USE OF PROCEEDS
The gross proceeds from this offering of the 2028 Notes and the 2030 Notes, excluding the initial purchasers’ discounts and the payment of our estimated expenses related to this offering, will be approximately $1,125.0 million in the aggregate, comprised of $ million in aggregate principal amount of 2028 Notes and $ million in aggregate principal amount of the 2030 Notes. Concurrently with the closing of the offering of the 2028 Notes and the 2030 Notes, the Company will deposit into a segregated account the Mandatory Redemption Amount. We intend to use the gross proceeds from the offering of the 2028 Notes and the 2030 Notes, together with additional borrowings and cash on hand, to: (1) fund the Acquisition, if consummated, (2) redeem the Existing Notes and (3) pay fees and expenses related to the foregoing. See “Capitalization.” If the Acquisition is not consummated, we will be required to redeem the Notes of each series at par in an amount equal to the Mandatory Redemption Amount on a pro rata basis in proportion to the aggregate principal amount of each series of Notes pursuant to a Special Mandatory Redemption as described under “Description of Notes—Special Mandatory Redemption.”
The following table sets forth the estimated sources and uses of funds in connection with the Transactions. The actual sources and uses of funds may vary from the estimated sources and uses of funds in the table and accompanying footnotes set forth below.
Sources and Uses of Funds (dollars in millions)
|
Sources(1) |
Amount |
Uses(1) |
Amount |
|||||||
| Notes issued hereby: |
Purchase price:(2) |
|||||||||
| 2028 Notes |
$ | Goodwill |
$ | 785.0 | ||||||
| 2030 Notes |
Real property |
215.0 | ||||||||
|
|
|
|||||||||
| Total |
1,125.0 | Parts and other assets, net |
40.7 | |||||||
|
|
|
|
|
|||||||
| Floor Plan Facilities:(3) |
Cash purchase price |
1,040.7 | ||||||||
|
|
|
|||||||||
| New Vehicle Floor Plan Facility |
236.9 | Acquired vehicle inventory:(4) |
||||||||
| Used Vehicle Floor Plan Facility |
150.0 | New vehicles |
236.9 | |||||||
|
|
|
|||||||||
| Total |
386.9 | Used vehicles |
47.0 | |||||||
|
|
|
|
|
|||||||
| 2018 Wells Fargo Mortgage Loan Facility |
69.0 | Total Acquisition consideration |
1,324.6 | |||||||
|
|
|
|||||||||
| New BofA Real Estate Facility |
216.0 | Redemption price for the Existing Notes(6) |
618.0 | |||||||
| Cash from balance sheet(5) |
172.7 | Estimated fees & expenses(7) |
27.0 | |||||||
|
|
|
|
|
|||||||
| Total Sources |
$ | 1,969.6 | Total Uses |
$ | 1,969.6 | |||||
|
|
|
|
|
|||||||
| (1) | Excludes $4.2 million of capital leases expected to be assumed in the Acquisition. |
| (2) | Pre-acquisition preliminary purchase price allocation presented represents the allocation of the assumed purchase price to the estimated fair value of the net assets to be acquired, based on certain assumptions developed by management. The pre-acquisition preliminary purchase price allocation should not be viewed as a substitute for the purchase allocation required by GAAP. Upon the consummation of the Acquisition, the actual purchase price allocation may differ from these estimates and could differ materially. |
| (3) | Reflects estimated borrowings under (a) the New Vehicle Floor Plan Facility expected to be used to fund the purchase of the Park Place new vehicle inventory, subject to actual new vehicle inventories at the Park Place dealerships on the closing date of the Acquisition, and (b) the Used Vehicle Floor Plan Facility expected to be used to fund the purchase of the Park Place used vehicle inventory, other current assets and other transaction consideration, which Used Vehicle Floor Plan Facility will provide for aggregate borrowings upon the closing of the Acquisition of up to the lesser of: (i) $200 million or (ii) 85% of the used vehicle inventory of both the Company and Park Place. |
| (4) | Estimated total Acquisition consideration reflects vehicle inventory of $283.9 million at the Park Place dealerships as of September 30, 2019 that is expected to be acquired in connection with the consummation of the Acquisition. New and used vehicle inventories at the Park Place dealerships vary significantly from time to time, and the actual value of vehicle inventories acquired will depend on the actual new and used vehicle inventories at the Park Place dealerships on the |
39
| closing date of the Acquisition. If the acquired used vehicle inventory and/or new vehicle inventory, and accordingly, the purchase price for the Acquisition, increases significantly from the used vehicle inventory and/or new vehicle inventory as of September 30, 2019, the Company intends to use, with respect to new vehicle inventory, borrowings under the New Vehicle Floor Plan Facility to pay the additional purchase price of such new vehicle inventory and, with respect to used vehicle inventory, a combination of all or any of cash on hand, borrowings under the Used Vehicle Floor Plan Facility and borrowings under the Revolving Credit Facility to pay the additional purchase price of such used vehicle inventory. See “Risk Factors—Risks Related to the Acquisition—The purchase price for the Acquisition could increase significantly from our estimate in this offering memorandum, which may adversely impact our liquidity.” If the acquired inventory, and accordingly, the purchase price for the Acquisition, decreases significantly from the inventory as of September 30, 2019, the Company expects to have additional liquidity following the consummation of the Acquisition. |
| (5) | Reflects the inclusion of $97.2 million of borrowings under the 2018 BofA Real Estate Facility incurred by the Company during the three months ended December 31, 2019 to fund a portion of the purchase price of the Acquisition. |
| (6) | On February 3, 2020, we issued a conditional notice of redemption to the holders of our Existing Notes, notifying such holders that we will redeem all of the Existing Notes on March 4, 2020. The redemption of the Existing Notes is conditioned upon the consummation of this offering. If redeemed, the Existing Notes will be redeemed at 103.000% of par, plus accrued and unpaid interest to, but excluding, the date of redemption. We will pay a redemption premium in connection with the redemption of the Existing Notes of $18.0 million. |
| (7) | Consists of our estimate of fees and expenses associated with the Transactions, including commitment fees, initial purchaser discounts and commissions in connection with the issuance of the 2028 Notes and the 2030 Notes and other financing fees and other transaction costs including advisory and professional fees. |
40
RISK FACTORS
An investment in either series of Notes is subject to a number of risks. You should carefully consider the following risk factors as well as the other information and data included in this offering memorandum prior to making an investment in either series of Notes. The risks described below could materially adversely affect our business, financial condition, cash flows or results of operations, in which case you could lose all or part of your original investment.
Risks Related to the Business
The automotive retail industry is sensitive to unfavorable changes in general economic conditions and various other factors that could affect demand for our products and services, which could have a material adverse effect on our business, our ability to implement our strategy and our results of operations.
Our future performance will be impacted by general economic conditions including: changes in employment levels; consumer demand, preferences and confidence levels; the availability and cost of credit; fuel prices; levels of discretionary personal income; and interest rates. We also are subject to economic, competitive and other conditions prevailing in the various markets in which we operate, even if those conditions are not prominent nationally.
Retail vehicle sales are cyclical and historically have experienced periodic downturns characterized by oversupply and weak demand, which could result in a need for us to lower the prices at which we sell vehicles, which would reduce our revenue per vehicle sold and our margins. Additionally, a shift in consumer’s vehicle preferences driven by pricing, fuel costs or other factors may have a material adverse effect on our revenues, margins and results of operations.
Changes in general economic conditions may make it difficult for us to execute our business strategy. In such an event, we may be required to enter into certain transactions in order to generate additional cash, which may include, but not be limited to, selling certain of our dealerships or other assets or increasing borrowings under our existing, or any future, credit facilities. There can be no assurance that, if necessary, we would be able to enter into any such transactions in a timely manner or on reasonable terms, if at all. Furthermore, in the event we were required to sell dealership assets, the sale of any material portion of such assets could have a material adverse effect on our revenue and profitability.
Adverse conditions affecting one or more of the vehicle manufacturers with which we hold franchises or their inability to deliver a desirable mix of vehicles that our consumers demand, could have a material adverse effect on our business, results of operations, financial condition and cash flows.
Historically, we have generated most of our revenue through new vehicle sales, and new vehicle sales also tend to lead to sales of higher-margin products and services, such as finance and insurance products and vehicle-related parts and service. As a result, our profitability is dependent to a great extent on various aspects of vehicle manufacturers’ operations, many of which are outside of our control. Our ability to sell new vehicles is dependent on manufacturers’ ability to design and produce, and willingness to allocate and deliver to our dealerships, a desirable mix of popular new vehicles that consumers demand. Popular vehicles may often be difficult to obtain from manufacturers for a number of reasons, including the fact that manufacturers generally allocate their vehicles to dealerships based on sales history and capital expenditures associated with such dealerships. Further, if a manufacturer fails to produce desirable vehicles or develops a reputation for producing undesirable vehicles or produces vehicles that do not comply with applicable laws or government regulations, and we own dealerships which sell that manufacturer’s vehicles, our revenues from those dealerships could be adversely affected as consumers shift their vehicle purchases away from that brand.
Although we seek to limit our dependence on any one vehicle manufacturer, there can be no assurance the brand mix allocated and delivered to our dealerships by the manufacturers will be appropriate or sufficiently
41
diverse to protect us from a significant decline in the desirability of vehicles manufactured by a particular manufacturer or disruptions in a manufacturer’s ability to produce vehicles. For the nine months ended September 30, 2019, manufacturers representing 5% or more of our revenues from new vehicle sales were as follows:
| Manufacturer (Vehicle Brands): |
% of Total New Vehicle Revenues |
|||
| American Honda Motor Co., Inc. (Honda and Acura) |
23 | % | ||
| Toyota Motor Sales, U.S.A., Inc. (Toyota and Lexus) |
19 | % | ||
| Nissan North America, Inc. (Nissan and Infiniti) |
12 | % | ||
| Ford Motor Company (Ford and Lincoln) |
11 | % | ||
| Mercedes-Benz USA, LLC (Mercedes-Benz, smart and Sprinter) |
7 | % | ||
| BMW of North America, LLC (BMW and Mini) |
6 | % | ||
Similar to automotive retailers, vehicle manufacturers may be affected by the long-term U.S. and international economic climate. In addition, we remain vulnerable to other matters that may impact the manufacturers of the vehicles we sell, many of which are outside of our control, including: (i) changes in their respective financial condition; (ii) changes in their respective marketing efforts; (iii) changes in their respective reputation; (iv) manufacturer and other product defects, including recalls; (v) changes in their respective management; (vi) disruptions in the production and delivery of vehicles and parts due to natural disasters or other reasons; and (vii) issues with respect to labor relations. Our business is highly dependent on consumer demand and brand preferences for our manufacturers products. Manufacturer recall campaigns are a common occurrence that have accelerated in frequency and scope over the last several years. Manufacturer recall campaigns could adversely affect our new and used vehicle sales or customer residual trade-in valuations, could cause us to temporarily remove vehicles from our inventory, could force us to incur increased costs, and could expose us to litigation and adverse publicity related to the sale of recalled vehicles, which could have a material adverse effect on our business, results of operations, financial condition and cash flows. Vehicle manufacturers that produce vehicles outside of the United States are subject to additional risks including changes in quotas, tariffs or duties, fluctuations in foreign currency exchange rates, regulations governing imports and the costs related thereto, and foreign governmental regulations.
Adverse conditions that materially affect a vehicle manufacturer and its ability to profitably design, market, produce or distribute desirable new vehicles could in turn materially adversely affect our ability to (i) sell vehicles produced by that manufacturer, (ii) obtain or finance our new vehicle inventories, (iii) access or benefit from manufacturer financial assistance programs, (iv) collect in full or on a timely basis any amounts due therefrom and/or (v) obtain other goods and services provided by the impacted manufacturer. In addition, we depend on manufacturers’ ability to design, produce and supply parts to us and any failure to do so could have a material adverse effect on our parts and services business. Our business, results of operations, financial condition and cash flows could be materially adversely affected as a result of any event that has an adverse effect on any vehicle manufacturer.
In addition, if a vehicle manufacturer’s financial condition worsens and it seeks protection from creditors in bankruptcy or similar proceedings, or otherwise under the laws of its jurisdiction of organization, (i) the manufacturer could seek to terminate or reject all or certain of our franchises, (ii) if the manufacturer is successful in terminating all or certain of our franchises, we may not receive adequate compensation for those franchises, (iii) our cost to obtain financing for our new vehicle inventory may increase or no longer be available from such manufacturer’s captive finance subsidiary, (iv) consumer demand for such manufacturer’s products could be materially adversely affected, especially if costs related to improving such manufacturer’s financial condition are factored into the price of its products, (v) there may be a significant disruption in the availability of consumer credit to purchase or lease that manufacturer’s vehicles or negative changes in the terms of such financing, which may negatively impact our sales or (vi) there may be a reduction in the value of receivables and inventory associated with that manufacturer, among other things. The occurrence of any one or more of these
42
events could have a material adverse effect on our business, results of operations, financial condition and cash flows.
Our outstanding indebtedness, ability to incur additional debt and the provisions in the agreements governing our debt, and certain other agreements, could have a material adverse effect on our business, financial condition, results of operations and cash flows.
As of September 30, 2019, we had total debt of $905.9 million, which excludes total floor plan notes payable of $861.0 million, and we will incur substantial additional indebtedness in connection with the Acquisition. We have the ability to incur substantial additional debt in the future to finance, among other things, acquisitions, working capital and capital expenditures, subject in each case to the restrictions contained in our debt instruments and other agreements existing at the time such indebtedness is incurred.
Our debt service obligations could have important consequences to us for the foreseeable future, including the following: (i) our ability to obtain additional financing for acquisitions, capital expenditures, working capital or other general corporate purposes may be impaired; (ii) a substantial portion of our cash flow from operating activities must be dedicated to the payment of principal and interest on our debt, thereby reducing the funds available to us for our operations and other corporate purposes; (iii) some of our borrowings are and will continue to be at variable rates of interest, which exposes us to risks of interest rate increases; and (iv) we may be or become substantially more leveraged than some of our competitors, which may place us at a relative competitive disadvantage and make us more vulnerable to changes in market conditions and governmental regulations.
In addition to our ability to incur additional debt in the future, there are operating and financial restrictions and covenants, such as leverage covenants, in certain of our debt and mortgage agreements, including the agreement governing our 2019 Senior Credit Facility and our mortgage agreements and related mortgage guarantees, as well as certain other agreements to which we are a party that may adversely affect our ability to finance our future operations or capital needs or to pursue certain business activities. These limit, among other things, our ability to incur certain additional debt, create certain liens or other encumbrances and make certain payments (including dividends and repurchases of our common stock and for investments). Certain of these agreements also require us to maintain compliance with certain financial ratios.
Our failure to comply with any of these covenants in the future could constitute a default under the relevant agreement, which could, depending on the relevant agreement, (i) entitle the creditors under such agreement to terminate our ability to borrow under the relevant agreement and accelerate our obligations to repay outstanding borrowings; (ii) require us to repay those borrowings; (iii) entitle the creditors under such agreement to foreclose on the property securing the relevant indebtedness; or (iv) prevent us from making debt service payments on certain of our other indebtedness, any of which would have a material adverse effect on our business, financial condition, results of operations or cash flows. In many cases, a default under one of our debt, mortgage, or other agreements, could trigger cross-default provisions in one or more of our other debt or mortgage agreements. There can be no assurance that our creditors would agree to an amendment or waiver of our covenants. In the event we obtain an amendment or waiver, we would likely incur additional fees and higher interest expense.
In addition to the financial and other covenants contained in our various debt or mortgage agreements, certain of our lease agreements contain covenants that give our landlords the right to terminate the lease, seek significant cash damages, or evict us from the applicable property, if we fail to comply. Similarly, our failure to comply with any financial or other covenants in any of our framework agreements, would give the relevant manufacturer certain rights, including the right to reject proposed acquisitions, and may give it the right to repurchase its franchises from us. Events that give rise to such rights, and our inability to acquire additional dealerships or the requirement that we sell one or more of our dealerships at any time, could inhibit the growth of our business, and could have a material adverse effect on our business, financial condition, results of operations
43
and cash flows. Manufacturers may also have the right to restrict our ability to provide guarantees of our operating companies, pledges of the capital stock of our subsidiaries and liens on our assets, which could materially adversely effect our ability to obtain financing for our business and operations on favorable terms or at desired levels, if at all.
The occurrence of any one of these events may limit our ability to take strategic actions that would otherwise enable us to manage our business, in a manner in which we otherwise would, absent such limitations, which could materially adversely affect our business, financial condition, results of operations and cash flows.
Our business, financial condition and results of operations may be materially adversely affected by increases in interest rates.
We generally finance our purchases of new vehicle inventory, have the ability to finance the purchases of used vehicle inventory, and have the availability to borrow funds for working capital under our senior secured credit facilities that charge interest at variable rates. Therefore, our interest expense from variable rate debt will rise with increases in interest rates. In addition, a significant rise in interest rates may also have the effect of depressing demand in the interest rate sensitive aspects of our business, particularly new and used vehicle sales and the related profit margins and F&I revenue per vehicle, because most of our customers finance their vehicle purchases. As a result, rising interest rates may have the effect of simultaneously increasing our capital costs and reducing our revenues. Given our variable interest rate debt and floor plan notes payable outstanding as of September 30, 2019, each one percent increase in market interest rates would increase our total annual interest expense by as much as $8.9 million. When considered in connection with reduced expected sales as and if interest rates increase, any such increase could materially adversely affect our business, financial condition and results of operations.
Our vehicle sales, financial condition and results of operations may be materially adversely affected by changes in costs or availability of consumer financing.
The majority of vehicles purchased by our customers are financed. Reductions in the availability of credit to consumers have contributed to declines in our vehicle sales in past periods. Reductions in available consumer credit or increased costs of that credit, could result in a decline in our vehicle sales, which would have a material adverse effect on our financial condition and results of operations.
Lenders that have historically provided financing to those buyers who, for various reasons, do not have access to traditional financing, including those buyers who have a poor credit history or lack the down payment necessary to purchase a vehicle, are often referred to as subprime lenders. If market conditions cause subprime lenders to tighten credit standards, or if interest rates increase, the ability to obtain financing from subprime lenders for these consumers to purchase vehicles could become limited, resulting in a decline in our vehicle sales, which in turn, could have a material adverse effect on our financial condition and results of operations.
Substantial competition in automobile sales and services may have a material adverse effect on our results of operations.
The automotive retail and service industry is highly competitive with respect to price, service, location, and selection. Our competition includes: (i) franchised automobile dealerships in our markets that sell the same or similar new and used vehicles; (ii) privately negotiated sales of used vehicles; (iii) other used vehicle retailers, including regional and national vehicle rental companies; (iv) internet-based used vehicle brokers that sell used vehicles to consumers; (v) service center and parts supply chain stores; and (vi) independent service and repair shops.
We do not have any cost advantage over other retailers in purchasing new vehicles from manufacturers. We typically rely on our advertising, merchandising, sales expertise, service reputation, strong local branding
44
and dealership location to sell new vehicles. Because our dealer agreements only grant us a non-exclusive right to sell a manufacturer’s product within a specified market area, our revenues, gross profit and overall profitability may be materially adversely affected if competing dealerships expand their market share. Further, our vehicle manufacturers may decide to award additional franchises in our markets in ways that negatively impact our sales.
The internet has become a significant part of the advertising and sales process in our industry. Customers are using the internet to shop, and compare prices, for new and used vehicles, automotive repair and maintenance services, finance and insurance products and other automotive products. If we are unable to effectively use the internet to attract customers to our own on-line channels and mobile applications, and, in turn, to our stores, our business, financial condition, results of operations and cash flows could be materially adversely affected. Additionally, the growing use of social media by consumers increases the speed and extent that information and opinions can be shared, and negative posts or comments on social media about us or any of our stores, could damage our reputation and brand names, which could have a material adverse effect on our business, financial condition, results of operations and cash flows.
Additionally, if one or more companies are permitted to circumvent the state franchise laws of several states in the United States thereby permitting them to sell their new vehicles without the requirements of establishing a dealer-network, they may be able to have a competitive advantage over the traditional dealers, which could have a material adverse effect on our sales in those states.
We are dependent upon our relationships with the manufacturers of vehicles that we sell and are subject to restrictions imposed by, and significant influence from, these vehicle manufacturers. Any of these restrictions or any changes or deterioration of these relationships could have a material adverse effect on our business, financial condition, results of operations and cash flows.
We are dependent on our relationships with the manufacturers of the vehicles we sell, which have the ability to exercise a great deal of control and influence over our day-to-day operations, as a result of the terms of our dealer, framework and related agreements. We may obtain new vehicles from manufacturers, service vehicles, sell new vehicles and display vehicle manufacturers’ trademarks only to the extent permitted under these agreements. The terms of these agreements may conflict with our interests and objectives and may impose limitations on key aspects of our operations, including acquisition strategy and capital spending.
For example, manufacturers can set performance standards with respect to sales volume, sales effectiveness and customer satisfaction, and require us to obtain manufacturer consent before we can acquire dealerships selling a manufacturer’s automobiles. From time to time, we may be precluded under agreements with certain manufacturers from acquiring additional franchises, or subject to other adverse actions, to the extent we are not meeting certain performance criteria at our existing stores (with respect to matters such as sales volume, customer satisfaction and sales effectiveness) until our performance improves in accordance with the agreements, subject to applicable state franchise laws. In addition, many vehicle manufacturers place limits on the total number of franchises that any group of affiliated dealerships may own and certain manufacturers place limits on the number of franchises or share of total brand vehicle sales that may be maintained by an affiliated dealership group on a national, regional or local basis, as well as limits on store ownership in contiguous markets, which limits may be applicable to the Company as a result of the Acquisition. If we reach any of these limits, we may be prevented from making further acquisitions, or we may be required to dispose of certain dealerships, whether as a result of the Acquisition or otherwise, which could adversely affect our future growth. We cannot provide assurance that manufacturers will approve future acquisitions timely, if at all, which could significantly impair the execution of our acquisition strategy.
In addition, certain manufacturers use a dealership’s manufacturer-determined customer satisfaction index (“CSI”) score as a factor governing participation in incentive programs. To the extent we do not meet minimum score requirements, our future payments may be materially reduced or we may be precluded from receiving certain incentives, which could materially adversely affect our business, financial condition, results of operations and cash flows.
45
Manufacturers also typically establish facilities and minimum capital requirements for dealerships on a case-by-case basis. In certain circumstances, including as a condition to obtaining consent to a proposed acquisition, a manufacturer may require us to remodel, upgrade or move our facilities, and capitalize the subject dealership at levels we would not otherwise choose to fund, causing us to divert our financial resources away from uses that management believes may be of higher long-term value to us. Delays in obtaining, or failing to obtain, manufacturer consent, would impede our ability to execute acquisitions that we believe would integrate well with our overall strategy and limit our ability to expand our business.
Manufacturers can also establish new franchises or relocate existing franchises, subject to applicable state franchise laws. The establishment or relocation of franchises in our markets could have a material adverse effect on the business, financial condition and results of operations of our dealerships in the market in which the action is taken.
Manufacturers may also limit our ability to divest one or more of our dealerships in a timely manner or at all. Most of our dealer agreements provide the manufacturer with a right of first refusal to purchase any of the manufacturer’s franchises we seek to sell. Divestitures may also require manufacturer consent and failure to obtain consent would require us to find another potential buyer or wait until the buyer is able to meet the requirements of the manufacturer. A delay in the sale of a dealership could have a negative impact on our business, financial condition, results of operations, and cash flows.
Manufacturers may terminate or may not renew our dealer and framework agreements, or may compel us to divest our dealerships, for a number of reasons, including default under the agreement, any unapproved change of control (which specific changes vary from manufacturer to manufacturer, but which include material changes in the composition of our Board of Directors during a specified time period, the acquisition of 5% or more of our voting stock by another vehicle manufacturer or distributor, the acquisition of 20% or more of our voting stock by third parties, and the acquisition of an ownership interest sufficient to direct or influence management and policies), or certain other unapproved events (including certain extraordinary corporate transactions such as a merger or sale of all or substantially all of our assets). Triggers of these clauses are often based upon actions by our stockholders and are generally outside of our control. Restrictions on any unapproved changes of ownership or management may adversely impact our value, as they may prevent or deter prospective acquirers from gaining control of us. In addition, actions taken by a manufacturer to exploit its bargaining position in negotiating the terms of renewals of franchise agreements or otherwise, could also have a material adverse effect on our revenues and profitability.
There can be no assurances that we will be able to renew our dealer and framework agreements on a timely basis, on acceptable terms, or at all. Our business, financial condition and results of operations may be materially adversely affected to the extent that our rights become compromised or our operations are restricted due to the terms of our dealer or framework agreements or if we lose franchises representing a significant percentage of our revenues due to termination or failure to renew such agreements.
If vehicle manufacturers reduce or discontinue sales incentive, warranty or other promotional programs, our financial condition, results of operations and cash flows may be materially adversely affected.
We benefit from certain sales incentive, warranty, and other promotional programs of vehicle manufacturers that are intended to promote and support their respective new vehicle sales. Key incentive programs include: (i) customer rebates on new vehicles; (ii) dealer incentives on new vehicles; (iii) special financing or leasing terms; (iv) warranties on new and used vehicles; and (v) sponsorship of used vehicle sales by authorized new vehicle dealers. Vehicle manufacturers often make many changes to their incentive programs. Any reduction or discontinuation of manufacturers’ incentive programs for any reason, including a supply and demand imbalance, may reduce our sales volume which, in turn, could have a material adverse effect on our results of operations, cash flows, and financial condition.
46
If state laws that protect automotive retailers are repealed, weakened, or superseded by our framework agreements with manufacturers, our dealerships will be more susceptible to termination, non-renewal, or renegotiation of their dealer agreements, which could have a material adverse effect on our business, results of operations and financial condition.
Applicable state laws generally provide that an automobile manufacturer may not terminate or refuse to renew a dealer agreement unless it has first provided the dealer with written notice setting forth “good cause” and stating the grounds for termination or non-renewal. Some state laws allow dealers to file protests or petitions or allow them to attempt to comply with the manufacturer’s criteria within a notice period to avoid the termination or non-renewal. Our framework agreements with certain manufacturers contain provisions that, among other things, attempt to limit the protections available to dealers under these laws, and, though unsuccessful to date, manufacturers’ ongoing lobbying efforts may lead to the repeal or revision of these laws. If these laws are repealed in the states in which we operate, manufacturers may be able to terminate our franchises without providing advance notice, an opportunity to cure or a showing of good cause. Without the protection of these state laws, it may also be more difficult for us to renew our dealer agreements upon expiration. Changes in laws that provide manufacturers the ability to terminate our dealer agreements could materially adversely affect our business, financial condition and results of operations. Furthermore, if a manufacturer seeks protection from creditors in bankruptcy, courts have held that the federal bankruptcy laws may supersede the state laws that protect automotive retailers resulting in either the termination, non-renewal or rejection of franchises by such manufacturers, which, in turn, could materially adversely affect our business, financial condition and results of operations.
A failure of any of our information systems or those of our third-party service providers, or a data security breach with regard to personally identifiable information (“PII”) about our customers or employees, could have a material adverse effect on our business, results of operations, financial condition and cash flows.
We depend on the efficient operation of our information systems and those of our third-party service providers. We rely on information systems at our dealerships in all aspects of our sales and service efforts, as well in the preparation of our consolidated financial and operating data. All of our dealerships currently operate on a common dealer management system (“DMS”). Our business could be significantly disrupted if (i) the DMS fails to integrate with other third-party information systems, customer relations management tools or other software, or to the extent any of these systems become unavailable to us or fail to perform as designed for an extended period of time or (ii) our relationship with our DMS provider or any other third-party provider deteriorates. Additionally, any disruption to access and connectivity of our information systems due to natural disasters, power loss or other reasons could disrupt our business operations, impact sales and results of operations, expose us to customer or third-party claims, or result in adverse publicity.
Additionally, in the ordinary course of business, we and our partners receive significant PII about our customers in order to complete the sale or service of a vehicle and related products. We also receive PII from our employees. The regulatory environment surrounding information security and privacy is increasingly demanding, with numerous state and federal regulations, as well as payment card industry and other vendor standards, governing the collection and maintenance of PII from consumers and other individuals. We believe the automotive dealership industry is a particular target of identity thieves, as there are numerous opportunities for a data security breach, including cyber-security breaches, burglary, lost or misplaced data, scams, or misappropriation of data by employees, vendors or unaffiliated third parties. Because of the increasing number and sophistication of cyber-attacks, and despite the security measures we have in place and any additional measures we may implement or adopt in the future, our facilities and systems, and those of our third-party service providers, could be vulnerable to security breaches, computer viruses, lost or misplaced data, programming errors, scams, burglary, human errors, acts of vandalism and/or other events. Alleged or actual data security breaches can increase costs of doing business, negatively affect customer satisfaction and loyalty, expose us to negative publicity, individual claims or consumer class actions, administrative, civil or criminal investigations or actions, and infringe on proprietary information, any of which could have a material adverse effect on our business, financial condition, results of operations or cash flows.
47
Our operations are subject to extensive governmental laws and regulations. If we are found to be in purported violation of or subject to liabilities under any of these laws or regulations, or if new laws or regulations are enacted that adversely affect our operations, our business, results of operations, financial condition, cash flows, reputation and prospects could suffer.
The automotive retail industry, including our facilities and operations, is subject to a wide range of federal, state, and local laws and regulations, such as those relating to motor vehicle sales, retail installment sales, leasing, finance and insurance, marketing, licensing, consumer protection, consumer privacy, escheatment, anti-money laundering, environmental, vehicle emissions and fuel economy, and health and safety. In addition, with respect to employment practices, we are subject to various laws and regulations, including complex federal, state, and local wage and hour and anti-discrimination laws. The violation of the laws or regulations to which we are subject could result in administrative, civil, or criminal sanctions against us, which may include a cease and desist order against the subject operations or even revocation or suspension of our license to operate the subject business, as well as significant fines and penalties. Violation of certain laws and regulations to which we are subject may also subject us to consumer class action or other lawsuits or governmental investigations and adverse publicity. We currently devote significant resources to comply with applicable federal, state, and local regulation of health, safety, environmental, zoning and land use regulations, and we may need to spend additional time, effort, and money to keep our operations and existing or acquired facilities in compliance therewith.
In addition, there is a risk that our employees could engage in misconduct that violates the laws or regulations to which we are subject. It is not always possible to detect or deter employee misconduct, and the precautions we take to detect and prevent this activity may not be effective in all cases. If any of our employees were to engage in misconduct or were to be accused of such misconduct, our business and reputation could be adversely affected.
The Dodd-Frank Act, which was signed into law on July 21, 2010, established the Consumer Financial Protection Bureau (“CFPB”), an independent federal agency funded by the United States Federal Reserve with broad regulatory powers and limited oversight from the United States Congress. Although automotive dealers are generally excluded, the Dodd-Frank Act could lead to additional, indirect regulation of automotive dealers, in particular, their sale and marketing of finance and insurance products, through its regulation of automotive finance companies and other financial institutions. In addition, the CFPB possesses supervisory authority with respect to certain non-bank lenders, including automotive finance companies, participating in automotive financing. The Dodd-Frank Act also provided the Federal Trade Commission (“FTC”) with new and expanded authority regarding automotive dealers. Since then, the FTC has been gathering information on consumer protection issues through roundtables, public comments and consumer surveys. The FTC may exercise its additional rule-making authority to expand consumer protection regulations relating to the sale, financing and leasing of motor vehicles. In 2014, the FTC implemented an enforcement initiative relating to the advertising practices of automotive dealers. In connection therewith, in May 2016, we signed a consent order with the FTC to settle allegations that in certain instances our advertisements did not adequately disclose information about used vehicles with open safety recalls. Under the consent order, we did not agree to make any payments or admit wrong-doing, but we did agree to make certain disclosures in marketing materials and at the point of sale and comply with certain record-keeping obligations.
Continued pressure from the CFPB, FTC, and other federal agencies could lead to significant changes in the manner that dealers are compensated for arranging customer financing, and while it is difficult to predict how any such changes might impact us, any adverse changes could have a material adverse impact on our finance and insurance business and results of operations. Furthermore, we expect that new laws and regulations, particularly at the federal level, in other areas may be enacted, which could also materially adversely impact our business.
Environmental laws and regulations govern, among other things, discharges into the air and water, storage of petroleum substances and chemicals, the handling and disposal of solid and hazardous wastes, investigation and remediation of contamination. Similar to many of our competitors, we have incurred and expect
48
to continue to incur capital and operating expenditures and other costs to comply with such federal and state statutes. In addition, we may become subject to broad liabilities arising out of contamination at our currently and formerly owned or operated facilities, at locations to which hazardous substances were transported from such facilities, and at such locations related to entities formerly affiliated with us. For such potential liabilities, we believe we are entitled to indemnification from other entities. However, we cannot provide assurance that such entities will view their obligations as we do or will be able or willing to satisfy them. Failure to comply with applicable laws and regulations, or significant additional expenditures required to maintain compliance therewith, could have a material adverse effect on our business, results of operations, financial condition or cash flows.
A significant judgment against us or the imposition of a significant fine could have a material adverse effect on our business, financial condition and future prospects. We further expect that, from time to time, new laws and regulations, particularly in the environmental area will be enacted, and compliance with such laws, or penalties for failure to comply, could significantly increase our costs. For example, vehicle manufacturers are subject to government-mandated fuel economy and greenhouse gas emission standards, which continue to change and become more stringent over time. Specifically, vehicle manufacturers are subject to corporate average fuel economy standards (“CAFE”) for passenger cars and light trucks. Failure of a manufacturer to develop passenger vehicles and light trucks that meet CAFE and/or greenhouse gas emission standards could subject the manufacturer to substantial penalties, increase the cost of vehicles sold to us, and adversely affect our ability to market and sell vehicles to meet consumer needs and desires, which could have a material adverse effect on our business, results of operations, financial condition or cash flows.
We are subject to risks related to the provision of employee health care benefits, which could have a material adverse effect on our business, results of operations, financial condition and cash flows.
We use a combination of insurance and self-insurance for health care plans. We record expenses under those plans based on estimates of the costs of expected claims, administrative costs, stop-loss insurance premiums, and expected health care trends. Actual costs under these plans are subject to variability that is dependent upon participant enrollment, demographics and the actual costs of claims made. Negative trends in any of these areas could cause us to incur additional unplanned health care costs, which could adversely impact our business, financial condition, results of operations and cash flows. In addition, if enrollment in our health care plans increases significantly, the additional costs that we will incur may be significant enough to materially affect our business, financial condition, results of operations and cash flows.
We are, and expect to continue to be, subject to legal and administrative proceedings, which, if the outcomes are adverse to us, could have a material adverse effect on our business, results of operations, financial condition, cash flows, reputation and prospects.
We are involved and expect to continue to be involved in numerous legal proceedings arising out of the conduct of our business, including litigation with customers, employment-related lawsuits, class actions, purported class actions and actions brought by governmental authorities. We do not believe that the ultimate resolution of any known matters will have a material adverse effect on our business, reputation, financial condition, results of operations, cash flows or prospects. However, the results of these matters cannot be predicted with certainty, and an unfavorable resolution of one or more of these matters could have a material adverse effect on our business, financial condition, results of operations and cash flows.
Property loss or other uninsured liabilities could have a material adverse impact on our results of operations.
We are subject to substantial risk of property loss due to the significant concentration of property at dealership locations, including vehicles and parts. We have historically experienced business interruptions from time to time at several of our dealerships, due to actual or threatened adverse weather conditions or natural disasters, such as hurricanes, tornadoes, floods, hail storms or other extraordinary events. Concentration of property at dealership locations also makes the automotive retail business particularly vulnerable to theft, fraud
49
and misappropriation of assets. Illegal or unethical conduct by employees, customers, vendors, and unaffiliated third parties can result in loss of assets, disrupt operations, impact brand reputation, jeopardize manufacturer and other relationships, result in the imposition of fines or penalties, and subject us to governmental investigations or lawsuits. While we maintain insurance to protect against a number of losses, this insurance coverage often contains significant deductibles. In addition, we “self-insure” a portion of our potential liabilities, meaning we do not carry insurance from a third-party for such liabilities, and are wholly responsible for any related losses including for certain potential liabilities that some states prohibit the maintenance of insurance to protect against. In certain instances, our insurance may not fully cover a loss depending on the applicable deductible or the magnitude and nature of the claim. Additionally, changes in the cost or availability of insurance in the future could substantially increase our costs to maintain our current level of coverage or could cause us to reduce our insurance coverage and increase our self-insured risks. To the extent we incur significant additional costs for insurance, suffer losses that are not covered by in-force insurance or suffer losses for which we are self-insured, our financial condition, results of operations or cash flows could be materially adversely impacted.
A decline in our credit rating or a general disruption in the credit markets could negatively impact our liquidity and ability to conduct our operations.
A deterioration of our credit rating, or a general disruption in the credit markets, could limit our ability to obtain credit on terms acceptable to us, or at all. In addition, uncertain economic conditions or the re-pricing of certain credit risks may make it more difficult for us to obtain one or more types of funding in the amounts, or at rates considered acceptable to us, at any given time. Our inability to access necessary or desirable funding, or to enter into certain related transactions, at times and at costs deemed appropriate by us, could have a negative impact on our liquidity and our ability to conduct our operations. Any of these developments could also reduce the ability or willingness of the financial institutions that have extended credit commitments to us, or that have entered into hedge or similar transactions with us, to fulfill their obligations to us, which also could have a material adverse effect on our liquidity and our ability to conduct our operations.
We are subject to risks associated with imported product restrictions or limitations, foreign trade and currency valuations.
Our business involves the sale of vehicles, parts or vehicles composed of parts that are manufactured outside the United States. As a result, our operations are subject to risks of doing business outside of the United States and importing merchandise, including import duties, exchange rates, trade restrictions, work stoppages, natural or man-made disasters, and general political and socio-economic conditions in other countries. The United States or the countries from which our products are imported may, from time to time, impose new quotas, duties, tariffs or other restrictions or limitations, or adjust presently prevailing quotas, duties or tariffs. The imposition of new, or adjustments to prevailing, quotas, duties, tariffs or other restrictions or limitations could have a material adverse effect on our business, financial condition, results of operations and cash flows. Relative weakness of the U.S. dollar against foreign currencies in the future may result in an increase in costs to us and in the retail price of such vehicles or parts, which could discourage consumers from purchasing such vehicles and adversely impact our revenues and profitability.
If we are unable to acquire and successfully integrate additional dealerships into our business, our revenue and earnings growth may be adversely affected.
We believe that the automotive retailing industry is a mature industry whose sales are significantly impacted by the prevailing economic climate, both nationally and in local markets. Accordingly, we believe that our future growth depends in part on our ability to manage expansion, control costs in our operations and acquire and effectively integrate acquired dealerships into our organization. When seeking to acquire other dealerships, we often compete with several other national, regional and local dealership groups, and other strategic and financial buyers, some of which may have greater financial resources than us. Competition for attractive
50
acquisition targets may result in fewer acquisition opportunities for us and we may have to forgo acquisition opportunities to the extent we cannot negotiate such acquisitions on acceptable terms.
We also face additional risks commonly encountered with growth through acquisitions. These risks include, but are not limited to: (i) failing to obtain manufacturers’ consents to acquisitions of additional franchises; (ii) incurring significant transaction-related costs for both completed and failed acquisitions; (iii) incurring significantly higher capital expenditures and operating expenses; (iv) failing to integrate the operations and personnel of the acquired dealerships and impairing relationships with employees; (v) incorrectly valuing entities to be acquired or incurring undisclosed liabilities at acquired dealerships; (vi) disrupting our ongoing business and diverting our management resources to newly acquired dealerships; (vii) failing to achieve expected performance levels; and (viii) impairing relationships with manufacturers and customers as a result of changes in management.
We may not adequately anticipate all the demands that our growth will impose on our personnel, procedures and structures, including our financial and reporting control systems, data processing systems, and management structure. Moreover, our failure to retain qualified management personnel at any acquired dealership may increase the risks associated with integrating the acquired dealership. If we cannot adequately anticipate and respond to these demands, we may fail to realize acquisition synergies and our resources will be focused on incorporating new operations into our structure rather than on areas that may be more profitable.
We are a holding company and as a result are dependent on our operating subsidiaries to generate sufficient cash and distribute cash to us to service our indebtedness and fund our ongoing operations.
Our ability to make payments on our indebtedness and fund our ongoing operations depends on our operating subsidiaries’ ability to generate cash in the future and distribute that cash to us. It is possible that our subsidiaries may not generate cash from operations in an amount sufficient to enable us to service our indebtedness. In addition, many of our subsidiaries are required to comply with the provisions of franchise agreements, dealer agreements, other agreements with manufacturers, mortgages, and credit facility providers. Many of these agreements contain minimum working capital or net worth requirements, and are subject to change at least annually. Although the requirements contained in these agreements did not restrict our subsidiaries from distributing cash to us as of September 30, 2019, unexpected changes to our financial metrics or to the terms of our franchise agreements, dealer agreements or other agreements with manufacturers could require us to alter the manner in which we distribute or use cash. If our operating subsidiaries are unable to generate and distribute sufficient cash to us to service our indebtedness and fund our ongoing operations, our financial condition may be materially adversely affected.
Goodwill and manufacturer franchise rights comprise a significant portion of our total assets. We must test our goodwill and manufacturer franchise rights for impairment at least annually, which could result in a material, non-cash write-down of goodwill or manufacturer franchise rights and could have a material adverse effect on our results of operations and stockholders’ equity.
Our principal intangible assets are goodwill and our rights under our franchise agreements with vehicle manufacturers. Goodwill and indefinite-lived intangible assets, including manufacturer franchise rights, are subject to impairment assessments at least annually (or more frequently when events or changes in circumstances indicate that an impairment may have occurred), by applying a qualitative or quantitative assessment. A decrease in our market capitalization or profitability increases the risk of goodwill impairment. The fair value of our manufacturer franchise rights is determined by discounting a sub-set of the projected cash flows at a dealership that we attribute to the value of the franchise. Changes to the business mix or declining cash flows in a dealership increase the risk of impairment. An impairment loss could have a material adverse effect on our results of operations and stockholders’ equity. During the years ended December 31, 2018 and 2017, we recognized $3.7 million and $5.1 million, respectively, in pre-tax non-cash impairment charges associated with manufacturer franchise rights recorded at certain dealerships.
51
Technological advances, including increases in ride sharing applications, electric vehicles and autonomous vehicles in the long-term could have a material adverse effect on our business.
The automotive industry is predicted to experience change over the long-term. Shared vehicle services such as Uber and Lyft provide consumers with increased choice in their personal mobility options. The effect of these and similar mobility options on the retail automotive industry is uncertain, and may include lower levels of new vehicles sales. In addition, technological advances are facilitating the development of driverless vehicles. The eventual timing of widespread availability of driverless vehicles is uncertain due to regulatory requirements, additional technological requirements, and uncertain consumer acceptance of these vehicles. The effect of driverless vehicles on the automotive retail industry is uncertain and could include changes in the level of new and used vehicles sales, the price of new vehicles, and the role of franchised dealers, any of which could materially adversely affect our business, financial condition and results of operations. The widespread adoption of electric and battery powered vehicles also could have a material adverse effect on the profitability of our parts and service business.
Risks Related to the Acquisition
The Acquisition, if consummated, will create numerous risks and uncertainties which could adversely affect our business and results of operations.
After consummation of the Acquisition, we will have significantly more sales, assets and employees than we did prior to the transaction. The integration process will require us to expend significant capital and significantly expand the scope of our operations and financial systems. Our management will be required to devote a significant amount of time and attention to the process of integrating the operations of our business with that of Park Place. There is a significant degree of difficulty and management involvement inherent in that process.
These difficulties include:
| • | integrating the operations of Park Place while carrying on the ongoing operations of our business; |
| • | managing a significantly larger company than before consummation of the Acquisition; |
| • | the possibility of faulty assumptions underlying our expectations regarding the integration process, including, among other things, unanticipated delays, costs or inefficiencies; |
| • | the effects of unanticipated liabilities; |
| • | operating a more diversified business; |
| • | integrating two separate business cultures, which may prove to be incompatible; |
| • | attracting and retaining the necessary personnel associated with the business of Park Place following the Acquisition; |
| • | creating uniform standards, controls, procedures, policies and information systems and controlling the costs associated with such matters; and |
| • | integrating information, purchasing, accounting, finance, sales, billing, payroll and regulatory compliance systems. |
52
As a private company, Park Place was not required to obtain an audit of its internal control over financial reporting or otherwise have such internal control assessed, except to the extent required in connection with audits pursuant to GAAP; however, following the consummation of the Acquisition, the financial systems of Park Place will be integrated into our financial system and subject to the internal control audit required with respect to the Company as a public company.
If any of these factors limits our ability to integrate Park Place into our operations successfully or on a timely basis, the expectations of future results of operations, including certain run-rate synergies expected to result from the Acquisition, might not be met. As a result, we may not be able to realize the expected benefits that we seek to achieve from the Acquisition, which could also affect our ability to service our debt obligations, including the Notes. In addition, we may be required to spend additional time or money on integration that otherwise would be spent on the development and expansion of our business, including efforts to further expand our product portfolio.
This offering memorandum includes certain financial information prepared by Park Place that has not been independently reviewed or audited.
The financial information for the three months ended December 31, 2019 attributable to Park Place for such period is based on good faith estimates of Asbury management derived entirely from financial information provided by the management of Park Place acquired in the due diligence process prior to our ownership and control thereof. Accordingly, although we believe such information to be accurate, such information cannot be independently verified by our management, nor has such information been independently reviewed or audited by our auditors or the auditors for Park Place. We cannot assure you that such financial information of Park Place for the three month period ended December 31, 2019 would not be materially different if such information was reviewed or audited by our auditors. See “Summary—Summary Historical Consolidated Financial Information of Park Place.”
We may be unable to realize the anticipated cost savings or operational improvements or may incur additional and/or unexpected costs in order to realize them.
There can be no assurance that we will be able or realize the anticipated cost savings or operational improvements from the proposed transaction in the anticipated amounts or within the anticipated timeframes or costs expectations or at all. We are implementing a series of cost savings initiatives at the Combined Company that, as described above under “Summary—Summary Historical Consolidated Financial Information of Asbury and Unaudited Pro Forma Condensed Combined Financial Information of the Combined Company,” we expect to result in recurring, annual run-rate cost savings. We expect to incur one-time, non-recurring costs to achieve such synergies.
These or any other cost savings or operational improvements that we realize may differ materially from our estimates. We cannot provide assurances that these anticipated savings will be achieved or that our programs and improvements will be completed as anticipated or at all. In addition, any cost savings that we realize may be offset, in whole or in part, by reductions in revenues or through increases in other expenses.
The projections and assumptions related to cost savings contained in this offering memorandum are based on our current estimates, but they involve risks, uncertainties, projections and other factors that may cause actual results, performance or achievements to be materially different from any future results, performance or achievements, express or implied. Neither our independent auditors nor any other independent auditors, have examined, compiled or performed any procedures with respect to these projections, nor have they expressed any opinion, or any other form of assurance on such information or their achievability. Assumptions relating to these projections involve subjective decisions and judgments with respect to, among other things, the estimated impact of certain operational adjustments, including the reduction in corporate costs, lowering servicing costs by maintaining key store-level accounting and administrative activities in our shared service centers and leveraging our scale to reduce costs related to purchasing certain equipment, supplies and services through national vendor
53
relationships, as well expected operational improvements primarily with respect to F&I and to a lesser extent P&S, and other cost and savings adjustments, as well as future economic, competitive, industry and market conditions and future business decisions, all of which are inherently uncertain and may be beyond the control of our management. Although our management believes these estimates and assumptions to be reasonable, any of the assumptions could be inaccurate and investors should not place undue reliance upon the calculation of Pro Forma Adjusted EBITDA or Pro Forma Adjusted EBITDAR after anticipated cost savings given how they are calculated and the possibility that the underlying estimates and assumptions may ultimately not reflect actual results. Any of the assumptions could be inaccurate and, therefore, there can be no assurance that Pro Forma Adjusted EBITDA or Pro Forma Adjusted EBITDAR described herein will prove to be accurate or that the objectives and plans expressed will be achieved. The internal financial projections used to calculate estimated cost savings also do not take into account any circumstances or events occurring after the date on which they were prepared. These internal financial projections reflect assumptions as to certain business decisions that are subject to change. As a result, actual results may differ materially from those contained in these internal financial projections. Accordingly, there can be no assurance that the internal financial projections will be realized or that actual results will not be significantly higher or lower than projected. We undertake no obligation to update or otherwise revise or reconcile these internal financial projections whether as a result of new information, future events or otherwise.
Failure to realize the expected costs savings and operating synergies related to the Acquisition could result in increased costs and have an adverse effect on the Combined Company’s financial results and prospects.
If the Acquisition is consummated, our post-closing recourse for liabilities related to Park Place is limited.
As part of the Acquisition, we will assume certain liabilities of Park Place. There may be liabilities that we failed or were unable to discover in the course of performing due diligence investigations into Park Place. In addition, as Park Place is integrated, we may learn additional information about Park Place, such as unknown or contingent liabilities or other issues relating to the operations of Park Place. Any such liabilities or issues, individually or in the aggregate, could have a material adverse effect on our business, financial condition and results of operations. Under the Asset Purchase Agreement, the Sellers will be liable for certain breaches of representations, warranties and covenants but our recovery may be contingent upon the aggregate damages arising out of any such breaches exceeding specified dollar thresholds and is subject to other time-based and monetary-based limitations. Accordingly, we may not be able to enforce certain claims against the sellers with respect to liabilities of Park Place.
We do not currently control Park Place and will not control Park Place until completion of the Acquisition.
We do not currently control Park Place and will not control Park Place until completion of the Acquisition. The Asset Purchase Agreement imposes certain limitations on how Park Place manages its business, but we cannot assure you that Park Place’s business will be operated in the same way as it would be under our control.
The pro forma financial information in this offering memorandum may not be reflective of our operating results and financial condition following the Transactions.
The pro forma financial information included in this offering memorandum is derived from our and Park Place’s historical audited and unaudited financial statements. We prepared the pro forma information based upon available information and assumptions and estimates that we believe are reasonable. This pro forma information may not necessarily reflect what our results of operations and financial position would have been had the Transactions occurred during the periods presented or what our results of operations and financial position will be in the future. For example, the financing, integration, restructuring and transaction costs related to the Acquisition could be higher or lower than currently estimated. In addition, our customers may not buy products or services from us following completion of the Transactions in the expected amounts, and as a result, our revenue could materially decline or any anticipated increases in our revenue could be lower than expected.
54
The purchase price for the Acquisition could increase significantly from our estimate in this offering memorandum, which may adversely impact our liquidity.
The estimated purchase price for the Acquisition in the “Use of Proceeds” section of this offering memorandum is based, in part, on the value of the vehicle inventory at the Park Place dealerships as of September 30, 2019. The actual purchase price will be based, in part, on the value of vehicle inventory at the Park Place dealerships on the closing date of the Acquisition. The value of vehicle inventories at automobile dealerships fluctuates significantly due to changes in economic conditions, the availability of consumer financing and the seasonality of demand for vehicles, among other factors. If the value of the vehicle inventory at the Park Place dealerships is greater than we estimated at September 30, 2019, we will be required to pay additional purchase price consideration, which may require use to draw on existing sources of liquidity, including the Revolving Credit Facility and cash on hand. To the extent we are required to pay a higher purchase price for the Acquisition, we may have less liquidity to fund our other operations and growth strategies, which may adversely impact our financial condition, results of operations or cash flows.
55
DESCRIPTION OF OTHER INDEBTEDNESS
2019 Senior Credit Facility
We are party to a credit agreement with Bank of America, N.A. (“Bank of America”), as administrative agent, and the other co-syndication agents and lenders party thereto (as amended, restated or supplemented from time to time, the “2019 Senior Credit Agreement”). The 2019 Senior Credit Agreement provides for a credit facility consisting of a (i) $250.0 million revolving credit facility (the “Revolving Credit Facility”) with a $50.0 million sublimit for letters of credit, (ii) $1.04 billion new vehicle revolving floor plan facility (the “New Vehicle Floor Plan Facility”), and (iii) $160.0 million used vehicle revolving floor plan facility (the “Used Vehicle Floor Plan Facility” and, together with the Revolving Credit Facility and the New Vehicle Floor Plan Facility, the “2019 Senior Credit Facility”), in each case subject to limitations on borrowing availability as set out in the 2019 Senior Credit Agreement.
Subject to the compliance with certain conditions, the 2019 Senior Credit Agreement provides that we and our dealership subsidiaries that are borrowers under the 2019 Senior Credit Facility (collectively, the “Borrowers”) have the ability, at our option, to re-designate a portion of our availability under the Revolving Credit Facility to the New Vehicle Floor Plan Facility or the Used Vehicle Floor Plan Facility, provided that no more than 20% of the aggregate floorplan commitments may be allocated to the Used Vehicle Floorplan Facility. The maximum amount we are allowed to re-designate is determined based on aggregate commitments under the Revolving Credit Facility. In addition, we are able to designate any amounts in the New Vehicle Floor Plan Facility or the Used Vehicle Floor Plan Facility back to the Revolving Credit Facility. The 2019 Senior Credit Agreement also provides that we have the ability, at our option and subject to the receipt of additional commitments from existing or new lenders, to increase the size of the facilities without lender consent in an amount not exceeding the amount equal to the sum of (A) the amount that would make the Consolidated Secured Leverage Ratio equal to 2.00 to 1.00 plus (B) $350 million and provided commitments under the Revolving Credit Facility shall not exceed 20% of the aggregate commitment.
Proceeds from borrowings under the 2019 Senior Credit Facility will be used, among other things, (i) to finance the purchase of new and used vehicles by us and certain of our subsidiaries, (ii) for our working capital needs and the working capital needs of certain of our subsidiaries, and (iii) for other general corporate purposes.
Borrowings under the Revolving Credit Facility bear interest, at our option, based on the London Interbank Offered Rate (“LIBOR”) or the Base Rate, in each case plus an Applicable Rate. The Base Rate is the highest of (i) the Federal Funds Rate plus 0.50%, (ii) the Bank of America prime rate, and (iii) one month LIBOR plus 1.00%. Applicable Rate means with respect to the Revolving Credit Facility, a range from 1.00% to 2.00% for LIBOR loans and 0.15% to 1.00% for Base Rate loans, in each case based on our consolidated total lease adjusted leverage ratio.
In connection with the New Vehicle Floor Plan Facility, we continue to maintain an offset account with Bank of America that allows us to transfer cash as an offset to floor plan notes payable. These transfers reduce the amount of outstanding new vehicle floor plan notes payable that would otherwise accrue interest, while retaining the ability to transfer amounts from the offset account into our operating cash accounts within one to two days. As a result of the use of our floor plan offset account, we experience a reduction in Floor Plan Interest Expense on our Consolidated Statements of Income.
In addition to the payment of interest on borrowings outstanding under the 2019 Senior Credit Facility, we are required to pay a quarterly commitment fee on total unused commitments thereunder. The fee for unused commitments under the Revolving Credit Facility is between 0.15% and 0.40% per year, based on our total lease adjusted leverage ratio, and the fee for unused commitments under the New Vehicle Facility Floor Plan and the Used Vehicle Facility Floor Plan Facility is 0.15% per year.
56
The 2019 Senior Credit Facility matures, and all amounts outstanding thereunder will be due and payable, on September 25, 2024.
The representations and covenants contained in the 2019 Senior Credit Agreement are customary for financing transactions of this nature including, among others, a requirement to comply with a minimum consolidated current ratio and consolidated fixed charge coverage ratio (each as defined in the 2019 Senior Credit Agreement) and a maximum consolidated total lease adjusted leverage ratio, in each case as set out in the 2019 Senior Credit Agreement. In addition, certain other covenants could restrict our ability to incur additional debt, pay dividends or acquire or dispose of assets.
The 2019 Senior Credit Agreement also provides for events of default that are customary for financing transactions of this nature, including cross-defaults to other material indebtedness. In certain instances, an event of default under either the Revolving Credit Facility or the Used Vehicle Floor Plan Facility could be, or result in, an event of default under the New Vehicle Floor Plan Facility, and vice versa. Upon the occurrence of an event of default, we could be required to immediately repay all amounts outstanding under the applicable facility.
The obligations under the 2019 Senior Credit Agreement are guaranteed by each existing, and will be guaranteed by each of our future, direct and indirect domestic subsidiaries, other than, at our option, any immaterial subsidiary. The obligations under the New Vehicle Floor Plan Facility and Used Vehicle Floor Plan Facility are each also guaranteed by us. The obligations under each of the Revolving Credit Facility and the Used Vehicle Floor Plan Facility are collateralized by liens on substantially all of the present and future assets, other than real property, of us and the guarantors. The obligations under the New Vehicle Floor Plan Facility are collateralized by liens on substantially all of the present and future assets, other than real property, of the borrowers under the New Vehicle Floor Plan Facility.
Amendment in connection with the Acquisition
In connection with the Acquisition, we have obtained an amendment, among other things, to (1) increase the aggregate commitments under the Revolving Credit Facility to $350,000,000, (2) increase the aggregate commitments under the New Vehicle Floorplan Facility to $1,350,000,000 and (3) increase the aggregate commitments under the Used Vehicle Floorplan Facility to $200,000,000. These amendments to increase the aggregate commitments will become effective concurrently with the consummation of the Acquisition. In connection with the consummation of the Acquisition, we intend to borrow approximately $387 million under the 2019 Senior Credit Facility with respect to existing Park Place vehicle inventory, including approximately $237 million under the New Vehicle Floor Plan Facility and approximately $150 million under the Used Vehicle Floor Plan Facility.
Other Floor Plan Financing Facilities
In addition to the New Vehicle Floor Plan Facility and Used Vehicle Floor Plan Facility, which are components of our 2019 Senior Credit Facility, we also have floor plan facilities with Ford to purchase new Ford and Lincoln vehicle inventory, as well as facilities with certain other manufacturers for loaner vehicles. Neither our floor plan facility with Ford nor our facilities for loaner vehicles have stated borrowing limitations.
Borrowings under these other floor plan financing facilities accrue interest at 1.50% above the prime rate.
Under the terms of the collateral documents entered into with the lenders under these other floor plan financing facilities, we and all of our dealership subsidiaries have granted security interests in the vehicle inventory financed under the respective floor plan facilities, as well as the proceeds from the sale of such vehicles, and certain other collateral.
57
Regardless of whether borrowings are under our 2019 Senior Credit Facility or one of our other floor plan financing facilities, we consider floor plan notes payable to a lender unaffiliated with the manufacturer from which we purchase a new vehicle “Non-Trade” and all floor plan notes relating to used vehicles “Floor Plan Notes Payable-Non-Trade” and a purchase from a lender affiliated with the manufacturer from which we purchase our new vehicle inventory “Floor Plan Notes Payable-Trade.” As of September 30, 2019, we had $122.1 million of Floor Plan Notes Payable-Trade, net and $738.9 million of Floor Plan Notes Payable-Non-Trade, net outstanding, excluding $19.5 million of floor plan notes payable classified as Liabilities Associated with Assets Held for Sale. For a more detailed discussion of our floor plan notes payable, see “Management’s Discussion and Analysis of Financial Condition and Results of Operation—Liquidity and Capital Resources” for the three months ended September 30, 2019, which is included elsewhere in this offering memorandum.
2013 BofA Real Estate Facility
On September 26, 2013, we entered into a real estate term loan credit agreement (the “2013 BofA Real Estate Credit Agreement”) with Bank of America, N.A. (“Bank of America”), as lender, providing for term loans in an aggregate amount not to exceed $75.0 million, subject to customary terms and conditions (the “2013 BofA Real Estate Facility”). Term loans under our 2013 BofA Real Estate Facility bear interest, at our option, based on LIBOR plus 1.50% or the Base Rate (as described below) plus 0.50%. The Base Rate is the highest of (i) the Federal Funds rate plus 0.50%, (ii) the Bank of America prime rate, and (iii) one month LIBOR plus 1.0%. Our right to make draws under the 2013 BofA Real Estate Facility terminated on December 26, 2013. We are required to make quarterly principal payments of 1.25% of the initial amount of each loan on a twenty year repayment schedule, with a balloon repayment of the outstanding principal amount of loans due on September 26, 2023. Borrowings under the 2013 BofA Real Estate Facility are guaranteed by each of our operating dealership subsidiaries whose real estate is financed under the 2013 BofA Real Estate Facility, and are collateralized by first priority liens, subject to certain permitted exceptions, on all of the real property financed thereunder.
The representations and covenants contained in the 2013 BofA Real Estate Credit Agreement are customary for financing transactions of this nature, including, among others, a requirement to comply with a minimum consolidated current ratio, minimum consolidated fixed charge coverage ratio and maximum consolidated total lease adjusted leverage ratio, in each case as set out in the 2013 BofA Real Estate Credit Agreement. In addition, certain other covenants could restrict our ability to incur additional debt, pay dividends or acquire or dispose of assets. The 2018 BofA Real Estate Credit Agreement also provides for events of default that are customary for financing transactions of this nature, including cross-defaults to other material indebtedness. Upon the occurrence of an event of default, we could be required by the 2013 BofA Real Estate Credit Agreement to immediately repay all amounts outstanding thereunder.
As of September 30, 2019, we had $36.1 million in term loans outstanding under the 2013 BofA Real Estate Facility.
2015 Wells Fargo Master Loan Facility
On February 3, 2015, certain of our subsidiaries entered into an amended and restated master loan agreement (as amended, restated or supplemented from time to time, the “2015 Wells Fargo Master Loan Agreement”) with Wells Fargo Bank, National Association (“Wells Fargo”), as lender, which provides form term loans to certain of our subsidiaries that are borrowers under the 2015 Wells Fargo Master Loan Agreement in an aggregate amount not to exceed $100.0 million (the “2015 Wells Fargo Master Loan Facility”). Our right to make draws under the 2015 Wells Fargo Master Loan Facility terminated on February 1, 2016. Term loans under the 2015 Wells Fargo Master Loan Facility bear interest based on LIBOR plus 1.85%. We are required to make quarterly principal payments with respect to the initial amount of each loan in 108 equal monthly principal payments based on a hypothetical 19 year amortization schedule, with a balloon repayment of the outstanding
58
principal amount of loans due on February 1, 2025. Borrowings under the 2015 Wells Fargo Master Loan Facility can be voluntarily prepaid in whole or in part any time without premium or penalty. Borrowings under the 2015 Wells Fargo Master Loan Facility are guaranteed by us pursuant to an unconditional guaranty, and all of the real property financed by any of our operating dealership subsidiaries under the 2015 Wells Fargo Master Loan Facility is collateralized by first priority liens, subject to certain permitted exceptions.
The representations, warranties and covenants contained in the 2015 Wells Fargo Master Loan Agreement and the related documents are customary for financing transactions of this nature, including, among others, a requirement to comply with a minimum consolidated current ratio, minimum consolidated fixed charge coverage ratio and maximum consolidated total lease adjusted leverage ratio. In addition, certain other covenants could restrict our ability to incur additional debt, pay dividends or acquire or dispose of assets. The 2015 Wells Fargo Master Loan Agreement also provides for events of default that are customary for financing transactions of this nature, including cross-defaults to other material indebtedness. Upon the occurrence of an event of default, we could be required by the 2015 Wells Fargo Master Loan Facility to immediately repay all amounts outstanding thereunder.
As of September 30, 2019, there was $79.5 million outstanding under the 2015 Wells Fargo Master Loan Facility.
2018 BofA Real Estate Facility
On November 13, 2018, we entered into a real estate term loan credit agreement (as amended, restated or supplemented from time to time, the “2018 BofA Real Estate Credit Agreement”) with Bank of America, as lender, providing for term loans in an aggregate amount not to exceed $128.1 million, subject to customary terms and conditions (the “2018 BofA Real Estate Facility”). Our right to make draws under the 2018 BofA Real Estate Facility terminated on November 13, 2019. Term loans under our 2018 BofA Real Estate Facility bear interest, at our option, based on LIBOR plus 1.90% or the Base Rate (as described below) plus 0.50%. The Base Rate is the highest of (i) the Federal Funds rate plus 0.50%, (ii) the Bank of America prime rate, and (iii) one month LIBOR plus 1.0%. We are required to make quarterly principal payments of 1.25% of the initial amount of each loan on a twenty year repayment schedule, with a balloon repayment of the outstanding principal amount of loans due on November 13, 2025. Borrowings under the 2018 BofA Real Estate Facility are guaranteed by each of our operating dealership subsidiaries whose real estate is financed under the 2018 BofA Real Estate Facility, and are collateralized by first priority liens, subject to certain permitted exceptions, on all of the real property financed thereunder.
The representations and covenants contained in the 2018 BofA Real Estate Credit Agreement are customary for financing transactions of this nature, including, among others, a requirement to comply with a minimum consolidated current ratio, minimum consolidated fixed charge coverage ratio and maximum consolidated total lease adjusted leverage ratio, in each case as set out in the 2018 BofA Real Estate Credit Agreement. In addition, certain other covenants could restrict our ability to incur additional debt, pay dividends or acquire or dispose of assets. The 2018 BofA Real Estate Credit Agreement also provides for events of default that are customary for financing transactions of this nature, including cross-defaults to other material indebtedness. Upon the occurrence of an event of default, we could be required by the 2018 BofA Real Estate Credit Agreement to immediately repay all amounts outstanding thereunder.
As of September 30, 2019, we had $24.8 million in term loans outstanding under the 2018 BofA Real Estate Facility. During the three months ended December 31, 2019, we borrowed an additional $97.2 million to fund a portion of the purchase price for the Acquisition.
59
2018 Wells Fargo Master Loan Facility
On November 16, 2018, certain of our subsidiaries entered into a master loan agreement (the “2018 Wells Fargo Master Loan Agreement” and, together with the 2013 BofA Real Estate Credit Agreement, the 2015 Wells Fargo Master Loan Agreement and the 2018 BofA Real Estate Agreement, the “Existing Real Estate Credit Agreements”) with Wells Fargo Bank, National Association, as lender, which provides for term loans to certain of our subsidiaries that are borrowers under the Wells Fargo Master Loan Agreement in an aggregate amount not to exceed $100.0 million (the “2018 Wells Fargo Master Loan Facility” and, together with the 2013 BofA Real Estate Facility, the 2015 Wells Fargo Master Loan Facility and the 2018 BofA Real Estate Facility, the “Existing Real Estate Facilities”). Our right to make draws under the 2018 Wells Fargo Master Loan Facility will terminate on June 30, 2020. Term loans under the 2018 Wells Fargo Master Loan Facility bear interest based on LIBOR plus an applicable margin based on a pricing grid ranging from 1.50% per annum to 1.85% per annum based on our consolidated total lease adjusted leverage ratio. We are required to make quarterly principal payments with respect to the initial amount of each loan in 108 equal monthly principal payments based on a hypothetical 19 year amortization schedule, with a balloon repayment of the outstanding principal amount of loans due on December 1, 2028. Borrowings under the 2018 Wells Fargo Master Loan Facility can be voluntarily prepaid in whole or in part any time without premium or penalty. Borrowings under the 2018 Wells Fargo Master Loan Facility are guaranteed by us pursuant to an unconditional guaranty, and all of the real property financed by any of our operating dealership subsidiaries under the 2018 Wells Fargo Master Loan Facility is collateralized by first priority liens, subject to certain permitted exceptions.
The representations, warranties and covenants contained in the 2018 Wells Fargo Master Loan Agreement and the related documents are customary for financing transactions of this nature, including, among others, a requirement to comply with a minimum consolidated current ratio, minimum consolidated fixed charge coverage ratio and maximum consolidated total lease adjusted leverage ratio. In addition, certain other covenants could restrict our ability to incur additional debt, pay dividends or acquire or dispose of assets. The 2018 Wells Fargo Master Loan Agreement also provides for events of default that are customary for financing transactions of this nature, including cross-defaults to other material indebtedness. Upon the occurrence of an event of default, we could be required by the 2018 Wells Fargo Master Loan Facility to immediately repay all amounts outstanding thereunder.
As of September 30, 2019, we had $25.0 million outstanding borrowings under the 2018 Wells Fargo Master Loan Facility. In connection with the consummation of the Acquisition, we intend to borrow approximately $69 million under the 2018 Wells Fargo Master Loan Facility.
2024 Senior Subordinated Notes
At September 30, 2019, we had $600.0 million in aggregate principal amount of our outstanding 6.0% Senior Subordinated Notes due 2024 (the “Existing Notes”). The Existing Notes mature on December 15, 2024 and bear interest at a rate of 6.0% a year, payable semi-annually in arrears on June 15 and December 15 of each year. As of December 15, 2019, we may redeem some or all of the Existing Notes at a redemption price equal to 103.000% of the principal amount thereof plus accrued and unpaid interest to the date of redemption with the redemption price stepping down each year, decreasing to 100% of the principal amount thereof, plus accrued and unpaid interest to the date of redemption on or after December 1, 2022. If we sell certain of our assets or experience specific kinds of changes of control, we must offer to repurchase the Existing Notes.
The Existing Notes have been fully and unconditionally guaranteed, on a joint and several basis, by substantially all of our subsidiaries. The indenture governing the Existing Notes contains certain covenants that restrict our ability to incur additional debt, pay dividends, acquire or dispose of assets and engage in certain other transactions. The indenture governing the Existing Notes also provides for events of default that are customary for financing transactions of this nature.
On February 3, 2020, we issued a conditional notice of redemption to the holders of our Existing Notes, notifying such holders that we will redeem all of the Existing Notes on March 4, 2020. The redemption of the Existing Notes is conditioned upon the consummation of this offering. If redeemed, the Existing Notes will be
60
redeemed at 103.000% of par, plus accrued and unpaid interest to, but excluding, the date of redemption. We will pay a redemption price in connection with the redemption of the Existing Notes of $18.0 million.
Bridge Credit Facility
In connection with the execution of the Acquisition Agreements, we entered into the bridge commitment letter with the Bank of America (as amended, restated or supplemented from time to time, the “Bridge Commitment Letter”), pursuant to which, among other things, the Bank of America and a syndicate of lenders (the “Bridge Lenders”) have committed to provide bridge debt financing for the Acquisition, consisting of a $650.0 million senior unsecured bridge credit facility (the “Bridge Credit Facility”), the availability of which will be reduced by the issuance of the 2028 Notes and the consummation of the transactions contemplated by the New BofA Real Estate Facility described below. The obligation of the Bridge Lenders to enter into and make available to us borrowings under the Bridge Credit Facility is subject to a number of customary conditions, including execution and delivery of certain definitive documentation and absence of a material adverse effect. If necessary, the terms of the Bridge Credit Facility, including any conditions thereto and covenants thereunder, will be set forth in various definitive documentation to be entered into by the respective parties. We intend to replace the availability under the Bridge Credit Facility with permanent or alternative financing.
New BofA Real Estate Facility
In connection with the Transactions, we intend to enter into a new real estate term loan credit agreement (as amended, restated or supplemented from time to time, the “New BofA Real Estate Credit Agreement”) with the various financial institutions party thereto, as lenders, certain of our subsidiaries that own or lease the real estate financed thereunder, as borrowers, and Bank of America, as lender, providing for term loans in an aggregate amount not to exceed approximately $300 million, subject to customary terms and conditions (the “New BofA Real Estate Facility”). Term loans under our New BofA Real Estate Facility are expected to bear interest, at our option, based on (1) LIBOR plus an applicable margin based on a pricing grid ranging from 1.50% per annum to 2.00% per annum based on our consolidated total lease adjusted leverage ratio or (2) the Base Rate (as described below) plus an applicable margin based on a pricing grid ranging from 0.50% per annum to 1.00% per annum based on our consolidated total lease adjusted leverage ratio. The Base Rate is the highest of (i) the Federal Funds rate plus 0.50%, (ii) the Bank of America prime rate, and (iii) one month LIBOR plus 1.0%. We will be required to make 27 consecutive quarterly principal payments of 1.25% of the initial amount of each loan, with a balloon repayment of the outstanding principal amount of loans due on the maturity date. The New BofA Real Estate Facility is expected to mature seven years from the initial funding date of the facility. Borrowings under the New BofA Real Estate Facility are expected to be guaranteed by us and each of our operating dealership subsidiaries that lease or own the real estate being financed under the New BofA Real Estate Facility, and are expected to be collateralized by first priority liens, subject to certain permitted exceptions, on all of the real property financed thereunder.
The representations and covenants expected to be contained in the New BofA Real Estate Credit Agreement are customary for financing transactions of this nature, including, among others, a requirement to comply with a minimum consolidated current ratio, minimum consolidated fixed charge coverage ratio and maximum consolidated total lease adjusted leverage ratio, in each case as set out in the New BofA Real Estate Credit Agreement. In addition, certain other covenants could restrict our ability to incur additional debt, pay dividends or acquire or dispose of assets. The New BofA Real Estate Credit Agreement also provides for events of default that are customary for financing transactions of this nature, including cross-defaults to other material indebtedness. Upon the occurrence of an event of default, we could be required by the New BofA Real Estate Credit Agreement to immediately repay all amounts outstanding thereunder.
In connection with the Transactions, we intend to borrow approximately $216 million under the New BofA Real Estate Facility, and have the ability to make one additional draw in an amount up to 80% of the
61
appraised value of the property expected to be acquired at or after the consummation of the Acquisition.
Other Mortgage Notes Payable
At September 30, 2019, we had $127.3 million of other mortgage note obligations (excluding amounts outstanding under the Existing Real Estate Facilities) outstanding at interest rates generally ranging from 4% to 5%. These obligations are collateralized by the related real estate at our applicable owned dealership locations. During the three months ended December 31, 2019, the Company repaid $25.0 million of mortgage notes due at maturity. In connection with the dispositions of the five Gray Daniels dealerships and the Nalley Nissan dealership, the Company expects to repay approximately $24.0 million of related mortgage notes.
62