Attached files
| file | filename |
|---|---|
| EX-32.1 - EXHIBIT 32.1 - LEVI STRAUSS & CO | lvis11242019ex-321.htm |
| EX-31.2 - EXHIBIT 31.2 - LEVI STRAUSS & CO | lvis11242019ex-312.htm |
| EX-31.1 - EXHIBIT 31.1 - LEVI STRAUSS & CO | lvis11242019ex-311.htm |
| EX-23.1 - EXHIBIT 23.1 - LEVI STRAUSS & CO | lvis11242019ex-231.htm |
| EX-21.1 - EXHIBIT 21.1 - LEVI STRAUSS & CO | lvis11242019ex-211.htm |
| EX-10.19 - EXHIBIT 10.19 - LEVI STRAUSS & CO | lvis11242019ex-1019.htm |
| EX-10.13 - EXHIBIT 10.13 - LEVI STRAUSS & CO | lvis11242019ex-1013.htm |
| EX-10.12 - EXHIBIT 10.12 - LEVI STRAUSS & CO | lvis11242019ex-1012.htm |
| EX-10.11 - EXHIBIT 10.11 - LEVI STRAUSS & CO | lvis11242019ex-1011.htm |
| EX-10.10 - EXHIBIT 10.10 - LEVI STRAUSS & CO | lvis11242019ex-1010.htm |
| EX-10.9 - EXHIBIT 10.9 - LEVI STRAUSS & CO | lvis11242019ex-109.htm |
| EX-10.8 - EXHIBIT 10.8 - LEVI STRAUSS & CO | lvis11242019ex-108.htm |
| EX-4.8 - EXHIBIT 4.8 - LEVI STRAUSS & CO | lvis11242019ex-48.htm |
UNITED STATES SECURITIES AND EXCHANGE COMMISSION
Washington, D.C. 20549
_____________________________
FORM 10-K
(Mark One) _____________________________
þ | ANNUAL REPORT PURSUANT TO SECTION 13 OR 15(d) OF THE SECURITIES EXCHANGE ACT OF 1934 | |
or
¨ | TRANSITION REPORT PURSUANT TO SECTION 13 OR 15(d) OF THE SECURITIES EXCHANGE ACT OF 1934 | |
For the Fiscal Year Ended November 24, 2019
Commission file number: 001-06631
_____________________________
LEVI STRAUSS & CO.
(Exact Name of Registrant as Specified in Its Charter)
DELAWARE | 94-0905160 | |
(State or Other Jurisdiction of Incorporation or Organization) | (I.R.S. Employer Identification No.) | |
1155 Battery Street, San Francisco, California 94111
(Address of Principal Executive Offices) (Zip Code)
(415) 501-6000
(Registrant’s Telephone Number, Including Area Code)
_____________________________
Securities registered pursuant to Section 12(b) of the Act:
Title of each class | Trading symbol(s) | Name of each exchange on which registered | ||
Class A Common Stock, $0.001 par value per share | LEVI | New York Stock Exchange | ||
_____________________________
Indicate by check mark if the registrant is a well-known seasoned issuer, as defined in Rule 405 of the Securities Act. Yes ¨ No þ
Indicate by check mark if the registrant is not required to file reports pursuant to Section 13 or Section 15(d) of the Act.
Yes ¨ No þ
Indicate by check mark whether the registrant (1) has filed all reports required to be filed by Section 13 or 15(d) of the Securities Exchange Act of 1934 during the preceding 12 months (or for such shorter period that the registrant was required to file such reports), and (2) has been subject to such filing requirements for the past 90 days. Yes þ No ¨
Indicate by check mark whether the registrant has submitted electronically every Interactive Data File required to be submitted pursuant to Rule 405 of Regulation S-T (§232.405 of this chapter) during the preceding 12 months (or for such shorter period that the registrant was required to submit such files). Yes þ No ¨
Indicate by check mark whether the registrant is a large accelerated filer, an accelerated filer, or a non-accelerated filer, a smaller reporting company, or an emerging growth company. See definition of "Large accelerated filer," "accelerated filer," "smaller reporting company" and "emerging growth company" in Rule 12b-2 of the Exchange Act. (Check one):
Large accelerated filer ¨ | Non-accelerated filer þ | Accelerated filer ¨ | Smaller reporting company ¨ | Emerging growth company ¨ |
If an emerging growth company, indicate by check mark if the registrant has elected not to use the extended transition period for complying with any new or revised financial accounting standards provided pursuant to Section 13(a) of the Exchange Act ¨
Indicate by check mark whether the registrant is a shell company (as defined in Rule 12b-2 of the Act). Yes ¨ No þ
The aggregate market value of the registrant’s shares of Class A common stock held by non-affiliates of the registrant as of May 24, 2019, the last business day of the registrant’s most recently completed second fiscal quarter, was $930,196,674, based on the closing price reported for such date on the New York Stock Exchange.
Indicate the number of shares outstanding of each of the issuer’s classes of common stock, as of the latest practicable date.
As of January 24, 2020, the registrant had 57,367,130 shares of Class A common stock, $0.001 par value per share and 336,748,994 shares of Class B common stock, $0.001 par value per share, outstanding.
Documents incorporated by reference:
Portions of the registrant’s definitive Proxy Statement for the 2020 Annual Meeting of Stockholders to be filed with the U.S. Securities and Exchange Commission pursuant to Regulation 14A not later than 120 days after the end of the fiscal year covered by this Annual Report on Form 10-K are incorporated by reference in Part III, Items 10-14 of this Annual Report on Form 10-K.
LEVI STRAUSS & CO.
TABLE OF CONTENTS TO FORM 10-K
FOR FISCAL YEAR ENDED NOVEMBER 24, 2019
Page Number | |||
Item 1. | |||
Item 1A. | |||
Item 1B. | |||
Item 2. | |||
Item 3. | |||
Item 4. | |||
Item 5. | |||
Item 6. | |||
Item 7. | |||
Item 7A. | |||
Item 8. | |||
Item 9. | |||
Item 9A. | |||
Item 9B. | |||
Item 10. | |||
Item 11. | |||
Item 12. | |||
Item 13. | |||
Item 14. | |||
Item 15. | |||
Item 16. | Form 10-K Summary | ||
PART I
Item 1. | BUSINESS |
Overview
From our California Gold Rush beginnings, we have grown into one of the world's largest brand-name apparel companies. A history of responsible business practices, rooted in our core values, has helped us build our brands and engender consumer trust around the world. Under our Levi's®, Dockers®, Signature by Levi Strauss & Co.™ and Denizen® brands, we design, market and sell – directly or through third parties and licensees – products that include jeans, casual and dress pants, tops, shorts, skirts, jackets, footwear, and related accessories for men, women and children around the world.
Our Global Reach
Our products are sold in more than 110 countries, grouped into three geographic regions that comprise our three operating segments: the Americas, Europe and Asia (which includes the Middle East and Africa). We service our customers through our global infrastructure, developing, sourcing and marketing our products around the world. Although our brands are recognized as authentically "American," we derive approximately half of our net revenues from outside the United States. A summary of financial information for each regional operating segment is found in Note 21 to our audited consolidated financial statements included in this report. As a global company with sales and operations in foreign countries, we are subject to risks of doing business in foreign countries. See "Item 1A – Risk Factors", specifically "Risks Relating to Our Industry – Our business is subject to risks associated with sourcing and manufacturing overseas, as well as risks associated with potential tariffs or a global trade war" and "Risks Relating to Our Business – We are a global company with significant revenues and earnings generated internationally, which exposes us to the impact of foreign currency fluctuations, as well as political and economic risks."
Our products are sold in over 50,000 retail locations worldwide, including approximately 3,000 brand-dedicated stores and shop-in-shops. In the United States, chain retailers and department stores are the primary distribution channels for our Levi's® and Dockers® products. Outside the United States, department stores, specialty retailers, franchised or other brand-dedicated stores and shop-in-shops have traditionally been our primary distribution channels. Levi's® and Dockers® products are also sold through our brand-dedicated company-operated retail stores and through the e-commerce sites we operate, as well as the e-commerce sites operated by certain of our key wholesale customers and other third parties. We distribute Signature by Levi Strauss & Co.™ and Denizen® brand products primarily through mass channel retailers in the Americas.
We were founded in San Francisco, California in 1853 and were incorporated in Delaware in 1970. We conduct our operations outside the United States through foreign subsidiaries. We have headquarters in San Francisco, Brussels and Singapore. Our primary corporate office is located at Levi's Plaza, 1155 Battery Street, San Francisco, California 94111, and our main telephone number is (415) 501-6000.
Our website – www.levistrauss.com – contains additional and detailed information about our history, our products and our commitments. Financial news and reports and related information about our company can be found at levistrauss.com/investors/financial-news.
We file or furnish electronically with the U.S. Securities and Exchange Commission (the “SEC”) annual reports on Form 10-K, quarterly reports on Form 10-Q, current reports on Form 8-K, and amendments to those reports filed or furnished pursuant to Section 13(a) or 15(d) of the Exchange Act. We make copies of these reports available free of charge through our investor relations website as soon as reasonably practicable after we file or furnish them with the SEC. The SEC maintains a website at www.sec.gov that contains reports, proxy and information statements and other information regarding Levi Strauss and other issuers that file electronically with the SEC.
Information contained on or accessible through our websites is not incorporated into, and does not form a part of, this Annual Report or any other report or document we file with the SEC, and any references to our websites are intended to be inactive textual references only.
Our Competitive Strengths
The apparel industry is experiencing significant changes in how and where consumers shop for products, impacting the entire apparel value chain. We believe we are well-positioned to succeed in this environment due to the following strengths:
Iconic brands with deep heritage, superior product quality and a culture of innovation.
With a rich history spanning over 165 years, we offer products of exceptional quality at accessible prices. Levi’s is one of
1
the most recognizable consumer brands in the world and the #1 brand globally in jeanswear (measured by total retail sales). Levi’s is an authentic and original lifestyle brand that has expanded beyond men’s jeans into women’s jeans and multiple product categories. Consumers around the world instantly recognize the distinctive traits of Levi’s jeans-the double arc stitching on the back pocket, known as the Arcuate Stitching Design, and the red fabric tab stitched into the right back pocket, known as the Red Tab Device. Building upon this rich history, we continue to innovate our product offerings to meet the evolving tastes of today’s consumers. Our Eureka Innovation Lab, an in-house creative space in San Francisco, California dedicated to research, design, creative development and advanced product prototypes, is responsible for delivering cutting-edge advancements for our company and the industry, with an emphasis on fit, finish and fabric. For example, the 4-way stretch fabric underpinning our 2015 Levi’s women’s jeans relaunch was developed at Eureka.
In our Levi’s men’s jeans business, we retain our commitment to innovating within our core fits, such as our iconic 501 jean, while introducing new fits to address changing consumer preferences. For example, our men’s 511 slim fit has been our top selling men’s jean for the last five fiscal years. In fiscal year 2017, we increased our focus on newer tapered men’s fits and have seen growth and momentum in sales of these fits as a result. We relaunched our Levi’s women’s jeans business in fiscal year 2015, resulting in a number of new styles, and from fiscal year 2015 to fiscal year 2019, our women’s jeans net revenues grew at a CAGR of 13%. We continue to refine our styles, fits and fabrics and explore new silhouettes that resonate with our consumer.
Unique connection with our consumers.
Over the last few years, we have increased the level of marketing support for our brands. In fiscal year 2019, our spending on advertising and promotions was $399.3 million, and 6.9% of net revenues. This disciplined investment in brand-building is a key driver of the inflection in our financial performance that occurred in fiscal year 2017. In 2014, we launched a global brand campaign called “Live in Levi’s,” reflecting that many of our consumers’ greatest moments take place while they are wearing their favorite pair of Levi’s. As part of this ongoing campaign, our “Circles” TV and online ad continues to be viewed on YouTube with over 26 million views to date. “Circles” also won the 2017 Cannes Lions Silver award, one of the most prestigious brand communication awards worldwide.
We also maintain a leading presence at significant cultural events around the world such as music festivals and sporting events, which have put the Levi’s brand back at the center of culture. In 2013, we secured the naming rights to the new stadium for the San Francisco 49ers, allowing us to connect with sports and music fans across the world. In February 2016, Super Bowl 50 at Levi’s Stadium was one of the most-watched programs in TV history. In April 2018, our Levi’s cutoff shorts, worn by Beyoncé during her headline performance at the Coachella music festival, were deemed the “ultimate Coachella clothing item” by People magazine, with Coachella generating approximately 5.8 billion global impressions for the Levi’s brand. In 2019, we again dominated Coachella as the go-to uniform for festival season with Levi's 501 cutoff shorts, generating a 50% increase in impressions versus the prior year.
We are also leading the way in customization and personalization, with a focus on delivering a leading world-class omni-channel environment, areas that we believe are increasingly important to today’s consumers. We developed an experiential in-store Tailor Shop concept in which, in select stores, consumers can alter or customize their own jeans and trucker jackets by adding personalized stitching and patches. We now include these Tailor Shops in select stores across the world, providing an added reason for an in-person visit. Several of our stores also include Print Bars where consumers can design and print personalized T-shirts on the spot. We continued our investment in digital innovation by launching Future Finish, an online customization experience on Levi.com that leverages our FLX technology, which makes it easy to create a custom pair of Levi’s and puts the power of personalization directly into the consumers’ hands.
In addition, we generate exposure through selective collaborations with iconic partners, including Disney's Star Wars, Hello Kitty and Stranger Things. In 2019, we collaborated again with Nike, this time with a focus on customization; the exclusive co-branded sneakers were available in select Levi's stores and sold out in 3 days. We also introduced the next iteration of our Trucker Jacket with Jacquard by Google which uses advanced technology and patented conductive fibers, woven into the fabric of the jacket, to seamlessly and wirelessly connect our Trucker to any smartphone.
Robust, diversified business model across multiple regions, channels and categories.
We have a diversified business model that spans our three regions, a robust presence across both our wholesale and direct-to-consumer ("DTC") channels and an established market share position in jeans, non-jeans bottoms and tops for both men and women. In fiscal year 2019, 21% of our net revenues were from tops, 72% of our net revenues were from bottoms, and 7% of our net revenues were from footwear and accessories.
We have demonstrated strong net revenues growth in all three of our geographic regions. Net revenues in our Americas segment increased 1% and 10% year-over-year in fiscal year 2019 and in fiscal year 2018, respectively, with growth since 2015 at a CAGR of 3%, within which the U.S. marketplace has grown at a CAGR of 1%. Net revenues in our Europe segment increased
2
7% and 25% year-over- year in fiscal year 2019 and in fiscal year 2018, respectively. Net revenues in our Asia segment increased 6% and 8% year-over-year in fiscal year 2019 and in fiscal year 2018, respectively. Our Europe and Asia segments represented 31% and 16% of our net revenues, respectively, in fiscal year 2019, as compared to 23% and 17% of our net revenues, respectively, in fiscal year 2015, with growth at CAGRs of 15% and 6%, respectively. Our Europe and Asia segments represented 45% of our total regional operating income in fiscal year 2019, as compared to 31% of our total regional operating income in fiscal year 2015, demonstrating the geographical diversification of our business.
We sell our products worldwide through third-party retailers such as department stores, specialty retailers, third-party e-commerce sites and franchisees who operate brand-dedicated stores. Our wholesale channels, excluding franchise stores, generated 56% and 62% of our net revenues in fiscal years 2019 and 2015, respectively. Franchise stores (which are part of our wholesale channels) generated 7% and 8% of our net revenues in fiscal years 2019 and 2015, respectively. We take care to select wholesale customers and distributors that we believe will represent our brands in a manner consistent with our values and growth strategies. The strength of our brands as a driver of retail traffic at our key wholesale partners allows us to maintain preferred floor space and presentation formats. Our wholesale channels net revenues increased 2% and 11% year-over-year in fiscal year 2019 and in fiscal year 2018, respectively, with growth since 2015 at a CAGR of 4%, demonstrating strong growth despite a challenging channel environment and becoming a smaller percentage of our overall net revenues. Sales to our top ten wholesale customers accounted for 26% and 27% of our net revenues in fiscal year 2019 and in fiscal year 2018, respectively. No single customer represented 10% or more of our net revenues in either of these years.
We also sell our products directly to consumers through a variety of formats, including our own company-operated mainline and outlet stores, company-operated e-commerce sites and select shop-in-shops located in department stores and other third-party retail locations. Sales through our DTC channel have increased from 29% of our net revenues in fiscal year 2015 to 36% of our net revenues in fiscal year 2019, with growth at a CAGR of 12%. Our DTC channel also experienced 6% year-over-year net revenues growth from fiscal year 2018 to fiscal year 2019. Of sales through our DTC channel: sales from our company-operated mainline and outlet stores represented 27% of our net revenues in fiscal year 2019, as compared to 22% of our net revenues in fiscal year 2015; sales from our shop-in-shops represented 5% of our net revenues in fiscal year 2019, as compared to 4% of our net revenues in fiscal year 2015; and sales from our company-operated e-commerce sites represented 5% of our net revenues in fiscal year 2019, as compared to 3% of our net revenues in fiscal year 2015.
We are dedicated to expanding product category offerings that are underdeveloped for us today and that we believe can continue to drive organic business growth. For example, our tops category has increased from 11% of our net revenues in fiscal year 2015 to 21% of our net revenues in fiscal year 2019, with growth at a CAGR of 25%, and our women’s sales increased from 20% of our net revenues in fiscal year 2015 to 31% of our net revenues in fiscal year 2019, with growth at a CAGR of 18%, driven by our women’s jeans relaunch and product category diversification efforts. Net revenues from men’s sales grew at a CAGR of 3% over the same period.
Strong global operating infrastructure.
Our presence in more than 110 countries enables us to leverage our global scale for product development and sourcing while using our local expertise to tailor products and retail experiences to individual markets. In addition, our integrated production development and distribution platform enables us to achieve operating efficiencies and deliver superior quality products. In fiscal year 2018, we announced Project F.L.X., an approach that uses lasers to digitize denim finish design and reduce finishing time improving inventory management, eliminate thousands of chemical formulations and reduces lead time. In fiscal year 2019, we sourced apparel from independent contractors located in approximately 23 countries around the world, including the United States, with no single country accounting for more than 20% of our sourcing by unit volume. By leveraging our flexible supply chain and global operating infrastructure, we are able to more quickly respond to consumer and customer demands, scale operations across diverse geographies and sales channels, shorten product development cycles and adapt to changing economic and political conditions, including new trade policies.
Values-driven company with an unwavering commitment to corporate citizenship.
Throughout our long history, we have upheld our strong belief that we can help shape society through civic engagement and community involvement, responsible labor and workplace practices, philanthropy, ethical conduct, environmental stewardship and transparency. The Levi Strauss Foundation, founded in 1952, is our main philanthropic arm. Its mission is to advance the human rights and well-being of underserved people in places where we have a business presence. We contribute to this foundation on an ongoing basis from the profits we generate. Across all aspects of our business, we engage in a “profits through principles” business approach and constantly strive to set higher standards for ourselves and the industry. In 2017 and 2018, we were named to Fortune magazine’s “Change the World” list as a result of our initiatives to improve worker well-being and reduce the use of chemicals in our finishing process, respectively. Also in 2018, we announced an industry-leading climate action strategy, which includes ambitious science-based targets for reducing carbon emissions in our owned-and-operated facilities and across our global
3
supply chain. And in 2019, we pioneered a contextual approach to water use that prioritizes saving water in areas that need it most, pledging to halve our water use in manufacturing in areas of high and medium water stress by 2025. Over the years, our milestone initiatives include: integrating our factories prior to the enactment of the Civil Rights Act of 1964; developing a comprehensive supplier code of conduct that requires safe and healthy working conditions before such codes of conduct became commonplace among multinational apparel companies; and offering benefits to same-sex partners in the 1990s, long before most other companies.
Management team with a track record of success.
Over the last several years, our leadership team has built upon the strong foundation of our business, guiding our transformation into a more global, diversified lifestyle apparel company, driving strong financial results and improving our balance sheet. Our distinct culture and track record of success have enabled us to become a leading destination for top talent. Our Chief Executive Officer and Chief Financial Officer have been with the company for eight and seven years, respectively, and most of our other key executives have worked together at the company for the last six years. Additionally, we have senior leadership in each of our operating segments to execute our growth strategy across our markets with the benefit of local knowledge and relationships.
Our Business Strategies
Our growth and financial performance over the last several years has been the result of key growth strategies adopted by our management team, each of which is described in more detail below. We will continue to aggressively pursue our global market opportunity by executing these growth strategies and continuing to innovate throughout our business.
Drive the Profitable Core. Our core includes our most profitable and cash-generating businesses. Keeping these businesses healthy and growing is critical for funding expansion in other key growth areas.
• | Maintain and strengthen our longstanding leadership in men's bottoms. We are actively focused on maintaining and strengthening our men’s bottoms business, which has been and will continue to be a key driver of our operating results. Our iconic 501 jean continues to be a staple in closets around the world, and we continually find ways to update this fit to appeal to new consumers and remain relevant as tastes change. We are also introducing new products, such as updated straight leg and taper styles and fabrics with added stretch for greater comfort. Enhancing the fit, finish and fabric of our existing product offerings while continuing to introduce new styles enables us to appeal to younger millennial customers and to capitalize on the ongoing consumer trend toward casualization in fashion. We will continue to be nimble and respond to evolving demographics and fashion trends while retaining our authentic heritage. |
• | Expand and strengthen our established wholesale customer base. Our established wholesale customer base represents our largest distribution channel and will continue to represent a significant opportunity for growth. We are deepening key wholesale relationships through more targeted product assortments and a broader lifestyle offering. We are expanding our wholesale relationships, with a focus in the United States on growing premium accounts such as Nordstrom and Bloomingdale's. We are also growing our core business through wholesale e-commerce sites, including Amazon, where we have expanded our core product offering and established a Levi’s-branded storefront that offers consumers a curated experience similar to the one they enjoy when they visit our company-operated e-commerce sites. |
• | Increase penetration and sales within our top five developed markets. We manage our business by region, which enables us to respond more rapidly to opportunities presented by specific geographic markets. We continue to see growth among our top five developed markets: the United States, France, Germany, Mexico and the United Kingdom. Across these markets, we plan to expand via a combination of new stores, expanded wholesale relationships and an increased e-commerce presence. |
• | Invest in marketing and advertising to increase engagement with our brands. We expect to continue our investment in marketing and advertising, including television, digital and influencer marketing, focusing primarily on growing sales of our core product offerings and increasing engagement with all of our brands, particularly among younger consumers. |
Expand for More. We have significant opportunity to grow by expanding beyond our core business into other underpenetrated categories, markets and brands.
• | Develop leading positions in categories outside of men’s bottoms. We are focusing our product design and marketing efforts to reshape our global consumer perceptions from a U.S. men’s bottoms-oriented company to a global lifestyle leader for both men and women. To this end, in the near term, we are focusing on growing our tops and women’s businesses. While our logo T-shirt business has been a key driver of this growth, we are also seeing growth across other tops sub-categories such as fleece (sweatshirts) and trucker jackets. We believe we have a long runway for growth in both our tops and women’s categories. In the longer term, we intend to increase our focus on expanding our other product categories such as footwear and outerwear. |
4
• | Expand presence in underpenetrated international markets. We believe we have a significant opportunity to deepen our presence in key emerging markets, such as China and India, to drive long-term growth. We believe our management team in China can significantly expand our business in China as we leverage a localized go-to-market strategy to open new stores and build affinity among Chinese consumers. In the fall of 2019, and in collaboration with a franchise partner, we opened a new 7,000 square foot door in Wuhan. This is now our largest store to-date in China, allowing us to showcase a broader assortment, including super-premium products, and early consumer response has been very strong. In India, to support further growth, we have opened three company-operated stores since December 2017 and launched a company-operated e-commerce platform for the country in January 2018. |
• | Opportunistically pursue acquisitions. We expect to opportunistically pursue acquisitions to supplement our strong organic growth profile and drive further brand and category diversification. We will evaluate potential acquisition opportunities with a focus on strategic acquisitions that will enhance our portfolio of brands, bolster our product category expertise or add a new operating capability while fitting well with our corporate culture and providing an attractive financial return. We assess on a regular basis the potential acquisition of franchise partners, distributors and the product categories we have under license, to enhance the consumer experience and to accelerate distribution of our brands. We believe we are well-positioned and have the financial flexibility to pursue attractive acquisition opportunities as they arise. Just recently in December 2019, we acquired the assets of one of our distributors within Latin America in order to take direct control of our Levi's® and Docker's® brands within the Americas region and accelerate growth. |
Strengthen Position as a Leading World-Class Omni-Channel Retailer. We are focused on growing our DTC channel in order to better control our brands and drive meaningful connections with our consumers globally.
• | Continue to expand our retail presence and improve our sales productivity in existing stores. We continue to add new, profitable retail locations in the United States and across the globe. We had 81 more company-operated stores on November 24, 2019 than we did on November 25, 2018. We are focused on creating a shopping experience that excites today’s consumers with enhanced customization and personalization through our Tailor Shops and Print Bars. Additionally, we are continuing to implement integrated omni-channel and digital capabilities across our store fleet. We have updated our systems to enable customers to return products in-store that they purchased through our websites and allow our sales associates to place orders in store when desired fits or sizes are not available. We have continued rolling out our RFID inventory management system to improve operations and help us test the effectiveness of different store layouts and assortments. We have also started updating the POS terminals in our stores so we can deliver a seamless experience across all touchpoints to our customers and continue working toward our strategy of becoming a leading world-class omni-channel retailer. |
• | Drive e-commerce growth through global presence and superior consumer experience. We have been focused on building out our e-commerce sites across geographies while also upgrading the foundation of our sites in key geographies such as the United States and Europe in order to deliver a better user experience. In addition, we are incubating a portfolio of innovative e-commerce features that further enhance consumer experience and demonstrate our leadership in fit and style in an online forum. For example, in 2017 we rolled out "Ask Indigo," an AI-powered stylebot, to help guide consumers to the products that best fit their needs, just as an associate would in a brick-and-mortar store. We are continually testing and refining these features to help drive increased traffic, conversion and order size. We also recently rolled out an online program that enables consumers to customize trucker jackets, logo T-shirts and other products just as they would in-store. |
Enhance Operational Excellence. We seek out operational improvements that leverage our scale to unlock efficiencies throughout our organization and enable us to respond quickly to changing market dynamics.
• | Improve operations by leveraging our scale and consolidating end-to-end accountability. We have ongoing initiatives to reduce inefficiency and increase profitability in our business. Our key efforts include leveraging our global scale to drive supply chain savings, end-to-end planning efforts to manage inventory more efficiently and a focus on driving continuous organizational efficiencies. We are in the process of implementing a new enterprise resource planning system that will strengthen our data and analysis capabilities. We are also planning to upgrade our distribution centers and improve our distribution networks in the United States and Europe to ensure we are prepared for future growth. |
• | Improve flexibility and ability to respond to changing fashion and consumer trends. We are taking steps to shorten our time to market in order to better meet the rapidly evolving needs of our customers and consumers. For example, Project F.L.X. increases operational agility in our men’s and women’s bottoms businesses and facilitates improved inventory management by enabling us to make final decisions on the mix of styles for our denim products closer to the time of sale. We have also added shorter go-to-market processes in categories such as tops in order to forecast and buy inventory more effectively, leading to higher sell through rates and less marked down product. |
5
Our Brands and Products
We offer a broad range of products, including jeans, casual and dress pants, tops, shorts, skirts, jackets, footwear and related accessories. Across all of our brands, pants – including jeans, casual pants and dress pants – represented 65%, 68% and 72% of our total units sold in fiscal years 2019, 2018 and 2017, respectively. Men's products generated 67%, 69% and 72% of our total net sales in fiscal years 2019, 2018 and 2017, respectively.
Levi's® Brand
The Levi's® brand epitomizes classic, authentic American style and effortless cool. Levi's is an authentic and original lifestyle brand and the #1 brand globally in jeanswear (measured by total retail sales). Since their inception in 1873, Levi's® jeans have become one of the most recognizable garments in the world – reflecting the aspirations and earning the loyalty of people for generations. Consumers around the world instantly recognize the distinctive traits of Levi's® jeans, including the Arcuate Stitching Design and the Red Tab Device. The Levi's® brand continues to evolve to meet the tastes of today's consumers, driven by its distinctive pioneering and innovative spirit. Our range of leading jeanswear, other apparel items and accessories for men, women and children is available in more than 110 countries, allowing individuals around the world to express their personal style.
The Levi's® brand encompasses a range of products. Levi's® Red Tab™ products are the foundation of the brand, consisting of a wide spectrum of jeans and jeanswear offered in a variety of fits, fabrics, finishes, styles and price points intended to appeal to a broad spectrum of consumers. The line includes the iconic 501® jean, the original and best-selling five-pocket jean of all time. The line also incorporates a full range of jeanswear fits and styles designed specifically for women. Sales of Red Tab™ products represented the majority of our Levi's® brand net sales in all three of our regions in fiscal years 2019, 2018 and 2017. We also offer premium products around the world under the Levi's® brand, including a range of premium pants, tops, shorts, skirts, jackets, footwear, and related accessories.
Our Levi's® brand products accounted for 87% of our total net sales in fiscal year 2019, and 86% in fiscal year 2018 and 2017, approximately half of which were generated in our Americas region.
Dockers® Brand
Founded in 1986, the Dockers® brand sparked a revolution in the way millions of men dressed around the world, shifting from the standard issue suit to a more casual look. 30 years later, the Dockers® brand continues to embody the spirit of khakis and define business casual. Since its introduction, the brand has focused on men's khakis and the essential clothing accessories to go with them.
Our Dockers® brand products accounted for 6%, 7% and 8% of our total net sales in fiscal years 2019, 2018 and 2017, respectively. Although the substantial majority of these net sales were in the Americas region, Dockers® brand products were sold in more than 50 countries.
Signature by Levi Strauss & Co.™ and Denizen® Brands
In addition to our Levi's® and Dockers® brands, we offer the Signature by Levi Strauss & Co.™ and Denizen® brands, which are focused on value-conscious consumers who seek quality craftsmanship and great fit and style at affordable prices. We offer denim jeans, casual pants, tops and jackets in a variety of fits, fabrics and finishes for men, women and children under the Signature by Levi Strauss & Co.™ brand through the mass retail channel in the United States and Canada. The Denizen® brand was introduced in the United States starting in 2011, and includes a variety of jeans to complement active lifestyles and to empower consumers to express their aspirations, individuality and attitudes. The Denizen® brand is sold through wholesale accounts in the United States.
Our Signature by Levi Strauss & Co.™ and Denizen® brand products accounted for 7%, 7% and 6% of our total net sales in fiscal years 2019, 2018 and 2017, respectively.
Licensing
The appeal of our brands across consumer groups and our global reach enable us to license our Levi's® and Dockers® trademarks for a variety of product categories in multiple markets in each of our regions, including footwear, belts, wallets and bags, outerwear, sweaters, dress shirts, kidswear, sleepwear and hosiery. Licensing accounted for 2% of our total net revenues in each of fiscal years 2019, 2018 and 2017.
6
We enter into licensing agreements with our licensees covering royalty payments, product design and manufacturing standards, marketing and sale of licensed products, and protection of our trademarks. We require our licensees to comply with our code of conduct for contract manufacturing and engage independent monitors to perform regular on-site inspections and assessments of production facilities.
Sales, Distribution and Customers
We recognize wholesale revenue from sales of our products through third-party retailers such as department stores, specialty retailers, third-party e-commerce sites and franchise locations dedicated to our brands. We also sell our products directly to consumers through a variety of formats, including our own company-operated mainline and outlet stores, company-operated e- commerce sites and select shop-in-shops located in department stores and other third-party retail locations.
Multi-brand Retailers
We seek to make our products available where consumers shop, including offering products that are appropriately tailored for our wholesale customers and their retail consumers. We take care to select wholesale customers and distributors that we believe will represent our brands in a manner consistent with our values and growth strategies. Sales to our top ten wholesale customers accounted for 26%, 27% and 28% of our net revenues in fiscal years 2019, 2018 and 2017, respectively. No single customer represented 10% or more of our net revenues in any of these years.
We also sell our products directly to consumers through shop-in-shops located in certain of our wholesale customers’ and other third-party retail locations. Typically, this format is conducted on a concession basis, whereby the inventory continues to be owned by us (not the retailer) until ultimate sale to the end consumer. The salespeople involved in these transactions are generally our employees and not those of the retailer. We recognize revenue in the amount of the sale to the end consumer, while paying our partners a commission. We operated approximately 500 of these shop-in-shops as of November 24, 2019.
Dedicated Stores and E-commerce Sites
We believe retail stores dedicated to our brands are important for the growth, visibility, availability and commercial success of our brands, and they are an increasingly important part of our strategy for expanding distribution of our products. Our brand-dedicated stores are either operated by us or by independent third parties such as franchisees. In addition to the dedicated stores, we maintain brand-dedicated e-commerce sites that sell products directly to consumers.
Company-operated brick-and-mortar retail stores. Our company-operated retail stores, comprising both mainline and outlet stores, generated 27%, 26% and 25% of our net revenues in fiscal years 2019, 2018 and 2017, respectively. As of November 24, 2019, we had 905 company-operated stores, predominantly Levi's® stores, located in 32 countries across our three regions. We had 282 of these stores in the Americas, 324 stores in Europe and 299 stores in Asia. During 2019, we added 121 company-operated stores and closed 40 stores.
Franchised and other stores. Franchised, licensed, or other forms of brand-dedicated stores operated by independent third parties sell Levi's® and Dockers® products in markets outside the United States. There were approximately 1,400 of these stores as of November 24, 2019, and they are a key element of our international distribution. In addition to these stores, we consider our network of brand-dedicated shop-in-shops, which are located within department stores and may be either operated directly by us or third parties, to be an important component of our retail distribution in international markets. Outside the United States, approximately 250 of these shop-in-shops were operated by third parties as of November 24, 2019.
E-commerce sites. We maintain brand-dedicated e-commerce sites, including www.levi.com and www.dockers.com, that sell products directly to consumers across multiple markets around the world. These sites represented 5%, 4% and 4% of overall net revenues in fiscal years 2019, 2018 and 2017; and 14%, 13% and 13% of DTC channel net revenues in fiscal years 2019, 2018 and 2017.
Seasonality of Sales
We typically achieve our largest quarterly revenues in the fourth quarter. In fiscal year 2019, our net revenues in the first, second, third and fourth quarters represented 25%, 23%, 25% and 27%, respectively, of our total net revenues for the year. In fiscal year 2018, our net revenues in the first, second, third and fourth quarters represented 24%, 22%, 25% and 29%, respectively, of our total net revenues for the year.
We typically achieve a significant amount of revenues from our DTC channel on the Friday following Thanksgiving Day, which is commonly referred to as Black Friday. Due to the timing of our fiscal year-end, a particular fiscal year might include one, two or no Black Fridays, which could impact our net revenues for the fiscal year. Each of fiscal years 2018 and 2017 included one Black Friday. Fiscal year 2019 did not have a Black Friday, while fiscal year 2020 will have two Black Fridays.
7
We use a 52- or 53- week fiscal year, with each fiscal year ending on the Sunday that is closest to November 30 of that year. Certain of our foreign subsidiaries have fiscal years ending November 30. Each fiscal year generally consists of four 13-week quarters, with each quarter ending on the Sunday that is closest to the last day of the month of that quarter. Fiscal years 2019, 2018 and 2017 were 52-week years, ending on November 24, 2019, November 25, 2018 and November 26, 2017, respectively. Each quarter of fiscal years 2019, 2018 and 2017 consisted of 13 weeks. The fourth quarter of 2020 will consist of 14 weeks.
The level of our working capital reflects the seasonality of our business. We expect inventory, accounts payable and accrued expenses to be higher in the second and third quarters in preparation for the fourth quarter selling season. Order backlog is not material to our business.
Effects of Inflation
We believe inflation in the regions where most of our sales occur has not had a significant effect on our net revenues or profitability.
Marketing and Promotion
Our marketing is rooted in globally consistent brand messages that reflect the unique attributes of our brands, including the Levi's® brand as the authentic and original jeanswear brand and the Dockers® brand as the definitive khaki. We continually strengthen our portfolio of brands and our positioning at the center of popular culture with a diverse mix of marketing initiatives to drive consumer demand, such as through social media and digital and mobile outlets, sponsorships, product placement in leading fashion magazines and with celebrities, television and radio advertisements, personal sponsorships and endorsements, and selective collaborations with key influencers, integrating ourselves with significant cultural events, and on-the-ground efforts such as street-level events and similar targeted "viral" marketing activities. We also connect with sport and music fans across the world, including through the naming rights to the stadium for the San Francisco 49ers, which we secured in 2013.
Our marketing organization includes both global and regional marketing teams. Our global marketing team is responsible for developing a toolkit of marketing assets and brand guidelines to be applied across all marketing activities, including media, engagement, brand environment and in-store activation. Our regional marketing teams adapt global tools for local relevance and execute marketing strategies within the markets where we operate.
We also use our websites, including www.levi.com and www.dockers.com in relevant markets to enhance consumer understanding of our brands and help consumers find and buy our products. Information contained on, or that can be accessed through, these websites is not intended to be incorporated by reference into this Annual Report and references to our website addressed in this Annual Report are inactive textual references only.
Sourcing and Logistics
Organization. Our global sourcing and logistics organizations are responsible for taking a product from the design concept stage through production to delivery to our customers. Our objective is to leverage our global scale to achieve product development and sourcing efficiencies and reduce total product and distribution costs while maintaining our focus on product quality, local service levels and working capital management. Our presence in more than 110 countries enables us to leverage our global scale for product development and sourcing while using our local expertise to tailor products and retail experiences to individual markets. Our integrated production development and distribution platform enables us to achieve operating efficiencies and deliver superior quality products.
Product procurement. We source nearly all of our products through independent contract manufacturers. The remainder is sourced from our company-operated manufacturing and finishing plants. See "Item 2 – Properties" for more information about these manufacturing facilities.
Sources and availability of raw materials. The principal fabrics used in our products include cotton, blends, synthetics and wools. The prices we pay our suppliers for our products are dependent in part on the market price for raw materials used to produce them, primarily cotton. The price and availability of cotton may fluctuate substantially, depending on a variety of factors. The price fluctuations impact the cost of our products in future seasons due to the lead time of our product development cycle. Fluctuations in product costs can cause a decrease in our profitability if product pricing actions taken in response are insufficient or if those actions cause our wholesale customers or retail consumers to reduce the volumes they purchase.
Sourcing locations. We use numerous independent contract manufacturers located throughout the world for the production and finishing of our garments. We conduct assessments of political, social, economic, trade, labor and intellectual property protection conditions in the countries in which we source our products before placing production in those countries and on an ongoing basis. We also monitor ongoing global trade regulations to optimize our supply chain networks in response to changes in tariffs or other trade policies around the world.
8
In fiscal year 2019, we sourced products from independent contract manufacturers located in approximately 23 countries around the world, including United States. We sourced products in North and South Asia, the Americas, Europe and Africa. No single country accounted for more than 20% of our sourcing in fiscal year 2019.
Sourcing practices. Our sourcing practices include these elements:
• | We require all third-party contractors and subcontractors who manufacture or finish products for us to comply with our code of conduct relating to supplier working conditions as well as environmental, employment and sourcing practices. We also require our licensees to ensure that their manufacturers comply with our requirements. |
• | Our supplier code of conduct covers employment practices such as wages and benefits, working hours, health and safety, working age and discriminatory practices, environmental matters such as wastewater treatment and solid waste disposal, and ethical and legal conduct. |
• | We regularly assess manufacturing and finishing facilities through periodic on-site facility inspections and improvement activities, including use of independent monitors to supplement our internal staff. We integrate review and performance results into our sourcing decisions. |
• | We disclose the names and locations of our contract manufacturers to encourage collaboration among apparel companies in factory monitoring and improvement. We regularly evaluate and refine our code of conduct processes. |
Logistics. We use company-operated and third-party distribution facilities to warehouse and ship products to our wholesale customers, retail stores and e-commerce customers. For more information, see "Item 2 – Properties." Distribution center activities include receiving finished goods from our contract manufacturers and plants, inspecting those products, preparing them for retail presentation, and shipping them to our customers and to our own stores. Our distribution centers maintain a combination of replenishment and seasonal inventory. In certain locations around the globe, we have consolidated our distribution centers to service multiple countries.
Competition
The global apparel industry is highly competitive and fragmented. It is characterized by low barriers to entry, brands targeted at specific consumer segments, many regional and local competitors, and an increasing number of global competitors. Principal competitive factors include:
• | anticipating and responding to changing consumer preferences and buying trends in a timely manner, and ensuring product availability at wholesale and DTC channels; |
• | developing high-quality, innovative products with relevant designs, fits, finishes, fabrics, style and performance features that meet consumer desires and trends; |
• | maintaining favorable and strong brand name recognition and appeal through strong and effective marketing support and intelligence in diverse market segments; |
• | identifying and securing desirable new retail locations and presenting products effectively at company-operated retail and franchised and other brand-dedicated stores; |
• | ensuring high-profile product placement at retailers; |
• | anticipating and responding to consumer expectations regarding e-commerce shopping and shipping; |
• | optimizing supply chain cost efficiencies and product development cycle lead times; |
• | creating products at a range of price points that appeal to the consumers of both our wholesale customers and our dedicated retail stores and e-commerce sites situated in each of our geographic regions; and |
• | generating competitive economics for wholesale customers, including retailers, franchisees, and licensees. |
We believe we compete favorably with respect to these factors.
We face competition from a broad range of competitors at the global, regional and local levels in diverse channels across a wide range of retail price points, and some of our competitors are larger and have more resources in the markets in which we operate. Our primary competitors include vertically integrated specialty stores, jeanswear brands, khakiwear brands, athletic wear companies, retailers' private or exclusive labels, and certain e-commerce sites.
9
Intellectual Property
We have more than 5,400 trademark registrations and pending applications in approximately 180 jurisdictions worldwide, and we acquire rights in new trademarks according to business needs. Substantially all of our global trademarks are owned by Levi Strauss & Co. We regard our trademarks as our most valuable assets and believe they have substantial value in the marketing of our products. The Levi's®, Dockers® and 501® trademarks, the Arcuate Stitching Design, the Tab Device, the Two Horse® Design, the Housemark and the Wings and Anchor Design are among our core trademarks.
We protect these trademarks by registering them with the U.S. Patent and Trademark Office and with governmental agencies in other countries, particularly where our products are manufactured or sold. We work vigorously to enforce and protect our trademark rights by engaging in regular market reviews, helping local law enforcement authorities detect and prosecute counterfeiters, issuing cease-and-desist letters against third parties infringing or denigrating our trademarks, opposing registration of infringing trademarks, and initiating litigation as necessary. We are currently pursuing over 250 infringement matters around the world. We also work with trade groups and industry participants seeking to strengthen laws relating to the protection of intellectual property rights in markets around the world.
As of November 24, 2019, we had nine issued U.S. patents and 19 U.S. patent applications pending. Our patents expire between 2025 and 2038. We also have 15 international and foreign patent applications pending. In addition, as we develop technologies that we believe are innovative, such as Project F.L.X., we intend to continually assess the patentability of new intellectual property.
Employees
As of November 24, 2019, we employed approximately 15,800 people, approximately 7,300 of whom were located in the Americas, 4,600 in Europe, and 3,900 in Asia. Approximately 1,800 of our employees were associated with the manufacturing and procurement of our products, 8,500 worked in retail, including seasonal employees, 1,500 worked in distribution and 4,000 were other non-production employees. As of November 24, 2019, approximately 3,700 of our employees were represented by a labor union or covered by a collective bargaining agreement. We have not experienced any work stoppages, and we consider our relations with our employees to be good.
History and Corporate Citizenship
Our story began in San Francisco, California in 1853 as a wholesale dry goods business. We invented the blue jean 20 years later. In 1873, we received a U.S. patent for “waist overalls” with metal rivets at points of strain. The first product line designated by the lot number "501" was created in 1890.
In the 19th and early 20th centuries, our work pants were worn primarily by cowboys, miners and other working men in the western United States. Then, in 1934, we introduced our first jeans for women, and after World War II, our jeans began to appeal to a wider market. By the 1960s, they had become a symbol of American culture, representing a unique blend of history and youth. We opened our export and international businesses in the 1950s and 1960s, respectively. The Dockers® brand helped drive "Casual Friday" in the 1990s and has been a cornerstone of casual menswear for more than 30 years.
Today, descendants of the family of Levi Strauss continue to be actively involved in our company. Our Class B common stock is primarily owned by these descendants and their relatives and trusts established for their behalf. In order to facilitate a forum for frequent, open and constructive dialogue between us and these stockholders, the family members have organized a family council, which engages with us on topics of mutual interest, such as our industry, governance, ownership and philanthropy. Management shares information and interacts with the family members, including the family council, in a manner consistent with all applicable laws and regulations.
Throughout this long history, we have upheld our strong belief that we can help shape society through civic engagement and community involvement, responsible labor and workplace practices, philanthropy, ethical conduct, environmental stewardship and transparency. We engage in a "profits through principles" business approach and constantly strive to set higher standards for ourselves and the industry. Our milestone initiatives over the years include integrating our factories prior to the enactment of the Civil Rights Act of 1964; developing a comprehensive supplier code of conduct that requires safe and healthy working conditions before such codes of conduct became commonplace among multinational apparel companies; and offering benefits to same-sex partners in the 1990s, long before most other companies.
10
Item 1A. | RISK FACTORS |
Investing in our Class A common stock involves a high degree of risk. You should consider and read carefully all of the risks and uncertainties described below, as well as other information included in this Annual Report and in our other public filings. The risks described below are not the only ones facing us. The occurrence of any of the following risks or additional risks and uncertainties not presently known to us or that we currently believe to be immaterial could materially and adversely affect our business, financial condition or results of operations. In such case, the trading price of our Class A common stock could decline, and you may lose all or part of your original investment. This Annual Report also contains forward-looking statements and estimates that involve risks and uncertainties. Our actual results could differ materially from those anticipated in the forward-looking statements as a result of specific factors, including the risks and uncertainties described below.
Risks Relating to Our Business
Our success depends on our ability to maintain the value and reputation of our brands.
Our success depends in large part on the value and reputation of our brands, which are integral to our business and the implementation of our strategies for expanding our business. Maintaining, promoting and positioning our brands will depend largely on the success of our marketing and merchandising efforts and our ability to provide consistent, high-quality products. Our brands and reputation could be adversely affected if we fail to achieve these objectives, if we fail to deliver high- quality products acceptable to our customers and consumers or if we face or mishandle a product recall.
Our brand value also depends on our ability to maintain a positive consumer perception of our corporate integrity and culture. Negative claims or publicity involving us or our products, or the production methods of any of our suppliers or contract manufacturers, could seriously damage our reputation, sales and brand image, regardless of whether such claims or publicity are accurate. Social media, which accelerates and potentially amplifies the scope of negative claims or publicity, can increase the challenges of responding to negative claims or publicity. In addition, we or our senior executives may from time to time take positions on social issues that may be unpopular with some customers or potential customers, which may impact our ability to attract or retain such customers. Adverse publicity could undermine consumer confidence in our brands and reduce long-term demand for our products, even if such publicity is unfounded. Any harm to our brands and reputation could adversely affect our business and financial condition.
We depend on a group of key wholesale customers for a significant portion of our revenues. A significant adverse change in a customer relationship or in a customer's performance or financial position could harm our business and financial condition.
Sales to our top ten wholesale customers accounted for 26%, 27% and 28% of our total net revenues in fiscal years 2019, 2018 and 2017, respectively. No single customer represented 10% or more of our net revenues in any of these years. While we have long-standing relationships with our wholesale customers, we do not have long-term contracts with them. As a result, purchases generally occur on an order-by-order basis, and the relationship, as well as particular orders, can generally be terminated by either party at any time. If any major wholesale customer decreases or ceases its purchases from us, cancels its orders, reduces the floor space, assortments, fixtures or advertising for our products or changes its manner of doing business with us for any reason, such actions could adversely affect our business and financial condition. Furthermore, certain of our major wholesale customers may seek to distribute our products globally in a manner or at prices that impact the positioning that we seek to promote in our other channels of distribution. In addition, a decline in the performance or financial condition of a major wholesale customer – including bankruptcy or liquidation – could result in a material loss of revenues to us and cause us to limit or discontinue business with that customer, require us to assume more credit risk relating to our receivables from that customer or limit our ability to collect amounts related to previous purchases by that customer. Any of the foregoing could adversely affect our business and financial condition. For example, our wholesale customer, Sears Holdings Corporation and certain of its subsidiaries, including Kmart, is currently undergoing bankruptcy proceedings and has closed stores and implemented layoffs in 2019. Continuing developments will likely adversely affect our sales to this customer.
The retail industry in the United States has experienced substantial consolidation over the last decade, and further consolidation may occur. Consolidation in the retail industry has typically resulted in store closures, centralized purchasing decisions, and increased emphasis by retailers on inventory management and productivity, which could result in fewer stores carrying our products or reduced demand by retailers of our products. In addition, we and other suppliers may experience increased customer leverage over us and greater exposure to credit risk as a result of industry consolidation. Furthermore, consolidation may be partly due to consumers continuing to transition away from traditional wholesale retailers to large online retailers, which in turn exposes our products to increased competition. Any of the foregoing results can impact, and have adversely impacted in the past, our net revenues, margins and ability to operate efficiently.
11
We may be unable to maintain or increase our sales through our primary distribution channels.
In addition to our brand-dedicated company-operated retail stores and e-commerce sites, our primary distribution channels include department stores, specialty retailers, mass channel retailers, franchised or other brand-dedicated stores, and shop-in-shops.
We may be unable to maintain or increase sales of our products through these distribution channels for several reasons, including the following:
• | the retailers in these channels maintain – and seek to grow – substantial private-label and exclusive offerings as they strive to differentiate the brands and products they offer from those of their competitors; |
• | the retailers may change their apparel strategies in a way that shifts focus away from our typical consumer or that otherwise results in a reduction of sales of our products generally, such as a reduction of fixture spaces devoted to our products or a shift to other brands; |
• | other channels, including vertically integrated specialty stores and e-commerce sites, account for a substantial portion of jeanswear and casual wear sales. In some of our mature markets, these stores and sites have placed competitive pressure on our primary distribution channels, and many of these stores and sites are now looking to our developing markets to grow their business; and |
• | shrinking points of distribution, including fewer doors at our customer locations, or bankruptcy or financial difficulties of a customer. |
Further success by retailer private-labels, vertically-integrated specialty stores and e-commerce sites may continue to adversely affect the sales of our products across all channels, as well as the profitability of our brand-dedicated stores. Additionally, our ability to secure or maintain retail floor space, product display prominence, market share and sales in these channels depends on our ability to offer differentiated products, to increase retailer profitability on our products and the strength of our brands, and such efforts could have an adverse impact on our margins.
We are a global company with significant revenues and earnings generated internationally, which exposes us to the impact of foreign currency fluctuations, as well as political and economic risks.
A significant portion of our revenues and earnings are generated internationally. In addition, a substantial amount of our products comes from sources outside the country of distribution. As a result, we are both directly and indirectly (through our suppliers) subject to the risks of doing business outside the United States, including:
• | currency fluctuations, which have impacted our results of operations significantly in recent years; |
• | political, economic and social instability; |
• | changes in tariffs and taxes; |
• | regulatory restrictions on our ability to operate in our preferred manner; |
• | rapidly changing regulatory restrictions and requirements, for example in the area of data privacy; and |
• | less protective foreign laws relating to intellectual property. |
The functional currency for most of our foreign operations is the applicable local currency. As a result, fluctuations in foreign currency exchange rates affect the results of our operations and the value of our foreign assets and liabilities, including debt, which in turn may adversely affect results of operations and cash flows and the comparability of period-to-period results of operations. Changes in foreign currency exchange rates may also affect the relative prices at which we and foreign competitors sell products in the same market. Foreign governmental policies and actions regarding currency valuation could result in actions by the United States and other countries to offset the effects of such fluctuations. Given the unpredictability and volatility of foreign currency exchange rates, ongoing or unusual volatility may adversely impact our business and financial conditions.
Furthermore, due to our global operations, we are subject to numerous domestic and foreign laws and regulations affecting our business, such as those related to labor, employment, worker health and safety, antitrust and competition, environmental protection, consumer protection, privacy, and anti-corruption, including but not limited to the Foreign Corrupt Practices Act (the "FCPA") and the U.K. Bribery Act. Although we have put into place policies and procedures aimed at ensuring legal and regulatory compliance, our employees, subcontractors and agents could take actions that violate these requirements. Violations of these regulations could subject us to criminal or civil enforcement actions, any of which could have an adverse effect on our business.
We also are subject to the impacts of political, economic and social instability. For example, in June 2016, voters in the United Kingdom approved an advisory referendum to withdraw from the European Union, commonly referred to as "Brexit." A withdrawal could significantly disrupt the free movement of goods, services, and people between the United Kingdom and the European Union, and result in increased legal and regulatory complexities, as well as potential higher costs of conducting business
12
in Europe. The uncertainty surrounding the terms of the United Kingdom's withdrawal and its consequences could adversely impact consumer and investor confidence, and the level of consumer purchases of discretionary items and retail products, including our products. Any of these effects, among others, could materially adversely affect our business, results of operations, and financial condition. Brexit has also contributed to significant volatility and uncertainty in global stock markets and currency exchange rates, and such volatility could continue to occur.
Changes to trade policy, including tariff and customs regulations, may have a material adverse effect on our business, financial condition and results of operations.
Changes in U.S. or international social, political, regulatory and economic conditions or in laws and policies governing trade, manufacturing, development and investment in the countries where we currently sell our products or conduct our business, as well as any negative sentiment toward the United States as a result of such changes, could adversely affect our business. The Trump Administration has instituted or proposed changes in trade policies that include the negotiation or termination of trade agreements, the imposition of higher tariffs on U.S. imports, economic sanctions on individuals, corporations or countries, and other government regulations affecting trade between the United States and other countries where we conduct our business. It may be time-consuming and expensive for us to alter our business operations in order to adapt to or comply with any such changes. The Trump Administration has also negotiated a replacement trade deal for NAFTA with Mexico and Canada, known as the United States-Mexico-Canada Agreement ("USMCA"), which still needs to be ratified by Canada before going into force.
As a result of recent policy changes and proposals of the Trump Administration, there may be greater restrictions and economic disincentives on international trade. New tariffs and other changes in U.S. trade policy could trigger retaliatory actions by affected countries. Like many other multinational corporations, we do a significant amount of business that could be impacted by changes to U.S. and international trade policies (including governmental action related to tariffs, and trade agreements). Such changes have the potential to adversely impact the U.S. economy or certain sectors thereof, our industry and the global demand for our products and, as a result, could have a material adverse effect on our business, financial condition and results of operations.
The enactment of tax reform legislation, including legislation implementing changes in taxation of international business activities, could materially impact our financial position and results of operations.
Legislation or other changes in US and international tax laws could increase our liability and adversely affect our after-tax profitability. For example, the Tax Cuts and Jobs Act (the "Tax Act") was enacted in the United States on December 22, 2017. The Tax Act had a significant impact on our effective tax rate, cash tax expenses and net deferred tax assets. The Tax Act reduced the U.S. corporate statutory tax rate, eliminated or limited the deduction of several expenses that were previously deductible, imposed a mandatory deemed repatriation tax on undistributed historic earnings of foreign subsidiaries, requires a minimum tax on earnings generated by foreign subsidiaries and permits a tax-free repatriation of foreign earnings through a dividends received deduction. We have completed our evaluation of the overall impact of the Tax Act on our effective tax rate and balance sheet through fiscal year-end 2019, and reflected the amounts in our financial statements. The Tax Act, as well as regulations and legal decisions interpreting and applying the Tax Act, may have significant impacts in future periods.
If we encounter problems with distribution, our ability to deliver our products to market could be adversely affected.
We rely on both company-owned and third-party distribution facilities to warehouse and ship products to our wholesale customers, retail stores and e-commerce consumers throughout the world. As part of the pursuit for improved organizational agility and marketplace responsiveness, we have consolidated the number of distribution facilities we rely upon and continue to look for opportunities for further consolidation in certain regions. Such consolidation may make our operations more vulnerable to interruptions in the event of work stoppages, labor disputes, earthquakes, floods, fires or other natural disasters affecting these distribution centers. In addition, distribution capacity is dependent on the timely performance of services by third parties, including the transportation of products to and from their distribution facilities. Moreover, our distribution system includes computer-controlled and automated equipment, which may be subject to a number of risks related to data and system security or computer viruses, the proper operation of software and hardware, power interruptions or other system failures. If we encounter problems with our distribution system, whether company-owned or third-party, our ability to meet customer and consumer expectations, manage inventory, complete sales and achieve operating efficiencies could be adversely affected.
Our efforts to expand our retail business may not be successful, which could impact our operating results.
One of our key strategic priorities is to become a leading world-class omni-channel retailer by expanding our consumer reach in brand-dedicated stores globally, including making selective investments in company-operated stores and e-commerce sites, franchisee and other brand-dedicated store models. In many locations, we face major, established retail competitors who may be able to better attract consumers and execute their retail strategies. In addition, a retail operating model involves substantial investments in equipment and property, information systems, inventory and personnel. Due to the high fixed-cost structure associated with these investments, a significant expansion in company-operated stores, a decline in sales or the closure of or poor
13
performance of stores could result in significant costs and impacts to our margins. Our ability to grow our retail channel also depends on the availability and cost of real estate that meets our criteria for traffic, square footage, demographics, and other factors. Failure to identify and secure adequate new locations, or failure to effectively manage the profitability of the fleet of stores, could have an adverse effect on our results of operations.
In addition, our investments in customer, digital, and omni-channel shopping initiatives may not deliver the results we anticipate. One of our strategic priorities is to further develop an omni-channel shopping experience for our customers through the integration of our store and digital shopping channels. Our omni-channel initiatives include cross-channel logistics optimization and exploring additional ways to develop an omni-channel shopping experience, including further digital integration and customer personalization. These initiatives involve significant investments in IT systems and significant operational changes. In addition, our competitors are also investing in omni-channel initiatives, some of which may be more successful than our initiatives. If the implementation of our customer, digital, and omni-channel initiatives is not successful, or we do not realize the return on our investments in these initiatives that we anticipate, our operating results would be adversely affected.
If we are unable to effectively execute our e-commerce business, our reputation and operating results may be harmed.
While e-commerce still comprises a small portion of our net revenues, it has been our fastest growing business over the last several years. The success of our e-commerce business depends, in part, on third parties and factors over which we have limited control, including changing consumer preferences and buying trends relating to e-commerce usage, both domestically and abroad, and promotional or other advertising initiatives employed by our wholesale customers or other third parties on their e-commerce sites. Any failure on our part, or on the part of our third-party digital partners, to provide attractive, reliable, secure and user-friendly e-commerce platforms could negatively impact our consumers’ shopping experience, resulting in reduced website traffic, diminished loyalty to our brands and lost sales. In addition, as we continue to expand and increase the global presence of our e-commerce business, sales from our retail stores and wholesale channels of distribution in areas where e-commerce sites are introduced may decline due to changes in consumer shopping habits and cannibalization.
We are also vulnerable to certain additional risks and uncertainties associated with our e-commerce sites, including:
•changes in required technology interfaces;
•website downtime and other technical failures;
•costs and technical issues from website software upgrades;
•data and system security;
•computer viruses; and
•changes in applicable federal and state regulations.
In addition, we must keep up to date with competitive technology trends, including the use of new or improved technology, creative user interfaces and other e-commerce marketing tools such as paid search and mobile applications, among others, which may increase our costs and which may not succeed in increasing sales or attracting consumers. For example, it is possible that consumers may not sign up for our loyalty program at anticipated rates if they do not find the features and benefits compelling, and that we may not realize the benefits that we anticipate from these programs. Our failure to successfully respond to these risks and uncertainties might adversely affect the sales in our e-commerce business, as well as damage our reputation and brands.
Additionally, the success of our e-commerce business and the satisfaction of our consumers depend on their timely receipt of our products. The efficient flow of our products requires that our company-operated and third-party operated distribution facilities have adequate capacity to support the current level of e-commerce operations and any anticipated increased levels that may follow from the growth of our e-commerce business. If we encounter difficulties with our distribution facilities or in our relationships with the third parties who operate the facilities, or if any such facilities were to shut down for any reason, including as a result of fire, other natural disaster or labor disruption, we could face shortages of inventory, resulting in "out of stock" conditions in the e-commerce sites we operate and those operated by our wholesale customers or other third parties, and we could incur significantly higher costs and longer lead times associated with distributing our products to our consumers and experience dissatisfaction from our consumers. Any of these issues could have an adverse effect on our business and harm our reputation.
Unexpected obstacles in new markets and that arise in connection with growth in our existing markets may limit our expansion opportunities and cause our business and growth to suffer.
Our future growth depends in part on our continued expansion efforts in existing markets and in new markets where we may have limited familiarity and experience with regulatory environments and market practices. We may not be able to expand or successfully operate in those markets as a result of such unfamiliarity or other unexpected barriers to expansion or entry. In connection with our efforts, we may encounter obstacles, including cultural and linguistic differences, differences in regulatory environments, labor practices and market practices, economic or governmental instability, difficulties in keeping abreast of market,
14
business and technical developments and foreign consumers’ tastes and preferences. Our failure to develop our business in new markets or disappointing growth in existing markets that we may experience could harm our business and results of operations.
We face risks arising from any future restructuring of our operations and uncertainty with respect to our ability to achieve any anticipated cost savings associated with such restructuring.
We continuously assess opportunities to streamline operations and fuel long-term profitable growth. Future charges related to such actions may harm our profitability in the periods incurred.
Implementation of global productivity actions presents a number of significant risks, including:
• | actual or perceived disruption of service or reduction in service levels to customers and consumers; |
• | potential adverse effects on our internal control environment and inability to preserve adequate internal controls relating to our general and administrative functions in connection with the decision to outsource certain business service activities; |
• | actual or perceived disruption to suppliers, distribution networks and other important operational relationships and the inability to resolve potential conflicts in a timely manner; |
• | difficulty in obtaining timely delivery of products of acceptable quality from our contract manufacturers; |
• | diversion of management attention from ongoing business activities and strategic objectives; and |
• | failure to maintain employee morale and retain key employees. |
Because of these and other factors, we cannot predict whether we will fully realize the purpose and anticipated operational benefits or cost savings of any global productivity actions and, if we do not, our business and results of operations may be adversely affected. Furthermore, if we experience adverse changes to our business, additional restructuring or reorganization activities may be required in the future.
Any major disruption or failure of our information technology systems, or our failure to successfully implement new technology effectively, could adversely affect our business and operations.
We rely on various information technology systems, owned by us and third parties, to manage our operations. Over the last several years, we have been and continue to implement modifications and upgrades to our systems, including making changes to legacy systems, replacing legacy systems with successor systems with new functionality and acquiring new systems with new functionality. For example, over the next several years, we plan to continue the process of implementing a new enterprise resource planning system across the company. These activities subject us to inherent costs and risks associated with replacing and upgrading these systems, including impairment of our ability to fulfill customer orders, potential disruption of our internal control structure, substantial capital expenditures, additional administration and operating expenses, retention of sufficiently skilled personnel to implement and operate the new systems, demands on management time, and other risks and costs of delays or difficulties in transitioning to new or upgraded systems or of integrating new or upgraded systems into our current systems. Our system implementations may not result in productivity improvements at a level that outweighs the costs of implementation, or at all. In addition, the difficulties with implementing new or upgraded technology systems may cause disruptions in our business operations and have an adverse effect on our business and operations, if not anticipated and appropriately mitigated.
As we outsource functions, we become more dependent on the entities performing those functions. Disruptions or delays at our third-party service providers could adversely impact our operations.
As part of our long-term profitable growth strategy, we are continually looking for opportunities to provide essential business services in a more cost-effective manner. In some cases, this requires the outsourcing of functions or parts of functions that can be performed more effectively by external service providers. For example, we currently outsource a significant portion of our information technology, finance, customer relations and customer service functions to Wipro Limited. While we believe we conduct appropriate diligence before entering into agreements with any outsourcing entity, the failure of one or more of such entities to meet our performance standards and expectations, including with respect to data security, compliance with data protection and privacy laws, providing services on a timely basis or providing services at the prices we expect, may have an adverse effect on our results of operations or financial condition. In addition, we could face increased costs or disruption associated with finding replacement vendors or hiring new employees in order to return these services in-house. We may outsource other functions in the future, which would increase our reliance on third parties.
15
We face cybersecurity, privacy and data protection risks and may incur increasing costs in an effort to minimize those risks.
We utilize systems that allow for the secure storage and transmission of proprietary or confidential information regarding our consumers, employees, and others, including credit card information and personal information. As evidenced by the numerous companies who have suffered serious data security breaches, we may be vulnerable to, and unable to anticipate or detect data security breaches and data loss, including rapidly evolving and increasingly sophisticated cybersecurity attacks. In addition, data security breaches can also occur as a result of a failure by us or our employees, such as failing to follow policies, procedures or training, or by persons with whom we have commercial relationships that result in the unauthorized release of personal or confidential information. In addition to our own databases, we use third-party service providers to store, process and transmit confidential or personal information on our behalf. Although we contractually require these service providers to implement and use reasonable security measures and to comply with laws relating to privacy and data protection, we cannot control third parties and cannot guarantee that a data security breach will not occur in the future either at their location or within their systems.
A data security breach may expose us to a risk of loss or misuse of this information, and could result in significant costs to us, which may include, among others, potential liabilities to payment card networks for reimbursement of credit card fraud and card reissuance costs, including fines and penalties, potential liabilities from governmental or third-party investigations, proceedings or litigation and diversion of management attention and also further inquiries and increased scrutiny from regulatory entities. We could also experience delays or interruptions in our ability to function in the normal course of business, including delays in the fulfillment or cancellation of customer orders or disruptions in the manufacture and shipment of products. In addition, actual or anticipated attacks may cause us to incur costs, including costs to deploy additional personnel and protection technologies, train employees, and engage third-party experts and consultants. Any compromise or breach of our security could result in a violation of applicable privacy and other laws, significant legal and financial exposure, and a loss of confidence in our security measures, which could have an adverse effect on our results of operations and our reputation.
The regulatory environment surrounding information security and privacy is increasingly demanding, with frequent imposition of new and changing requirements. In the United States, various laws and regulations apply to the collection, processing, disclosure and security of certain types of data, including the Electronic Communications Privacy Act, the Computer Fraud and Abuse Act, the Health Insurance Portability and Accountability Act of 1996, the Gramm Leach Bliley Act and state laws relating to privacy and data security, including the California Consumer Privacy Act. Several foreign countries and governmental bodies, including the European Union, also have laws and regulations dealing with the handling and processing of personal information obtained from their residents, which in certain cases are more restrictive than those in the United States. Laws and regulations in these jurisdictions apply broadly to the collection, use, storage, disclosure and security of various types of data referred to as personal information. The definition of personal information, which includes data that identifies or may be used to identify an individual, directly or indirectly, such as names or email addresses and, in some jurisdictions, any unique identifier such as an internet protocol addresses, has been continually revised in a way that puts larger amounts of information within scope of the laws. Such laws and regulations may be modified or subject to new or different interpretations, and new laws and regulations may be enacted in the future. Within the European Union, the General Data Protection Regulation, which became effective in May 2018 and replaced the 1995 European Union Data Protection Directive and superseded applicable European Union member state legislation, imposes significant new requirements on how companies collect, process and transfer personal data, as well as significant fines for noncompliance. The increased complexity in these laws and the inherent conflicts between jurisdictions may result in an inability for the company to comply with all applicable requirements in the jurisdictions where we do business despite our best efforts.
Any failure or perceived failure by us to comply with laws, regulations, policies or regulatory guidance relating to privacy or data security may result in governmental investigations and enforcement actions, litigation, fines and penalties or adverse publicity, and could cause our customers and consumers to lose trust in us, which could have an adverse effect on our reputation and business. Our efforts to implement evolving global detailed legal requirements relating to protection of personal information creates uncertainty in our ability to anticipate the volume of consumer inquiries, to timely respond, and to predict consumer understanding of our business practices which may all unintentionally create confusion about our practices and cause loss of trust and damage to our reputation.
We currently rely on contract manufacturing of our products. Our inability to secure production sources meeting our quality, cost, working conditions and other requirements, or failures by our contract manufacturers to perform, could harm our sales, service levels and reputation.
In fiscal year 2019, we sourced approximately 99% of our products from independent contract manufacturers who purchase fabric and make our products and may also provide us with design and development services. As a result, we must locate and secure production capacity. We depend on contract manufacturers to maintain adequate financial resources, including access to sufficient credit, secure a sufficient supply of raw materials, and maintain sufficient development and manufacturing capacity in an environment characterized by continuing cost pressure and demands for product innovation and speed-to-market. In addition, we currently do not have any material long-term contracts with any of our contract manufacturers. Under our current arrangements
16
with our contract manufacturers, these manufacturers generally may unilaterally terminate their relationship with us at any time. Finally, while we have historically worked with numerous manufacturers, in recent years we have begun consolidating the number of contract manufacturers from which we source our products. In addition, some of our contract manufacturers have merged. Reliance on a fewer number of contract manufacturers involves risk, and any difficulties or failures to perform by our contract manufacturers could cause delays in product shipments or otherwise negatively affect our results of operations.
A contract manufacturer's failure to ship products to us in a timely manner or to meet our quality standards, or interference with our ability to receive shipments due to factors such as port or transportation conditions or security incidents, could cause us to miss the delivery date requirements of our customers. Failing to make timely deliveries may cause our customers to cancel orders, refuse to accept deliveries, impose non-compliance charges, demand reduced prices, or reduce future orders, any of which could harm our sales and margins. If we need to replace any contract manufacturer, we may be unable to locate additional contract manufacturers on terms that are acceptable to us, or at all, or we may be unable to locate additional contract manufacturers with sufficient capacity to meet our requirements or to fill our orders in a timely manner.
We require contract manufacturers to meet our standards in terms of working conditions, environmental protection, raw materials, facility safety, security and other matters before we are willing to place business with them. As such, we may not be able to obtain the lowest-cost production. We also may need to move our production to the extent that we determine our contract manufacturers are not in compliance with our standards. We may also encounter delays in production and added costs as a result of the time it takes to train our contract manufacturers in our methods, products and quality control standards. In addition, the labor and business practices of apparel manufacturers and their suppliers have received increased attention from the media, non-governmental organizations, consumers and governmental agencies in recent years. Any failure by our contract manufacturers or their suppliers to adhere to labor or other laws, appropriate labor or business practices, safety, structural or environmental standards, and the potential litigation, negative publicity and political pressure relating to any of these events, could harm our business and reputation.
Our suppliers may be impacted by economic conditions and cycles and changing laws and regulatory requirements which could impact their ability to do business with us or cause us to terminate our relationship with them and require us to find replacements, which we may have difficulty doing.
Our suppliers are subject to the fluctuations in general economic cycles, and global economic conditions may impact their ability to operate their businesses. They may also be impacted by the increasing costs or availability of raw materials, labor and distribution, resulting in demands for less attractive contract terms or an inability for them to meet our requirements or conduct their own businesses. The performance and financial condition of a supplier may cause us to alter our business terms or to cease doing business with a particular supplier, or change our sourcing practices generally, which could in turn adversely affect our business and financial condition.
In addition, regulatory developments such as reporting requirements on the use of "conflict" minerals mined from the Democratic Republic of Congo and adjoining countries could affect the sourcing and availability of raw materials used by our suppliers in the manufacturing of certain of our products. We have been and may continue to be subject to costs associated with regulations, including for the diligence pertaining to the presence of any conflict minerals used in our products and the cost of remediation and other changes to products, processes, or sources of supply as a consequence of such verification activities. The impact of such regulations may result in a limited pool of suppliers who provide conflict free metals, and we cannot be assured that we will be able to obtain products in sufficient quantities or at competitive prices. Also, because our supply chain is complex, we may face reputational challenges with our consumers and other stakeholders if we are unable to sufficiently verify the origins for all metals used in the products we sell.
If one or more of our counterparty financial institutions default on their obligations to us, we may incur significant losses.
As part of our hedging activities, we enter into transactions involving derivative financial instruments, which may include forward contracts, commodity futures contracts, option contracts, collars and swaps, with various financial institutions. In addition, we have significant amounts of cash, cash equivalents and other investments on deposit or in accounts with banks or other financial institutions in the United States and abroad. As a result, we are exposed to the risk of default by or failure of counterparty financial institutions. This risk may be heightened during economic downturns and periods of uncertainty in the financial markets. If one of our counterparties were to become insolvent or file for bankruptcy, our ability to recover losses incurred as a result of default or our assets that are deposited or held in accounts with such counterparty may be limited by the counterparty’s liquidity or the applicable laws governing the insolvency or bankruptcy proceedings. In the event of default or failure of one or more of our counterparties, we could incur significant losses, which could negatively impact our results of operations and financial condition.
17
The loss of members of our executive management and other key employees or the failure to attract and retain key personnel could harm our business.
Our future success depends, in part, on the continued service of our executive management team and other key employees, and the loss of the services of any key individual could harm our business. Our future success also depends, in part, on our ability to recruit, retain and motivate our employees sufficiently, both to maintain our current business and to execute our strategic initiatives. Competition for experienced and well-qualified employees in our industry is particularly intense in many of the places where we do business, and we may not be successful in attracting and retaining such personnel. Moreover, shifts in U.S. immigration policy could negatively impact our ability to attract, hire and retain highly skilled employees who are from outside the United States.
Most of the employees in our production and distribution facilities are covered by collective bargaining agreements, and any material job actions could negatively affect our results of operations.
In North America, most of our distribution employees are covered by various collective bargaining agreements. Outside North America, most of our production and distribution employees are covered by either industry-sponsored and/or government-sponsored collective bargaining mechanisms. Any work stoppages or other job actions by these employees could harm our business and reputation.
Our licensees and franchisees may not comply with our product quality, manufacturing standards, marketing and other requirements, which could negatively affect our reputation and business.
We license our trademarks to third parties for manufacturing, marketing and distribution of various products. While we enter into comprehensive agreements with our licensees covering product design, product quality, sourcing, manufacturing, marketing and other requirements, our licensees may not comply fully with those agreements. Non-compliance could include marketing products under our brand names that do not meet our quality and other requirements or engaging in manufacturing practices that do not meet our supplier code of conduct. These activities could harm our brand equity, our reputation and our business.
In addition, we enter into franchise agreements with unaffiliated franchisees to operate stores and, in certain circumstances, websites, in many countries around the world. Under these agreements, third parties operate, or will operate, stores and websites that sell apparel and related products under our brand names. While the agreements we have entered into and plan to enter into in the future provide us with certain termination rights, the value of our brands could be impaired to the extent that these third parties do not operate their stores or websites in a manner consistent with our requirements regarding our brand identities and customer experience standards. Failure to protect the value of our brands, or any other harmful acts or omissions by a franchisee, could have an adverse effect on our results of operations and our reputation.
Our success depends on the continued protection of our trademarks and other proprietary intellectual property rights.
Our trademarks and other intellectual property rights are important to our success and competitive position, and the loss of or inability to enforce trademark and other proprietary intellectual property rights could harm our business. We devote substantial resources to the establishment and protection of our trademark and other proprietary intellectual property rights on a global basis. In addition to our trademarks and other intellectual property rights, as we develop technologies, such as Project F.L.X., that we believe are innovative, we intend to continually assess the patentability and other protectability of new intellectual property. However, the patents that we own and those that may be issued in the future may not adequately protect our intellectual property, survive legal challenges or provide us with competitive advantages, and our patent applications may not be granted. Our efforts to establish and protect our proprietary intellectual property rights may not be adequate to prevent imitation of our products by others or to prevent others from seeking to claim ownership or seeking to block sales of our products. Unauthorized copying of our products or unauthorized use of our trademarks, patented technologies or other proprietary rights may not only erode sales of our products but may also cause significant reputational harm to our brand names and our ability to effectively represent ourselves to our consumers, contractors, suppliers and/or licensees. Moreover, others may seek to assert rights in, or ownership of, our trademarks and other intellectual property, including through civil and/or criminal prosecution. We may not be able to successfully resolve those claims, which may result in financial liability and criminal penalties, and defending or pursuing such claims may create significant financial burdens. In addition, the laws and enforcement mechanisms of some foreign countries may not allow us to protect our proprietary rights to the same extent as we are able to in the United States and other countries.
We have substantial liabilities and cash requirements associated with our postretirement benefits, pension and deferred compensation plans.
Our postretirement benefits, pension and deferred compensation plans result in substantial liabilities on our balance sheet. These plans and activities have generated, and will generate, substantial cash requirements for us, and these requirements may increase beyond our expectations in future years based on changing market conditions. The difference between plan obligations and assets, or the funded status of the plans, is a significant factor in determining the net periodic benefit costs of our pension
18
plans and the ongoing funding requirements of those plans. Many variables, such as changes in interest rates, mortality rates, health care costs, investment returns and/or the market value of plan assets, can affect the funded status of our defined benefit pension, other postretirement, and postemployment benefit plans and cause volatility in the net periodic benefit cost and future funding requirements of the plans. Plan liabilities may impair our liquidity, have an unfavorable impact on our ability to obtain financing and place us at a competitive disadvantage compared to some of our competitors who do not have such liabilities and cash requirements.
Natural disasters, public health crises, political crises, and other catastrophic events or other events outside of our control may damage our facilities or the facilities of third parties on which we depend, and could impact consumer spending.
Our global headquarters and the headquarters of our Americas region are both located in California near major geologic faults that have experienced earthquakes in the past. An earthquake or other natural disaster or power shortages or outages could disrupt operations or impair critical systems. Any of these disruptions or other events outside of our control could affect our business negatively, harming our operating results. In addition, if any of our facilities, including our manufacturing, finishing or distribution facilities, our company-operated or franchised stores or the facilities of our suppliers, third-party service providers, or customers, is affected by natural disasters, such as earthquakes, tsunamis, power shortages or outages, floods or monsoons, public health crises, such as pandemics and epidemics, political crises, such as terrorism, war, political instability or other conflict, or other events outside of our control, our business and operating results could suffer. Disasters occurring at our or our vendors’ facilities also could impact our reputation and our consumers’ perception of our brands. Moreover, these types of events could negatively impact consumer spending in the impacted regions or depending upon the severity, globally, which could adversely impact our operating results. For example, in December 2019, a strain of coronavirus was reported to have surfaced in Wuhan, China, resulting in store closures and a decrease in consumer traffic in China. At this point, the extent to which the coronavirus may impact our results is uncertain.
Failure to comply with anti-bribery, anti-corruption and anti-money laundering laws could subject us to penalties and other adverse consequences.
We are subject to the FCPA, the U.K. Bribery Act and other anti-bribery, anti-corruption and anti-money laundering laws in various jurisdictions around the world. The FCPA, the U.K. Bribery Act and similar applicable laws generally prohibit companies, as well as their officers, directors, employees and third-party intermediaries, business partners and agents, from making improper payments or providing other improper things of value to government officials or other persons. We and our third-party intermediaries may have direct or indirect interactions with officials and employees of government agencies or state owned or affiliated entities and other third parties where we may be held liable for corrupt or other illegal activities, even if we do not explicitly authorize them. While we have policies and procedures and internal controls to address compliance with such laws, we cannot assure you that all of our employees and third-party intermediaries, business partners and agents will not take actions in violation of such policies and laws, for which we may be ultimately held responsible. To the extent that we learn that any of our employees or third-party intermediaries, business partners or agents do not adhere to our policies, procedures or internal controls, we are committed to taking appropriate remedial action. In the event that we believe or have reason to believe that our directors, officers, employees or third-party intermediaries, agents or business partners have or may have violated such laws, we may be required to investigate or to have outside counsel investigate the relevant facts and circumstances. Detecting, investigating and resolving actual or alleged violations can be extensive and require a significant diversion of time, resources and attention from senior management. Any violation of the FCPA, the U.K. Bribery Act or other applicable anti-bribery, anti-corruption and anti-money laundering laws could result in whistleblower complaints, adverse media coverage, investigations, loss of export privileges, and criminal or civil sanctions, penalties and fines, any of which may could adversely affect our business and financial condition.
Our current and future products may experience quality problems from time to time that could result in negative publicity, litigation, product recalls and warranty claims, which could result in decreased revenues and harm to our brands.
There can be no assurance we will be able to detect, prevent or fix all defects that may affect our products. Inconsistency of legislation and regulations may also affect the costs of compliance with such laws and regulations. Such problems could hurt the image of our brands, which is critical to maintaining and expanding our business. Any negative publicity or lawsuits filed against us related to the perceived quality of our products could harm our brand and decrease demand for our products.
Climate change may adversely impact our business.
Rising global average temperatures due to increased concentrations of carbon dioxide and other greenhouse gases in the atmosphere are causing significant changes in weather patterns around the globe and an increase in the frequency and severity of natural disasters. Changes in weather patterns and the increased frequency, intensity and duration of extreme weather events (e.g., floods, droughts and severe storms) could, among other things, adversely impact the cultivation of cotton, which is a key resource in the production of our products, disrupt the operation of our supply chain and the productivity of our contract manufacturers, disrupt retail operations and traffic in consumer markets, increase our product costs and impact the types of apparel products that
19
consumers purchase. As a result, the effects of climate change could have short- and long-term impacts on our business and operations.
Future acquisitions of and investments in new businesses could impact our business and financial condition.
From time to time, we may acquire or invest in businesses or partnerships that we believe could complement our business or offer growth opportunities. The pursuit of such acquisitions or investments may divert the attention of management and cause us to incur various expenses, regardless of whether the acquisition or investment is ultimately completed. In addition, acquisitions and investments may not perform as expected or cause us to assume unrecognized or underestimated liabilities. Further, if we are able to successfully identify and acquire additional businesses, we may not be able to successfully integrate the acquired personnel or operations, or effectively manage the combined business following the acquisition, any of which could harm our business and financial condition.
Risks Relating to Our Debt
We have debt and interest payment requirements at a level that may restrict our future operations.
As of November 24, 2019, we had $1.0 billion of debt, all of which was unsecured, and we had $819.5 million of additional borrowing capacity under our credit facility. The credit facility is secured by domestic inventories, accounts receivable, and other assets such as the Levi’s® trademarks in the U.S. Our debt requires us to dedicate a substantial portion of any cash flow from operations to the payment of interest and principal due under our debt, which reduces funds available for other business purposes and results in us having lower net income than we would otherwise have had. This dedicated use of cash could impact our ability to successfully compete by, for example:
• | increasing our vulnerability to general adverse economic and industry conditions; |
• | limiting our flexibility in planning for or reacting to changes in our business and industry; |
• | placing us at a competitive disadvantage compared to some of our competitors that have less debt; and |
• | limiting our ability to obtain additional financing required to fund working capital and capital expenditures and for other general corporate purposes. |
A substantial portion of our debt is Euro-denominated senior notes. In addition, borrowings under our credit facility bear interest at variable rates. As a result, increases in market interest rates and changes in foreign exchange rates could require a greater portion of our cash flow to be used to pay interest, which could further hinder our operations. Increases in market interest rates may also affect the trading price of our debt securities that bear interest at a fixed rate. Our ability to satisfy our obligations and to reduce our total debt depends on our future operating performance and on economic, financial, competitive and other factors, many of which are beyond our control.
In addition, certain loans made by us and financing extended to us are made at variable rates that use LIBOR as a benchmark for establishing the interest rate. LIBOR is the subject of recent proposals for reform. On July 27, 2017, the United Kingdom’s Financial Conduct Authority announced that it intends to stop persuading or compelling banks to submit LIBOR rates after 2021. These reforms may cause LIBOR to cease to exist, new methods of calculating LIBOR to be established or the establishment of an alternative reference rate(s). These consequences cannot be entirely predicted and could have an adverse impact on the market value for or value of LIBOR-linked securities, loans, and other financial obligations or extensions of credit held by or due to us. Changes in market interest rates may influence our financing costs, returns on financial investments and the valuation of derivative contracts and could reduce our earnings and cash flows.
The Tax Act also places limitations on businesses abilities to deduct interest expenses. If our adjusted taxable income were to decrease, we may not be able to fully deduct our interest expenses.
Restrictions in our notes, indentures and credit facility may limit our activities, including dividend payments, share repurchases and acquisitions.
Our credit facility and the indentures governing our senior unsecured notes contain restrictions, including covenants limiting our ability to incur additional debt, grant liens, make acquisitions and other investments, prepay specified debt, consolidate, merge or acquire other businesses or engage in other fundamental changes, sell assets, pay dividends and other distributions, repurchase stock, enter into transactions with affiliates, enter into capital leases or certain leases not in the ordinary course of business, enter into certain derivatives, grant negative pledges on our assets, make loans or other investments, guarantee third-party obligations, engage in sale leasebacks and make changes in our corporate structure. These restrictions, in combination with our leveraged condition, may make it more difficult for us to successfully execute our business strategy, grow our business or compete with companies not similarly restricted.
20
If our foreign subsidiaries are unable to distribute cash to us when needed, we may be unable to satisfy our obligations under our debt securities, which could force us to sell assets or use cash that we were planning to use elsewhere in our business.
We conduct our international operations through foreign subsidiaries and we only receive the cash that remains after our foreign subsidiaries satisfy their obligations. We may depend upon funds from our foreign subsidiaries for a portion of the funds necessary to meet our debt service obligations. Any agreements our foreign subsidiaries enter into with other parties, as well as applicable laws and regulations limiting the right and ability of non-U.S. subsidiaries and affiliates to pay dividends and remit cash to affiliated companies, may restrict the ability of our foreign subsidiaries to pay dividends or make other distributions to us. If those subsidiaries are unable to transfer the amount of cash that we need, we may be unable to make payments on our debt obligations, which could force us to sell assets or use cash that we were planning on using elsewhere in our business, which could hinder our operations.
Our business is affected by seasonality, which could result in fluctuations in our operating results.
We experience moderate fluctuations in aggregate sales volume during the year. Historically, revenues in our third and fourth fiscal quarters have slightly exceeded those in our first and second fiscal quarters. In addition, our customers and consumers may cancel orders, change delivery schedules or change the mix of products ordered with minimal notice. As a result, we may not be able to accurately predict our quarterly sales. Accordingly, our results of operations are likely to fluctuate significantly from period to period. This seasonality, along with other factors that are beyond our control, including general economic conditions, changes in consumer preferences, weather conditions, including the effects of climate change, the availability of import quotas, transportation disruptions and foreign currency exchange rate fluctuations, could adversely affect our business and cause our results of operations to fluctuate.
We are subject to periodic claims and litigation that could result in unexpected expenses and could ultimately be resolved against us.
From time to time, we may be involved in litigation and other proceedings, including matters related to commercial disputes, product liability, intellectual property, trade, customs laws and regulations, employment, regulatory compliance and other claims related to our business. Any such proceeding or audit could result in significant settlement amounts, damages, fines or other penalties, divert financial and management resources and result in significant legal fees. An unfavorable outcome of any particular proceeding could exceed the limits of our insurance policies, or our insurance carriers may decline to fund such final settlements or judgments, which could have an adverse impact on our business, financial condition and results of operations. In addition, any such proceeding could negatively impact our brand equity and our reputation.
Changes in our credit ratings or macroeconomic conditions may affect our liquidity, increasing borrowing costs and limiting our financing options.
Our long-term debt is currently rated BB+ by Standard & Poor’s and Ba1 by Moody’s Investors Service. If our credit ratings are lowered, borrowing costs for future long-term debt or short-term credit facilities may increase and our financing options, including our access to the unsecured credit market, could be limited. In addition, macroeconomic conditions such as increased volatility or disruption in the credit markets could adversely affect our ability to refinance existing debt.
Risks Relating to Our Industry
Our revenues are influenced by economic conditions that impact consumer spending and consumer confidence.
Apparel is a cyclical industry that is dependent upon the overall level of consumer spending and consumer confidence. Consumer purchases of discretionary items, including our products, generally decline during periods when disposable income is adversely affected, there is economic uncertainty or volatility or during recessionary periods. Our wholesale customers anticipate and respond to adverse changes in economic conditions and uncertainty by closing doors, reducing inventories, canceling orders or increasing promotional activity. Our brand-dedicated stores are also affected by these conditions which may lead to a decline in consumer traffic and spending in these stores. As a result, factors that diminish consumer spending and confidence in any of the markets in which we compete, particularly deterioration in general economic conditions, consumer credit availability, consumer debt levels, inflation, the impact of foreign exchange fluctuations on tourism and tourist spending, volatility in investment returns, fear of unemployment, increases in energy costs or tax or interest rates, housing market downturns, fear about and impact of pandemic illness, and other factors such as acts of war, natural disasters or terrorist or political events that impact consumer confidence, could reduce our sales and adversely affect our business and financial condition through their impact on our wholesale customers as well as direct sales. These outcomes and behaviors have in the past, and may continue to in the future, adversely affect our business and financial condition.
21
Intense competition in the global apparel industry could lead to reduced sales and prices.
We face a variety of competitive challenges in the global apparel industry from a variety of companies, and competition has increased over the years due to factors such as:
• | the international expansion and increased presence of vertically integrated specialty stores; |
• | expansion into e-commerce by existing and new competitors; |
• | the proliferation of private labels and exclusive brands offered by department stores, chain stores and mass channel retailers; |
• | the introduction of lines of jeans, athleisure and casual apparel by well-known and successful athletic wear companies; and |
• | the transition of apparel companies who traditionally relied on wholesale distribution channels into their own retail distribution network. |
In addition, some of these competitors have greater financial, supply, distribution and marketing resources and may be able to adapt to changes in consumer preferences or retail requirements more quickly or devote greater resources to the building and sustaining of their brand equity and the marketing and sale of their products both in stores and online. In addition, some of these competitors may be able to achieve lower product costs or adopt more aggressive pricing and discounting policies. As a result, we may not be able to compete as effectively with them and may not be able to maintain or grow the demand for our products. Failure to compete effectively due to these factors could reduce our sales and adversely affect our business and financial condition.
The success of our business depends upon our ability to forecast and respond timely to consumer demand and market conditions and offer on-trend and new and updated products at attractive price points.
The global apparel industry is characterized by ever-changing fashion trends and consumer preferences, including the increasing shift to digital brand engagement and social media communication, and by the rapid replication of new products by competitors. The apparel industry is also impacted by changing consumer preferences regarding spending categories generally, including shifts away from traditional consumer spending and towards "experiential" spending and sustainable products. As a result, our success depends in large part on our ability to develop, market and deliver innovative and stylish products at a pace, intensity, and price competitive with other brands in the markets in which we sell our products. In addition, we must create products at a range of price points that appeal to the consumers of both our wholesale customers and our dedicated retail stores and e-commerce sites situated in each of our diverse geographic regions. Our development and production cycles take place prior to full visibility into all of these factors for the coming seasons. Failure on our part to forecast and respond timely to consumer demand and market conditions and to regularly and rapidly develop innovative and stylish products and update core products could limit sales growth, adversely affect retail and consumer acceptance of our products, and negatively impact the consumer traffic in our dedicated retail stores. In addition, if we fail to accurately forecast consumer demand, we may experience excess inventory levels, which may result in inventory write-downs and the sale of excess inventory at discounted prices. This could have an adverse effect on the image and reputation of our brands and could adversely affect our gross margins. Conversely, if we underestimate consumer demand for our products, we may experience inventory shortages, which could delay shipments to customers, negatively impact retailer and consumer relationships and diminish brand loyalty. Moreover, our newer products may not produce as high a gross margin as our traditional products and thus may have an adverse effect on our overall margins and profitability.
The global apparel industry is subject to intense cost and pricing pressure.
The apparel industry is characterized by low barriers to entry for both suppliers and marketers, global sourcing through suppliers located throughout the world, trade liberalization, continuing movement of product sourcing to lower cost countries, regular promotional activity, and the ongoing emergence of new competitors with widely varying strategies and resources. These factors have contributed, and may continue to contribute in the future, to intense pricing pressure and uncertainty throughout the supply chain. Pricing pressure has been exacerbated by the variability of raw materials in recent years. This pressure could have adverse effects on our business and financial condition, including:
• | reduced gross margins across our product lines and distribution channels; |
• | increased retailer demands for allowances, incentives and other forms of economic support; and |
• | increased pressure on us to reduce our production costs and operating expenses. |
22
Increases in the price or availability of raw materials could increase our cost of goods and negatively impact our financial results.
The principal fabrics used in our products include cotton, blends, synthetics and wools. The prices we pay our suppliers for our products are dependent in part on the market price for raw materials used to produce them, primarily cotton. The price and availability of cotton may fluctuate substantially, depending on a variety of factors, including demand, acreage devoted to cotton crops and crop yields, weather, supply conditions, transportation costs, energy prices, work stoppages, government regulation and policy, economic climates, market speculation compliance with our working condition, environmental protection, and other standards, and other unpredictable factors. Any and all of these factors may be exacerbated by global climate change. Cotton prices suffered from unprecedented variability and uncertainty in prior years and may fluctuate significantly again in the future. In the event of a significant disruption or unavailability in the supply of the fabrics or raw materials used by our vendors in the manufacture of our products, our vendors might not be able to locate alternative suppliers of materials of comparable quality at an acceptable price. In addition, prices of purchased finished products also depend on wage rates in the regions where our contract manufacturers are located, as well as freight costs from those regions.Fluctuations in wage rates required by legal or industry standards could increase our costs. Increases in raw material costs or wage rates, unless sufficiently offset by our pricing actions, may cause a decrease in our profitability and negatively impact our sales volume. These factors may also have an adverse impact on our cash and working capital needs as well as those of our suppliers.
Our business is subject to risks associated with sourcing and manufacturing overseas, as well as risks associated with potential tariffs or a global trade war.
We import materials and finished garments into all of our operating regions. Our ability to import products in a timely and cost-effective manner may be affected by conditions at ports or issues that otherwise affect transportation and warehousing providers, such as port and shipping capacity, labor disputes and work stoppages, political unrest, security incidents, severe weather, or security requirements in the United States and other countries. These issues could delay importation of products or require us to locate alternative ports or warehousing providers to avoid disruption to our customers. These alternatives may not be available on short notice or could result in higher transportation costs, which could have an adverse impact on our business and financial condition, specifically our gross margin and overall profitability.
Substantially all of our import operations are subject to complex custom laws, regulations and tax requirements as well as trade regulations, such as tariffs set by governments through mutual agreements or bilateral actions. In addition, the countries in which our products are manufactured or imported may from time to time impose additional duties, tariffs or other restrictions on our imports or adversely modify existing restrictions. Adverse changes in these import costs and restrictions, or the failure by us or our suppliers to comply with customs regulations or similar laws, could harm our business. In this regard, the results of the November 2016 election in the United States and the Brexit vote in the United Kingdom have introduced greater uncertainty with respect to future tax and trade regulations. Changes in tax policy or trade regulations, the disallowance of tax deductions on imported merchandise, or the imposition of new tariffs on imported products, could have an adverse effect on our business and results of operations.
In 2018, the Trump Administration announced tariffs on steel and aluminum imported into the United States, which has resulted in reciprocal tariffs from the European Union on goods, including denim products, imported from the United States. Because we manufacture most of our products outside the United States, these reciprocal tariffs are not expected to have a material impact on our business. The Trump Administration has also imposed tariffs on goods imported from China in connection with China’s intellectual property practices and forced technology transfer. The Trump Administration has also negotiated a replacement trade deal for NAFTA with Mexico and Canada, the USMCA, which still needs to be ratified. Currently, of the products that we sell in the United States, approximately 8% are manufactured in Mexico and less than 8% are manufactured in China. If the Trump Administration follows through on its proposed China tariffs, or if additional tariffs or trade restrictions are implemented by the United States or other countries in connection with a global trade war, the cost of our products manufactured in China or other countries and imported into the United States or other countries could increase, which in turn could adversely affect the demand for these products and have an adverse effect on our business and results of operations.
Risks Relating to Ownership of Our Class A Common Stock
The market price of our Class A common stock may be volatile or may decline steeply or suddenly regardless of our operating performance and we may not be able to meet investor or analyst expectations. You may lose all or part of your investment.
The market price of our Class A common stock may fluctuate or decline significantly in response to numerous factors, many of which are beyond our control, including:
• | actual or anticipated fluctuations in our revenues or other operating results; |
• | variations between our actual operating results and the expectations of securities analysts, investors and the financial community; |
23
• | any forward-looking financial or operating information we may provide to the public or securities analysts, any changes in this information or our failure to meet expectations based on this information; |
• | actions of securities analysts who initiate or maintain coverage of us, changes in financial estimates by any securities analysts who follow our company or our failure to meet these estimates or the expectations of investors; |
• | whether investors or securities analysts view our stock structure unfavorably, particularly our dual-class structure; |
• | additional shares of Class A common stock being sold into the market by us or our existing stockholders, or the anticipation of such sales, including if existing stockholders sell shares into the market when applicable “lock-up” periods end; |
• | announcements by us or our competitors of significant products or features, innovations, acquisitions, strategic partnerships, joint ventures, capital commitments, divestitures or other dispositions; |
• | changes in operating performance and stock market valuations of companies in our industry, including our vendors and competitors; |
• | price and volume fluctuations in the overall stock market, including as a result of general economic trends; |
• | lawsuits threatened or filed against us, or events that negatively impact our reputation; |
• | developments in new legislation and pending lawsuits or regulatory actions, including interim or final rulings by judicial or regulatory bodies; and |
• | other events or factors, including those resulting from war or incidents of terrorism, or responses to these events. |
In addition, extreme price and volume fluctuations in the stock markets have affected and continue to affect many retail companies’ stock prices. Often, their stock prices have fluctuated in ways unrelated or disproportionate to the respective companies’ operating performance. In the past, stockholders have filed securities class action litigation following periods of market volatility. If we were to become involved in securities litigation, it could subject us to substantial costs, divert resources and the attention of management from our business and seriously harm our business.
Moreover, because of these fluctuations, comparing our operating results on a period-to-period basis may not be meaningful. You should not rely on our past results as an indication of our future performance. This variability and unpredictability could also result in our failing to meet the expectations of industry or financial analysts or investors for any period. If our revenues or operating results fall below the expectations of analysts or investors or below any forecasts we may provide to the market, or if the forecasts we provide to the market are below the expectations of analysts or investors, the price of our Class A common stock could decline substantially. Such a decline could occur even when we have met any previously publicly stated revenues or earnings forecasts that we may provide.
An active trading market for our Class A common stock may not be sustained.
Our Class A common stock is currently listed on the New York Stock Exchange ("NYSE") under the symbol "LEVI." However, we cannot assure you that an active trading market for our Class A common stock will be sustained. Accordingly, we cannot assure you of the likelihood that an active trading market for our Class A common stock will be maintained, the liquidity of any trading market, your ability to sell your shares of Class A common stock when desired or the prices that you may obtain for your shares.
Future sales of our Class A common stock by existing stockholders could cause our stock price to decline.
If our existing stockholders, including employees, who obtain equity, sell or indicate an intention to sell, substantial amounts of our Class A common stock in the public market, the trading price of our Class A common stock could decline. As of January 24, 2020 we had outstanding a total of 57,367,130 shares of Class A common stock and 336,748,994 shares of Class B common stock. Of these shares, only the shares of Class A common stock are currently freely tradable without restrictions or further registration under the Securities Act, except for any shares held by persons who are not our “affiliates” as defined in Rule 144 under the Securities Act and who have complied with the holding period requirements of Rule 144 under the Securities Act.
Sales of a substantial number of such shares, or the perception that such sales may occur, upon the expiration of the securities subject to the lock-up agreements, could cause our stock price to decline or make it more difficult for the holders of our Class A common stock to sell at a time and price that they deem appropriate.
Holders of more than 90% of our Class B common stock have contractual rights, subject to certain conditions, to require us to file registration statements for the public resale of the shares of Class A common stock issuable upon conversion of their Class B common stock, or to include such shares in registration statements that we may file.
24
The dual class structure of our common stock concentrates voting control with descendants of the family of Levi Strauss, who have the ability to control the outcome of matters submitted for stockholder approval, which will limit your ability to influence corporate matters and may depress the trading price of our Class A common stock.
Our Class B common stock, which is entitled to ten votes per share, is primarily owned by descendants of the family of our founder, Levi Strauss, and their relatives and trusts established for their behalf. Collectively, these persons have the ability to control the outcome of stockholder votes, including the election of our board of directors and the approval or rejection of a merger, change of control or other significant corporate transaction. In addition, so long as any shares of Class B common stock remain outstanding, the approval of the holders of a majority of our then-outstanding Class B common stock (or, in certain cases, a majority of our then-outstanding Class A common stock and Class B common stock, voting together as a single class) will be required in order for us to take certain actions.
This control may adversely affect the market price of our Class A common stock. In addition, certain index providers have announced restrictions on including companies with multiple-class share structures in certain of their indexes. S&P Dow Jones and FTSE Russell have recently announced changes to their eligibility criteria for inclusion of shares of public companies on certain indices, including the S&P 500. These changes exclude companies with multiple classes of shares of common stock from being added to such indices. In addition, several stockholder advisory firms have announced their opposition to the use of multiple class structures. As a result, the dual class structure of our common stock may prevent the inclusion of our Class A common stock in such indices and may cause stockholder advisory firms to publish negative commentary about our corporate governance practices or otherwise seek to cause us to change our capital structure. Any such exclusion from indices could result in a less active trading market for our Class A common stock. Any actions or publications by stockholder advisory firms critical of our corporate governance practices or capital structure could also adversely affect the value of our Class A common stock.
We believe having a long-term-focused, committed and engaged stockholder base provides us with an important strategic advantage, particularly in our business, where our more than 165-year history contributes to the iconic reputations of our brands. However, the interests of these stockholders may not always be aligned with each other or with the interests of our other stockholders. By exercising their control, these stockholders could cause our company to take actions that are at odds with the investment goals or interests of institutional, short-term or other non-controlling investors, or that have a negative effect on our stock price. Further, because these stockholders control the majority of our Class B common stock, we might be a less attractive takeover target, which could adversely affect the market price of our Class A common stock.
If securities or industry analysts either do not publish research about us or publish inaccurate or unfavorable research about us, our business or our market, or if they adversely change their recommendations regarding our Class A common stock, the trading price or trading volume of our Class A common stock could decline.
The trading market for our Class A common stock is influenced in part by the research and reports that securities or industry analysts may publish about us, our business, our market or our competitors. If one or more of the analysts initiate research with an unfavorable rating or downgrade our Class A common stock, provide a more favorable recommendation about our competitors or publish inaccurate or unfavorable research about our business, our Class A common stock price would likely decline. If any analyst who may cover us were to cease coverage of us or fail to regularly publish reports on us, we could lose visibility in the financial markets, which in turn could cause the trading price or trading volume of our Class A common stock to decline.
Future securities issuances could result in significant dilution to our stockholders and impair the market price of our Class A common stock.
Future issuances of our Class A common stock or the conversion of a substantial number of shares of our Class B common stock, or the perception that these issuances or conversions may occur, could depress the market price of our Class A common stock and result in dilution to existing holders of our Class A common stock. Also, to the extent stock-based awards are issued or become vested, there will be further dilution. The amount of dilution could be substantial depending upon the size of the issuances or exercises. Furthermore, we may issue additional equity securities that could have rights senior to those of our Class A common stock. As a result, purchasers of Class A common stock bear the risk that future issuances of debt or equity securities may reduce the value of such shares and further dilute their ownership interest.
As of November 24, 2019, there were 451,897 shares of Class A common stock and 24,806,706 shares of Class B common stock issuable pursuant to restricted stock units ("RSUs"), performance restricted stock units ("PRSUs") and stock appreciation rights ("SARs") that may be settled in shares of our Class A or Class B common stock. All of the shares of Class A common stock issuable upon exercise or settlement of such awards, or upon the conversion of shares of Class B common stock issuable upon exercise or settlement of such awards, are registered for public resale under the Securities Act. Accordingly, these shares will be able to be freely sold in the public market upon issuance as permitted by any applicable vesting requirements, and subject to compliance with applicable securities laws.
25
Holders of more than 90% of our Class B common stock have contractual rights, subject to certain conditions, to require us to file registration statements for the public resale of the shares of Class A common stock issuable upon conversion of their Class B common stock, or to include such shares in registration statements that we may file.
The requirements of being a public company may strain our resources, result in more litigation and divert management’s attention.
Although we have made filings with the SEC for many years, as a newly public company we are subject to the additional reporting requirements of the Exchange Act, the Sarbanes-Oxley Act of 2002, the Dodd-Frank Wall Street Reform and Consumer Protection Act, the listing requirements of the NYSE and other applicable securities rules and regulations. For example, we are required to file proxy statements under Section 14 of the Exchange Act. Complying with these rules and regulations has increased and will increase our legal and financial compliance costs, make some activities more difficult, time consuming or costly and increase demand on our systems and resources. As a result, management’s attention may be diverted from other business concerns, which could adversely affect our business and operating results. We may also need to hire additional employees or engage outside consultants to comply with these requirements, which will increase our costs and expenses.
In addition, changing laws, regulations and standards relating to corporate governance and public disclosure are creating uncertainty for public companies, increasing legal and financial compliance costs and making some activities more time consuming. These laws, regulations and standards are subject to varying interpretations, in many cases due to their lack of specificity, and, as a result, their application in practice may evolve over time as new guidance is provided by regulatory and governing bodies. This could result in continuing uncertainty regarding compliance matters and higher costs necessitated by ongoing revisions to disclosure and governance practices. We intend to invest resources to comply with evolving laws, regulations and standards, and this investment may result in increased general and administrative expenses and a diversion of management’s time and attention from revenue-generating activities to compliance activities. If our efforts to comply with new laws, regulations and standards differ from the activities intended by regulatory or governing bodies due to ambiguities related to their application and practice, regulatory authorities may initiate legal proceedings against us and our business may be adversely affected.
These new rules and regulations may make it more expensive for us to obtain director and officer liability insurance and, in the future, we may be required to accept reduced coverage or incur substantially higher costs to obtain coverage. These factors could also make it more difficult for us to attract and retain qualified members of our board of directors, particularly to serve on our audit committee and compensation committee, and qualified executive officers.
By disclosing information in the various filings required of a public company, our business and financial condition will become more visible, which may result in threatened or actual litigation, including by competitors and other third parties. If those claims are successful, our business could be seriously harmed. Even if the claims do not result in litigation or are resolved in our favor, the time and resources needed to resolve them could divert our management’s resources and seriously harm our business.
Delaware law and provisions in our amended and restated certificate of incorporation and amended and restated bylaws could make a merger, tender offer or proxy contest difficult, thereby depressing the trading price of our Class A common stock.
Our amended and restated certificate of incorporation and amended and restated bylaws contain provisions that could depress the trading price of our Class A common stock by acting to discourage, delay or prevent a change of control of our company or changes in our management that our stockholders may deem advantageous. In particular, our amended and restated certificate of incorporation and amended and restated bylaws:
• | establish a classified board of directors so that not all members are elected at one time; |
• | permit our board of directors to establish the number of directors and fill any vacancies and newly-created directorships; |
• | authorize the issuance of “blank check” preferred stock that our board of directors could use to implement a stockholder rights plan; |
• | provide that our board of directors is expressly authorized to make, alter or repeal our bylaws; |
• | restrict the forum for certain litigation against us to Delaware; |
• | reflect the dual class structure of our common stock; and |
• | establish advance notice requirements for nominations for election to our board of directors or for proposing matters that can be acted upon by stockholders. |
Any provision of our amended and restated certificate of incorporation, our amended and restated bylaws or Delaware law that has the effect of delaying or deterring a change in control could limit the opportunity for our stockholders to receive a premium for their shares of Class A common stock, and could also affect the price that some investors are willing to pay for our Class A common stock.
26
Our amended and restated certificate of incorporation provides that the Court of Chancery of the State of Delaware is the exclusive forum for substantially all disputes between us and our stockholders, which could limit our stockholders’ ability to obtain a favorable judicial forum for disputes with us or our directors, officers or employees.
Our amended and restated certificate of incorporation provides that the Court of Chancery of the State of Delaware is the exclusive forum for the following types of actions or proceedings under Delaware statutory or common law:
• | any derivative action or proceeding brought on our behalf; |
• | any action asserting a breach of fiduciary duty; |
• | any action asserting a claim against us arising under the Delaware General Corporation Law, our amended and restated certificate of incorporation or our amended and restated bylaws; and |
• | any action asserting a claim against us that is governed by the internal-affairs doctrine. |
This provision would not apply to suits brought to enforce a duty or liability created by the Exchange Act or any other claim for which the U.S. federal courts have exclusive jurisdiction.
This exclusive-forum provision may limit a stockholder’s ability to bring a claim in a judicial forum that it finds favorable for disputes with us or our directors, officers or employees, which may discourage lawsuits against us and our directors, officers and employees. If a court were to find this exclusive forum provision in our amended and restated certificate of incorporation to be inapplicable or unenforceable in an action, we may incur additional costs associated with resolving the dispute in other jurisdictions, which could seriously harm our business.
27
Item 1B. | UNRESOLVED STAFF COMMENTS |
Not applicable.
Item 2. | PROPERTIES |
We conduct manufacturing, distribution and administrative activities in owned and leased facilities. As of November 24, 2019, we operated two manufacturing-related facilities abroad and seven distribution centers around the world. We have renewal rights for most of our property leases. We anticipate that we will be able to extend these leases on terms satisfactory to us or, if necessary, locate substitute facilities on acceptable terms. We believe our facilities and equipment are in good condition and are suitable and adequate to meet our current requirements. Information about our key operating properties in use as of November 24, 2019 is summarized in the following table:
Location | Primary Use | Leased/Owned | ||||
Americas | ||||||
San Francisco, CA | Design and Product Development | Leased | ||||
Hebron, KY | Distribution | Owned | ||||
Canton, MS | Distribution | Owned | ||||
Henderson, NV | Distribution | Owned | ||||
Etobicoke, Canada | Distribution | Owned | ||||
Cuautitlan, Mexico | Distribution | Leased | ||||
Europe | ||||||
Plock, Poland | Manufacturing and Finishing | Leased(1) | ||||
Northhampton, U.K. | Distribution | Leased | ||||
Asia | ||||||
Adelaide, Australia | Distribution | Leased | ||||
Cape Town, South Africa | Manufacturing, Finishing and Distribution | Leased | ||||
______________
(1) | Building and improvements are owned but subject to a ground lease. |
Our global headquarters and the headquarters of our Americas region are both located in leased premises in San Francisco, California. Our Europe and Asia headquarters are located in leased premises in Diegem, Belgium and Singapore, respectively. In addition to the above, we operate finance shared service centers in Eugene, Oregon and Bangalore, India. We also operate two back-up data centers located in Carrollton and Westlake, Texas. As of November 24, 2019, we leased 80 administrative and sales offices in 46 countries, as well as leased 12 warehouses in seven countries.
In addition, as of November 24, 2019, we had 905 company-operated retail and outlet stores in leased premises in 32 countries: 282 stores in the Americas, 324 stores in Europe and 299 stores in Asia.
Item 3. | LEGAL PROCEEDINGS |
In the ordinary course of business, we have various pending cases involving contractual matters, facility and employee-related matters, distribution matters, product liability claims, customs and duty regulations, trademark infringement and other matters. We do not believe any of these pending legal proceedings will have a material impact on our financial condition, results of operations or cash flows.
Item 4. | MINE SAFETY DISCLOSURES |
Not applicable.
28
PART II
Item 5. | MARKET FOR REGISTRANT'S COMMON EQUITY, RELATED STOCKHOLDER MATTERS AND ISSUER PURCHASES OF EQUITY SECURITIES |
Market Information
Our Class A common stock is traded on the New York Stock Exchange (“NYSE”) under the symbol “LEVI” since March 21, 2019. Prior to that date, there was no public trading market for our stock. Our Class B common stock is neither listed nor publicly traded.
Holders of Record
As of January 24, 2020, there were 46 holders of record of our Class A common stock and 239 holders of record of our Class B common stock. The number of Class A beneficial stockholders is substantially greater than the number of holders of record because a large portion of our Class A common stock is held in “street name” by banks and brokerage firms.
Dividend Policy
We do not have an established annual dividend policy, but we aim to grow our annual cash dividends along with our earnings growth. We will continue to review our ability to pay cash dividends on an ongoing basis and dividends may be declared at the discretion of the Board depending upon, among other factors, our financial condition and compliance with the terms of our debt agreements. Our debt arrangements limit our ability to pay dividends. For more detailed information about these limitations, see Note 6 to our audited consolidated financial statements included in this report.
Securities Authorized for Issuance Under Equity Incentive Plans
See Item 12, “Security Ownership of Certain Beneficial Owners and Management and Related Stockholder Matters” for information regarding securities authorized for issuance.
Cumulative Stock Performance Graph
The following graph compares the cumulative total return to stockholders on our Class A common stock relative to the cumulative total returns of the S&P 500, and the S&P 500 Apparel, Accessories and Luxury Goods. An investment of $100 (with reinvestment of all dividends) is assumed to have been made in our Class A common stock and in each index on March 21, 2019, the date our Class A common stock began trading on the NYSE, and its relative performance is tracked through November 24, 2019. The comparisons are based on historical data and are not indicative of, nor intended to forecast, the future performance of our Class A common stock.
29
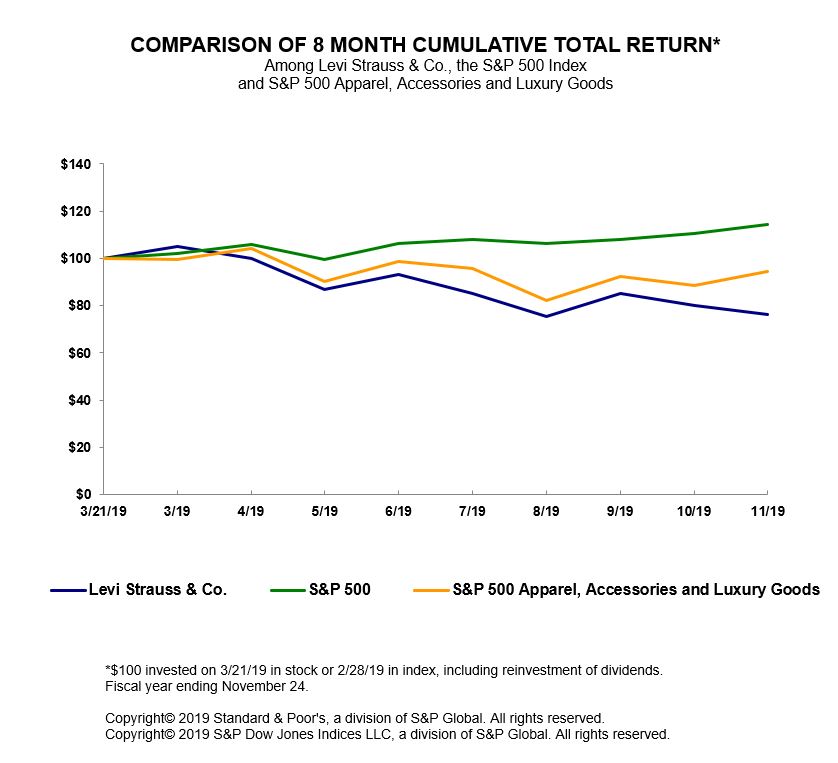
The following table assumes an investment of $100 (with reinvestment of all dividends) to have been made in our Class A common stock and in each index on March 21, 2019, the date our Class A common stock began trading on the NYSE, and indicates the cumulative total return to stockholders on our Class A common stock and the cumulative total return of each index at our fiscal year end of November 24, 2019:
(in dollars) | March 21, 2019 | November 24, 2019 | ||||||
Levi Strauss & Co. | $ | 100.00 | $ | 76.40 | ||||
S&P 500 | $ | 100.00 | $ | 114.49 | ||||
S&P 500 Apparel, Accessories and Luxury Goods | $ | 100.00 | $ | 94.24 | ||||
The information under “Cumulative Stock Performance Graph” is not deemed to be “soliciting material” or “filed” with the SEC or subject to Regulation 14A or 14C, or to the liabilities of Section 18 of the Exchange Act, and is not to be incorporated by reference in any filing of Levi Strauss & Co. under the Securities Act or the Exchange Act, whether made before or after the date of this Annual Report and irrespective of any general incorporation language in those filings.
Use of Proceeds from Initial Public Offering of Class A Common Stock
On March 25, 2019, we closed our initial public offering of Class A common stock (our “IPO”), in which we sold 14,960,557 shares of our Class A common stock at a price to the public of $17.00 per share, including shares sold in connection with the exercise of the underwriters’ option to purchase additional shares and excluding shares of common stock sold in our IPO by certain of our existing stockholders. The offer and sale of all of the shares in our IPO were registered under the Securities Act
30
pursuant to a registration statement on Form S-1 (File No. 333-229630), which was declared effective by the SEC on March 20, 2019.
We received net proceeds from our IPO of $234.6 million after deducting underwriting discounts and commissions of $13.6 million and other direct and incremental offering expenses of $6.1 million. No payments were made to our directors or officers or their associates, holders of 10% or more of any class of our equity securities or any affiliates.
There has been no material change in the planned use of our net IPO proceeds as described in the prospectus contained in such registration statement.
31
Item 6. | SELECTED FINANCIAL DATA |
The following table sets forth our selected historical consolidated financial data which are derived from our audited consolidated financial statements for fiscal years 2019, 2018, 2017, 2016 and 2015. The financial data set forth below should be read in conjunction with, and are qualified by reference to, "Item 7 – Management's Discussion and Analysis of Financial Condition and Results of Operations," our audited consolidated financial statements for fiscal years 2019, 2018 and 2017 and the related notes to those audited consolidated financial statements, included elsewhere in this report.
Year Ended November 24, 2019 | Year Ended November 25, 2018 | Year Ended November 26, 2017 | Year Ended November 27, 2016 | Year Ended November 29, 2015 | |||||||||||||||
(Dollars in thousands, except per share amounts) | |||||||||||||||||||
Statements of Income Data: | |||||||||||||||||||
Net revenues | $ | 5,763,087 | $ | 5,575,440 | $ | 4,904,030 | $ | 4,552,739 | $ | 4,494,493 | |||||||||
Cost of goods sold | 2,661,714 | 2,577,465 | 2,341,301 | 2,223,727 | 2,225,512 | ||||||||||||||
Gross profit | 3,101,373 | 2,997,975 | 2,562,729 | 2,329,012 | 2,268,981 | ||||||||||||||
Selling, general and administrative expenses(1)(2) | 2,534,698 | 2,457,564 | 2,082,662 | 1,853,489 | 1,800,277 | ||||||||||||||
Restructuring, net | — | — | — | 312 | 14,071 | ||||||||||||||
Operating income | 566,675 | 540,411 | 480,067 | 475,211 | 454,633 | ||||||||||||||
Interest expense | (66,248 | ) | (55,296 | ) | (68,603 | ) | (73,170 | ) | (81,214 | ) | |||||||||
Underwriter commission paid on behalf of selling stockholders | (24,860 | ) | — | — | — | — | |||||||||||||
Loss on early extinguishment of debt | — | — | (22,793 | ) | — | (14,002 | ) | ||||||||||||
Other income (expense), net(2) | 2,017 | 14,907 | (39,890 | ) | 5,219 | (49,019 | ) | ||||||||||||
Income before taxes | 477,584 | 500,022 | 348,781 | 407,260 | 310,398 | ||||||||||||||
Income tax expense | 82,604 | 214,778 | 64,225 | 116,051 | 100,507 | ||||||||||||||
Net income | 394,980 | 285,244 | 284,556 | 291,209 | 209,891 | ||||||||||||||
Net (income) loss attributable to noncontrolling interest | (368 | ) | (2,102 | ) | (3,153 | ) | (157 | ) | (455 | ) | |||||||||
Net income attributable to Levi Strauss & Co. | $ | 394,612 | $ | 283,142 | $ | 281,403 | $ | 291,052 | $ | 209,436 | |||||||||
Earnings per common share attributable to common stockholders: | |||||||||||||||||||
Basic | $ | 1.01 | $ | 0.75 | $ | 0.75 | $ | 0.78 | $ | 0.56 | |||||||||
Diluted | $ | 0.97 | $ | 0.73 | $ | 0.73 | $ | 0.76 | $ | 0.55 | |||||||||
Weighted-average common shares outstanding: | |||||||||||||||||||
Basic | 389,082,277 | 377,139,847 | 376,177,350 | 375,141,560 | 374,831,820 | ||||||||||||||
Diluted | 408,365,902 | 388,607,361 | 384,338,330 | 382,852,950 | 384,122,020 | ||||||||||||||
Statements of Cash Flow Data: | |||||||||||||||||||
Net cash flow provided by (used for): | |||||||||||||||||||
Operating activities | $ | 412,188 | $ | 420,371 | $ | 525,941 | $ | 306,550 | $ | 218,332 | |||||||||
Investing activities | (243,343 | ) | (179,387 | ) | (124,391 | ) | (68,348 | ) | (80,833 | ) | |||||||||
Financing activities | 55,018 | (148,224 | ) | (151,733 | ) | (173,549 | ) | (94,895 | ) | ||||||||||
Balance Sheet Data: | |||||||||||||||||||
Cash and cash equivalents | $ | 934,237 | $ | 713,120 | $ | 633,622 | $ | 375,563 | $ | 318,571 | |||||||||
Working capital(3)(4) | 1,702,982 | 1,235,860 | 1,118,157 | 942,019 | 681,982 | ||||||||||||||
Total assets(3) | 4,232,418 | 3,542,660 | 3,357,838 | 2,995,470 | 2,884,395 | ||||||||||||||
Total debt, excluding capital leases | 1,014,366 | 1,052,154 | 1,077,311 | 1,045,178 | 1,152,541 | ||||||||||||||
Temporary equity | — | 299,140 | 127,035 | 79,346 | 68,783 | ||||||||||||||
Total Levi Strauss & Co. stockholders' equity | 1,563,531 | 660,113 | 696,910 | 509,555 | 330,268 | ||||||||||||||
Other Financial Data: | |||||||||||||||||||
Depreciation and amortization | $ | 123,942 | $ | 120,205 | $ | 117,387 | $ | 103,878 | $ | 102,044 | |||||||||
Capital expenditures | 175,356 | 159,413 | 118,618 | 102,950 | 102,308 | ||||||||||||||
Cash dividends paid | 113,914 | 90,000 | 70,000 | 60,000 | 50,000 | ||||||||||||||
______________
(1) | Fiscal year 2017 includes an out-of-period adjustment which increased selling, general and administrative expenses by $8.3 million and decreased net income by $5.1 million. This item, which originated in prior years, relates to the correction of the periods used for the recognition of stock-based compensation expense associated with employees eligible to vest in awards after retirement. We have evaluated the effects of this out-of-period adjustment, both qualitatively and quantitatively, and concluded that the correction of this amount was not material to the current period or the periods in which they originated, including quarterly reporting. |
(2) | The amounts in Selling, general and administrative expenses, and Other income (expense), net in fiscal years prior to 2019 have been conformed to reflect the adoption of ASU 2017-07, "Compensation-Retirement Benefits (Topic 715) Improving the Presentation of Net Periodic Cost and Net Periodic Postretirement Benefit Cost" and include non-service cost component of net periodic benefit costs. Refer to Note 1 for more information. |
(3) | Certain insignificant amounts on the balance sheets from fiscal 2017 and 2016 have been conformed to the November 25, 2018 and November 24, 2019 presentation. |
(4) | Increase in working capital in fiscal year 2019 is partially attributable to our IPO in March 2019, as net proceeds of $234.6 million were received, and as a result of cash-settled stock-based compensation being replaced with stock-settled awards, $45.8 million of related liabilities were reclassified from accrued salaries, wages and employee benefits to additional paid in capital. Refer to Note 1 for additional information. |
32
Item 7. | MANAGEMENT’S DISCUSSION AND ANALYSIS OF FINANCIAL CONDITION AND RESULTS OF OPERATIONS |
You should read the following discussion and analysis of our financial condition and results of operations together with our consolidated financial statements and related notes thereto included in Part II, Item 8 of this Annual Report on Form 10-K, or Annual Report. Some of the information contained in this discussion and analysis or set forth elsewhere in this Annual Report, including information with respect to our plans and strategy for our business, includes forward-looking statements that involve risks and uncertainties. See “Special Note Regarding Forward-Looking Statements” and “Risk Factors” for a discussion of forward-looking statements and important factors that could cause actual results to differ materially from the results described in or implied by the forward-looking statements. We use a 52- or 53-week fiscal year, with each fiscal year ending on the Sunday that is closest to November 30 of that year. See “—Financial Information Presentation—Fiscal Year.”
Non-GAAP Financial Measures
To supplement our consolidated financial statements prepared and presented in accordance with generally accepted accounting principles in the Unites States ("GAAP"), we use certain non-GAAP financial measures throughout this Annual Report, as described further below, to provide investors with additional useful information about our financial performance, to enhance the overall understanding of our past performance and future prospects and to allow for greater transparency with respect to important metrics used by our management for financial and operational decision-making. We are presenting these non-GAAP financial measures to assist investors in seeing our financial performance from management’s view and because we believe they provide an additional tool for investors to use in comparing our core financial performance over multiple periods with other companies in our industry.
However, non-GAAP financial measures have limitations in their usefulness to investors because they have no standardized meaning prescribed by GAAP and are not prepared under any comprehensive set of accounting rules or principles. In addition, non-GAAP financial measures may be calculated differently from, and therefore may not be directly comparable to, similarly titled measures used by other companies. As a result, non-GAAP financial measures should be viewed as supplementing, and not as an alternative or substitute for, our consolidated financial statements prepared and presented in accordance with GAAP.
Overview
We are an iconic American company with a rich history of profitable growth, quality, innovation and corporate citizenship. Our story began in San Francisco, California, in 1853 as a wholesale dry goods business. We invented the blue jean 20 years later. Today we design, market and sell products that include jeans, casual and dress pants, tops, shorts, skirts, jackets, footwear and related accessories for men, women and children around the world under our Levi’s, Dockers, Signature by Levi Strauss & Co. and Denizen brands.
Our business is operated through three geographic regions: Americas, Europe and Asia (which includes the Middle East and Africa). We service our consumers through our global infrastructure, developing, sourcing and marketing our products around the world.
Our iconic, enduring brands are brought to life every day around the world by our talented and creative employees and partners. The Levi’s brand epitomizes classic, authentic American style and effortless cool. We have cultivated Levi’s as a lifestyle brand that is inclusive and democratic in the eyes of consumers while offering products that feel exclusive, personalized and original. This approach has enabled the Levi’s brand to evolve with the times and continually reach a new, younger audience, while our rich heritage continues to drive relevance and appeal across demographics. The Dockers brand helped drive "Casual Friday" in the 1990s and has been a cornerstone of casual menswear for more than 30 years. The Signature by Levi Strauss & Co. and Denizen brands, which we developed for value-conscious consumers, offer quality craftsmanship and great fit and style at affordable prices.
We recognize wholesale revenue from sales of our products through third-party retailers such as department stores, specialty retailers, leading third-party e-commerce sites and franchise locations dedicated to our brands. We also sell our products directly to consumers (direct-to-consumer "DTC") through a variety of formats, including our own company-operated mainline and outlet stores, company-operated e-commerce sites and select shop-in-shops that we operate within department stores and other third-party retail locations. As of November 24, 2019, our products were sold in over 50,000 retail locations in more than 110 countries, including approximately 3,000 brand-dedicated stores and shop-in-shops. As of November 24, 2019, we had 905 company-operated stores located in 32 countries and approximately 500 company-operated shop-in-shops. The remainder of our brand-dedicated stores and shop-in-shops were operated by franchisees and other partners.
Our Europe and Asia businesses, collectively, contributed 47% of our net revenues and 45% of our regional operating income in 2019, as compared to 45% of our net revenues and 41% of our regional operating income in 2018. Sales of Levi’s® brand
33
products represented approximately 87% of our total net sales in 2019, as compared to 86% in 2018. Pants represented 65% of our total units sold in 2019, as compared to 68% of our total units sold in 2018, and men's products generated 67% of our total net sales in 2019 as compared to 69% in 2018.
Our wholesale channel generated 64% and 65% of our net revenues in fiscal years 2019 and 2018, respectively. Our DTC channel generated 36% and 35% of our net revenues in fiscal years 2019 and 2018, respectively, with our company operated e-commerce representing 14% and 13% of DTC channel net revenues and 5% and 4% of total net revenues in fiscal years 2019 and 2018, respectively.
Our Objectives
Our key long-term objectives are to strengthen our brands globally in order to deliver sustainable profitable growth and generate industry leading shareholder returns. Critical strategies to achieve these objectives include; driving our profitable core business, expanding the reach of our brands globally and into new categories, leading in omni-channel, and achieving operational excellence.
Factors Affecting Our Business
We believe the key business and marketplace factors that are impacting our business include the following:
• | Factors that impact consumer discretionary spending, which remains volatile globally, continue to create a complex and challenging retail environment for us and our customers, characterized by unpredictable traffic patterns and a general promotional environment. In developed economies, mixed real wage growth and shifting in consumer spending also continue to pressure global discretionary spending. Consumers continue to focus on value pricing and convenience with the off-price retail channel remaining strong and increased expectations for real-time delivery. |
• | The diversification of our business model across regions, channels, brands and categories affects our gross margin. For example, if our sales in higher gross margin business regions, channels, brands and categories grow at a faster rate than in our lower gross margin business regions, channels, brands and categories, we would expect a favorable impact to aggregate gross margin over time. Gross margin in Europe is generally higher than in our other two regional operating segments. Sales directly to consumers generally have higher gross margins than sales through third parties, although these sales typically have higher selling expenses. Value brands, which are focused on the value-conscious consumer, generally generate lower gross margin. Enhancements to our existing product offerings, or our expansion into new products categories, may also impact our future gross margin. |
• | More competitors are seeking growth globally, thereby increasing competition across regions. Some of these competitors are entering markets where we already have a mature business such as the United States, Mexico, Western Europe and Japan, and may provide consumers discretionary purchase alternatives or lower-priced apparel offerings. |
• | Wholesaler/retailer dynamics and wholesale channels remain challenged by mixed growth prospects due to increased competition from e-commerce shopping, pricing transparency enabled by the proliferation of online technologies and vertically-integrated specialty stores. Retailers, including our top customers, have in the past and may in the future decide to consolidate, undergo restructurings or rationalize their stores which could result in a reduction in the number of stores that carry our products. |
• | Many apparel companies that have traditionally relied on wholesale distribution channels have invested in expanding their own retail store and e-commerce distribution and consumer-facing technologies, which has increased competition in the retail market. |
• | Competition for, and price volatility of, resources throughout the supply chain have increased, causing us and other apparel manufacturers to continue to seek alternative sourcing channels and create new efficiencies in our global supply chain. Trends affecting the supply chain include the proliferation of lower-cost sourcing alternatives, resulting in reduced barriers to entry for new competitors, and the impact of fluctuating prices of labor and raw materials as well as the consolidation of suppliers. Trends such as these can bring additional pressure on us and other wholesalers and retailers to shorten lead-times, reduce costs and raise product prices. |
• | Foreign currencies continue to be volatile. Significant fluctuations of the U.S. Dollar against various foreign currencies, including the Euro, British Pound and Mexican Peso will impact our financial results, affecting translation, and revenue, operating margins and net income. |
• | The current environment has introduced greater uncertainty with respect to potential tax and trade regulations. The current domestic and international political environment, including changes to other U.S. policies related to global trade and tariffs, have resulted in uncertainty surrounding the future state of the global economy. Such changes may require us to modify our current sourcing practices, which may impact our product costs and, if not mitigated, could |
34
have a material adverse effect on our business and results of operations. In addition, the United States enacted tax legislation in fiscal year 2018, which is intended to stimulate economic growth and capital investments in the United States by, among other provisions, lowering tax rates for both corporations and individuals. For more information, see Note 18 of our audited consolidated financial statements included in this report.
These factors contribute to a global market environment of intense competition, constant product innovation and continuing cost pressure, and combine with the continuing global economic conditions to create a challenging commercial and economic environment. We evaluate these factors as we develop and execute our strategies. For more information on the risk factors affecting our business, see "Item 1A - Risk Factors".
Seasonality of Sales
We typically achieve our largest quarterly revenues in the fourth quarter. In fiscal year 2019, our net revenues in the first, second, third and fourth quarters represented 25%, 23%, 25% and 27%, respectively, of our total net revenues for the year. In fiscal year 2018, our net revenues in the first, second, third and fourth quarters represented 24%, 22%, 25% and 29%, respectively, of our total net revenues for the year.
We typically achieve a significant amount of revenues from our DTC channel on the Friday following Thanksgiving Day, which is commonly referred to as Black Friday. Due to the timing of our fiscal year-end, a particular fiscal year might include one, two or no Black Fridays, which could impact our net revenues for the fiscal year. Each of fiscal years 2018 and 2017 included one Black Friday, fiscal year 2019 did not have a Black Friday, while fiscal year 2020 will have two Black Fridays.
The level of our working capital reflects the seasonality of our business. We expect inventory, accounts payable and accrued expenses to be higher in the second and third quarters in preparation for the fourth quarter selling season. Order backlog is not material to our business.
Effects of Inflation
We believe inflation in the regions where most of our sales occur has not had a significant effect on our net revenues or profitability.
Our 2019 Results
• | Net revenues. Compared to 2018, consolidated net revenues increased 3.4% on a reported basis and 5.8% on a constant-currency basis driven by growth across all three regions. |
• | Operating income. Compared to 2018, consolidated operating income increased 4.8% and operating margin increased to 9.8% from 9.7%, primarily reflecting higher net revenues and lower selling, general and administrative ("SG&A") expenses as a percent of net revenues as higher selling expenses incurred to support DTC growth were more than offset by lower administration expenses. |
• | Net income. Compared to 2018, consolidated net income increased to $395.0 million from $285.3 million due to higher operating income in the current year and a $143.4 million charge in the prior year from the transitional impact from the 2017 Tax Act, partially offset with a $24.9 million underwriter commission paid by us on behalf of selling stockholders in connection with our IPO. |
• | Adjusted EBIT. Compared to 2018, adjusted EBIT of $610.6 million increased 4% on a reported basis and 8% on a constant-currency basis as a result of higher net revenues. Adjusted EBIT margin was 10.6%, flat compared to prior year on a reported basis, and 20 basis points higher than the prior year on a constant-currency basis. The lack of Black Friday sales in 2019 adversely impacted the adjusted EBIT margin comparison by approximately 25 basis points. |
• | Adjusted net income. Compared to 2018, adjusted net income increased 9% due to higher operating income in the current year, and a $47.8 million charge in the prior year from a one-time U.S. transition tax on undistributed foreign earnings and foreign and state tax costs associated with future remittances of undistributed earnings from foreign subsidiaries, both resulting from the 2017 Tax Act. |
• | Earnings per share. Compared to 2018, diluted earnings per share increased from $0.73 to $0.97 due to higher net income, partially offset by an increase in shares outstanding as a result of our IPO. |
• | Adjusted diluted earnings per share. Compared to 2018, adjusted diluted earnings per share increased from $1.08 to $1.12 on a reported basis and increased from $1.03 to $1.12 on a constant-currency basis as a result of higher adjusted net income, partially offset by increased shares outstanding as a result of our IPO. |
35
Financial Information Presentation
Fiscal year. We use a 52- or 53-week fiscal year, with each fiscal year ending on the Sunday that is closest to November 30 of that year. Certain of our foreign subsidiaries have fiscal years ending November 30. Each fiscal year generally consists of four 13-week quarters, with each quarter ending on the Sunday that is closest to the last day of the last month of that quarter. Fiscal years 2019, 2018 and 2017 were 52-week years ending on November 24, 2019, November 25, 2018 and November 26, 2017, respectively. Fiscal 2020 will be a 53-week year. Each quarter of fiscal years 2019, 2018 and 2017 consisted of 13 weeks. The fourth quarter of 2020 will consist of 14 weeks.
Segments. We manage our business according to three operating segments: Americas, Europe and Asia.
Classification. Our classification of certain significant revenues and expenses reflects the following:
• | Net revenues comprise net sales and licensing revenues. Net sales include sales of products to wholesale customers, including franchised stores, and direct sales to consumers at our company-operated stores and shop-in-shops located within department stores and other third party locations, as well as company-operated e-commerce sites. Net revenues include discounts, allowances for estimated returns and incentives. Licensing revenues, which include revenues from the use of our trademarks in connection with the manufacturing, advertising and distribution of trademarked products by third-party licensees, are earned and recognized as products are sold by licensees based on royalty rates as set forth in the applicable licensing agreements. |
• | Cost of goods sold primarily comprises product costs, labor and related overhead, sourcing costs, inbound freight, internal transfers and the cost of operating our remaining manufacturing facilities, including the related depreciation expense. On both a reported and constant-currency basis, cost of goods sold reflects the transactional currency impact resulting from the purchase of products in a currency other than the functional currency. |
• | Selling expenses include, among other things, all occupancy costs and depreciation associated with our company-operated stores and commissions associated with our company-operated shop-in-shops, as well as costs associated with our e-commerce operations. |
• | We reflect substantially all distribution costs in selling, general and administrative expenses, including costs related to receiving and inspection at distribution centers, warehousing, shipping to our customers, handling, and certain other activities associated with our distribution network. |
• | SG&A and Other Income (Expense), net in the period ended November 25, 2018 and November 26, 2017 have been conformed to reflect the adoption of ASU 2017-07, "Compensation-Retirement Benefits (Topic 715) Improving the Presentation of Net Periodic Cost and Net Periodic Postretirement Benefit Cost". Refer to Note 1 for more information. |
36
Results of Operations
2019 compared to 2018
The following table summarizes, for the periods indicated, our consolidated statements of income, the changes in these items from period to period and these items expressed as a percentage of net revenues:
Year Ended | ||||||||||||||||
November 24, 2019 | November 25, 2018 | % Increase (Decrease) | November 24, 2019 | November 25, 2018 | ||||||||||||
% of Net Revenues | % of Net Revenues | |||||||||||||||
(Dollars in millions, except per share amounts) | ||||||||||||||||
Net revenues | $ | 5,763.1 | $ | 5,575.4 | 3.4 | % | 100.0 | % | 100.0 | % | ||||||
Cost of goods sold | 2,661.7 | 2,577.4 | 3.3 | % | 46.2 | % | 46.2 | % | ||||||||
Gross profit | 3,101.4 | 2,998.0 | 3.4 | % | 53.8 | % | 53.8 | % | ||||||||
Selling, general and administrative expenses | 2,534.7 | 2,457.5 | 3.1 | % | 44.0 | % | 44.1 | % | ||||||||
Operating income | 566.7 | 540.5 | 4.8 | % | 9.8 | % | 9.7 | % | ||||||||
Interest expense | (66.2 | ) | (55.3 | ) | 19.7 | % | (1.1 | )% | (1.0 | )% | ||||||
Underwriter commission paid on behalf of selling stockholders | (24.9 | ) | — | * | (0.4 | )% | — | % | ||||||||
Other income, net | 2.0 | 14.9 | (86.6 | )% | — | % | 0.3 | % | ||||||||
Income before income taxes | 477.6 | 500.1 | (4.5 | )% | 8.3 | % | 9.0 | % | ||||||||
Income tax expense | 82.6 | 214.8 | (61.5 | )% | 1.4 | % | 3.9 | % | ||||||||
Net income | 395.0 | 285.3 | 38.5 | % | 6.9 | % | 5.1 | % | ||||||||
Net income attributable to noncontrolling interest | (0.4 | ) | (2.1 | ) | (81.0 | )% | — | % | — | % | ||||||
Net income attributable to Levi Strauss & Co. | $ | 394.6 | $ | 283.2 | 39.3 | % | 6.8 | % | 5.1 | % | ||||||
Earnings per common share attributable to common stockholders: | ||||||||||||||||
Basic | $ | 1.01 | $ | 0.75 | 34.7 | % | * | * | ||||||||
Diluted | $ | 0.97 | $ | 0.73 | 32.9 | % | * | * | ||||||||
Weighted-average common shares outstanding: | ||||||||||||||||
Basic | 389.1 | 377.1 | 3.2 | % | * | * | ||||||||||
Diluted | 408.4 | 388.6 | 5.1 | % | * | * | ||||||||||
_____________
* Not meaningful
37
Net revenues
The following table presents net revenues by regional operating segment for the periods indicated and the changes in net revenues by operating segment on both reported and constant-currency bases from period to period:
Year Ended | |||||||||||||
% Increase | |||||||||||||
November 24, 2019 | November 25, 2018 | As Reported | Constant Currency | ||||||||||
(Dollars in millions) | |||||||||||||
Net revenues: | |||||||||||||
Americas | $ | 3,057.0 | $ | 3,042.7 | 0.5 | % | 0.8 | % | |||||
Europe | 1,768.1 | 1,646.2 | 7.4 | % | 13.3 | % | |||||||
Asia | 938.0 | 886.5 | 5.8 | % | 9.5 | % | |||||||
Total net revenues | $ | 5,763.1 | $ | 5,575.4 | 3.4 | % | 5.8 | % | |||||
As compared to the same period in the prior year, total net revenues were affected unfavorably by approximately $126 million in foreign currency exchange rates.
Americas. On both a reported basis and constant-currency basis, net revenues in our Americas region increased slightly for 2019. Currency translation had an unfavorable impact on net revenues of approximately $10 million for the year.
Constant-currency net revenues increased as a result of higher DTC revenues, in the U.S. and international markets, specifically Mexico, despite lacking Black Friday sales due to the timing of our 2019 fiscal year-end. The increase in sales was due to the expansion of our company-operated retail network, as we had 14 more stores in operation as of November 24, 2019 as compared to November 25, 2018 and increased traffic to our e-commerce business. Total wholesale revenues were down, driven from a decline in U.S. wholesale revenues, as a result of the softening in the overall wholesale environment, including the impact of financially troubled retailers and increased door closures since a year ago. The decline was also due to the 2018 relaunch of our Docker's Signature Khaki, as we stocked our customers' floors with the new product, driving increased sales in the prior year.
Europe. Net revenues in Europe increased on both reported and constant-currency bases, with currency translation affecting net revenues unfavorably by approximately $86 million.
Constant-currency net revenues increased for 2019 as a result of strong performance across both DTC and wholesale channels. The growth in DTC is mainly driven from strong performance within our company-operated retail network, particularly outlets, as well as expansion, as we had 24 more stores in operation as of November 24, 2019 as compared to November 25, 2018, despite lacking Black Friday sales due to the timing of our 2019 fiscal year-end. The growth in our wholesale channel is broad based, across all markets and product categories.
Asia. Net revenues in Asia increased on both reported and constant-currency bases, with currency translation affecting net revenues unfavorably by approximately $30 million.
On a constant-currency basis, the increase in net revenues was due to growth across both wholesale and DTC channels. The growth in wholesale, which includes franchised stores was across multiple markets, in particular India. The growth in DTC was primarily due to store expansion, as there were 43 more stores as of November 24, 2019 as compared to November 25, 2018 as well as growth within our e-commerce business.
38
Gross profit
The following table shows consolidated gross profit and gross margin for the periods indicated and the changes in these items from period to period:
Year Ended | ||||||||||
November 24, 2019 | November 25, 2018 | % Increase | ||||||||
(Dollars in millions) | ||||||||||
Net revenues | $ | 5,763.1 | $ | 5,575.4 | 3.4 | % | ||||
Cost of goods sold | 2,661.7 | 2,577.4 | 3.3 | % | ||||||
Gross profit | $ | 3,101.4 | $ | 2,998.0 | 3.4 | % | ||||
Gross margin | 53.8 | % | 53.8 | % | ||||||
Currency translation unfavorably impacted gross profit by approximately $72 million. Excluding the impact of currency translation, gross margin increased slightly due to sales in higher gross margin businesses offset primarily by transactional currency impact.
Selling, general and administrative expenses
The following table shows SG&A expenses for the periods indicated, the changes in these items from period to period and these items expressed as a percentage of net revenues:
Year Ended | ||||||||||||||||
November 24, 2019 | November 25, 2018 | % Increase (Decrease) | November 24, 2019 | November 25, 2018 | ||||||||||||
% of Net Revenues | % of Net Revenues | |||||||||||||||
(Dollars in millions) | ||||||||||||||||
Selling | $ | 1,116.8 | $ | 1,043.0 | 7.1 | % | 19.4 | % | 18.7 | % | ||||||
Advertising and promotion | 399.3 | 400.3 | (0.2 | )% | 6.9 | % | 7.2 | % | ||||||||
Administration | 426.0 | 484.5 | (12.1 | )% | 7.4 | % | 8.7 | % | ||||||||
Other | 592.6 | 529.7 | 11.9 | % | 10.3 | % | 9.5 | % | ||||||||
Total SG&A expenses | $ | 2,534.7 | $ | 2,457.5 | 3.1 | % | 44.0 | % | 44.1 | % | ||||||
Currency translation affected SG&A expenses favorably by approximately $50 million as compared to the prior year.
Selling. Currency translation impacted selling expenses favorably by approximately $29 million for the year ended November 24, 2019. Higher selling expenses primarily reflected costs associated with the expansion and performance of our DTC business, including increased investment in new and existing company-operated stores. We had 81 more company-operated stores as of November 24, 2019 than as of November 25, 2018.
Advertising and promotion. Currency translation impacted advertising and promotion expense favorably by approximately $8 million for the year ended November 24, 2019. Advertising and promotion expenses as a percent of net revenues decreased due to planned reductions in advertising spend.
Administration. Administration expenses include functional administrative and organization costs. Currency translation impacted administration expenses favorably by approximately $6 million for the fiscal year 2019. Administration expenses decreased due to lower annual incentive compensation costs as well as lower stock-based compensation costs, which reflect the cancel of cash-settled awards and concurrent replacement with similar equity-settled awards in relation to the IPO, as well as lower overall stock price volatility for 2019.
Other. Other SG&A expenses include distribution, information resources, and marketing organization costs. Currency translation impacted other SG&A expenses favorably by approximately $7 million for the fiscal year 2019. The increase in other SG&A costs was primarily due to an increase in information technology expenses, which reflect critical investments towards expanding our omni-channel capabilities as well as initial investments towards a new enterprise resource planning system. Distribution costs also increased to support increased volume, mainly within Europe and Asia.
39
Operating income
The following table shows operating income by regional operating segment and corporate expenses for the periods indicated, the changes in these items from period to period and these items expressed as a percentage of corresponding region net revenues:
Year Ended | ||||||||||||||||||
November 24, 2019 | November 25, 2018 | % (Decrease) Increase | November 24, 2019 | November 25, 2018 | ||||||||||||||
% of Net Revenues | % of Net Revenues | |||||||||||||||||
(Dollars in millions) | ||||||||||||||||||
Operating income: | ||||||||||||||||||
Americas | $ | 545.1 | $ | 551.4 | (1.1 | )% | 17.8 | % | 18.1 | % | ||||||||
Europe | 353.1 | 292.9 | 20.6 | % | 20.0 | % | 17.8 | % | ||||||||||
Asia | 85.8 | 86.6 | (0.9 | )% | 9.1 | % | 9.8 | % | ||||||||||
Total regional operating income | 984.0 | 930.9 | 5.7 | % | 17.1 | % | * | 16.7 | % | * | ||||||||
Corporate expenses | 417.3 | 390.4 | 6.9 | % | 7.2 | % | * | 7.0 | % | * | ||||||||
Total operating income | $ | 566.7 | $ | 540.5 | 4.8 | % | 9.8 | % | * | 9.7 | % | * | ||||||
Operating margin | 9.8 | % | 9.7 | % | ||||||||||||||
______________
* Percentage of consolidated net revenues
Currency translation affected total operating income unfavorably by approximately $22 million as compared to the prior year.
Regional operating income.
• | Americas. Currency translation did not have a significant impact on operating income in the region for fiscal year 2019. The decrease in operating income was primarily due to an increase in net revenues and gross margin offset by higher SG&A selling expense, mainly to support growth across our DTC channel. |
• | Europe. Currency translation unfavorably affected operating income in the region by approximately $17 million as compared to the prior year. Excluding the effects of currency, the increase in operating income was due to higher net revenues across all channels and increased gross margin, partially offset by higher SG&A selling, distribution, and advertising and promotion costs to support revenue growth. |
• | Asia. Currency translation unfavorably affected operating income in the region by approximately $5 million in the region for fiscal year 2019. Excluding the effects of currency, the increase in operating income for 2019 was due to higher net revenues across all channels, offset by higher SG&A selling expense to support growth across our retail channel. |
Corporate. Corporate expenses represent costs that management does not attribute to any of our regional operating segments.
Included in corporate expenses are other corporate staff costs and costs associated with our global inventory sourcing organization, which are reported as a component of consolidated gross margin. The increase in corporate expenses for 2019 was primarily due to an increase in foreign currency transaction losses related to our global sourcing organizations procurement of inventory on behalf of our foreign subsidiaries.
Interest expense
Interest expense was $66.2 million for the year ended November 24, 2019, as compared to $55.3 million in the prior year. The increase in interest expense was primarily related to higher interest on deferred compensation as a result of changes in market conditions, and higher interest incurred on lease financing obligations for build to suit locations.
Our weighted-average interest rate on average borrowings outstanding for 2019 was 5.31%, as compared to 5.01% for 2018.
40
Other income (expense), net
Other income (expense), net, primarily consists of foreign exchange management activities and transactions. For the year ended November 24, 2019 and November 25, 2018, we recorded net other income of $2.0 million and $14.9 million, respectively. The income in 2019 primarily reflected investment interest generated from money market funds and short-term investments, partially offset by net periodic pension cost and net losses on our foreign currency denominated balances. The income in 2018 primarily reflected net gains on our foreign exchange derivatives and investment interest generated from money market funds, partially offset by net losses on our foreign currency denominated balances.
Underwriter commission paid on behalf of selling stockholders
For the year ended November 24, 2019, we recorded an expense of $24.9 million for underwriting discounts and commissions paid by us on behalf of the selling stockholders in connection with our IPO.
Income tax expense
On December 22, 2017, the U.S. enacted the Tax Act, which significantly changed U.S. tax law. The Tax Act lowered our U.S. statutory federal income tax rate from 35% to 21% effective on November 26, 2018. Beginning the first quarter of 2019, our effective tax rate reflected a provision to tax Global Intangible Low-Taxed Income ("GILTI") of foreign subsidiaries and a tax benefit for Foreign Derived Intangible Income ("FDII"). In accordance with U.S. GAAP, we made an accounting policy election to account for GILTI in the period in which it is incurred.
Income tax expense was $82.6 million for the year ended November 24, 2019, compared to $214.8 million for the prior year. Our effective income tax rate was 17.3% for the year ended November 24, 2019, compared to 43.0% for the prior year. The decrease in the effective tax rate in 2019 as compared to 2018 was primarily driven by a $143.4 million one-time tax charge in 2018 related to the enactment of the Tax Act. This charge was comprised of $95.6 million re-measurement of deferred tax assets and liabilities and $37.5 million one-time U.S. transition tax on undistributed foreign earnings and $10.3 million charge related to foreign and state tax costs associated with the future remittance of undistributed earnings of foreign subsidiaries.
We historically provided for U.S. income taxes on the undistributed earnings of foreign subsidiaries unless they were considered indefinitely reinvested outside the United States. We have reevaluated this historic indefinite reinvestment assertion as a result of the enactment of the Tax Act and determined that any historical undistributed earnings through November 25, 2018 of foreign subsidiaries are no longer considered to be indefinitely reinvested as well as most of the additional undistributed earnings generated through November 2019. The deferred tax liability related to foreign and state tax costs associated with the future remittance of these undistributed earnings of foreign subsidiaries was $9.7 million. For the year ended November 24, 2019, management asserted indefinite reinvestment on a small portion of foreign earnings generated in fiscal year 2019. If such earnings were to repatriate back to the U.S., the related foreign withholding and state tax costs could be approximately $1 million.
41
2018 compared to 2017
The following table summarizes, for the periods indicated, our consolidated statements of income, the changes in these items from period to period and these items expressed as a percentage of net revenues:
Year Ended | ||||||||||||||||
November 25, 2018 | November 26, 2017 | % Increase (Decrease) | November 25, 2018 | November 26, 2017 | ||||||||||||
% of Net Revenues | % of Net Revenues | |||||||||||||||
(Dollars in millions, except per share amounts) | ||||||||||||||||
Net revenues | $ | 5,575.4 | $ | 4,904.0 | 13.7 | % | 100.0 | % | 100.0 | % | ||||||
Cost of goods sold | 2,577.4 | 2,341.3 | 10.1 | % | 46.2 | % | 47.7 | % | ||||||||
Gross profit | 2,998.0 | 2,562.7 | 17.0 | % | 53.8 | % | 52.3 | % | ||||||||
Selling, general and administrative expenses(1) | 2,457.5 | 2,082.6 | 18.0 | % | 44.1 | % | 42.5 | % | ||||||||
Operating income | 540.5 | 480.1 | 12.6 | % | 9.7 | % | 9.8 | % | ||||||||
Interest expense | (55.3 | ) | (68.6 | ) | (19.4 | )% | (1.0 | )% | (1.4 | )% | ||||||
Loss on early extinguishment of debt | — | (22.8 | ) | * | — | % | (0.5 | )% | ||||||||
Other income (expense), net(1) | 14.9 | (39.9 | ) | (137.3 | )% | 0.3 | % | (0.8 | )% | |||||||
Income before income taxes | 500.1 | 348.8 | 43.4 | % | 9.0 | % | 7.1 | % | ||||||||
Income tax expense | 214.8 | 64.2 | * | 3.9 | % | 1.3 | % | |||||||||
Net income | 285.3 | 284.6 | 0.2 | % | 5.1 | % | 5.8 | % | ||||||||
Net income attributable to noncontrolling interest | (2.1 | ) | (3.2 | ) | (34.4 | )% | — | % | (0.1 | )% | ||||||
Net income attributable to Levi Strauss & Co. | $ | 283.2 | $ | 281.4 | 0.6 | % | 5.1 | % | 5.7 | % | ||||||
Earnings per common share attributable to common stockholders: | ||||||||||||||||
Basic | $ | 0.75 | $ | 0.75 | — | % | * | * | ||||||||
Diluted | $ | 0.73 | $ | 0.73 | — | % | * | * | ||||||||
Weighted-average common shares outstanding: | ||||||||||||||||
Basic | 377.1 | 376.2 | 0.2 | % | * | * | ||||||||||
Diluted | 388.6 | 384.3 | 1.1 | % | * | * | ||||||||||
_____________
* Not meaningful
(1) | The amounts in SG&A and Other income (expense), net have been conformed to reflect the adoption of ASU 2017-07, "Compensation-Retirement Benefits (Topic 715) Improving the Presentation of Net Periodic Cost and Net Periodic Postretirement Benefit Cost" and include non-service cost component of net periodic benefit costs. Refer to Note 1 for more information. |
42
Net revenues
The following table presents net revenues by regional operating segment for the periods indicated and the changes in net revenues by operating segment on both reported and constant-currency bases from period to period:
Year Ended | |||||||||||||
% Increase | |||||||||||||
November 25, 2018 | November 26, 2017 | As Reported | Constant Currency | ||||||||||
(Dollars in millions) | |||||||||||||
Net revenues: | |||||||||||||
Americas | $ | 3,042.7 | $ | 2,774.0 | 9.7 | % | 10.0 | % | |||||
Europe | 1,646.2 | 1,312.3 | 25.4 | % | 20.8 | % | |||||||
Asia | 886.5 | 817.7 | 8.4 | % | 8.2 | % | |||||||
Total net revenues | $ | 5,575.4 | $ | 4,904.0 | 13.7 | % | 12.7 | % | |||||
As compared to the same period in the prior year, total net revenues were affected favorably by changes in foreign currency exchange rates.
Americas. On both a reported basis and constant-currency basis, net revenues in our Americas region increased for 2018. Currency translation had an unfavorable impact on net revenues of approximately $7 million for the year.
Constant-currency net revenues increased as a result of broad-based growth in the region. Wholesale revenues grew in the region, largely due to the continued growth in performance and expansion of Signature® products and Levi's® women's products as well as growth in Mexico. DTC revenues grew due to strong performance of our company-operated retail outlet and e-commerce businesses driven by increased traffic and conversion, as well as 21 more company-operated retail stores in operation as of November 25, 2018 as compared to November 26, 2017.
Europe. Net revenues in Europe increased on both reported and constant-currency bases, with currency translation affecting net revenues favorably by approximately $50 million.
Constant-currency net revenues increased for 2018 as a result of strong performance in all channels mostly due to traditional wholesale and company-operated retail. The widespread growth in all channels reflects the strength of the brand and expanded product assortment across the customer base, mainly in Levi's® men's and women's products. Additionally, there were 17 more company-operated retail stores in operation as of November 25, 2018 as compared to November 26, 2017.
Asia. Net revenues in Asia increased on both reported and constant-currency bases, with currency translation having a minimal impact on net revenues.
On a constant-currency basis, the increase in net revenues was primarily due to the expansion and strong performance of our company-operated retail network, which included 36 more stores as of November 25, 2018 as compared to November 26, 2017. Wholesale revenues in 2018 increased, particularly in India, Japan, Australia and New Zealand.
43
Gross profit
The following table shows consolidated gross profit and gross margin for the periods indicated and the changes in these items from period to period:
Year Ended | ||||||||||
November 25, 2018 | November 26, 2017 | % Increase | ||||||||
(Dollars in millions) | ||||||||||
Net revenues | $ | 5,575.4 | $ | 4,904.0 | 13.7 | % | ||||
Cost of goods sold | 2,577.4 | 2,341.3 | 10.1 | % | ||||||
Gross profit | $ | 2,998.0 | $ | 2,562.7 | 17.0 | % | ||||
Gross margin | 53.8 | % | 52.3 | % | ||||||
Currency translation favorably impacted gross profit by approximately $32 million. Gross margin increased primarily due to increased DTC sales.
Selling, general and administrative expenses
The following table shows our SG&A expenses for the periods indicated, the changes in these items from period to period and these items expressed as a percentage of net revenues:
Year Ended | ||||||||||||||||
November 25, 2018 | November 26, 2017 | % Increase | November 25, 2018 | November 26, 2017 | ||||||||||||
% of Net Revenues | % of Net Revenues | |||||||||||||||
(Dollars in millions) | ||||||||||||||||
Selling | $ | 1,043.0 | $ | 888.2 | 17.4 | % | 18.7 | % | 18.1 | % | ||||||
Advertising and promotion | 400.3 | 323.3 | 23.8 | % | 7.2 | % | 6.6 | % | ||||||||
Administration | 484.5 | 398.1 | 21.7 | % | 8.7 | % | 8.1 | % | ||||||||
Other | 529.7 | 473.0 | 12.0 | % | 9.5 | % | 9.7 | % | ||||||||
Total SG&A expenses | $ | 2,457.5 | $ | 2,082.6 | 18.0 | % | 44.1 | % | 42.5 | % | ||||||
Currency translation affected SG&A expenses unfavorably by approximately $19 million as compared to the prior year.
Selling. Currency translation impacted selling expenses unfavorably by approximately $11.0 million for the year ended November 25, 2018. Higher selling expenses primarily reflected costs associated with the expansion and performance of our DTC business, including increased investment in new and existing company-operated stores. We had 74 more company-operated stores as of November 25, 2018 than as of November 26, 2017.
Advertising and promotion. Currency translation impacted advertising and promotion expense unfavorably by approximately $2.0 million for the year ended November 25, 2018. Advertising and promotion expenses increased due to planned incremental investments in advertising.
Administration. Administration expenses include functional administrative and organization costs. Currency translation impacted administration expenses unfavorably by approximately $3.0 million for the fiscal year 2018. As compared to the same prior-year period, administration expenses in 2018 reflect higher stock-based and incentive compensation which increased $57.9 million, reflecting outperformance against our internally-set objectives. Our stock-based compensation expense related to cash-settled awards increased to $71.4 million for fiscal year 2018 from $31.3 million for the same prior-year period, mostly as a result of an increase in fair value of our common stock during the period. This increase was partially offset by an $8.3 million adjustment in 2017, which was for the correction of the periods used for the recognition of expense associated with employees eligible to vest in awards after retirement in the prior years.
Other. Other SG&A expense include distribution, information resources, and marketing organization costs. Currency translation impacted other SG&A expenses unfavorably by approximately $3.0 million for the fiscal year 2018. The increase in SG&A other costs was primarily due to an increase in distribution costs as a result of higher volume.
44
Operating income
The following table shows operating income by regional operating segment and corporate expenses for the periods indicated, the changes in these items from period to period and these items expressed as a percentage of corresponding region net revenues:
Year Ended | ||||||||||||||||||
November 25, 2018 | November 26, 2017 | % Increase | November 25, 2018 | November 26, 2017 | ||||||||||||||
% of Net Revenues | % of Net Revenues | |||||||||||||||||
(Dollars in millions) | ||||||||||||||||||
Operating income: | ||||||||||||||||||
Americas | $ | 551.4 | $ | 529.3 | 4.2 | % | 18.1 | % | 19.1 | % | ||||||||
Europe | 292.9 | 198.7 | 47.4 | % | 17.8 | % | 15.1 | % | ||||||||||
Asia | 86.6 | 78.3 | 10.6 | % | 9.8 | % | 9.6 | % | ||||||||||
Total regional operating income | 930.9 | 806.3 | 15.5 | % | 16.7 | % | * | 16.4 | % | * | ||||||||
Corporate expenses | 390.4 | 326.2 | 19.7 | % | 7.0 | % | * | 6.7 | % | * | ||||||||
Total operating income | $ | 540.5 | $ | 480.1 | 12.6 | % | 9.7 | % | * | 9.8 | % | * | ||||||
Operating margin | 9.7 | % | 9.8 | % | ||||||||||||||
______________
* Percentage of consolidated net revenues
Currency translation affected total operating income favorably by approximately $13 million as compared to the prior year.
Regional operating income.
• | Americas. Currency translation did not have a significant impact on operating income in the region for fiscal year 2018. The increase in operating income was primarily due to higher net revenues and gross margin partially offset by higher SG&A selling expense due to store growth and an increased investment in advertising. |
• | Europe. Currency translation favorably affected operating income by approximately $14 million as compared to the prior year. The increase in operating income was due to higher net revenues across all channels, partially offset by higher SG&A selling expense to support growth and higher advertising and promotion expense. |
• | Asia. Currency translation did not have a significant impact on operating income in the region for fiscal year 2018. The increase in operating income for 2018 was due to higher net revenues and gross margins, partially offset by higher SG&A selling expense related to retail expansion. |
Corporate. Corporate expenses represent costs that management does not attribute to any of our regional operating segments. Included in corporate expenses are restructuring and restructuring-related charges, other corporate staff costs, and costs associated with our global inventory sourcing organization. Currency translation did not have a significant impact on corporate expenses. The increase in corporate expenses for 2018 was primarily due to an increase in administration expenses of $57.9 million relating to stock-based and incentive compensation reflecting outperformance against our internally-set objectives. This increase was partially offset by an $8.3 million adjustment in 2017, which was for the correction of the periods used for the recognition of expense associated with employees eligible to vest in awards after retirement in the prior years.
Interest expense
Interest expense was $55.3 million for the year ended November 25, 2018, as compared to $68.6 million in the prior year. The decrease in interest expense was primarily due to lower average borrowing rates in 2018 resulting from our debt refinancing activities during the second quarter of 2017, and the reduction in deferred compensation interest due to changes to market conditions.
Our weighted-average interest rate on average borrowings outstanding for 2018 was 5.01%, as compared to 5.60% for 2017.
45
Loss on early extinguishment of debt
For the year ended November 26, 2017, we recorded a $22.8 million loss on early extinguishment of debt as a result of our debt refinancing activities during the year. The loss included $21.9 million of tender and call premiums on the retirement of the debt.
Other income (expense), net
Other income (expense), net, primarily consists of foreign exchange management activities and transactions. For the year ended November 25, 2018, we recorded net other income of $14.9 million as compared to net other expense of $39.9 million for the prior year. The income in 2018 primarily reflected net gains on our foreign exchange derivatives and investment interest generated from money market funds, partially offset by net losses on our foreign currency denominated balances. The expense in 2017 primarily reflected net losses on foreign exchange derivatives, partially offset by net gains on our foreign currency denominated balances.
Income tax expense
Income tax expense was $214.8 million for the year ended November 25, 2018, compared to $64.2 million for the prior year. Our effective income tax rate was 43.0% for the year ended November 25, 2018, compared to 18.4% for the prior year.
The increase in the effective tax rate in 2018 as compared to 2017 was primarily driven by one-time tax charge related to the impact of the Tax Cuts and Jobs Act (the "Tax Act") described below and proportionately less tax benefit from the lower tax cost of foreign operations, partially offset by the lower U.S. federal statutory tax rate.
For the year ended November 25, 2018, management reevaluated its historic assertion of indefinite reinvestment of $264 million of undistributed foreign earnings. These earnings, as well as other foreign earnings, were subject to the U.S. one-time mandatory transition tax and are eligible to be repatriated to the United States without additional U.S. federal tax under the Tax Act. As a result of this reevaluation, we have determined that any historical undistributed earnings through November 25, 2018 are no longer considered to be indefinitely reinvested and accordingly recognized a $10.3 million deferred tax expense associated with the future remittance of these undistributed earnings of foreign subsidiaries.
The Tax Act was enacted in the United States on December 22, 2017 and includes, among other items, a reduction in the federal corporate income tax rate from 35% to 21% and a deemed repatriation of foreign earnings. The enactment of the Tax Act resulted in a charge of $143.4 million to tax expense for the year ended November 25, 2018. This charge was comprised of a $95.6 million re-measurement of our deferred tax assets and liabilities based on the lower rates at which they are expected to reverse in the future, a $37.5 million one-time U.S. transition tax on undistributed foreign earnings and a $10.3 million charge related to foreign and state tax costs associated with the future remittance of undistributed earnings of foreign subsidiaries.
The Tax Act also includes provisions not yet effective for our company, including a provision to tax global intangible low-taxed income (GILTI) of foreign subsidiaries, which were effective for our company beginning on November 26, 2018. In accordance with U.S. GAAP, we have made an accounting policy election to treat taxes due under the GILTI provision as a current period expense.
46
Liquidity and Capital Resources
Liquidity outlook
We believe we will have adequate liquidity over the next 12 months to operate our business and to meet our cash requirements. Our capital allocation priorities are (1) to invest in opportunities and initiatives to grow our business organically, (2) to return capital to our stockholders in the form of cash dividends, which we expect to be in the range of $130 million in 2020, as well as stock repurchases to offset dilution that would otherwise be introduced from stock-based incentive compensation grants, and (3) to pursue acquisitions that support our current strategies. Future determinations regarding the declaration and payment of dividends, if any, will be at the discretion of our board of directors and will depend on then-existing conditions, including our results of operations, payout ratio, capital requirements, financial condition, prospects, contractual arrangements, any limitations on payment of dividends present in our current and future debt agreements and other factors that our board of directors may deem relevant.
Cash sources
We have historically relied primarily on cash flows from operations, borrowings under credit facilities, issuances of notes and other forms of debt financing. We regularly explore financing and debt reduction alternatives, including new credit agreements, unsecured and secured note issuances, equity financing, equipment and real estate financing, securitizations and asset sales.
We are party to a second amended and restated credit agreement that provides for a senior secured revolving credit facility. The facility is an asset-based facility, in which the borrowing availability is primarily based on the value of our U.S. Levi’s® trademarks and the levels of accounts receivable and inventory in the United States and Canada. The maximum availability under the facility is $850 million, of which $800 million is available to us for revolving loans in U.S. Dollars and $50 million is available to us for revolving loans either in U.S. Dollars or Canadian Dollars.
In March 2019, we completed our IPO, in which we issued and sold 14,960,557 shares of Class A common stock at a public offering price of $17.00 per share. We received net proceeds of $234.6 million after deducting underwriting discounts and commissions of $13.6 million and other direct and incremental offering expenses of $6.1 million. We agreed to pay all underwriting discounts and commissions applicable to the sales of shares of Class A common stock by the selling stockholders. This amount, $24.9 million, was paid at completion of the IPO in March 2019 and was recorded as non-operating expense in the second quarter of 2019. Additionally, we incurred $3.5 million of other costs associated with the IPO that were recorded in SG&A.
As of November 24, 2019, we did not have any borrowings under the credit facility, unused availability under the facility was $819.5 million, and our total availability of $850.0 million, based on collateral levels as defined by the agreement, was reduced by $30.5 million of other credit-related instruments.
As of November 24, 2019, we had cash and cash equivalents totaling approximately $934.2 million and short-term investments of $80.7 million resulting in a total liquidity position (unused availability and cash and cash equivalents and short-term investments) of approximately $1.8 billion.
Cash uses
Our principal cash requirements include working capital, capital expenditures, payments of principal and interest on our debt, payments of taxes, contributions to our pension plans and payments for postretirement health benefit plans, settlement of shares issued under our 2016 Equity Incentive Plan, as amended to date ("EIP") and, if market conditions warrant, occasional investments in, or acquisitions of, business ventures in our line of business. In addition, we regularly evaluate our ability to pay dividends or repurchase stock, all consistent with the terms of our debt agreements. Upon completion of our IPO in March 2019, our 2016 Plan was replaced with our 2019 Equity Incentive Plan ("2019 Plan"). Under the 2016 Plan, holders of shares could require us to repurchase such shares at the then-current market value pursuant to a contractual put right. Under the 2019 Plan and as a result of the IPO, this contractual put right was terminated. However, upon vesting or exercise of an award, we will continue to net settle shares in order to pay withholding taxes on behalf of our employees.
In December 2019, the Company completed an acquisition for all operating assets related to Levi’s® and Dockers® brands from The Jeans Company ("TJC"), LS&Co's distributor in Chile, Peru and Bolivia, for $52 million, plus transaction costs. This includes 78 Levi’s® and Dockers® retail stores, distribution with the region’s leading multi-brand retailers, and the logistical operations in these markets.
In January 2020, the Board declared a cash dividend of $0.08 per share to holders of record of its Class A and Class B common stock at the close of business on February 12, 2020. Total dividends are expected to be in the range of $130 million for fiscal year 2020 and to be paid out quarterly.
47
The following table provides information about our significant cash contractual obligations and commitments as of November 24, 2019:
Payments due or projected by fiscal period | |||||||||||||||||||||||||||
Total | 2020 | 2021 | 2022 | 2023 | 2024 | Thereafter | |||||||||||||||||||||
(Dollars in millions) | |||||||||||||||||||||||||||
Contractual and Long-term Liabilities: | |||||||||||||||||||||||||||
Short-term and long-term debt obligations | $ | 1,025 | $ | 8 | $ | — | $ | — | $ | — | $ | — | $ | 1,017 | |||||||||||||
Interest(1) | 273 | 46 | 45 | 45 | 43 | 43 | 51 | ||||||||||||||||||||
Future minimum payments(2) | 1,147 | 234 | 203 | 175 | 140 | 111 | 284 | ||||||||||||||||||||
Purchase obligations(3) | 863 | 636 | 41 | 27 | 18 | 16 | 125 | ||||||||||||||||||||
Postretirement obligations(4) | 67 | 9 | 9 | 8 | 8 | 7 | 26 | ||||||||||||||||||||
Pension obligations(5) | 194 | 44 | 25 | 15 | 15 | 15 | 80 | ||||||||||||||||||||
Long-term employee related benefits(6) | 96 | 11 | 4 | 3 | 4 | 3 | 71 | ||||||||||||||||||||
Total | $ | 3,665 | $ | 988 | $ | 327 | $ | 273 | $ | 228 | $ | 195 | $ | 1,654 | |||||||||||||
______________
(1) | Interest obligations are computed using constant interest rates until maturity. |
(2) | Amounts reflect contractual obligations relating to our existing leased facilities as of November 24, 2019, and therefore do not reflect our planned future openings of company-operated retail stores. For more information, see "Item 2 – Properties." |
(3) | Amounts reflect estimated commitments of $568 million for inventory purchases, $174 million for sponsorship, naming rights and related benefits with respect to the Levi's® Stadium, and $121 million for human resources, advertising, information technology and other professional services. |
(4) | The amounts presented in the table represent an estimate for the next ten years of our projected payments, based on information provided by our plans' actuaries, and have not been reduced by estimated Medicare subsidy receipts, the amounts of which are not material. Our policy is to fund postretirement benefits as claims and premiums are paid. For more information, see Note 8 to our audited consolidated financial statements included in this report. |
(5) | The amounts presented in the table represent an estimate of our projected contributions to the plans for the next ten years based on information provided by our plans' actuaries. For U.S. qualified plans, these estimates can exceed the projected annual minimum required contributions in an effort to level out potential future funding requirements and provide annual funding flexibility. The 2020 contribution amounts will be recalculated at the end of the plans' fiscal years, which for our U.S. pension plan is at the beginning of our third fiscal quarter. Accordingly, actual contributions may differ materially from those presented here, based on factors such as changes in discount rates and the valuation of pension assets. For more information, see Note 8 to our audited consolidated financial statements included in this report. |
(6) | Long-term employee-related benefits primarily relate to the current and non-current portion of deferred compensation arrangements and workers' compensation. We estimated these payments based on prior experience and forecasted activity for these items. For more information, see Note 12 to our audited consolidated financial statements included in this report. |
The above table does not include amounts related to our uncertain tax positions of $36.6 million. We do not anticipate a material effect on our liquidity as a result of payments in future periods of liabilities for uncertain tax positions. The table also does not include amounts related to potential cash settlement of stock appreciation rights ("SARs") put to the Company under the terms of our EIP. Based on the fair value of the Company's stock and the number of shares outstanding as of November 24, 2019, future payments under the terms of the EIP could range up to approximately $120 million, which could become payable in 2020. These payments are contingent on the Company's liquidity and the Board's discretion.
Information in the above table reflects our estimates of future cash payments. These estimates and projections are based upon assumptions that are inherently subject to significant economic, competitive, legislative and other uncertainties and contingencies, many of which are beyond our control. Accordingly, our actual expenditures and liabilities may be materially higher or lower than the estimates and projections reflected in the above table. The inclusion of these projections and estimates should not be regarded as a representation by us that the estimates will prove to be correct.
48
Cash flows
The following table summarizes, for the periods indicated, selected items in our consolidated statements of cash flows:
Year Ended | |||||||||||
November 24, 2019 | November 25, 2018 | November 26, 2017 | |||||||||
(Dollars in millions) | |||||||||||
Cash provided by operating activities | $ | 412.2 | $ | 420.4 | $ | 525.9 | |||||
Cash used for investing activities | (243.3 | ) | (179.4 | ) | (124.4 | ) | |||||
Cash provided by (used for) financing activities | 55.0 | (148.6 | ) | (151.8 | ) | ||||||
Cash and cash equivalents as of fiscal year end | 934.2 | 713.1 | 633.6 | ||||||||
2019 as compared to 2018
Cash flows from operating activities
Cash provided by operating activities was $412.2 million for 2019, as compared to $420.4 million for 2018. The decrease primarily reflects higher payments for SG&A expenses and inventory to support our growth, higher payments for employee stock-based incentive compensation, and a payment made for underwriting commissions on behalf of selling stockholders in connection with our IPO in March 2019, partially offset by an increase in cash received from customers as well as less contributions to our pension plans.
Cash flows from investing activities
Cash used for investing activities was $243.3 million for 2019, as compared to $179.4 million for 2018. The increase in cash used for investing activities is due to an increase in payments for capital expenditures and higher net payments to acquire short-term investments, partially offset by proceeds from settlement of forward foreign exchange contracts during 2019.
Cash flows from financing activities
Cash provided by financing activities was $55.0 million for 2019, as compared to cash used of $148.6 million for 2018. Cash provided in 2019 primarily reflects proceeds from our IPO of $254.3 million, partially offset by the payments of $113.9 million for cash dividends, $44.0 million for equity award exercises, $23.3 million for net repayments of short-term credit facility and borrowings, and payments of $19.7 million for underwriting commissions and other direct and incremental offering costs. Cash used in 2018 primarily reflects the payment of $90.0 million for cash dividends and $56.0 million for equity award exercises.
2018 as compared to 2017
Cash flows from operating activities
Cash provided by operating activities was $420.4 million for 2018, as compared to $525.9 million for 2017. The decrease primarily reflects additional contributions to our pension plans, higher payments for inventory and SG&A expenses to support our growth, as well as higher payments for income taxes, partially offset by an increase in cash received from customers.
Cash flows from investing activities
Cash used for investing activities was $179.4 million for 2018, as compared to $124.4 million for 2017. The increase in cash used for investing activities primarily reflects increased payments for capital expenditures.
Cash flows from financing activities
Cash used for financing activities was $148.6 million for 2018, as compared to $151.8 million for 2017. Cash used in 2018 primarily reflects the payments of $90.0 million for cash dividends and $56.0 million for equity award exercises. Cash used in 2017 primarily reflects the payment of a $70.0 million cash dividend as well as our refinancing activities and debt reduction, including debt extinguishment costs and debt issuance costs. Cash used in 2017 also reflects payments made for equity award exercises.
Indebtedness
The borrower of substantially all of our debt is Levi Strauss & Co., the parent and U.S. operating company. Of our total debt of $1.0 billion as of November 24, 2019, 100% was fixed-rate debt, net of capitalized debt issuance costs, and no variable-rate debt. As of November 24, 2019, our required aggregate debt principal payments on our unsecured long-term debt were $1.0 billion
49
in years after 2024. Short-term borrowings of $7.6 million at various foreign subsidiaries were expected to be either paid over the next 12 months or refinanced at the end of their applicable terms.
Our long-term debt agreements contain customary covenants restricting our activities as well as those of our subsidiaries. We were in compliance with all of these covenants as of November 24, 2019.
Non-GAAP Financial Measures
Adjusted SG&A, Adjusted EBIT, Adjusted EBIT Margin, Adjusted EBITDA, Adjusted Net Income, Adjusted Net Income Margin, Adjusted Diluted Earnings per Share
We define adjusted SG&A, a non-GAAP financial measure, as SG&A excluding costs associated with the IPO, changes in fair value on cash-settled stock-based compensation, and restructuring and related charges, severance and other, net. We define Adjusted EBIT, a non-GAAP financial measure, as net income excluding income tax expense, interest expense, other (income) expense, net, underwriter commission paid on behalf of selling stockholders, loss on early extinguishment of debt, costs associated with the IPO, impact of changes in fair value on cash-settled stock-based compensation, and restructuring and related charges, severance and other, net. We define Adjusted EBIT margin as Adjusted EBIT as a percentage of net revenues. We define Adjusted EBITDA as Adjusted EBIT excluding depreciation and amortization expense. We define adjusted net income, a non-GAAP financial measure, as net income excluding impact of underwriter commission paid on behalf of selling stockholders, loss on early extinguishment of debt, costs associated with the IPO, impact of changes in fair value on cash-settled stock-based compensation, restructuring and related charges, severance and other, net, and re-measurement of our deferred tax assets and liabilities based on the lower rates as a result of the Tax Act, adjusted to give effect to the income tax impact of such adjustments. To calculate the income tax impact of such adjustments on a year-to-date basis, we utilize an effective tax rate equal to our income tax expense divided by our income before income taxes, each as reflected in our statement of operations for the relevant period, except that during the year ended 2018 we excluded from income tax expense the effect of the $95.6 million re-measurement described above. We define adjusted net income margin as adjusted net income as a percentage of net revenues. We define adjusted diluted earnings per share as adjusted net income per weighted-average number of diluted common shares outstanding. We believe Adjusted SG&A, Adjusted EBIT, Adjusted EBIT margin, Adjusted EBITDA, adjusted net income, adjusted net income margin and adjusted diluted earnings per share are useful to investors because they help identify underlying trends in our business that could otherwise be masked by certain expenses that we include in calculating net income but that can vary from company to company depending on its financing, capital structure and the method by which its assets were acquired, and can also vary significantly from period to period. Our management also uses Adjusted EBIT in conjunction with other GAAP financial measures for planning purposes, including as a measure of our core operating results and the effectiveness of our business strategy, and in evaluating our financial performance.
Adjusted SG&A, Adjusted EBIT, Adjusted EBIT margin, Adjusted EBITDA, adjusted net income, adjusted net income margin and adjusted diluted earnings per share have limitations as analytical tools and should not be considered in isolation or as a substitute for an analysis of our results prepared and presented in accordance with GAAP. Some of these limitations include:
• | Adjusted EBIT, Adjusted EBIT margin and Adjusted EBITDA do not reflect income tax payments that reduce cash available to us; |
• | Adjusted EBIT, Adjusted EBIT margin and Adjusted EBITDA do not reflect interest expense, or the cash requirements necessary to service interest or principal payments on our indebtedness, which reduces cash available to us; |
• | Adjusted EBIT, Adjusted EBIT margin and Adjusted EBITDA exclude other (income) expense net, which has primarily consisted of realized and unrealized gains and losses on our forward foreign exchange contracts and transaction gains and losses on our foreign exchange balances, although these items affect the amount and timing of cash available to us when these gains and losses are realized; |
• | all of these non-GAAP financial measures exclude underwriter commission paid on behalf of selling stockholders in connection with our IPO that reduces cash available to us; |
• | all of these non-GAAP financial measures exclude other costs associated with our IPO; |
• | all of these non-GAAP financial measures exclude the expense resulting from the impact of changes in fair value on our cash-settled stock-based compensation awards, even though, prior to March 2019, such awards were required to be settled in cash; |
• | all of these non-GAAP financial measures exclude certain other SG&A items, which include severance, transaction and deal related costs, including acquisition and integration costs which can affect our current and future cash requirements; |
50
• | the expenses and other items that we exclude in our calculations of all of these non-GAAP financial measures may differ from the expenses and other items, if any, that other companies may exclude from all of these non-GAAP financial measures or similarly titled measures; |
• | Adjusted EBITDA excludes the recurring, non-cash expenses of depreciation of property and equipment and, although these are non-cash expenses, the assets being depreciated may need to be replaced in the future; and |
• | Adjusted net income, adjusted net income margin and adjusted diluted earnings per share do not include all of the effects of income taxes and changes in income taxes reflected in net income. |
Because of these limitations, all of these non-GAAP financial measures should be considered along with net income and other operating and financial performance measures prepared and presented in accordance with GAAP. The following table presents a reconciliation of SG&A, the most directly comparable financial measure calculated in accordance with GAAP, to Adjusted SG&A for each of the periods presented.
Adjusted SG&A:
Year Ended | |||||||||||
November 24, 2019 | November 25, 2018 | November 26, 2017 | |||||||||
(Dollars in millions) | |||||||||||
Most comparable GAAP measure: | |||||||||||
Selling, general and administrative expenses | $ | 2,534.7 | $ | 2,457.5 | $ | 2,082.6 | |||||
Non-GAAP measure: | |||||||||||
Selling, general and administrative expenses | 2,534.7 | 2,457.5 | 2,082.6 | ||||||||
Other costs associated with the IPO | (3.5 | ) | (0.1 | ) | — | ||||||
Impact of changes in fair value on cash-settled stock-based compensation(1) | (34.1 | ) | (44.0 | ) | (8.2 | ) | |||||
Restructuring and related charges, severance and other, net(2) | (6.3 | ) | (5.1 | ) | (13.4 | ) | |||||
Adjusted SG&A | $ | 2,490.8 | $ | 2,408.3 | $ | 2,061.0 | |||||
_____________
(1) | Includes the impact of the changes in fair value of Class B common stock following the grant date on awards that were granted as cash-settled and subsequently replaced with stock-settled awards concurrent with the IPO. |
(2) | Restructuring and related charges, severance and other, net include transaction and deal related costs, including acquisition and integration costs. |
51
The following table presents a reconciliation of net income, the most directly comparable financial measure calculated in accordance with GAAP, to Adjusted EBIT and Adjusted EBITDA for each of the periods presented.
Adjusted EBIT and Adjusted EBITDA:
Year Ended | |||||||||||
November 24, 2019 | November 25, 2018 | November 26, 2017 | |||||||||
(Dollars in millions) | |||||||||||
Most comparable GAAP measure: | |||||||||||
Net income | $ | 395.0 | $ | 285.3 | $ | 284.6 | |||||
Non-GAAP measure: | |||||||||||
Net income | 395.0 | 285.3 | 284.6 | ||||||||
Income tax expense | 82.6 | 214.8 | 64.2 | ||||||||
Interest expense | 66.2 | 55.3 | 68.6 | ||||||||
Other (income) expense, net(1) | (2.0 | ) | (14.9 | ) | 39.9 | ||||||
Underwriter commission paid on behalf of selling stockholders | 24.9 | — | — | ||||||||
Loss on early extinguishment of debt | — | — | 22.8 | ||||||||
Other costs associated with the IPO | 3.5 | 0.1 | — | ||||||||
Impact of changes in fair value on cash-settled stock-based compensation(2) | 34.1 | 44.0 | 8.2 | ||||||||
Restructuring and related charges, severance and other, net(3) | 6.3 | 5.1 | 13.4 | ||||||||
Adjusted EBIT | $ | 610.6 | $ | 589.7 | $ | 501.7 | |||||
Depreciation and amortization | 123.9 | 120.2 | 117.4 | ||||||||
Adjusted EBITDA | $ | 734.5 | $ | 709.9 | $ | 619.1 | |||||
Adjusted EBIT margin | 10.6 | % | 10.6 | % | 10.2 | % | |||||
_____________
(1) | Other (income) expense, net in the years ended November 25, 2018 and November 26, 2017 have been conformed to reflect the adoption of ASU 2017-07, "Compensation-Retirement Benefits (Topic 715) Improving the Presentation of Net Periodic Cost and Net Periodic Postretirement Benefit Cost". Refer to Note 1 for more information. |
(2) | Includes the impact of the changes in fair value of Class B common stock following the grant date on awards that were granted as cash-settled and subsequently replaced with stock-settled awards concurrent with the IPO. |
(3) | Restructuring and related charges, severance and other, net include transaction and deal related costs, including acquisition and integration costs. |
52
The following table presents a reconciliation of net income, the most directly comparable financial measure calculated in accordance with GAAP, to adjusted net income for each of the periods presented and the calculation of adjusted diluted earnings per share for each of the periods presented.
Adjusted Net Income and Adjusted Diluted Earnings per Share:
Year Ended | |||||||||||
November 24, 2019 | November 25, 2018 | November 26, 2017 | |||||||||
(Dollars in millions, except per share amounts) | |||||||||||
Most comparable GAAP measure: | |||||||||||
Net income | $ | 395.0 | $ | 285.3 | $ | 284.6 | |||||
Non-GAAP measure: | |||||||||||
Net income | 395.0 | 285.3 | 284.6 | ||||||||
Underwriter commission paid on behalf of selling stockholders | 24.9 | — | — | ||||||||
Loss on early extinguishment of debt | — | — | 22.8 | ||||||||
Other costs associated with the IPO | 3.5 | 0.1 | — | ||||||||
Impact of changes in fair value on cash-settled stock-based compensation(1) | 34.1 | 44.0 | 8.2 | ||||||||
Restructuring and related charges, severance and other, net(2) | 6.3 | 5.1 | 13.4 | ||||||||
Remeasurement of deferred tax assets and liabilities | — | 95.6 | — | ||||||||
Tax impact of adjustments | (7.6 | ) | (11.7 | ) | (8.2 | ) | |||||
Adjusted net income | $ | 456.2 | $ | 418.4 | $ | 320.8 | |||||
Adjusted net income margin | 7.9 | % | 7.5 | % | 6.5 | % | |||||
Adjusted diluted earnings per share | $ | 1.12 | $ | 1.08 | $ | 0.83 | |||||
_____________
(1) | Includes the impact of the changes in fair value of Class B common stock following the grant date on awards that were granted as cash-settled and subsequently replaced with stock-settled awards concurrent with the IPO. |
(2) | Restructuring and related charges, severance and other, net include transaction and deal related costs, including acquisition and integration costs. |
Net Debt and Leverage Ratio:
We define net debt, a non-GAAP financial measure, as total debt, excluding capital leases, less cash and cash equivalents. We define leverage ratio, a non-GAAP financial measure, as the ratio of total debt to the last 12 months Adjusted EBITDA. Our management believes that net debt and leverage ratio are important measures to monitor our financial flexibility and evaluate the strength of our balance sheet. Net debt and leverage ratio have limitations as analytical tools and may vary from similarly titled measures used by other companies. Net debt and leverage ratio should not be considered in isolation or as substitutes for an analysis of our results prepared and presented in accordance with GAAP.
53
The following table presents a reconciliation of total debt, excluding capital leases, the most directly comparable financial measure calculated in accordance with GAAP, to net debt for each of the periods presented.
November 24, 2019 | November 25, 2018 | ||||||
(Dollars in millions) | |||||||
Most comparable GAAP measure: | |||||||
Total debt, excluding capital leases | $ | 1,014.4 | $ | 1,052.2 | |||
Non-GAAP measure: | |||||||
Total debt, excluding capital leases | $ | 1,014.4 | $ | 1,052.2 | |||
Cash and cash equivalents | (934.2 | ) | (713.1 | ) | |||
Short-term investments in marketable securities | (80.7 | ) | — | ||||
Net debt | $ | (0.5 | ) | $ | 339.1 | ||
The following table presents a reconciliation of total debt, excluding capital leases, the most directly comparable financial measure calculated in accordance with GAAP, to leverage ratio for each of the periods presented.
November 24, 2019 | November 25, 2018 | ||||||
(Dollars in millions) | |||||||
Total debt, excluding capital leases | $ | 1,014.4 | $ | 1,052.2 | |||
Last Twelve Months Adjusted EBITDA | $ | 734.5 | $ | 709.9 | |||
Leverage ratio | 1.4 | 1.5 | |||||
Adjusted Free Cash Flow:
We define adjusted free cash flow, a non-GAAP financial measure, as net cash flow from operating activities plus underwriter commission paid on behalf of selling stockholders, less purchases of property, plant and equipment, plus proceeds (less payments) on settlement of forward foreign exchange contracts not designated for hedge accounting, less payment of debt extinguishment costs, less repurchases of common stock, including shares surrendered for tax withholdings on equity award exercises, and cash dividends to stockholders. We believe adjusted free cash flow is an important liquidity measure of the cash that is available after capital expenditures for operational expenses and investment in our business. We believe adjusted free cash flow is useful to investors because it measures our ability to generate or use cash. Once our business needs and obligations are met, cash can be used to maintain a strong balance sheet and invest in future growth.
Our use of adjusted free cash flow has limitations as an analytical tool and should not be considered in isolation or as a substitute for an analysis of our results under GAAP. First, adjusted free cash flow is not a substitute for net cash flow from operating activities. Second, other companies may calculate adjusted free cash flow or similarly titled non-GAAP financial measures differently or may use other measures to evaluate their performance, all of which could reduce the usefulness of adjusted free cash flow as a tool for comparison. Additionally, the utility of adjusted free cash flow is further limited as it does not reflect our future contractual commitments and does not represent the total increase or decrease in our cash balance for a given period. Because of these and other limitations, adjusted free cash flow should be considered along with net cash flow from operating activities and other comparable financial measures prepared and presented in accordance with GAAP.
54
The following table presents a reconciliation of net cash flow from operating activities, the most directly comparable financial measure calculated in accordance with GAAP, to adjusted free cash flow for each of the periods presented.
Year Ended | |||||||||||
November 24, 2019 | November 25, 2018 | November 26, 2017 | |||||||||
(Dollars in millions) | |||||||||||
Most comparable GAAP measure: | |||||||||||
Net cash provided by operating activities | $ | 412.2 | $ | 420.4 | $ | 525.9 | |||||
Non-GAAP measure: | |||||||||||
Net cash provided by operating activities | $ | 412.2 | $ | 420.4 | $ | 525.9 | |||||
Underwriter commission paid on behalf of selling stockholders | 24.9 | — | — | ||||||||
Purchases of property, plant and equipment | (175.4 | ) | (159.4 | ) | (118.6 | ) | |||||
Proceeds (Payments) on settlement of forward foreign exchange contracts not designated for hedge accounting | 12.2 | (20.0 | ) | (5.8 | ) | ||||||
Payment of debt extinguishment costs | — | — | (21.9 | ) | |||||||
Repurchase of common stock, including shares surrendered for tax withholdings on equity award exercises | (44.0 | ) | (56.0 | ) | (25.1 | ) | |||||
Dividend to stockholders | (113.9 | ) | (90.0 | ) | (70.0 | ) | |||||
Adjusted free cash flow | $ | 116.0 | $ | 95.0 | $ | 284.5 | |||||
Constant-Currency:
We report our operating results in accordance with GAAP, as well as on a constant-currency basis in order to facilitate period-to-period comparisons of our results without regard to the impact of fluctuating foreign currency exchange rates. The term foreign currency exchange rates refers to the exchange rates we use to translate our operating results for all countries where the functional currency is not the U.S. Dollar into U.S. Dollars. Because we are a global company, foreign currency exchange rates used for translation may have a significant effect on our reported results. In general, our reported financial results are affected positively by a weaker U.S. Dollar and are affected negatively by a stronger U.S. Dollar as compared to the foreign currencies in which we conduct our business. References to our operating results on a constant-currency basis mean our operating results without the impact of foreign currency translation fluctuations.
We believe disclosure of constant-currency results is helpful to investors because it facilitates period-to-period comparisons of our results by increasing the transparency of our underlying performance by excluding the impact of fluctuating foreign currency exchange rates. However, constant-currency results are non-GAAP financial measures and are not meant to be considered in isolation or as a substitute for comparable measures prepared in accordance with GAAP. Constant-currency results have no standardized meaning prescribed by GAAP, are not prepared under any comprehensive set of accounting rules or principles and should be read in conjunction with our consolidated financial statements prepared in accordance with GAAP. Constant-currency results have limitations in their usefulness to investors and may be calculated differently from, and therefore may not be directly comparable to, similarly titled measures used by other companies.
We calculate constant-currency amounts by translating local currency amounts in the prior-year period at actual foreign exchange rates for the current period. Our constant-currency results do not eliminate the transaction currency impact, which primarily include the realized and unrealized gains and losses recognized from the measurement and remeasurement of purchases and sales of products in a currency other than the functional currency. Additionally, gross margin is impacted by gains and losses related to the procurement of inventory, primarily products sourced in EUR and USD, by our global sourcing organization on behalf of our foreign subsidiaries.
55
Constant-Currency Net Revenues:
The table below sets forth the calculation of net revenues for each of our regional operating segments on a constant-currency basis for each of the periods presented.
Year Ended | |||||||||||||||||
November 24, 2019 | % Increase (Over Prior Year) | November 25, 2018 | % Increase (Over Prior Year) | November 26, 2017 | |||||||||||||
(Dollars in millions) | |||||||||||||||||
Total revenues | |||||||||||||||||
As reported | $ | 5,763.1 | 3.4 | % | $ | 5,575.4 | 13.7 | % | $ | 4,904.0 | |||||||
Impact of foreign currency exchange rates | — | * | (126.2 | ) | * | 44.0 | |||||||||||
Constant-currency net revenues | $ | 5,763.1 | 5.8 | % | $ | 5,449.2 | 12.7 | % | $ | 4,948.0 | |||||||
Americas | |||||||||||||||||
As reported | $ | 3,057.0 | 0.5 | % | $ | 3,042.7 | 9.7 | % | $ | 2,774.0 | |||||||
Impact of foreign currency exchange rates | — | * | (10.4 | ) | * | (7.3 | ) | ||||||||||
Constant-currency net revenues - Americas | $ | 3,057.0 | 0.8 | % | $ | 3,032.3 | 10.0 | % | $ | 2,766.7 | |||||||
Europe | |||||||||||||||||
As reported | $ | 1,768.1 | 7.4 | % | $ | 1,646.2 | 25.4 | % | $ | 1,312.3 | |||||||
Impact of foreign currency exchange rates | — | * | (85.9 | ) | * | 49.9 | |||||||||||
Constant-currency net revenues - Europe | $ | 1,768.1 | 13.3 | % | $ | 1,560.3 | 20.8 | % | $ | 1,362.2 | |||||||
Asia | |||||||||||||||||
As reported | $ | 938.0 | 5.8 | % | $ | 886.5 | 8.4 | % | $ | 817.7 | |||||||
Impact of foreign currency exchange rates | — | * | (29.9 | ) | * | 1.4 | |||||||||||
Constant-currency net revenues - Asia | $ | 938.0 | 9.5 | % | $ | 856.6 | 8.2 | % | $ | 819.1 | |||||||
_____________
* Not meaningful
56
Constant-Currency Adjusted EBIT:
The table below sets forth the calculation of adjusted EBIT on a constant-currency basis for each of the periods presented.
Year Ended | |||||||||||||||||
November 24, 2019 | % Increase (Over Prior Year) | November 25, 2018 | % Increase (Over Prior Year) | November 26, 2017 | |||||||||||||
(Dollars in millions) | |||||||||||||||||
Adjusted EBIT(1) | $ | 610.6 | 3.5 | % | $ | 589.7 | 17.5 | % | $ | 501.7 | |||||||
Impact of foreign currency exchange rates | — | * | (21.6 | ) | * | 12.4 | |||||||||||
Constant-currency Adjusted EBIT | $ | 610.6 | 7.5 | % | $ | 568.1 | 14.7 | % | $ | 514.1 | |||||||
Constant-currency Adjusted EBIT margin(2) | 10.6 | % | 10.4 | % | 10.4 | % | |||||||||||
_____________
(1) Adjusted EBIT is reconciled from net income which is the most comparable GAAP measure. Refer to Adjusted EBIT and Adjusted EBITDA table for more information.
(2) We define constant-currency Adjusted EBIT margin as constant-currency Adjusted EBIT as a percentage of constant-currency net revenues.
* Not meaningful
Constant-Currency Adjusted Net Income and Adjusted Diluted Earnings per Share:
The table below sets forth the calculation of adjusted net income and adjusted diluted earnings per share on a constant-currency basis for each of the periods presented.
Year Ended | |||||||||||||||||
November 24, 2019 | % Increase (Over Prior Year) | November 25, 2018 | % Increase (Over Prior Year) | November 26, 2017 | |||||||||||||
(Dollars in millions, except per share amounts) | |||||||||||||||||
Adjusted net income(1) | $ | 456.2 | 9.0 | % | $ | 418.4 | 30.4 | % | $ | 320.8 | |||||||
Impact of foreign currency exchange rates | — | * | (18.1 | ) | * | 11.5 | |||||||||||
Constant-currency Adjusted net income | $ | 456.2 | 14.0 | % | $ | 400.3 | 25.9 | % | $ | 332.3 | |||||||
Constant-currency Adjusted net income margin(2) | 7.9 | % | 7.3 | % | 6.7 | % | |||||||||||
Adjusted diluted earnings per share | $ | 1.12 | 3.7 | % | $ | 1.08 | 30.1 | % | $ | 0.83 | |||||||
Impact of foreign currency exchange rates | — | * | (0.05 | ) | * | 0.03 | |||||||||||
Constant-currency adjusted diluted earnings per share | $ | 1.12 | 8.7 | % | $ | 1.03 | 25.6 | % | $ | 0.86 | |||||||
_____________
(1) Adjusted net income is reconciled from net income which is the most comparable GAAP measure. Refer to Adjusted net income table for more information.
(2) We define constant-currency Adjusted net income margin as constant-currency Adjusted net income as a percentage of constant-currency net revenues.
* Not meaningful
Effects of Inflation
We believe that inflation in the regions where most of our sales occur has not had a significant effect on our net revenues or profitability.
Off-Balance Sheet Arrangements, Guarantees and Other Contingent Obligations
Off-balance sheet arrangements and other. We have contractual commitments for non-cancelable operating leases; for more information, see Note 13 to our audited consolidated financial statements included in this report. We participate in a multiemployer pension plan; however, our exposure to risks arising from participation in the plan and the extent to which we can be liable to the
57
plan for other participating employers' obligations are not material. We have no other material non-cancelable guarantees or commitments, and no material special-purpose entities or other off-balance sheet debt obligations.
Indemnification agreements. In the ordinary course of our business, we enter into agreements containing indemnification provisions under which we agree to indemnify the other party for specified claims and losses. For example, our trademark license agreements, real estate leases, consulting agreements, logistics outsourcing agreements, securities purchase agreements and credit agreements typically contain such provisions. This type of indemnification provision obligates us to pay certain amounts associated with claims brought against the other party as the result of trademark infringement, negligence or willful misconduct of our employees, breach of contract by us including inaccuracy of representations and warranties, specified lawsuits in which we and the other party are co-defendants, product claims and other matters. These amounts generally are not readily quantifiable; the maximum possible liability or amount of potential payments that could arise out of an indemnification claim depends entirely on the specific facts and circumstances associated with the claim. We have insurance coverage that minimizes the potential exposure to certain of such claims. We also believe that the likelihood of material payment obligations under these agreements to third parties is remote.
Critical Accounting Policies, Estimates and Assumptions
The preparation of financial statements in conformity with U.S. GAAP requires management to make estimates and assumptions that affect the amounts reported in the consolidated financial statements and the related notes. We believe that the following discussion addresses our critical accounting policies, which are those that are most important to the portrayal of our financial condition and results of operations and require management's most difficult, subjective and complex judgments, often as a result of the need to make estimates about the effect of matters that are inherently uncertain. Changes in such estimates, based on newly available information, or different assumptions or conditions, may affect amounts reported in future periods.
We summarize our critical accounting policies below.
Revenue recognition. Revenue transactions generally comprise of a single performance obligation which consists of the sale of products to customers either through wholesale or direct-to-consumer channels. Net revenues are recognized when the Company's performance obligations are satisfied upon transfer of control of promised goods. A customer is deemed to have control once they are able to direct the use and receive substantially all of the benefits of the product. This includes a present obligation to payment, the transfer of legal title, physical possession, the risks and rewards of ownership, and customer acceptance.
Licensing revenues are included in the Company's wholesale channel and represent approximately 2% of total revenues which are recognized over time based on the contractual term with variable amounts recognized only when royalties exceed contractual minimum royalty guarantees.
We recognize allowances for estimated returns in the period in which the related sale is recorded. We recognize allowances for estimated discounts, retailer promotions and other similar incentives at the later of the period in which the related sale is recorded or the period in which the sales incentive is offered to the customer. We estimate non-volume based allowances based on historical rates as well as customer and product-specific circumstances. Actual allowances may differ from estimates due to changes in sales volume based on retailer or consumer demand and changes in customer and product-specific circumstances. Sales and value-added taxes collected from customers and remitted to governmental authorities are presented on a net basis in the accompanying consolidated statements of income.
Inventory valuation. We value inventories at the lower of cost or market value. Inventory cost is generally determined using the first-in first-out method. We include product costs, labor and related overhead, sourcing costs, inbound freight, internal transfers, and the cost of operating our remaining manufacturing facilities, including the related depreciation expense, in the cost of inventories. We estimate quantities of slow-moving and obsolete inventory by reviewing on-hand quantities, outstanding purchase obligations and forecasted sales. In determining inventory market values, substantial consideration is given to the expected product selling price. We estimate expected selling prices based on our historical recovery rates for sale of slow-moving and obsolete inventory and other factors, such as market conditions, expected channel of disposition, and current consumer preferences. Estimates may differ from actual results due to changes in resale or market value, avenues of disposition, consumer and retailer preferences and economic conditions.
Impairment. We review our goodwill and other non-amortized intangible assets for impairment annually in the fourth quarter of our fiscal year, or more frequently as warranted by events or changes in circumstances which indicate that the carrying amount may not be recoverable. We qualitatively assess goodwill impairment and non-amortized intangible assets to determine whether it is more likely than not that the fair value of a reporting unit or other non-amortized intangible asset is less than its carrying amount. During fiscal year 2019, we performed this analysis examining key events and circumstances affecting fair value and determined it is more likely than not that the reporting unit's fair value is greater than its carrying amount. As such, no further analysis was required. If goodwill and other non-amortized intangible assets are not qualitatively assessed and it is determined that it is not more likely than not that the reporting unit's fair value is greater than its carrying amount, a two-step quantitative
58
approach is utilized. In the first step, we compare the carrying value of the reporting unit or applicable asset to its fair value, which we estimate using a discounted cash flow analysis or by comparison to the market values of similar assets. If the carrying amount of the reporting unit or asset exceeds its estimated fair value, we perform the second step, and determine the impairment loss, if any, as the excess of the carrying value of the goodwill or intangible asset over its fair value. The assumptions used in such valuations are subject to volatility and may differ from actual results; however, based on the carrying value of our goodwill and other non-amortized intangible assets as of November 24, 2019, relative to their estimated fair values, we do not anticipate any material impairment charges in the near-term.
We review our other long-lived assets for impairment whenever events or changes in circumstances indicate the carrying amount of an asset may not be recoverable. If the carrying amount of an other long-lived asset exceeds the expected future undiscounted cash flows, we measure and record an impairment loss for the excess of the carrying value of the asset over its fair value.
To determine the fair value of impaired assets, we utilize the valuation technique or techniques deemed most appropriate based on the nature of the impaired asset and the data available, which may include the use of quoted market prices, prices for similar assets or other valuation techniques such as discounted future cash flows or earnings.
Income tax. Significant judgment is required in determining our worldwide income tax provision. In the ordinary course of a global business, there are many transactions and calculations where the ultimate tax outcome is uncertain. Some of these uncertainties arise from examinations in various jurisdictions and assumptions and estimates used in evaluating the need for a valuation allowance.
The Tax Act was enacted in the United States on December 22, 2017 and includes, among other items, a reduction in the federal corporate income tax rate from 35% to 21% and a deemed repatriation of foreign earnings. We are required to recognize the effect of the tax law changes in the period of enactment, such as determining the transition tax, remeasuring our U.S. deferred tax assets and liabilities and reassessing the net realizability of our deferred tax assets and liabilities.
We are subject to income taxes in both the United States and numerous foreign jurisdictions. We compute our provision for income taxes using the asset and liability method, under which deferred tax assets and liabilities are recognized for the expected future tax consequences of temporary differences between the financial reporting and tax bases of assets and liabilities and for operating loss and tax credit carryforwards. Deferred tax assets and liabilities are measured using the currently enacted tax rates that are expected to apply to taxable income for the years in which those tax assets and liabilities are expected to be realized or settled. Significant judgments are required in order to determine the realizability of these deferred tax assets. In assessing the need for a valuation allowance, we evaluate all significant available positive and negative evidence, including historical operating results, estimates of future taxable income and the existence of prudent and feasible tax planning strategies. Changes in the expectations regarding the realization of deferred tax assets could materially impact income tax expense in future periods.
We continuously review issues raised in connection with all ongoing examinations and open tax years to evaluate the adequacy of our tax liabilities. We evaluate uncertain tax positions under a two-step approach. The first step is to evaluate the uncertain tax position for recognition by determining if the weight of available evidence indicates that it is more likely than not that the position will be sustained upon examination based on its technical merits. The second step is, for those positions that meet the recognition criteria, to measure the tax benefit as the largest amount that is more than fifty percent likely of being realized. We believe our recorded tax liabilities are adequate to cover all open tax years based on our assessment. This assessment relies on estimates and assumptions and involves significant judgments about future events. To the extent that our view as to the outcome of these matters changes, we will adjust income tax expense in the period in which such determination is made. We classify interest and penalties related to income taxes as income tax expense.
Employee benefits and incentive compensation
Pension and postretirement benefits. We have several non-contributory defined benefit retirement plans covering eligible employees. We also provide certain health care benefits for U.S. employees who meet age, participation and length of service requirements at retirement. In addition, we sponsor other retirement or post-employment plans for our foreign employees in accordance with local government programs and requirements. We retain the right to amend, curtail or discontinue any aspect of the plans, subject to local regulations. Any of these actions, either individually or in combination, could have a material impact on our consolidated financial statements and on our future financial performance.
We recognize either an asset or liability for any plan's funded status in our consolidated balance sheets. We measure changes in funded status using actuarial models which utilize an attribution approach that generally spreads individual events either over the estimated service lives of the remaining employees in the plan, or, for plans where participants will not earn additional benefits by rendering future service, over the plan participants' estimated remaining lives. The attribution approach assumes that employees render service over their service lives on a relatively smooth basis and as such, presumes that the income statement effects of
59
pension or postretirement benefit plans should follow the same pattern. Our policy is to fund our pension plans based upon actuarial recommendations and in accordance with applicable laws, income tax regulations and credit agreements.
Net pension and postretirement benefit income or expense is generally determined using assumptions which include expected long-term rates of return on plan assets, discount rates, compensation rate increases and medical trend and mortality rates. We use a mix of actual historical rates, expected rates and external data to determine the assumptions used in the actuarial models. For example, we utilized a yield curve constructed from a portfolio of high-quality corporate bonds with various maturities to determine the appropriate discount rate to use for our U.S. benefit plans. Under this model, each year's expected future benefit payments are discounted to their present value at the appropriate yield curve rate, thereby generating the overall discount rate. We utilized country-specific third-party bond indices to determine appropriate discount rates to use for benefit plans of our foreign subsidiaries. Changes in actuarial assumptions and estimates, either individually or in combination, could have a material impact on our consolidated financial statements and on our future financial performance. For example, as of November 24, 2019, a 25 basis point change in the discount rate would yield an approximately three percent change in the projected benefit obligation and no significant change in the annual service cost of our pension plans. A 25 basis point change in the discount rate would not have a significant impact on the postretirement benefit plan.
Employee incentive compensation. We maintain short-term and long-term employee incentive compensation plans. For our short-term plans, the amount of the cash bonus earned depends upon business unit and corporate financial results as measured against pre-established targets, and also depends upon the performance and job level of the individual. Our long-term plans are intended to reward certain levels of management for its long-term impact on our total earnings performance. Performance is measured at the end of a three-year period based on our performance over the period measured against certain pre-established targets such as the compound annual growth rates over the periods for net revenues and average margin of net earnings adjusted for certain items such as interest and taxes. We accrue the related compensation expense over the period of the plan, and changes in our projected future financial performance could have a material impact on our accruals.
Stock-Based Compensation. We have stock-based incentive plans which allow for the issuance of cash or equity-settled awards to certain employees and non-employee directors. We recognize stock-based compensation expense for share-based awards that are classified as equity based on the grant date fair value of the awards over the requisite service period, adjusted for estimated forfeitures. Cash-settled awards are classified as liabilities and stock-based compensation expense is measured using fair value at the end of each reporting period until settlement.
As of November 24, 2019, the fair value of the shares of our common stock has been determined on market prices. Prior to the IPO, the fair value of our common stock was determined by the Company's board of directors (the "Board"). As there was no public market for the Company’s common stock, the Board determined the fair value of the common stock on the stock option grant date by considering a number of objective and subjective factors, including third-party valuations of the common stock, comparisons of the Company's financial results against selected publicly-traded companies and application of a discount for the illiquidity of the stock to derive the fair value of the stock.
For stock appreciation rights that are classified as equity, we use the Black-Scholes valuation model to estimate the grant date fair value, unless the awards are subject to a market condition, in which case we use a Monte Carlo simulation valuation model. The grant date fair value of equity-classified restricted stock units that are not subject to a market condition, is based on the fair value of our common stock on the date of grant, adjusted to reflect the absence of dividends for those awards that are not entitled to dividend equivalents. For restricted stock units that include a market condition, we use a Monte Carlo simulation valuation model to estimate the grant date fair value. For share-based awards that are classified as liabilities, the fair value of the awards is estimated using the intrinsic value method, which is based on the fair value of our common stock on each measurement date.
The Black-Scholes option pricing model and the Monte Carlo simulation model require the input of highly subjective assumptions including volatility. Due to the fact that our common stock has not been publicly traded, the computation of expected volatility is based on the average of the implied volatilities and the historical volatilities over the expected life of the awards, of a representative peer group of publicly-traded entities. Other assumptions include the expected life, risk-free rate of interest and dividend yield. For equity awards with a service condition, the expected life is derived based on historical experience and expected future post-vesting termination and exercise patterns. For equity awards with a performance condition, the expected life is computed using the simplified method until historical experience is available. The risk-free interest rate is based on zero coupon U.S. Treasury bond rates corresponding to the expected life of the awards. Dividend assumptions are based on historical experience.
Due to the job function of the award recipients, we have included stock-based compensation in "Selling, general and administrative expenses" in our consolidated statements of income.
60
Recently Issued Accounting Standards
See Note 1 to our audited consolidated financial statements included in this report for recently issued accounting standards, including the expected dates of adoption and expected impact to our consolidated financial statements upon adoption.
61
SPECIAL NOTE REGARDING FORWARD-LOOKING STATEMENTS
Certain matters discussed in this Annual Report, including (without limitation) statements under "Management's Discussion and Analysis of Financial Condition and Results of Operations" contain forward-looking statements. Although we believe that, in making any such statements, our expectations are based on reasonable assumptions, any such statement may be influenced by factors that could cause actual outcomes and results to be materially different from those projected.
These forward-looking statements include statements relating to our anticipated financial performance and business prospects, including debt reduction, currency values and financial impact, foreign exchange counterparty exposures, the impact of pending legal proceedings, adequate liquidity levels, dividends and/or statements preceded by, followed by or that include the words "believe", "will", "so we can", "when", "anticipate", "intend", "estimate", "expect", "project", "could", "plans", "seeks" and similar expressions. These forward-looking statements speak only as of the date stated and we do not undertake any obligation to update or revise publicly any forward-looking statements, whether as a result of new information, future events or otherwise, even if experience or future events make it clear that any expected results expressed or implied by these forward-looking statements will not be realized. Although we believe that the expectations reflected in these forward-looking statements are reasonable, these expectations may not prove to be correct or we may not achieve the financial results, savings or other benefits anticipated in the forward-looking statements. These forward-looking statements are necessarily estimates reflecting the best judgment of our senior management and involve a number of risks and uncertainties, some of which may be beyond our control. These risks and uncertainties, including those disclosed under "Risk Factors" in Part I, Item 1A on this Annual Report and in our other filings with the Securities and Exchange Commission, could cause actual results to differ materially from those suggested by the forward-looking statements and include, without limitation:
• | changes in general economic and financial conditions, and the resulting impact on the level of discretionary consumer spending for apparel and pricing trend fluctuations, and our ability to plan for and respond to the impact of those changes; |
• | our ability to gauge and adapt to changing U.S. and international retail environments and fashion trends and changing consumer preferences in product, price-points, as well as in-store and digital shopping experiences; |
• | our ability to forecast and respond timely to price, innovation and other competitive pressures in the global apparel industry on and from our key customers and in our key markets; |
• | our dependence on key distribution channels, customers and suppliers; |
• | consequences of impacts to the businesses of our wholesale customers, including significant store closures or a significant decline in a wholesale customer's financial condition leading to restructuring actions, bankruptcies, liquidations or other unfavorable events for our wholesale customers, caused by factors such as inability to secure financing, decreased discretionary consumer spending, inconsistent traffic patterns and an increase in promotional activity as a result of decreased traffic, pricing fluctuations, general economic and financial conditions and changing consumer preferences; |
• | our ability to increase the number of dedicated stores for our products, including through opening and profitably operating company-operated stores; |
• | consequences of foreign currency exchange and interest rate fluctuations; |
• | changes in or application of trade and tax laws, potential increases in import tariffs or taxes and the potential withdrawal from or renegotiation or replacement of the North America Free Trade Agreement ("NAFTA"); and |
• | the impact of the recently passed Tax Act in the United States, including related changes to our deferred tax assets and liabilities, tax obligations and effective tax rate in future periods, as well as the charge recorded in fiscal 2018; |
• | our ability to effectively manage any global productivity and outsourcing actions as planned, which are intended to increase productivity and efficiency in our global operations, take advantage of lower-cost service-delivery models in our distribution network and streamline our procurement practices to maximize efficiency in our global operations, without business disruption or mitigation to such disruptions; |
• | our ability to successfully prevent or mitigate the impacts of data security breaches; |
• | our and our wholesale customers' decisions to modify strategies and adjust product mix and pricing, and our ability to manage any resulting product transition costs, including liquidating inventory or increasing promotional activity; |
• | our ability to purchase products through our independent contract manufacturers that are made with quality raw materials and our ability to mitigate the variability of costs related to manufacturing, sourcing, and raw materials supply and to manage consumer response to such mitigating actions; |
62
• | our ability to attract and retain key executives and other key employees; |
• | our ability to protect our trademarks and other intellectual property; |
• | the impact of the variables that affect the net periodic benefit cost and future funding requirements of our postretirement benefits and pension plans; |
• | ongoing or future litigation matters and disputes and regulatory developments; |
• | political, social and economic instability, or natural disasters, in countries where we or our customers do business. |
We have based the forward-looking statements contained in this Annual Report primarily on our current expectations and projections about future events and trends that we believe may affect our business, financial condition, results of operations, prospects, business strategy and financial needs. The outcome of the events described in these forward-looking statements is subject to risks, uncertainties, assumptions and other factors described under “Risk Factors” and elsewhere in this Annual Report. These risks are not exhaustive. Other sections of this Annual Report include additional factors that could adversely affect our business and financial performance. Moreover, we operate in a very competitive and rapidly changing environment. New risks and uncertainties emerge from time to time, and it is not possible for us to predict all risks and uncertainties that could have an impact on the forward-looking statements contained in this Annual Report. We cannot assure you that the results, events and circumstances reflected in the forward-looking statements will be achieved or occur, and actual results, events or circumstances could differ materially from those described in the forward-looking statements.
In addition, statements that “we believe” and similar statements reflect our beliefs and opinions on the relevant subject. These statements are based upon information available to us as of the date of this Annual Report, and while we believe such information forms a reasonable basis for such statements, such information may be limited or incomplete, and our statements should not be read to indicate that we have conducted an exhaustive inquiry into, or review of, all potentially available relevant information. These statements are inherently uncertain and investors are cautioned not to unduly rely upon these statements.
The forward-looking statements made in this Annual Report relate only to events as of the date on which such statements are made. We undertake no obligation to update any forward-looking statements after the date of this Annual Report or to conform such statements to actual results or revised expectations, except as required by law.
63
Item 7A. | QUANTITATIVE AND QUALITATIVE DISCLOSURES ABOUT MARKET RISK |
Investment and Credit Availability Risk
We manage cash and cash equivalents in various institutions at levels beyond FDIC coverage limits, and we purchase investments not guaranteed by the FDIC. Accordingly, there may be a risk that we will not recover the full principal of our investments or that their liquidity may be diminished. To mitigate this risk, our investment policy emphasizes preservation of principal and liquidity.
Multiple financial institutions are committed to provide loans and other credit instruments under our credit facility. There may be a risk that some of these institutions cannot deliver against these obligations in a timely manner, or at all.
Foreign Exchange Risk
The global scope of our business operations exposes us to the risk of fluctuations in foreign currency markets. This exposure is the result of certain product sourcing activities, some intercompany sales, foreign subsidiaries' royalty payments, interest payments, earnings repatriations, net investment in foreign operations and funding activities. Our foreign currency management objective is to minimize the effect of fluctuations in foreign exchange rates on our nonfunctional currency cash flows and selected assets or liabilities without exposing ourselves to additional risk associated with transactions that could be regarded as speculative.
We use a centralized currency management operation to take advantage of potential opportunities to naturally offset exposures against each other. For any residual exposures under management, we may enter into various financial instruments, including forward exchange contracts, to hedge certain forecasted transactions, as well as certain firm commitments, including third-party and intercompany transactions. We have also designated a portion of our Euro-denominated debt as a net investment hedge of our investment in certain European subsidiaries.
Our foreign exchange risk management activities are governed by a foreign exchange risk management policy approved by our Treasury committee. Members of our Treasury committee, comprised of a group of our senior financial executives, review our foreign exchange /activities in support of monitoring our compliance with policy. The operating policies and guidelines outlined in the foreign exchange risk management policy provide a framework that allows for a managed approach to the management of currency exposures while ensuring the activities are conducted within established parameters. Our policy includes guidelines for the organizational structure of our treasury risk management function and for internal controls over foreign exchange risk management activities, including various measurements for monitoring compliance. We monitor foreign exchange risk and related derivatives using different techniques, including a review of market value, sensitivity analysis and a value-at-risk model. We use the market approach to estimate the fair value of our foreign exchange derivative contracts.
We use derivative instruments to manage certain but not all exposures to foreign currencies. Our approach to managing foreign currency exposures is consistent with that applied in previous years. As of November 24, 2019, we had forward foreign exchange contracts not designated as hedges in qualifying hedging relationships, of which $1.1 billion were contracts to buy and $135.6 million were contracts to sell various foreign currencies. These contracts are at various exchange rates and expire at various dates through February 2021.
As of November 25, 2018, we had forward foreign exchange contracts to buy $981.8 million and to sell $193.5 million against various foreign currencies. These contracts were at various exchange rates and expire at various dates through February 2020.
Derivative Financial Instruments
We are exposed to market risk primarily related to foreign currencies. We manage foreign currency risks with the objective to minimize the effect of fluctuations in foreign exchange rates on our nonfunctional currency cash flows and selected assets or liabilities without exposing ourselves to additional risk associated with transactions that could be regarded as speculative.
We are exposed to credit loss in the event of nonperformance by the counterparties to the over-the-counter forward foreign exchange contracts. However, we believe that our exposures are appropriately diversified across counterparties and that these counterparties are creditworthy financial institutions. We monitor the creditworthiness of our counterparties in accordance with our foreign exchange and investment policies. In addition, we have International Swaps and Derivatives Association, Inc. ("ISDA") master agreements in place with our counterparties to mitigate the credit risk related to the outstanding derivatives. These agreements provide the legal basis for over-the-counter transactions in many of the world's commodity and financial markets.
64
The following table presents the currency, average forward exchange rate, notional amount and fair values for our outstanding forward contracts as of November 24, 2019 and November 25, 2018. The average forward exchange rate is the weighted average of the forward rates of the contracts for the indicated currency. The notional amount represents the U.S. Dollar equivalent amount of the foreign currency at the inception of the contracts, and is the net sum of all buy and sell transactions for the indicated currency. A net positive notional amount represents a position to buy the U.S. Dollar versus the exposure currency, while a net negative notional amount represents a position to sell the U.S. Dollar versus the exposure currency. All transactions will mature before the end of February 2021.
As of November 24, 2019 | As of November 25, 2018 | ||||||||||||||||||||
Average Forward Exchange Rate | Notional Amount | Fair Value | Average Forward Exchange Rate | Notional Amount | Fair Value | ||||||||||||||||
(Dollars in thousands) | |||||||||||||||||||||
Currency | |||||||||||||||||||||
Australian Dollar | 0.7 | $ | 29,447 | $ | 541 | 0.74 | $ | 29,371 | $ | 513 | |||||||||||
Brazilian Real | 3.98 | 8,726 | 504 | — | — | — | |||||||||||||||
Canadian Dollar | 1.32 | 103,938 | 809 | 1.3 | 86,242 | 626 | |||||||||||||||
Swiss Franc | 0.99 | (10,559 | ) | 36 | 1 | (12,031 | ) | 169 | |||||||||||||
Czech Koruna | 23.12 | (1,459 | ) | 8 | 22.78 | (1,301 | ) | 8 | |||||||||||||
Danish Krone | 6.73 | (1,114 | ) | 5 | 6.55 | (2,376 | ) | 22 | |||||||||||||
Euro | 1.14 | 406,350 | 6,321 | 1.17 | 312,601 | 6,577 | |||||||||||||||
British Pound Sterling | 1.25 | 167,793 | (3,629 | ) | 1.31 | 207,799 | 3,083 | ||||||||||||||
Hong Kong Dollar | 7.83 | (5,005 | ) | — | 7.81 | (5,226 | ) | (3 | ) | ||||||||||||
Hungarian Forint | 301.73 | (3,502 | ) | 25 | 283.7 | (2,622 | ) | 40 | |||||||||||||
Japanese Yen | 105.76 | 85,154 | 990 | 108.16 | 64,081 | 1,207 | |||||||||||||||
South Korean Won | 1,151.87 | 28,654 | 221 | 1,106.67 | 24,765 | 180 | |||||||||||||||
Mexican Peso | 20.15 | 131,910 | (947 | ) | 20.84 | 106,008 | 947 | ||||||||||||||
Norwegian Krone | 9.14 | (3,690 | ) | 5 | 8.44 | (3,093 | ) | (20 | ) | ||||||||||||
New Zealand Dollar | 0.63 | (2,562 | ) | 32 | 0.68 | (2,397 | ) | 17 | |||||||||||||
Polish Zloty | 3.88 | (1,993 | ) | 1 | 3.79 | (5,190 | ) | 47 | |||||||||||||
Swedish Krona | 9.28 | 25,642 | 644 | 8.48 | 24,724 | 1,034 | |||||||||||||||
Singapore Dollar | 1.36 | (5,703 | ) | (22 | ) | 1.36 | (34,528 | ) | (85 | ) | |||||||||||
Turkish Lira | 5.73 | 1,009 | 5 | — | — | — | |||||||||||||||
South African Rand | — | — | — | 15.08 | 1,444 | (126 | ) | ||||||||||||||
Total | $ | 953,036 | $ | 5,549 | $ | 788,271 | $ | 14,236 | |||||||||||||
65
Interest rate risk
The following table provides information about our financial instruments that may be sensitive to changes in interest rates. The table presents principal (face amount) outstanding balances of our debt instruments and the related weighted-average interest rates for the years indicated based on expected maturity dates. All amounts are stated in U.S. Dollar equivalents.
As of November 24, 2019 | As of November 25, 2018 | ||||||||||||||||||||||||||||||
Expected Maturity Date | |||||||||||||||||||||||||||||||
2020 | 2021 | 2022 | 2023 | 2024 | Thereafter | Total | Total | ||||||||||||||||||||||||
(Dollars in thousands) | |||||||||||||||||||||||||||||||
Debt Instruments | |||||||||||||||||||||||||||||||
Fixed Rate (US$) | $ | — | $ | — | $ | — | $ | — | $ | — | $ | 500,000 | $ | 500,000 | $ | 500,000 | |||||||||||||||
Average Interest Rate | — | — | — | — | — | 5.00 | % | 5.00 | % | 5.00 | % | ||||||||||||||||||||
Fixed Rate (Euro 475 million) | — | — | — | — | — | 525,255 | 525,255 | 541,500 | |||||||||||||||||||||||
Average Interest Rate | — | — | — | — | — | 3.375 | % | 3.375 | % | 3.375 | % | ||||||||||||||||||||
Variable Rate (US$) | — | — | — | — | — | — | — | — | |||||||||||||||||||||||
Average Interest Rate | — | — | — | — | — | — | — | — | |||||||||||||||||||||||
Total Principal (face amount) of our debt instruments(1) | $ | — | $ | — | $ | — | $ | — | $ | — | $ | 1,025,255 | $ | 1,025,255 | $ | 1,041,500 | |||||||||||||||
______________
(1) | Excluded from this table are other short-term borrowings of $7.6 million as of November 24, 2019, consisting of term loans and revolving credit facilities at various foreign subsidiaries which we expect to either pay over the next twelve months or refinance at the end of their applicable terms. All of the $7.6 million was fixed-rate debt. |
66
Item 8. | FINANCIAL STATEMENTS AND SUPPLEMENTARY DATA |
Report of Independent Registered Public Accounting Firm
To the Board of Directors and Stockholders of Levi Strauss & Co.
Opinion on the Financial Statements
We have audited the accompanying consolidated balance sheets of Levi Strauss & Co. and its subsidiaries (the “Company”) as of November 24, 2019 and November 25, 2018, and the related consolidated statements of income, of comprehensive income, of stockholders’ equity and of cash flows for each of the three years in the period ended November 24, 2019, including the related notes and schedule of valuation and qualifying accounts for each of the three years in the period ended November 24, 2019 appearing under Item 15 (collectively referred to as the “consolidated financial statements”). In our opinion, the consolidated financial statements present fairly, in all material respects, the financial position of the Company as of November 24, 2019 and November 25, 2018, and the results of its operations and its cash flows for each of the three years in the period ended November 24, 2019 in conformity with accounting principles generally accepted in the United States of America.
Change in Accounting Principle
As discussed in Note 1 to the consolidated financial statements, the Company changed the manner in which it accounts for revenue from contracts with customers and the manner in which it presents net periodic benefit costs as of November 26, 2018.
Basis for Opinion
These consolidated financial statements are the responsibility of the Company's management. Our responsibility is to express an opinion on the Company’s consolidated financial statements based on our audits. We are a public accounting firm registered with the Public Company Accounting Oversight Board (United States) (PCAOB) and are required to be independent with respect to the Company in accordance with the U.S. federal securities laws and the applicable rules and regulations of the Securities and Exchange Commission and the PCAOB.
We conducted our audits of these consolidated financial statements in accordance with the standards of the PCAOB. Those standards require that we plan and perform the audit to obtain reasonable assurance about whether the consolidated financial statements are free of material misstatement, whether due to error or fraud. The Company is not required to have, nor were we engaged to perform, an audit of its internal control over financial reporting. As part of our audits we are required to obtain an understanding of internal control over financial reporting but not for the purpose of expressing an opinion on the effectiveness of the Company's internal control over financial reporting. Accordingly, we express no such opinion.
Our audits included performing procedures to assess the risks of material misstatement of the consolidated financial statements, whether due to error or fraud, and performing procedures that respond to those risks. Such procedures included examining, on a test basis, evidence regarding the amounts and disclosures in the consolidated financial statements. Our audits also included evaluating the accounting principles used and significant estimates made by management, as well as evaluating the overall presentation of the consolidated financial statements. We believe that our audits provide a reasonable basis for our opinion.
/s/ PricewaterhouseCoopers LLP
San Francisco, California
January 30, 2020
We have served as the Company's auditor since 2007.
67
LEVI STRAUSS & CO. AND SUBSIDIARIES
CONSOLIDATED BALANCE SHEETS
November 24, 2019 | November 25, 2018 | ||||||
(Dollars in thousands) | |||||||
ASSETS | |||||||
Current Assets: | |||||||
Cash and cash equivalents | $ | 934,237 | $ | 713,120 | |||
Short-term investments in marketable securities | 80,741 | — | |||||
Trade receivables, net of allowance for doubtful accounts of $6,172 and $10,037 (Note 1) | 782,846 | 534,164 | |||||
Inventories: | |||||||
Raw materials | 4,929 | 3,681 | |||||
Work-in-process | 3,319 | 2,977 | |||||
Finished goods | 875,944 | 877,115 | |||||
Total inventories | 884,192 | 883,773 | |||||
Other current assets | 188,170 | 157,002 | |||||
Total current assets | 2,870,186 | 2,288,059 | |||||
Property, plant and equipment, net of accumulated depreciation of $1,054,267 and $974,206 | 529,558 | 460,613 | |||||
Goodwill | 235,788 | 236,246 | |||||
Other intangible assets, net | 42,782 | 42,835 | |||||
Deferred tax assets, net | 407,905 | 397,791 | |||||
Other non-current assets | 146,199 | 117,116 | |||||
Total assets | $ | 4,232,418 | $ | 3,542,660 | |||
LIABILITIES, TEMPORARY EQUITY AND STOCKHOLDERS’ EQUITY | |||||||
Current Liabilities: | |||||||
Short-term debt | $ | 7,621 | $ | 31,935 | |||
Accounts payable | 360,324 | 351,329 | |||||
Accrued salaries, wages and employee benefits | 223,374 | 298,990 | |||||
Accrued interest payable | 5,350 | 6,089 | |||||
Accrued income taxes | 24,050 | 15,466 | |||||
Accrued sales allowances (Note 1) | 123,311 | — | |||||
Other accrued liabilities | 423,174 | 348,390 | |||||
Total current liabilities | 1,167,204 | 1,052,199 | |||||
Long-term debt | 1,006,745 | 1,020,219 | |||||
Postretirement medical benefits | 64,006 | 74,181 | |||||
Pension liability | 193,214 | 195,639 | |||||
Long-term employee related benefits | 84,957 | 107,556 | |||||
Long-term income tax liabilities | 10,486 | 9,805 | |||||
Other long-term liabilities | 134,249 | 116,462 | |||||
Total liabilities | 2,660,861 | 2,576,061 | |||||
Commitments and contingencies | |||||||
Temporary equity (Note 1) | — | 299,140 | |||||
Stockholders’ Equity: | |||||||
Levi Strauss & Co. stockholders’ equity | |||||||
Common stock — $.001 par value; 1,200,000,000 Class A shares authorized; 53,079,235 shares and no shares issued and outstanding as of November 24, 2019 and November 25, 2018, respectively; and 422,000,000 Class B shares authorized, 340,674,741 shares and 376,028,430 shares issued and outstanding, as of November 24, 2019 and November 25, 2018, respectively | 394 | 376 | |||||
Additional paid-in capital (Note 1) | 657,659 | — | |||||
Accumulated other comprehensive loss | (404,986 | ) | (424,584 | ) | |||
Retained earnings | 1,310,464 | 1,084,321 | |||||
Total Levi Strauss & Co. stockholders’ equity | 1,563,531 | 660,113 | |||||
Noncontrolling interest | 8,026 | 7,346 | |||||
Total stockholders’ equity | 1,571,557 | 667,459 | |||||
Total liabilities, temporary equity and stockholders’ equity | $ | 4,232,418 | $ | 3,542,660 | |||
The accompanying notes are an integral part of these consolidated financial statements.
68
LEVI STRAUSS & CO. AND SUBSIDIARIES
CONSOLIDATED STATEMENTS OF INCOME
Year Ended | |||||||||||
November 24, 2019 | November 25, 2018 | November 26, 2017 | |||||||||
(Dollars in thousands, except per share amounts) | |||||||||||
Net revenues | $ | 5,763,087 | $ | 5,575,440 | $ | 4,904,030 | |||||
Cost of goods sold | 2,661,714 | 2,577,465 | 2,341,301 | ||||||||
Gross profit | 3,101,373 | 2,997,975 | 2,562,729 | ||||||||
Selling, general and administrative expenses | 2,534,698 | 2,457,564 | 2,082,662 | ||||||||
Operating income | 566,675 | 540,411 | 480,067 | ||||||||
Interest expense | (66,248 | ) | (55,296 | ) | (68,603 | ) | |||||
Underwriter commission paid on behalf of selling stockholders (Note 1) | (24,860 | ) | — | — | |||||||
Loss on early extinguishment of debt | — | — | (22,793 | ) | |||||||
Other income (expense), net | 2,017 | 14,907 | (39,890 | ) | |||||||
Income before income taxes | 477,584 | 500,022 | 348,781 | ||||||||
Income tax expense | 82,604 | 214,778 | 64,225 | ||||||||
Net income | 394,980 | 285,244 | 284,556 | ||||||||
Net income attributable to noncontrolling interest | (368 | ) | (2,102 | ) | (3,153 | ) | |||||
Net income attributable to Levi Strauss & Co. | $ | 394,612 | $ | 283,142 | $ | 281,403 | |||||
Earnings per common share attributable to common stockholders: | |||||||||||
Basic | $ | 1.01 | $ | 0.75 | $ | 0.75 | |||||
Diluted | $ | 0.97 | $ | 0.73 | $ | 0.73 | |||||
Weighted-average common shares outstanding: | |||||||||||
Basic | 389,082,277 | 377,139,847 | 376,177,350 | ||||||||
Diluted | 408,365,902 | 388,607,361 | 384,338,330 | ||||||||
The accompanying notes are an integral part of these consolidated financial statements.
69
LEVI STRAUSS & CO. AND SUBSIDIARIES
CONSOLIDATED STATEMENTS OF COMPREHENSIVE INCOME
Year Ended | |||||||||||
November 24, 2019 | November 25, 2018 | November 26, 2017 | |||||||||
(Dollars in thousands) | |||||||||||
Net income | $ | 394,980 | $ | 285,244 | $ | 284,556 | |||||
Other comprehensive income (loss), before related income taxes: | |||||||||||
Pension and postretirement benefits | 10,248 | 4,336 | 30,125 | ||||||||
Derivative Instruments | 19,026 | 21,280 | (59,945 | ) | |||||||
Foreign currency translation (losses) gains | (7,250 | ) | (43,713 | ) | 40,256 | ||||||
Unrealized gains (losses) on marketable securities | 4,362 | (1,488 | ) | 3,379 | |||||||
Total other comprehensive income (loss), before related income taxes | 26,386 | (19,585 | ) | 13,815 | |||||||
Income tax (expense) benefit related to items of other comprehensive income (loss) | (6,476 | ) | (852 | ) | 9,223 | ||||||
Comprehensive income, net of income taxes | 414,890 | 264,807 | 307,594 | ||||||||
Comprehensive income attributable to noncontrolling interest | (680 | ) | (1,868 | ) | (3,258 | ) | |||||
Comprehensive income attributable to Levi Strauss & Co. | $ | 414,210 | $ | 262,939 | $ | 304,336 | |||||
The accompanying notes are an integral part of these consolidated financial statements.
70
LEVI STRAUSS & CO. AND SUBSIDIARIES
CONSOLIDATED STATEMENTS OF STOCKHOLDERS' EQUITY
Levi Strauss & Co. Stockholders | |||||||||||||||||||||||
Common Stock | Additional Paid-In Capital | Retained Earnings | Accumulated Other Comprehensive Loss | Noncontrolling Interest | Total Stockholders' Equity | ||||||||||||||||||
(Dollars in thousands) | |||||||||||||||||||||||
Balance at November 27, 2016 | $ | 375 | $ | 1,445 | $ | 935,049 | $ | (427,314 | ) | $ | 2,220 | $ | 511,775 | ||||||||||
Net income | — | — | 281,403 | — | 3,153 | 284,556 | |||||||||||||||||
Other comprehensive income, net of tax | — | — | — | 22,933 | 105 | 23,038 | |||||||||||||||||
Stock-based compensation and dividends, net | 2 | 25,878 | (70 | ) | — | — | 25,810 | ||||||||||||||||
Reclassification to temporary equity | — | (13,575 | ) | (34,114 | ) | — | — | (47,689 | ) | ||||||||||||||
Repurchase of common stock | (2 | ) | (13,748 | ) | (11,352 | ) | — | — | (25,102 | ) | |||||||||||||
Cash dividends paid | — | — | (70,000 | ) | — | — | (70,000 | ) | |||||||||||||||
Balance at November 26, 2017 | 375 | — | 1,100,916 | (404,381 | ) | 5,478 | 702,388 | ||||||||||||||||
Net income | — | — | 283,142 | — | 2,102 | 285,244 | |||||||||||||||||
Other comprehensive loss, net of tax | — | — | — | (20,203 | ) | (234 | ) | (20,437 | ) | ||||||||||||||
Stock-based compensation and dividends, net | 3 | 18,471 | (67 | ) | — | — | 18,407 | ||||||||||||||||
Reclassification to temporary equity | — | 11,232 | (183,336 | ) | — | — | (172,104 | ) | |||||||||||||||
Repurchase of common stock | (2 | ) | (29,703 | ) | (26,334 | ) | — | — | (56,039 | ) | |||||||||||||
Cash dividends paid | — | — | (90,000 | ) | — | — | (90,000 | ) | |||||||||||||||
Balance at November 25, 2018 | 376 | — | 1,084,321 | (424,584 | ) | 7,346 | 667,459 | ||||||||||||||||
Net income | — | — | 394,612 | — | 368 | 394,980 | |||||||||||||||||
Other comprehensive income, net of tax | — | — | — | 19,598 | 312 | 19,910 | |||||||||||||||||
Stock-based compensation and dividends, net | 4 | 55,278 | (93 | ) | — | — | 55,189 | ||||||||||||||||
Employee stock purchase plan | — | 2,062 | — | — | — | 2,062 | |||||||||||||||||
Reclassification to temporary equity | — | (506 | ) | (23,339 | ) | — | — | (23,845 | ) | ||||||||||||||
Repurchase of common stock | — | (41,059 | ) | (2,923 | ) | — | — | (43,982 | ) | ||||||||||||||
Reclassification from temporary equity in connection with initial public offering (Note 1) | — | 351,185 | (28,200 | ) | — | — | 322,985 | ||||||||||||||||
Issuance of Class A common stock in connection with initial public offering (Note 1) | 14 | 234,569 | — | — | — | 234,583 | |||||||||||||||||
Cancel liability-settled awards and replace with equity-settled awards in connection with initial public offering (Note 1) | — | 56,130 | — | — | — | 56,130 | |||||||||||||||||
Cash dividends paid | — | — | (113,914 | ) | — | — | (113,914 | ) | |||||||||||||||
Balance at November 24, 2019 | $ | 394 | $ | 657,659 | $ | 1,310,464 | $ | (404,986 | ) | $ | 8,026 | $ | 1,571,557 | ||||||||||
The accompanying notes are an integral part of these consolidated financial statements.
71
LEVI STRAUSS & CO. AND SUBSIDIARIES
CONSOLIDATED STATEMENTS OF CASH FLOWS
Year Ended | |||||||||||
November 24, 2019 | November 25, 2018 | November 26, 2017 | |||||||||
(Dollars in thousands) | |||||||||||
Cash Flows from Operating Activities: | |||||||||||
Net income | $ | 394,980 | $ | 285,244 | $ | 284,556 | |||||
Adjustments to reconcile net income to net cash provided by operating activities: | |||||||||||
Depreciation and amortization | 123,942 | 120,205 | 117,387 | ||||||||
Unrealized foreign exchange losses (gains) | 11,721 | (30,804 | ) | 24,731 | |||||||
Realized (gain) loss on settlement of forward foreign exchange contracts not designated for hedge accounting | (12,166 | ) | 19,974 | 5,773 | |||||||
Employee benefit plans’ amortization from accumulated other comprehensive loss and settlement losses | 10,248 | 4,336 | 30,125 | ||||||||
Loss on extinguishment of debt, net of write-off of unamortized debt issuance costs | — | — | 22,793 | ||||||||
Stock-based compensation | 55,188 | 18,407 | 25,809 | ||||||||
(Benefit from) provision for deferred income taxes | (14,963 | ) | 134,258 | (486 | ) | ||||||
Other, net | 7,034 | 7,395 | 8,005 | ||||||||
Change in operating assets and liabilities: | |||||||||||
Trade receivables | (82,344 | ) | (60,474 | ) | 3,981 | ||||||
Inventories | (22,434 | ) | (147,389 | ) | (14,409 | ) | |||||
Other current assets | (22,102 | ) | (30,870 | ) | 1,828 | ||||||
Other non-current assets | (21,662 | ) | (3,189 | ) | (6,862 | ) | |||||
Accounts payable and other accrued liabilities | 18,054 | 161,039 | 35,714 | ||||||||
Restructuring liabilities | (256 | ) | (420 | ) | (4,274 | ) | |||||
Income tax liabilities | 9,352 | (8,590 | ) | 2,478 | |||||||
Accrued salaries, wages and employee benefits and long-term employee related benefits | (55,363 | ) | (44,887 | ) | (9,408 | ) | |||||
Other long-term liabilities | 12,959 | (3,864 | ) | (1,800 | ) | ||||||
Net cash provided by operating activities | 412,188 | 420,371 | 525,941 | ||||||||
Cash Flows from Investing Activities: | |||||||||||
Purchases of property, plant and equipment | (175,356 | ) | (159,413 | ) | (118,618 | ) | |||||
Proceeds (payments) on settlement of forward foreign exchange contracts not designated for hedge accounting | 12,166 | (19,974 | ) | (5,773 | ) | ||||||
Payments to acquire short-term investments | (114,247 | ) | — | — | |||||||
Proceeds from sale, maturity and collection of short-term investments | 34,094 | — | — | ||||||||
Net cash used for investing activities | (243,343 | ) | (179,387 | ) | (124,391 | ) | |||||
Cash Flows from Financing Activities: | |||||||||||
Proceeds from issuance of long-term debt | — | — | 502,835 | ||||||||
Repayments of long-term debt | — | — | (525,000 | ) | |||||||
Proceeds from short-term credit facilities | 39,175 | 31,929 | 35,333 | ||||||||
Repayments of short-term credit facilities | (53,025 | ) | (28,230 | ) | (29,764 | ) | |||||
Other short-term borrowings, net | (9,418 | ) | (4,977 | ) | (6,231 | ) | |||||
Payment of debt extinguishment costs | — | — | (21,902 | ) | |||||||
Payment of debt issuance costs | — | — | (10,366 | ) | |||||||
Proceeds from issuance of Class A common stock | 254,329 | — | — | ||||||||
Payments for underwriter commission and other offering costs | (19,746 | ) | — | — | |||||||
Proceeds from purchases of stock under employee stock purchase plan | 2,062 | — | — | ||||||||
Repurchase of common stock, including shares surrendered for tax withholdings on equity exercises | (43,982 | ) | (56,039 | ) | (25,102 | ) | |||||
Dividend to stockholders | (113,914 | ) | (90,000 | ) | (70,000 | ) | |||||
Other financing, net | (463 | ) | (1,316 | ) | (1,632 | ) | |||||
Net cash provided by (used for) financing activities | 55,018 | (148,633 | ) | (151,829 | ) | ||||||
Effect of exchange rate changes on cash and cash equivalents and restricted cash | (2,808 | ) | (13,344 | ) | 8,417 | ||||||
Net increase in cash and cash equivalents and restricted cash | 221,055 | 79,007 | 258,138 | ||||||||
Beginning cash and cash equivalents, and restricted cash | 713,698 | 634,691 | 376,553 | ||||||||
Ending cash and cash equivalents, and restricted cash | 934,753 | 713,698 | 634,691 | ||||||||
Less: Ending restricted cash | (516 | ) | (578 | ) | (1,069 | ) | |||||
Ending cash and cash equivalents | $ | 934,237 | $ | 713,120 | $ | 633,622 | |||||
Noncash Investing Activity: | |||||||||||
Property, plant and equipment acquired and not yet paid at end of period | $ | 30,512 | $ | 23,099 | $ | 22,664 | |||||
Property, plant and equipment additions due to build-to-suit lease transactions | 10,861 | 2,750 | 19,888 | ||||||||
Supplemental disclosure of cash flow information: | |||||||||||
Cash paid for interest during the period | $ | 54,000 | $ | 51,200 | $ | 52,097 | |||||
Cash paid for income taxes during the period, net of refunds | 96,540 | 96,277 | 54,602 | ||||||||
The accompanying notes are an integral part of these consolidated financial statements.
72
LEVI STRAUSS & CO. AND SUBSIDIARIES
NOTES TO CONSOLIDATED FINANCIAL STATEMENTS
FOR THE YEARS ENDED NOVEMBER 24, 2019, NOVEMBER 25, 2018 AND NOVEMBER 26, 2017
NOTE 1: SIGNIFICANT ACCOUNTING POLICIES
Nature of Operations
Levi Strauss & Co. (the "Company") is one of the world’s largest brand-name apparel companies. The Company designs, markets and sells – directly or through third parties and licensees – products that include jeans, casual and dress pants, tops, shorts, skirts, jackets, footwear and related accessories, for men, women and children around the world under the Levi’s®, Dockers®, Signature by Levi Strauss & Co.™ and Denizen® brands. The Company operates its business through three geographic regions: Americas, Europe and Asia.
Basis of Presentation and Principles of Consolidation
The consolidated financial statements of the Company and its wholly-owned and majority-owned foreign and domestic subsidiaries are prepared in conformity with generally accepted accounting principles in the United States ("U.S. GAAP"). All significant intercompany balances and transactions have been eliminated.
The Company’s fiscal year ends on the last Sunday of November in each year, although the fiscal years of certain foreign subsidiaries end on November 30. Fiscal years 2019, 2018 and 2017 were 52-week years, ending on November 24, 2019, November 25, 2018 and November 26, 2017, respectively. Each quarter of fiscal years 2019, 2018 and 2017 consisted of 13 weeks. All references to years relate to fiscal years rather than calendar years.
Out-of-period Adjustments
For the year ended November 26, 2017, the Company's results include an out-of-period adjustment, which increased selling, general and administrative expenses by $8.3 million and decreased net income by $5.1 million. Basic and diluted earnings per common share attributable to common stockholders both decreased by $0.01 per share. This item, which originated in prior years, relates to the correction of the periods used for the recognition of stock-based compensation expense associated with employees eligible to vest in awards after retirement. The Company has evaluated the effects of this out-of-period adjustment, both qualitatively and quantitatively, and concluded that the correction of this amount was not material to the 2017 period or the periods in which they originated, including quarterly reporting.
Stock Split
On February 12, 2019, the Company’s stockholders approved an amendment to the Company’s certificate of incorporation (the "Amendment") to effect a ten-for-one stock split of shares of the Company’s outstanding common stock, such that each share of common stock, $0.01 par value, became ten shares of common stock, $0.001 par value per share. In addition, the Amendment increased the number of authorized shares of the Company's common stock by 930,000,000 to 1,200,000,000. The Amendment became effective on March 4, 2019 when filed with the Secretary of State of the State of Delaware. All share and per-share data in the consolidated financial statements and notes has been retroactively adjusted to reflect the stock split for all periods presented.
Initial Public Offering
In March 2019, the Company completed its IPO in which it issued and sold 14,960,557 shares of Class A common stock at a public offering price of $17.00 per share. The Company received net proceeds of $234.6 million after deducting underwriting discounts and commissions of $13.6 million and other direct and incremental offering expenses of $6.1 million. The Company agreed to pay all underwriting discounts and commissions applicable to the sales of shares of Class A common stock by the selling stockholders. This amount, $24.9 million, was paid at completion of the IPO in March 2019 and was recorded as non-operating expense in the second quarter of 2019. Additionally, the Company incurred $3.5 million of other costs associated with the IPO that were recorded in selling, general and administrative expenses ("SG&A").
In connection with the IPO, on March 19, 2019 the Company's Board of Directors approved the cancellation of the majority of the outstanding unvested cash-settled restricted stock units ("RSU's") and their concurrent replacement with similar equity-settled RSUs ("Replacement Awards"), pursuant to the Company's 2016 Equity Incentive Plan (the "2016 Plan"). RSUs for certain foreign affiliates will continue to be cash-settled. Other than the form of settlement, all other terms of the awards (including their vesting schedules) are the same. Prior to this modification, the cash-settled awards were classified as liabilities
73
LEVI STRAUSS & CO. AND SUBSIDIARIES
NOTES TO CONSOLIDATED FINANCIAL STATEMENTS — (continued)
FOR THE YEARS ENDED NOVEMBER 24, 2019, NOVEMBER 25, 2018 AND NOVEMBER 26, 2017
and stock-based compensation expense was measured using the fair value at the end of each reporting period. After the modification, the stock-based compensation expense for these awards was measured using the modification date fair value. As a result of the modification, accrued stock-based compensation expense of $45.8 million and $10.3 million were reclassified on the Company's consolidated balance sheets from accrued salaries, wages and employee benefits and other long-term liabilities, respectively, to additional paid in capital. Refer to Note 11 for more information.
Prior to the IPO, the holders of shares issued under the 2016 Plan could require the Company to repurchase such shares at the then-current market value pursuant to a contractual put right. Equity-classified stock-based awards that may be settled in cash at the option of the holder were presented on the Company's consolidated balance sheets outside of permanent equity. Accordingly, temporary equity on the Company's consolidated balance sheets included the redemption value of these awards generally related to the elapsed service period since the grant date reflecting patterns of compensation cost recognition, as well as the fair value of the Company's common stock issued pursuant to the 2016 Plan. Upon the completion of the IPO in the second quarter of 2019, this contractual put right was terminated and these awards are no longer presented as temporary equity. As a result, the balance in temporary equity as of immediately prior to the IPO of $351.2 million was reclassified to additional paid in capital. Refer to Note 11 for more information.
On February 12, 2019, the Company’s stockholders also approved the adoption of an amended and restated certificate of incorporation (the "IPO Certificate") and amended and restated bylaws. The IPO Certificate provides for two classes of common stock: Class A common stock, par value $0.001 per share, and Class B common stock, par value $0.001 per share. All common stock outstanding at the time of the IPO converted automatically into Class B common stock, each having ten votes per share. Shares of Class A common stock, each having one vote per share, were sold in the IPO. Shares of Class B common stock sold by selling stockholders in the IPO automatically converted into shares of Class A common stock in connection with such sale. Holders of Class B common stock can voluntarily convert their shares into Class A common stock if and when they wish to do so in order to sell their shares to the public.
On February 12, 2019, the Company’s stockholders approved the Company's 2019 Equity Incentive Plan (the "2019 Plan") and the Company's 2019 Employee Stock Purchase Plan (the "2019 ESPP"), each of which became effective on March 20, 2019, the effective date of the IPO registration statement. The maximum number of shares of the Company’s Class A common stock that may be issued under the 2019 Plan is 40,000,000. The 2019 ESPP authorizes the issuance of 12,000,000 shares of the Company’s Class A common stock and is subject to automatic annual increases.
Use of Estimates
The preparation of financial statements in conformity with U.S. GAAP requires management to make estimates and assumptions that affect the amounts reported in the consolidated financial statements and the related notes to the consolidated financial statements. Estimates are based upon historical factors, current circumstances and the experience and judgment of the Company’s management. Management evaluates its estimates and assumptions on an ongoing basis and may employ outside experts to assist in its evaluations. Changes in such estimates, based on more accurate future information, or different assumptions or conditions, may affect amounts reported in future periods.
Cash and Cash Equivalents
The Company considers all highly liquid investments with an original maturity of three months or less to be cash equivalents. Cash equivalents are stated at fair value.
Derivative Instruments and Hedging Activities
The Company records all derivatives on the balance sheet at fair value, which are included in "Other current assets", "Other non-current assets", "Other accrued liabilities" or "Other long-term liabilities" on the Company’s consolidated balance sheets. The portion of the fair value that represents cash flow occurring within one year are classified as current and the portion related to cash flows occurring beyond one year are classified as non-current. The cash flows from the designated derivative instruments used as hedges are classified in the Company's consolidated statements of cash flows in the same section as the cash flows of the hedged item.
74
LEVI STRAUSS & CO. AND SUBSIDIARIES
NOTES TO CONSOLIDATED FINANCIAL STATEMENTS — (continued)
FOR THE YEARS ENDED NOVEMBER 24, 2019, NOVEMBER 25, 2018 AND NOVEMBER 26, 2017
Cash Flow Hedges
The Company's cash flow hedges are recorded in "Other comprehensive income" and are not reclassified to earnings until the related net investment position has been liquidated. For foreign exchange forward contracts accounted for as cash flow hedges, the ineffective portion (if any) will not be separately recorded. The classification of effective hedge results on the Company's consolidated statements of income is the same as that of the underlying exposure. For foreign exchange risk cash flow hedges, forward points are excluded from the assessment of hedge effectiveness and are recognized in "Net Revenues" or "Costs of goods sold" on a straight-line basis over the life of the contract. In each accounting period, differences between the change in fair value of the forward points and the amount recognized on a straight-line basis is recognized in "Other comprehensive income".
Net Investment Hedges
The Company designates certain non-derivative instruments as net investment hedges to hedge the Company's net investment position in certain of its foreign subsidiaries. For these instruments, the Company documents the hedge designation by identifying the hedging instrument, the nature of the risk being hedged and the approach for measuring hedge effectiveness. The ineffective portions of these hedges are recorded in "Other income (expense), net" in the Company's consolidated statements of income. The effective portions of these hedges are recorded in "Accumulated other comprehensive loss" on the Company's consolidated balance sheets and are not reclassified to earnings until the related net investment position has been liquidated.
No Hedging Designation
The Company may also enter into derivative instruments that are not designated as hedges and do not qualify for hedge accounting. For derivatives not designated for hedge accounting, changes in the fair value are recorded in "Other expense, net" in the Company’s consolidated statements of income.
The Company's foreign currency management objective is to minimize the effect of fluctuations in foreign exchange rates on nonfunctional currency cash flows and selected assets or liabilities without exposing the Company to additional risk associated with transactions that could be regarded as speculative. The Company manages certain forecasted foreign currency exposures and uses a centralized currency management operation to take advantage of potential opportunities to naturally offset foreign currency exposures against each other.
Accounts Receivable, Net
The Company extends credit to its customers that satisfy pre-defined credit criteria. Accounts receivable are recorded net of an allowance for doubtful accounts. The Company estimates the allowance for doubtful accounts based upon an analysis of the aging of accounts receivable at the date of the consolidated financial statements, assessments of collectability based on historic trends, customer-specific circumstances, and an evaluation of economic conditions. Actual write-off of receivables may differ from estimates due to changes in customer and economic circumstances.
Inventory Valuation
The Company values inventories at the lower of cost or net realizable value. Inventory cost is determined using the first-in first-out method. The Company includes product costs, labor and related overhead, inbound freight, internal transfers, and the cost of operating its remaining manufacturing facilities, including the related depreciation expense, in the cost of inventories. The Company estimates quantities of slow-moving and obsolete inventory, by reviewing on-hand quantities, outstanding purchase obligations and forecasted sales. The Company determines inventory net realizable value by estimating expected selling prices based on the Company's historical recovery rates for slow-moving and obsolete inventory and other factors, such as market conditions, expected channel of distribution and current consumer preferences.
Income Tax
Significant judgment is required in determining the Company's worldwide income tax provision. In the ordinary course of a global business, there are many transactions and calculations where the ultimate tax outcome is uncertain. Some of these
75
LEVI STRAUSS & CO. AND SUBSIDIARIES
NOTES TO CONSOLIDATED FINANCIAL STATEMENTS — (continued)
FOR THE YEARS ENDED NOVEMBER 24, 2019, NOVEMBER 25, 2018 AND NOVEMBER 26, 2017
uncertainties arise from examinations in various jurisdictions and assumptions and estimates used in evaluating the need for valuation allowances.
The Tax Cuts and Jobs Act (the "Tax Act") was enacted in the United States on December 22, 2017 and includes, among other items, a reduction in the federal corporate income tax rate from 35% to 21% and a deemed repatriation of foreign earnings. The Company is required to recognize the effect of the tax law changes in the period of enactment, such as determining the transition tax, remeasuring the Company's U.S. deferred tax assets and liabilities and reassessing the net realizability of the Company's deferred tax assets and liabilities.
The Company is subject to income taxes in both the United States and numerous foreign jurisdictions. The Company computes its provision for income taxes using the asset and liability method, under which deferred tax assets and liabilities are recognized for the expected future tax consequences of temporary differences between the financial reporting and tax bases of assets and liabilities and for operating loss and tax credit carryforwards. All deferred income taxes are classified as non-current on the Company's consolidated balance sheets. Deferred tax assets and liabilities are measured using the currently enacted tax rates that are expected to apply to taxable income for the years in which those tax assets and liabilities are expected to be realized or settled. Significant judgments are required in order to determine the realizability of these deferred tax assets. In assessing the need for a valuation allowance, the Company's management evaluates all significant available positive and negative evidence, including historical operating results, estimates of future taxable income and the existence of prudent and feasible tax planning strategies.
The Company continuously reviews issues raised in connection with all ongoing examinations and open tax years to evaluate the adequacy of its tax liabilities. The Company evaluates uncertain tax positions under a two-step approach. The first step is to evaluate the uncertain tax position for recognition by determining if the weight of available evidence indicates that it is more likely than not that the position will be sustained upon examination based on its technical merits. The second step, for those positions that meet the recognition criteria, is to measure the tax benefit as the largest amount that is more than fifty percent likely to be realized. The Company believes that its recorded tax liabilities are adequate to cover all open tax years based on its assessment. This assessment relies on estimates and assumptions and involves significant judgments about future events. To the extent that the Company's view as to the outcome of these matters change, the Company will adjust income tax expense in the period in which such determination is made. The Company classifies interest and penalties related to income taxes as income tax expense.
Property, Plant and Equipment
Property, plant and equipment are carried at cost, less accumulated depreciation. The cost is depreciated on a straight-line basis over the estimated useful lives of the related assets. Costs relating to internal-use software development are capitalized when incurred during the application development phase. Buildings are depreciated over 20 to 40 years, and leasehold improvements are depreciated over the lesser of the life of the improvement or the initial lease term. Buildings and leasehold improvements includes build-to-suit assets related to the construction of a building or leasehold improvement (generally on property owned by the landlord) when the Company concludes it has substantially all of the risks of ownership during construction of a leased property and therefore is deemed the owner of the project. Accordingly, the Company recorded an asset representing the total costs of the buildings and improvements, including the costs paid by the lessor (the legal owner of the buildings), with corresponding liabilities. Upon completion of construction of each building, the Company did not meet the sale-leaseback criteria for de-recognition of the building assets and liabilities. Therefore the leases are accounted for as lease financing obligations. See Note 13 "Commitments and Contingencies". The related financing obligation is recorded in "other long-term liabilities". Machinery and equipment includes furniture and fixtures, automobiles and trucks, and networking communication equipment, and is depreciated over a range from three to 20 years. Capitalized internal-use software is depreciated over periods ranging from three to seven years.
Goodwill and Other Intangible Assets
Goodwill resulted primarily from a 1985 acquisition of the Company by Levi Strauss Associates Inc., a former parent company that was subsequently merged into the Company in 1996, and the Company's 2009 acquisitions. Goodwill is not amortized. Intangible assets are comprised of owned trademarks with indefinite useful lives which are not amortized and acquired contractual rights.
76
LEVI STRAUSS & CO. AND SUBSIDIARIES
NOTES TO CONSOLIDATED FINANCIAL STATEMENTS — (continued)
FOR THE YEARS ENDED NOVEMBER 24, 2019, NOVEMBER 25, 2018 AND NOVEMBER 26, 2017
Impairment
The Company reviews its goodwill and other non-amortized intangible assets for impairment annually in the fourth quarter of its fiscal year, or more frequently as warranted by events or changes in circumstances which indicate that the carrying amount may not be recoverable. The Company qualitatively assesses goodwill and non-amortized intangible assets to determine whether it is more likely than not that the fair value of a reporting unit or other non-amortized intangible asset is less than its carrying amount. During 2019, 2018 and 2017, the Company performed this analysis by examining key events and circumstances affecting fair value and determined it is more likely than not that the reporting unit's fair value is greater than its carrying amount. As such, no further analysis was required for purposes of testing of the Company’s goodwill or other non-amortized intangible asset for impairment.
If goodwill is not qualitatively assessed or if goodwill is qualitatively assessed and it is determined it is not more likely than not that the reporting unit's fair value is greater than its carrying amount, a two-step quantitative approach is utilized. In the first step, the Company compares the carrying value of the reporting unit or applicable asset to its fair value, which the Company estimates using a discounted cash flow analysis or by comparison with the market values of similar assets. If the carrying amount of the reporting unit or asset exceeds its estimated fair value, the Company performs the second step, and determines the impairment loss, if any, as the excess of the carrying value of the goodwill or intangible asset over its fair value.
The Company reviews its other long-lived assets for impairment whenever events or changes in circumstances indicate the carrying amount of an asset may not be recoverable. If the carrying amount of an asset exceeds the expected future undiscounted cash flows, the Company measures and records an impairment loss for the excess of the carrying value of the asset over its fair value.
To determine the fair value of impaired assets, the Company utilizes the valuation technique or techniques deemed most appropriate based on the nature of the impaired asset and the data available, which may include the use of quoted market prices, prices for similar assets or other valuation techniques such as discounted future cash flows or earnings.
Debt Issuance Costs
The Company capitalizes debt issuance costs on its senior revolving credit facility, which are included in "Other non-current assets" on the Company's consolidated balance sheets. Capitalized debt issuance costs on the Company's unsecured long-term debt are presented as a reduction to the debt outstanding on the Company's consolidated balance sheets. The unsecured long-term debt issuance costs are generally amortized utilizing the effective interest method whereas the senior revolving credit facility issuance costs are amortized utilizing the straight-line method. Amortization of debt issuance costs is included in "Interest expense" in the consolidated statements of income.
Deferred Rent
The Company is obligated under operating leases of property for manufacturing, finishing and distribution facilities, office space, retail stores and equipment. Rental expense relating to operating leases are recognized on a straight-line basis over the lease term after consideration of lease incentives and scheduled rent escalations beginning as of the date the Company takes physical possession or control of the property. Differences between rental expense and actual rental payments are recorded as deferred rent liabilities included in "Other accrued liabilities" and "Other long-term liabilities" on the consolidated balance sheets.
Fair Value of Financial Instruments
The fair values of the Company's financial instruments reflect the amounts that would be received to sell an asset or paid to transfer a liability in an orderly transaction between market participants at the measurement date (exit price). The fair value estimates presented in these financial statements are based on information available to the Company as of November 24, 2019 and November 25, 2018.
The carrying values of cash and cash equivalents, trade receivables and short-term borrowings approximate fair value since they are short term in nature. The Company has estimated the fair value of its other financial instruments using the market and income approaches. Rabbi trust assets and forward foreign exchange contracts are carried at their fair values. The Company's
77
LEVI STRAUSS & CO. AND SUBSIDIARIES
NOTES TO CONSOLIDATED FINANCIAL STATEMENTS — (continued)
FOR THE YEARS ENDED NOVEMBER 24, 2019, NOVEMBER 25, 2018 AND NOVEMBER 26, 2017
debt instruments are carried at historical cost and adjusted for amortization of premiums, discounts, or deferred financing costs, foreign currency fluctuations and principal payments.
Pension and Postretirement Benefits
The Company has several non-contributory defined benefit retirement plans covering eligible employees. The Company also provides certain health care benefits for U.S. employees who meet age, participation and length of service requirements at retirement. In addition, the Company sponsors other retirement or post-employment plans for its foreign employees in accordance with local government programs and requirements. The Company retains the right to amend, curtail or discontinue any aspect of the plans, subject to local regulations.
The Company recognizes either an asset or a liability for any plan's funded status in its consolidated balance sheets. The Company measures changes in funded status using actuarial models which utilize an attribution approach that generally spreads individual events over the estimated service lives of the remaining employees in the plan. For plans where participants will not earn additional benefits by rendering future service, which includes the Company's U.S. plans, individual events are spread over the plan participants' estimated remaining lives. The Company's policy is to fund its retirement plans based upon actuarial recommendations and in accordance with applicable laws, income tax regulations and credit agreements. Net pension and postretirement benefit income or expense is generally determined using assumptions which include expected long-term rates of return on plan assets, discount rates, compensation rate increases and medical and mortality trend rates. The Company considers several factors including historical rates, expected rates and external data to determine the assumptions used in the actuarial models.
Employee Incentive Compensation
The Company maintains short-term and long-term employee incentive compensation plans. Provisions for employee incentive compensation are recorded in "Accrued salaries, wages and employee benefits" and "Long-term employee related benefits" on the Company's consolidated balance sheets. The Company accrues the related compensation expense over the period of the plan and changes in the liabilities for these incentive plans generally correlate with the Company's financial results and projected future financial performance.
Stock-Based Compensation
The Company has stock-based incentive plans which allow for the issuance of cash or equity-settled awards to certain employees and non-employee directors. The Company recognizes stock-based compensation expense for share-based awards that are classified as equity based on the grant date fair value of the awards over the requisite service period, adjusted for estimated forfeitures. The cash-settled awards are classified as liabilities and stock-based compensation expense is measured using fair value at the end of each reporting period until settlement.
As of November 24, 2019, the fair value of the shares of the Company's common stock has been determined on market prices. Prior to the IPO, on March 19, 2019, the fair value of the common stock was determined by the Company's board of directors (the "Board"). As there was no public market for the Company’s common stock, the Board determined the fair value of the common stock on the stock option grant date by considering a number of objective and subjective factors, including third-party valuations of the common stock, comparisons of the Company's financial results against selected publicly-traded companies and application of a discount for the illiquidity of the stock to derive the fair value of the stock.
For stock appreciation rights that are classified as equity, the Company uses the Black-Scholes valuation model to estimate the grant date fair value. The grant date fair value of equity-classified restricted stock units that are not subject to a market condition, is based on the fair value of the Company's common stock on the date of grant, adjusted to reflect the absence of dividends for those awards that are not entitled to dividend equivalents. For restricted stock units that include a market condition, the Company uses a Monte Carlo simulation valuation model to estimate the grant date fair value. For share-based awards that are classified as liabilities, the fair value of the awards is estimated using the intrinsic value method, which is based on the Company's common stock fair value on each measurement date.
The Black-Scholes option pricing model and the Monte Carlo simulation model require the input of highly subjective assumptions including volatility. The computation of expected volatility is based on the average of the historical and implied volatilities over the expected life of the awards, of a representative peer group of publicly-traded entities. Other assumptions
78
LEVI STRAUSS & CO. AND SUBSIDIARIES
NOTES TO CONSOLIDATED FINANCIAL STATEMENTS — (continued)
FOR THE YEARS ENDED NOVEMBER 24, 2019, NOVEMBER 25, 2018 AND NOVEMBER 26, 2017
include expected life, risk-free rate of interest and dividend yield. For equity awards with a service condition, the expected life is derived based on historical experience and expected future post-vesting termination and exercise patterns. For equity awards with a performance condition, the expected life is computed using the simplified method until historical experience is available. The risk-free interest rate is based on zero coupon U.S. Treasury bond rates corresponding to the expected life of the awards. Dividend assumptions are based on historical experience.
Due to the job function of the award recipients, the Company has included stock-based compensation cost in "Selling, general and administrative expenses" in the consolidated statements of income.
Self-Insurance
Up to certain limits, the Company self-insures various loss exposures primarily relating to workers' compensation risk and employee and eligible retiree medical health benefits. The Company carries insurance policies covering claim exposures which exceed predefined amounts, per occurrence and/or in the aggregate. Accruals for losses are made based on the Company's claims experience and actuarial assumptions followed in the insurance industry, including provisions for incurred but not reported losses.
Foreign Currency
The functional currency for most of the Company's foreign operations is the applicable local currency. For those operations, assets and liabilities are translated into U.S. Dollars using period-end exchange rates; income and expenses are translated at average monthly exchange rates; and equity accounts are translated at historical rates. Net changes resulting from such translations are recorded as a component of translation adjustments in "Accumulated other comprehensive loss" on the Company's consolidated balance sheets.
Foreign currency transactions are transactions denominated in a currency other than the entity's functional currency. At each balance sheet date, each entity remeasures the recorded balances related to foreign-currency transactions using the period-end exchange rate. Unrealized gains or losses arising from the remeasurement of these balances are recorded in "Other income (expense), net" in the Company's consolidated statements of income. In addition, at the settlement date of foreign currency transactions, the realized foreign currency gains or losses are recorded in "Other income (expense), net" in the Company's consolidated statements of income to reflect the difference between the rate effective at the settlement date and the historical rate at which the transaction was originally recorded.
Noncontrolling Interest
Noncontrolling interest includes a 16.4% minority interest of third parties in Levi Strauss Japan K.K., the Company's Japanese subsidiary ("LSJKK").
On January 9, 2020, the Company completed its all cash tender offer for the acquisition of the remaining 16.4% minority interest shares of Levi Strauss Japan common stock at a purchase price of ¥1,570 per share for a total purchase price of $13.6 million US dollars, plus transaction costs. As a result, Levi Strauss Japan has become a wholly owned subsidiary.
Revenue Recognition
Net sales includes sales within the wholesale and direct-to-consumer channels. Wholesale channel revenues includes sales to third-party retailers such as department stores, specialty retailers, third-party e-commerce sites and franchise locations dedicated to the Company's brands. The Company also sells products directly to consumers, which are reflected in the direct-to-consumer ("DTC") channel, through a variety of formats, including company-operated mainline and outlet stores, company-operated e-commerce sites and select shop-in-shops located in department stores and other third-party retail locations.
Revenue transactions generally comprise of a single performance obligation which consists of the sale of products to customers either through wholesale or direct-to-consumer channels. The Company satisfies the performance obligation and records revenues when transfer of control has passed to the customer, based on the terms of sale. Transfer of control passes to wholesale customers upon shipment or upon receipt depending on the agreement with the customer. Within the Company's DTC channel, control generally transfers to the customer at the time of sale within company-operated retail stores and upon delivery to the customer with respect to e-commerce transactions.
79
LEVI STRAUSS & CO. AND SUBSIDIARIES
NOTES TO CONSOLIDATED FINANCIAL STATEMENTS — (continued)
FOR THE YEARS ENDED NOVEMBER 24, 2019, NOVEMBER 25, 2018 AND NOVEMBER 26, 2017
Licensing revenues are included in the Company's wholesale channel and represent approximately 2% of total revenues which are recognized over time based on the contractual term with variable amounts recognized only when royalties exceed contractual minimum royalty guarantees.
Payment terms for wholesale transactions depend on the country of sale or agreement with the customer, and payment is generally required after shipment or receipt by the wholesale customer. Payment is due at the time of sale for retail store and e-commerce transactions.
Net sales to the Company's ten largest customers totaled 26%, 27% and 28% of net revenues for 2019, 2018 and 2017, respectively. No customer represented 10% or more of net revenues in any of these years.
Cost of Goods Sold
Cost of goods sold includes the expenses incurred to acquire and produce inventory for sale, including product costs, labor and related overhead, inbound freight, internal transfers, and the cost of operating the Company's remaining manufacturing facilities, including the related depreciation expense.
Selling, General and Administrative Expenses
Selling, general and administrative expenses ("SG&A") are primarily comprised of costs relating to advertising, marketing, selling, distribution, information technology and other corporate functions. Selling costs include, among other things, all occupancy costs associated with company-operated stores and with the Company's company-operated shop-in-shops located within department stores. The Company expenses advertising costs as incurred. For 2019, 2018 and 2017, total advertising expense was $399.3 million, $400.3 million and $323.3 million, respectively. Distribution costs include costs related to receiving and inspection at distribution centers, warehousing, shipping to the Company's customers, handling and certain other activities associated with the Company's distribution network. These expenses totaled $227.4 million, $208.8 million, and $173.4 million for 2019, 2018 and 2017, respectively.
Changes in Accounting Principles
• | In May 2014, the Financial Accounting Standards Board ("FASB") issued Accounting Standard Update ("ASU") 2014-09, Revenue from Contracts with Customers (Topic 606). ASU 2014-09 outlines a single comprehensive model for entities to use in accounting for revenue arising from contracts with customers. Under the new standard and its related amendments (collectively known as Accounting Standards Codification 606 ("ASC 606"), an entity recognizes revenue when its customer obtains control of promised goods or services, in an amount that reflects the consideration which the entity expects to receive in exchange for those goods or services. Enhanced disclosures are required regarding the nature, amount, timing and uncertainty of revenue and cash flows arising from contracts with customers. |
The Company has identified certain changes in balance sheet classification under ASC 606. Allowances for estimated returns, discounts and retailer promotions and other similar incentives are presented as other accrued liabilities rather than netted within accounts receivable and the estimated cost of inventory associated with allowances for estimated returns are included as other current assets rather than inventories. The Company adopted the standard as of November 26, 2018 using the modified retrospective approach and determined there is no impact to retained earnings upon adoption. Refer to Note 16 for more information.
80
LEVI STRAUSS & CO. AND SUBSIDIARIES
NOTES TO CONSOLIDATED FINANCIAL STATEMENTS — (continued)
FOR THE YEARS ENDED NOVEMBER 24, 2019, NOVEMBER 25, 2018 AND NOVEMBER 26, 2017
The following table presents the related effect of the adoption of Topic 606 on the Consolidated Balance Sheets:
November 24, 2019 | |||||||||||
As Reported | Remove Effect of Adoption | Balances Without Adoption of Topic 606 | |||||||||
(Dollars in thousands) | |||||||||||
Trade receivables, net of allowance for doubtful accounts | $ | 782,846 | $ | 171,113 | $ | 611,733 | |||||
Inventories: Finished goods | 875,944 | (16,444 | ) | 892,388 | |||||||
Other current assets | 188,170 | 16,444 | 171,726 | ||||||||
Total current assets | 2,870,186 | 171,113 | 2,699,073 | ||||||||
Total assets | 4,232,418 | 171,113 | 4,061,305 | ||||||||
Accrued sales allowances | 123,311 | 123,311 | — | ||||||||
Other accrued liabilities | 423,174 | 47,802 | 375,372 | ||||||||
Total current liabilities | 1,167,204 | 171,113 | 996,091 | ||||||||
Total liabilities, temporary equity and stockholders' equity | $ | 4,232,418 | $ | 171,113 | $ | 4,061,305 | |||||
• | In November 2016, the FASB issued ASU No. 2016-18, Statement of Cash Flows (Topic 230): Restricted Cash, which requires that restricted cash be included with cash and cash equivalents when reconciling the beginning-of-period and end-of-period total amounts shown in the statement of cash flows. Restricted cash is reported in Other non-current assets in the Company's Consolidated Balance Sheets. The Company adopted this standard in the first quarter of 2019, and other than the change in presentation within the Consolidated Statements of Cash Flows, the adoption of ASU 2016-18 did not have an impact on the Company's consolidated financial statements. |
• | In March 2017, the FASB issued ASU 2017-07, Compensation-Retirement Benefits (Topic 715) Improving the Presentation of Net Periodic Cost and Net Periodic Postretirement Benefit Cost. ASU 2017-07 changes the income statement presentation of net periodic benefit costs requiring separation between operating expense (service cost component) and non-operating expense (all other components, including interest cost, expected return on plan assets, amortization of prior service costs or credits, curtailments and settlements, actuarial gains and losses, etc.). Accordingly, the Company determined this impacts the Company's Consolidated Statements of Income, as the service cost components of net periodic benefit costs are reported within operating income and the other components of net periodic benefit costs are reported in the Other Income (Expense), Net line item. The presentation change in the Consolidated Statements of Income requires application on a retrospective basis. A practical expedient is permitted under the guidance which allows the Company to use information previously disclosed in the pension and other postretirement benefit plans footnote as the basis to apply the retrospective presentation requirements. As a result of the Company's adoption of this standard, other components of net periodic benefit costs, primarily interest costs and investment earnings, of $15.9 million, $3.4 million and $12.9 million for the year ended November 24, 2019, November 25, 2018 and November 26, 2017, respectively, were included in Other Income (Expense), Net line item rather than SG&A expenses in the Company's Consolidated Statements of Income. |
• | In August 2017, the FASB issued ASU 2017-12, Derivatives and Hedging (Topic 815) Targeted Improvements to Accounting for Hedging Activities. ASU 2017-12 refines and expands hedge accounting for both financial and commodity risks. This ASU creates more transparency around how economic results are presented, both on the face of the financial statements and in the footnotes. In addition, this ASU makes certain targeted improvements to simplify the application of hedge accounting guidance. The Company adopted this standard during the first quarter of 2019 upon entering into foreign exchange risk contracts designated as hedges. |
Recently Issued Accounting Standards
The following recently issued accounting standards, all of which are FASB Accounting Standards Updates ("ASU"), have been grouped by their required effective dates for the Company:
81
LEVI STRAUSS & CO. AND SUBSIDIARIES
NOTES TO CONSOLIDATED FINANCIAL STATEMENTS — (continued)
FOR THE YEARS ENDED NOVEMBER 24, 2019, NOVEMBER 25, 2018 AND NOVEMBER 26, 2017
First Quarter of 2020
• | In February 2016, the FASB issued ASU 2016-02, Leases (Topic 842), which requires the identification of arrangements that should be accounted for as leases by lessees. In general, for operating or financing lease arrangements exceeding a 12-month term, a right-of-use asset and a lease obligation will be recognized on the balance sheet of the lessee while the income statement will reflect lease expense for operating leases and amortization and interest expense for financing leases. The Company has identified leases for real estate, personal property and other arrangements. The new standard is required to be applied using a modified retrospective approach with two adoption methods permissible. The Company will elect the transition method that applies the new lease standard at the adoption date instead of the earliest period presented. The Company will elect the practical expedient to not separate lease components from nonlease components for all leases. Additionally, the Company will make an accounting policy election to keep leases with an initial 12-month term or less off of the balance sheet and recognize these lease payments within the consolidated statements of income on a straight-line basis over the term of the lease. The Company will elect the package of transition practical expedients which would allow the Company to carry forward prior conclusions related to: (i) whether any expired or existing contracts contain leases, (ii) the lease classification for any expired or existing leases and (iii) initial direct costs for existing leases. Based on our preliminary assessment, the Company anticipates upon adoption to recognize $1.0 billion to $1.2 billion of total operating lease liabilities and $0.9 billion to $1.1 billion of operating lease right-of-use assets, as well as remove $50 million to $60 million of existing deferred rent liabilities, which will be recorded as an offset against the right-of-use assets. In addition, the Company expects to remove $40 million to $50 million and $50 million to $60 million of existing assets and liabilities related to build-to-suit lease arrangements, respectively. The difference of nil to $20 million is expected to be recognized as the cumulative effect in retained earnings as of the date of initial application of the new lease standard. |
• | In February 2018, the FASB issued ASU 2018-02, Income Statement - Reporting Comprehensive Income (Topic 220). ASU 2018-02 addresses certain stranded income tax effects in accumulated other comprehensive income (loss) resulting from the Tax Act enacted on December 22, 2017. The guidance will be effective for the Company in the first quarter of fiscal 2020. The Company estimates the accumulated adjustment to retained earnings will be $50 million to $60 million with an offsetting adjustment to accumulated other comprehensive income (loss) upon adoption. |
First Quarter of 2021
• | In January 2017, the FASB issued ASU 2017-04, Intangibles-Goodwill and Other (Topic 350) Simplifying the Test for Goodwill Impairment. ASU 2017-04 eliminates the two-step process that required identification of potential impairment and a separate measure of the actual impairment. The annual assessment of goodwill impairment will be determined by using the difference between the carrying amount and the fair value of the reporting unit. The Company is currently assessing the impact that adopting this new accounting standard will have on its consolidated financial statements. |
• | In August 2018, the FASB issued ASU 2018-15, Intangibles - Goodwill and Other - Internal-Use Software (Subtopic 350-40). ASU 2018-15 aligns the requirements for capitalizing implementation costs incurred in a hosting arrangement that is a service contract with the requirements for capitalizing implementation costs incurred to develop or obtain internal use software (and hosting arrangements that include an internal-use software license). The guidance provides criteria for determining which implementation costs to capitalize as an asset related to the service contract and which costs to expense. The capitalized implementation costs are required to be expensed over the term of the hosting arrangement. The guidance also clarifies the presentation requirements for reporting such costs in the entity’s financial statements. Early adoption is permitted. The Company is currently evaluating the impact that adopting this new accounting standard will have on its consolidated financial statements and related disclosures. |
Fourth Quarter of 2021
• | In August 2018, the FASB issued ASU 2018-14, Compensation - Retirement Benefits - Defined Benefit Plans - General (Subtopic 715-20). ASU 2018-14 modifies the disclosure requirements for employers that sponsor defined |
82
LEVI STRAUSS & CO. AND SUBSIDIARIES
NOTES TO CONSOLIDATED FINANCIAL STATEMENTS — (continued)
FOR THE YEARS ENDED NOVEMBER 24, 2019, NOVEMBER 25, 2018 AND NOVEMBER 26, 2017
benefit pension or other postretirement plans. Early adoption is permitted. The Company is currently evaluating the impact that adopting this new accounting standard will have on its related disclosures.
NOTE 2: PROPERTY, PLANT AND EQUIPMENT
The components of property, plant and equipment ("PP&E") were as follows:
November 24, 2019 | November 25, 2018 | ||||||
(Dollars in thousands) | |||||||
Land | $ | 8,254 | $ | 8,197 | |||
Buildings and leasehold improvements | 516,239 | 466,256 | |||||
Machinery and equipment | 489,746 | 471,015 | |||||
Capitalized internal-use software | 511,927 | 453,943 | |||||
Construction in progress | 57,659 | 35,408 | |||||
Subtotal | 1,583,825 | 1,434,819 | |||||
Accumulated depreciation | (1,054,267 | ) | (974,206 | ) | |||
PP&E, net | $ | 529,558 | $ | 460,613 | |||
Depreciation expense for the years ended November 24, 2019, November 25, 2018, and November 26, 2017, was $123.9 million, $120.2 million and $117.4 million, respectively.
83
LEVI STRAUSS & CO. AND SUBSIDIARIES
NOTES TO CONSOLIDATED FINANCIAL STATEMENTS — (continued)
FOR THE YEARS ENDED NOVEMBER 24, 2019, NOVEMBER 25, 2018 AND NOVEMBER 26, 2017
NOTE 3: GOODWILL AND OTHER INTANGIBLE ASSETS
The changes in the carrying amount of goodwill by business segment for the years ended November 24, 2019 and November 25, 2018, were as follows:
Americas | Europe | Asia | Total | ||||||||||||
(Dollars in thousands) | |||||||||||||||
Balance, November 26, 2017 | $ | 207,765 | $ | 28,324 | $ | 1,238 | $ | 237,327 | |||||||
Foreign currency fluctuation | (34 | ) | (1,060 | ) | 13 | (1,081 | ) | ||||||||
Balance, November 25, 2018 | 207,731 | 27,264 | 1,251 | 236,246 | |||||||||||
Additions | — | — | 321 | 321 | |||||||||||
Foreign currency fluctuation | 18 | (729 | ) | (68 | ) | (779 | ) | ||||||||
Balance, November 24, 2019 | $ | 207,749 | $ | 26,535 | $ | 1,504 | $ | 235,788 | |||||||
Other intangible assets, net, were as follows:
November 24, 2019 | November 25, 2018 | ||||||||||||||||||||||
Gross Carrying Value | Accumulated Amortization | Total | Gross Carrying Value | Accumulated Amortization | Total | ||||||||||||||||||
(Dollars in thousands) | |||||||||||||||||||||||
Non-amortized intangible assets: | |||||||||||||||||||||||
Trademarks | $ | 42,743 | $ | — | $ | 42,743 | $ | 42,743 | $ | — | $ | 42,743 | |||||||||||
Amortized intangible assets: | |||||||||||||||||||||||
Acquired contractual rights | 448 | (409 | ) | 39 | 462 | (370 | ) | 92 | |||||||||||||||
Total | $ | 43,191 | $ | (409 | ) | $ | 42,782 | $ | 43,205 | $ | (370 | ) | $ | 42,835 | |||||||||
The amortization of these intangible assets in the years ended November 24, 2019, November 25, 2018 and November 26, 2017 is immaterial.
As of November 24, 2019, there was no impairment to the carrying value of the Company's goodwill or non-amortized intangible assets.
84
LEVI STRAUSS & CO. AND SUBSIDIARIES
NOTES TO CONSOLIDATED FINANCIAL STATEMENTS — (continued)
FOR THE YEARS ENDED NOVEMBER 24, 2019, NOVEMBER 25, 2018 AND NOVEMBER 26, 2017
NOTE 4: FAIR VALUE OF FINANCIAL INSTRUMENTS
The following table presents the Company’s financial instruments that are carried at fair value:
November 24, 2019 | November 25, 2018 | ||||||||||||||||||||||
Fair Value Estimated Using | Fair Value Estimated Using | ||||||||||||||||||||||
Fair Value | Level 1 Inputs(1) | Level 2 Inputs(2) | Fair Value | Level 1 Inputs(1) | Level 2 Inputs(2) | ||||||||||||||||||
(Dollars in thousands) | |||||||||||||||||||||||
Financial assets carried at fair value | |||||||||||||||||||||||
Rabbi trust assets | $ | 49,207 | $ | 49,207 | $ | — | $ | 34,385 | $ | 34,385 | $ | — | |||||||||||
Short-term investments in marketable securities | 80,741 | — | 80,741 | — | — | — | |||||||||||||||||
Derivative instruments(3) | 16,323 | — | 16,323 | 18,372 | — | 18,372 | |||||||||||||||||
Total | $ | 146,271 | $ | 49,207 | $ | 97,064 | $ | 52,757 | $ | 34,385 | $ | 18,372 | |||||||||||
Financial liabilities carried at fair value | |||||||||||||||||||||||
Derivative instruments(3) | 8,123 | — | 8,123 | 4,447 | — | 4,447 | |||||||||||||||||
Total | $ | 8,123 | $ | — | $ | 8,123 | $ | 4,447 | $ | — | $ | 4,447 | |||||||||||
_____________
(1) | Fair values estimated using Level 1 inputs are inputs which consist of quoted prices in active markets for identical assets or liabilities that the Company has the ability to access at the measurement date. Rabbi trust assets consist of a diversified portfolio of equity, fixed income and other securities. See Note 12 for more information on rabbi trust assets. |
(2) | Fair values estimated using Level 2 inputs are inputs, other than quoted prices, that are observable for the asset or liability, either directly or indirectly and include among other things, quoted prices for similar assets or liabilities in markets that are active or inactive as well as inputs other than quoted prices that are observable. For forward foreign exchange contracts, inputs include foreign currency exchange and interest rates and, where applicable, credit default swap prices. |
(3) | The Company’s cash flow hedges are subject to International Swaps and Derivatives Association, Inc. master agreements. These agreements permit the net settlement of these contracts on a per-institution basis. Refer to Note 5 for more information. |
The following table presents the carrying value, including related accrued interest, and estimated fair value of the Company’s financial instruments that are carried at adjusted historical cost:
November 24, 2019 | November 25, 2018 | ||||||||||||||
Carrying Value | Estimated Fair Value | Carrying Value | Estimated Fair Value | ||||||||||||
(Dollars in thousands) | |||||||||||||||
Financial liabilities carried at adjusted historical cost | |||||||||||||||
5.00% senior notes due 2025(1) | $ | 489,299 | $ | 505,757 | $ | 487,272 | $ | 478,774 | |||||||
3.375% senior notes due 2027(1) | 522,524 | 556,266 | 538,219 | 546,238 | |||||||||||
Short-term borrowings | 7,621 | 7,621 | 32,470 | 32,470 | |||||||||||
Total | $ | 1,019,444 | $ | 1,069,644 | $ | 1,057,961 | $ | 1,057,482 | |||||||
_____________
(1) | Fair values are estimated using Level 1 inputs and incorporate mid-market price quotes. Level 1 inputs are inputs which consist of quoted prices in active markets for identical liabilities that the Company has the ability to access at the measurement date. |
85
LEVI STRAUSS & CO. AND SUBSIDIARIES
NOTES TO CONSOLIDATED FINANCIAL STATEMENTS — (continued)
FOR THE YEARS ENDED NOVEMBER 24, 2019, NOVEMBER 25, 2018 AND NOVEMBER 26, 2017
NOTE 5: DERIVATIVE INSTRUMENTS AND HEDGING ACTIVITIES
Designated Cash Flow Hedges
The Company actively manages the risk of changes in functional currency equivalent cash flows resulting from anticipated non-functional currency denominated purchases and sales. The Company’s global sourcing organization uses the U.S. dollar as its functional currency and is primarily exposed to changes in functional currency equivalent cash flows from anticipated inventory purchases, as it procures inventory on behalf of subsidiaries with Euro functional currencies. Additionally, a European subsidiary uses Euros as its functional currency and is exposed to anticipated non-functional currency denominated sales. The Company manages these risks by using currency forward contracts formally designated and effective as cash flow hedges. Hedge effectiveness is generally determined by evaluating the ability of a hedging instrument's cumulative change in fair value to offset the cumulative change in the present value of expected cash flows on the underlying exposures. For forward contracts, forward points are excluded from the determination of hedge effectiveness and are included in current Cost of sales for hedges of anticipated inventory purchases and in Net Revenues for hedges of anticipated sales on a straight-line basis over the life of the contract. In each accounting period, differences between the change in fair value of the forward points and the amount recognized on a straight-line basis is recognized in other comprehensive income. There was no hedge ineffectiveness for the year ended November 24, 2019.
Net Investment Hedges
The Company has designated a portion of its outstanding Euro-denominated senior notes as a net investment hedge to manage foreign currency exposures in its foreign operations.
Non-designated Cash Flow Hedges
The Company enters into derivative instruments not designated as hedges. These derivative instruments are not speculative and are used to manage the Company’s exposure to certain product sourcing activities, some intercompany sales, foreign subsidiaries' royalty payments, interest payments, earnings repatriations, net investment in foreign operations and funding activities but the Company has not elected to apply hedge accounting. Changes in the fair value of derivatives not designated in hedging relationships are recorded directly in "Other income (expense), net" in the Company’s consolidated statements of income.
86
LEVI STRAUSS & CO. AND SUBSIDIARIES
NOTES TO CONSOLIDATED FINANCIAL STATEMENTS — (continued)
FOR THE YEARS ENDED NOVEMBER 24, 2019, NOVEMBER 25, 2018 AND NOVEMBER 26, 2017
As of November 24, 2019, the Company had forward foreign exchange contracts derivatives that were not designated as hedges in qualifying hedging relationships, of which $1.1 billion were contracts to buy and $135.6 million were contracts to sell various foreign currencies. These contracts are at various exchange rates and expire at various dates through February 2021.
The table below provides data about the carrying values of derivative instruments and non-derivative instruments:
November 24, 2019 | November 25, 2018 | ||||||||||||||||||||||
Assets | (Liabilities) | Derivative Net Carrying Value | Assets | (Liabilities) | Derivative Net Carrying Value | ||||||||||||||||||
Carrying Value | Carrying Value | Carrying Value | Carrying Value | ||||||||||||||||||||
(Dollars in thousands) | |||||||||||||||||||||||
Derivatives designated as hedging instruments | |||||||||||||||||||||||
Foreign exchange risk cash flow hedges(1) | $ | 6,149 | $ | — | $ | 6,149 | $ | — | $ | — | $ | — | |||||||||||
Foreign exchange risk cash flow hedges(2) | — | (3,809 | ) | (3,809 | ) | — | — | — | |||||||||||||||
Total | $ | 6,149 | $ | (3,809 | ) | $ | — | $ | — | ||||||||||||||
Derivatives not designated as hedging instruments | |||||||||||||||||||||||
Forward foreign exchange contracts(1) | $ | 16,323 | $ | (6,149 | ) | $ | 10,174 | $ | 18,372 | $ | — | $ | 18,372 | ||||||||||
Forward foreign exchange contracts(2) | 3,813 | (8,127 | ) | (4,314 | ) | — | (4,447 | ) | (4,447 | ) | |||||||||||||
Total | $ | 20,136 | $ | (14,276 | ) | $ | 18,372 | $ | (4,447 | ) | |||||||||||||
Non-derivatives designated as hedging instruments | |||||||||||||||||||||||
Euro senior notes | $ | — | $ | (525,255 | ) | $ | — | $ | (541,500 | ) | |||||||||||||
_____________
(1) | Included in "Other current assets" or "Other non-current assets" on the Company’s consolidated balance sheets. |
(2) | Included in "Other accrued liabilities" or "Other long-term liabilities" on the Company’s consolidated balance sheets. |
87
LEVI STRAUSS & CO. AND SUBSIDIARIES
NOTES TO CONSOLIDATED FINANCIAL STATEMENTS — (continued)
FOR THE YEARS ENDED NOVEMBER 24, 2019, NOVEMBER 25, 2018 AND NOVEMBER 26, 2017
The Company's over-the-counter forward foreign exchange contracts are subject to International Swaps and Derivatives Association, Inc. master agreements. These agreements permit the net-settlement of these contracts on a per-institution basis; however, the Company records the fair value on a gross basis on its consolidated balance sheets based on maturity dates, including those subject to master netting arrangements.
The table below presents the gross and net amounts of these contracts recognized on the Company's consolidated balance sheets by type of financial instrument:
November 24, 2019 | November 25, 2018 | |||||||||||||||||||||||
Gross Amounts of Assets / (Liabilities) Presented in the Balance Sheet | Gross Amounts Not Offset in the Balance Sheet | Net Amount of Assets / (Liabilities) | Gross Amounts of Assets / (Liabilities) Presented in the Balance Sheet | Gross Amounts Not Offset in the Balance Sheet | Net Amount of Assets / (Liabilities) | |||||||||||||||||||
(Dollars in thousands) | ||||||||||||||||||||||||
Foreign exchange risk contracts and forward foreign exchange contracts | ||||||||||||||||||||||||
Financial assets | $ | 21,839 | $ | (10,142 | ) | $ | 11,697 | $ | 16,417 | $ | (1,756 | ) | $ | 14,661 | ||||||||||
Financial liabilities | (16,290 | ) | 10,142 | (6,148 | ) | (2,181 | ) | 1,756 | (425 | ) | ||||||||||||||
Total | $ | 5,549 | $ | 14,236 | ||||||||||||||||||||
Embedded derivative contracts | ||||||||||||||||||||||||
Financial assets | $ | 4,446 | $ | — | $ | 4,446 | $ | 1,955 | $ | — | $ | 1,955 | ||||||||||||
Financial liabilities | (1,795 | ) | — | (1,795 | ) | (2,266 | ) | — | (2,266 | ) | ||||||||||||||
Total | $ | 2,651 | $ | (311 | ) | |||||||||||||||||||
The table below provides data about the amount of gains and losses related to derivative instruments and non-derivative instruments designated as net investment hedges included in "Accumulated other comprehensive loss" ("AOCI") on the Company’s consolidated balance sheets, and in "Other income (expense), net" in the Company’s consolidated statements of income:
Gain or (Loss) Recognized in AOCI (Effective Portion) | Amount of Gain (Loss) Reclassified from AOCI into Net Income(1) | ||||||||||||||||||
As of | As of | Year Ended | |||||||||||||||||
November 24, 2019 | November 25, 2018 | November 24, 2019 | November 25, 2018 | November 26, 2017 | |||||||||||||||
(Dollars in thousands) | |||||||||||||||||||
Foreign exchange risk contracts | $ | 2,781 | $ | — | $ | 3,418 | $ | — | $ | — | |||||||||
Realized forward foreign exchange swaps(2) | 4,637 | 4,637 | $ | — | $ | — | $ | — | |||||||||||
Yen-denominated Eurobonds | (19,811 | ) | (19,811 | ) | $ | — | $ | — | $ | — | |||||||||
Euro-denominated senior notes | (38,171 | ) | (54,416 | ) | $ | — | $ | — | $ | — | |||||||||
Cumulative income taxes | 25,606 | 29,703 | $ | — | $ | — | $ | — | |||||||||||
Total | $ | (24,958 | ) | $ | (39,887 | ) | |||||||||||||
_____________
(1) Amounts reclassified from AOCI were classified as net revenues or costs of goods sold on the consolidated statements of income.
(2) Prior to and during 2005, the Company used foreign exchange currency swaps to hedge the net investment in its foreign operations. For hedges that qualified for hedge accounting, the net gains were included in AOCI and are not reclassified to earnings until the related net investment position has been liquidated.
88
LEVI STRAUSS & CO. AND SUBSIDIARIES
NOTES TO CONSOLIDATED FINANCIAL STATEMENTS — (continued)
FOR THE YEARS ENDED NOVEMBER 24, 2019, NOVEMBER 25, 2018 AND NOVEMBER 26, 2017
Within the next 12 months, a $2.3 million gain from cash flow hedges are expected to be reclassified from AOCI into net income.
The table below presents the effects of the Company's cash flow hedges of foreign exchange risk contracts on the Consolidated Statements of Income for the year ended November 24, 2019:
Year ended | |||
November 24, 2019 | |||
(Dollars in thousands) | |||
Amount of Gain (Loss) on Cash Flow Hedge Activity: | |||
Revenues | $ | (3,908 | ) |
Cost of Goods Sold | $ | 7,326 | |
The table below provides data about the amount of gains and losses related to derivatives not designated as hedging instruments included in "Other income (expense), net" in the Company’s consolidated statements of income:
Year Ended | |||||||||||
November 24, 2019 | November 25, 2018 | November 26, 2017 | |||||||||
(Dollars in thousands) | |||||||||||
Forward foreign exchange contracts: | |||||||||||
Realized gain (loss)(1) | $ | 8,164 | $ | (19,974 | ) | $ | (5,773 | ) | |||
Unrealized (loss) gain (2) | (8,038 | ) | 31,141 | (35,394 | ) | ||||||
Total | $ | 126 | $ | 11,167 | $ | (41,167 | ) | ||||
_____________
(1) | The realized gain in 2019 is driven by gains on contracts to sell various currencies, mainly the Euro, as a result of the U.S. Dollar strengthening throughout the year against lower original contract rates. |
(2) | The unrealized loss in 2019 is driven by losses on contracts to sell various foreign currencies, mainly the Euro, as a result of the U.S. Dollar weakening against the original contract rates at year end. The gain in 2018 is primarily driven by gains on contracts to sell the Euro, the Mexican Peso and the British Pound, as a result of the U.S. Dollar strengthening at year end. The unrealized loss in 2017 is primarily driven by losses on contracts to sell the Mexican Peso, the Euro and the British Pound, as a result of the U.S. Dollar weakening at year end. |
89
LEVI STRAUSS & CO. AND SUBSIDIARIES
NOTES TO CONSOLIDATED FINANCIAL STATEMENTS — (continued)
FOR THE YEARS ENDED NOVEMBER 24, 2019, NOVEMBER 25, 2018 AND NOVEMBER 26, 2017
NOTE 6: DEBT
The following table presents the Company's debt:
November 24, 2019 | November 25, 2018 | ||||||
(Dollars in thousands) | |||||||
Long-term debt | |||||||
5.00% senior notes due 2025 | $ | 487,632 | $ | 485,605 | |||
3.375% senior notes due 2027 | 519,113 | 534,614 | |||||
Total long-term debt | $ | 1,006,745 | $ | 1,020,219 | |||
Short-term debt | |||||||
Short-term borrowings | 7,621 | 31,935 | |||||
Total debt | $ | 1,014,366 | $ | 1,052,154 | |||
Senior Revolving Credit Facility
The Company is a party to a Second Amended and Restated Credit Agreement that provides for a senior secured revolving credit facility. The credit facility is an asset-based facility, in which the borrowing availability is primarily based on the value of the U.S. Levi's® trademarks and the levels of certain eligible cash, accounts receivable and inventory in the United States and Canada.
Availability, interest and maturity. The maximum availability under the credit facility is $850.0 million, of which $800.0 million is available to the Company for revolving loans in U.S. Dollars and $50.0 million is available to the Company for revolving loans in either U.S. or Canadian Dollars. Subject to the availability under the borrowing base, the Company may make and repay borrowings from time to time until the maturity of the credit facility. The Company may make voluntary prepayments of borrowings at any time and must make mandatory prepayments if certain events occur. Of the maximum availability of $850.0 million, the U.S. Levi’s® trademarks are deemed to add the lesser of (i) $350.0 million and (ii) 65% of the net orderly liquidation value of such trademarks to the borrowing base. Upon the maturity date of May 23, 2022, all of the obligations outstanding under the credit facility become due. The interest rate for borrowings under the credit facility is LIBOR plus 125-175 basis points, depending on borrowing base availability, and the rate for undrawn availability is 20 basis points.
The Company’s unused availability under its amended and restated senior secured revolving credit facility was $819.5 million at November 24, 2019, as the Company’s total availability of $850.0 million, based on the collateral levels discussed above, was reduced by $28.0 million of stand-by letters of credit and by $2.5 million of other credit-related instruments. The Company has stand-by letters of credit with various international banks under the Company's credit facility serving as guarantees to cover U.S. workers' compensation claims and working capital requirements for certain subsidiaries, primarily in India.
The Second Amended and Restated Credit Agreement also provides that the Company may increase the availability under the Company's credit facility up to the greater of (i) $1.6 billion in the aggregate and (ii) an amount that would not cause the Company's secured leverage ratio (as defined in the Second Amended and Restated Credit Agreement) to exceed 3.25 to 1.00, in each case if certain conditions are met.
Guarantees and security. The Company's obligations under the Second Amended and Restated Credit Agreement are guaranteed by its domestic subsidiaries. The obligations under the Second Amended and Restated Credit Agreement are secured by specified domestic assets, including certain U.S. trademarks associated with the Levi's® brand and accounts receivable, goods and inventory in the United States. Additionally, the obligations of Levi Strauss & Co. (Canada) Inc. under the credit agreement are secured by Canadian accounts receivable, goods, inventory and other Canadian assets. The lien on the U.S. Levi's® trademarks and related intellectual property may be released at the Company's discretion subject to certain conditions, and such release would reduce the borrowing base.
90
LEVI STRAUSS & CO. AND SUBSIDIARIES
NOTES TO CONSOLIDATED FINANCIAL STATEMENTS — (continued)
FOR THE YEARS ENDED NOVEMBER 24, 2019, NOVEMBER 25, 2018 AND NOVEMBER 26, 2017
Covenants. The Second Amended and Restated Credit Agreement contains customary covenants restricting the Company's activities, as well as those of the Company's subsidiaries, including limitations on the ability to sell assets, engage in mergers, or other fundamental changes, enter into capital leases or certain leases not in the ordinary course of business, enter into transactions involving related parties or derivatives, incur or prepay indebtedness, grant liens or negative pledges on the Company's assets, make loans or other investments, pay dividends or repurchase stock or other securities, guarantee third-party obligations, engage in sale leasebacks and make changes in the Company's corporate structure. There are exceptions to these covenants, and some are only applicable when unused availability falls below specified thresholds. In addition, the Second Amended and Restated Credit Agreement includes, as a financial covenant, a springing fixed charge coverage ratio of 1.0 to 1.0, which arises when availability falls below a specified threshold.
Events of default. The Second Amended and Restated Credit Agreement contains customary events of default, including payment failures, breaches of representations and warranties, failure to comply with covenants, failure to satisfy other obligations under the credit agreements or related documents, defaults in respect of other indebtedness, bankruptcy, insolvency and inability to pay debts when due, material judgments, pension plan terminations or specified underfunding, substantial stock ownership changes, failure of certain provisions of any guarantee or security document supporting the Company's credit facility to be in full force and effect, change of control and specified changes in the composition of the Board. The cross-default provisions in the Second Amended and Restated Credit Agreement apply if a default occurs on other indebtedness of the Company or the guarantors in excess of $50.0 million and the applicable grace period in respect of the indebtedness has expired, such that the lenders of or trustee for the defaulted indebtedness have the right to accelerate. If an event of default occurs under the Second Amended and Restated Credit Agreement, subject to any applicable grace period, the lenders may terminate their commitments, declare immediately payable all borrowings under the credit facility and foreclose on the collateral.
Senior Notes due 2025
Principal, interest, and maturity. On April 27, 2015, the Company issued $500.0 million in aggregate principal amount of 5.00% senior notes due 2025 (the "Senior Notes due 2025") to qualified institutional buyers and to purchasers outside the United States, which were later exchanged for new notes in the same principal amount with substantially identical terms, except that the new notes were registered under the Securities Act of 1933, as amended (the "Securities Act"). The Senior Notes due 2025 will mature on May 1, 2025. Interest on the Senior Notes due 2025 is payable semi-annually in arrears on May 1 and November 1.
Ranking. The Senior Notes due 2025 are not guaranteed by any of the Company's subsidiaries and are unsecured obligations. Accordingly, they:
•rank equal in right of payment with all of the Company's other existing and future unsecured and unsubordinated debt;
• | rank senior in right of payment to the Company's future debt and other obligations that are, by their terms, expressly subordinated in right of payment to the Senior Notes due 2025; |
• | are effectively subordinated in right of payment to all of the Company's existing and future senior secured debt and other obligations (including the credit facility) to the extent of the value of the collateral securing such debt; and |
• | are structurally subordinated to all obligations of each of the Company's subsidiaries. |
Optional redemption. At any time prior to May 1, 2020, the Company may redeem some or all of the Senior Notes due 2025 at a price equal to 100% of the principal amount, plus accrued and unpaid interest, if any, to the date of redemption, and a "make-whole" premium. On or after May 1, 2020, the Company may redeem some or all of the Senior Notes due 2025, at once or over time, at redemption prices specified in the indenture governing the Senior Notes due 2025, plus accrued and unpaid interest, if any, to the date of redemption. The Company recorded a discount of $13.9 million in conjunction with the issuance of the Senior Notes due 2025, related to tender and redemption premiums paid to certain holders of the Senior Notes due 2020 who participated in the issuance of the Senior Notes due 2025, which will be amortized to interest expense over the term of the notes.
Mandatory redemption, Offer to Purchase and Open Market Purchases. The Company is not required to make any sinking fund payments with respect to the Senior Notes due 2025. However, under certain circumstances in the event of an asset sale or as described under "Change of Control" below, the Company may be required to offer to purchase the Senior Notes due 2025. The Company may from time to time purchase the Senior Notes due 2025 in the open market or otherwise.
91
LEVI STRAUSS & CO. AND SUBSIDIARIES
NOTES TO CONSOLIDATED FINANCIAL STATEMENTS — (continued)
FOR THE YEARS ENDED NOVEMBER 24, 2019, NOVEMBER 25, 2018 AND NOVEMBER 26, 2017
Covenants. The 2025 indenture contains covenants that limit, among other things, the Company’s and certain of the Company’s subsidiaries’ ability to incur additional debt, make certain restricted payments, consummate specified asset sales, enter into transactions with affiliates, and incur liens, and that, impose restrictions on the ability of its subsidiaries to pay dividends or make payments to the Company and its restricted subsidiaries, merge or consolidate with another person, and dispose of all or substantially all of the Company’s assets or its restricted subsidiaries' assets. The 2025 indenture provides for customary events of default (subject in certain cases to customary grace and cure periods), which include nonpayment of principal, premium or interest, breach of covenants in the 2025 indenture, payment defaults or acceleration of certain other indebtedness, a failure to pay certain judgments and certain events of bankruptcy and insolvency. Generally, if an event of default occurs, the trustee under the 2025 indenture or the holders of at least 25% in principal amount of the then outstanding Senior Notes due 2025 may declare all the Senior Notes due 2025 to be due and payable immediately.
Change of control. Upon the occurrence of a change in control (as defined in the 2025 indenture), each holder of the Senior Notes due 2025 may require us to repurchase all or a portion of the Senior Notes due 2025 in cash at a price equal to 101% of the principal amount of the Senior Notes due 2025 to be repurchased, plus accrued and unpaid interest, if any, to the date of purchase.
Senior Notes due 2027
Principal, interest and maturity. On February 28, 2017, the Company issued €475.0 million in aggregate principal amount of 3.375% senior notes due 2027 (the "Senior Notes due 2027") to qualified institutional buyers and to purchasers outside the United States, which were later exchanged for new notes in the same principal amount with substantially identical terms, except that the new notes were registered under the Securities Act. The Senior Notes due 2027 will mature on March 15, 2027. Interest on the Senior Notes due 2027 is payable semi-annually in arrears on March 15 and September 15.
Ranking. The Senior Notes due 2027 are not guaranteed by any of the Company's subsidiaries and are unsecured obligations. Accordingly, they:
• | rank equal in right of payment with all of the Company's other existing and future unsecured and unsubordinated debt; |
• | rank senior in right of payment to the Company's future debt and other obligations that are, by their terms, expressly subordinated in right of payment to the Senior Notes due 2027; |
• | are effectively subordinated in right of payment to all of the Company's existing and future senior secured debt and other obligations (including the credit facility) to the extent of the value of the collateral securing such debt; and |
• | are structurally subordinated to all obligations of each of the Company's subsidiaries. |
Optional redemption. At any time prior to March 15, 2020, the Company may redeem up to a maximum of 40% of the aggregate principal amount of the Senior Notes due 2027 with the proceeds of certain equity offerings at a redemption price of 103.375% of the principal amount, plus accrued and unpaid interest, if any, to the date of redemption. In addition, the Company may redeem some or all of the Senior Notes due 2027 prior to March 15, 2022, at a price equal to 100% of the principal amount, plus accrued and unpaid interest, if any, to the date of redemption, and a "make-whole" premium. On or after March 15, 2022, the Company may redeem some or all of the Senior Notes due 2027, at once or over time, at redemption prices specified in the indenture governing the Senior Notes due 2027, or the 2027 indenture, and together with the 2025 indenture, the indentures, plus accrued and unpaid interest, if any, to the date of redemption.
Mandatory redemption, offer to purchase and open market purchases. The Company is not required to make any sinking fund payments with respect to the Senior Notes due 2027. However, under certain circumstances in the event of an asset sale or as described under "Change of Control" below, the Company may be required to offer to purchase the Senior Notes due 2027. The Company may from time to time purchase the Senior Notes due 2027 in the open market or otherwise.
Covenants. The 2027 indenture contains covenants that limit, among other things, the Company’s and certain of the Company’s subsidiaries’ ability to incur additional debt, pay dividends or make other restricted payments, consummate specified asset sales, enter into transactions with affiliates and incur liens, and that impose restrictions on the ability of its subsidiaries to pay dividends or make payments to the Company and its restricted subsidiaries, merge or consolidate with another person, and sell, assign, transfer, lease convey or otherwise dispose of all or substantially all of the Company’s assets or the assets of its restricted subsidiaries. The 2027 indenture provides for customary events of default (subject in certain cases to customary grace and cure periods), which include nonpayment of principal, premium or interest, breach of covenants, in the 2027 indenture, payment defaults or acceleration of certain other indebtedness, a failure to pay certain judgments and certain events of bankruptcy and insolvency. Generally, if an
92
LEVI STRAUSS & CO. AND SUBSIDIARIES
NOTES TO CONSOLIDATED FINANCIAL STATEMENTS — (continued)
FOR THE YEARS ENDED NOVEMBER 24, 2019, NOVEMBER 25, 2018 AND NOVEMBER 26, 2017
event of default occurs, the trustee under the 2027 indenture or the holders of at least 25% in principal amount of the then outstanding Senior Notes due 2027 may declare all the Senior Notes due 2027 to be due and payable immediately.
Change of control. Upon the occurrence of a change in control (as defined in the 2027 indenture), each holder of the Senior Notes due 2027 may require the Company to repurchase all or a portion of the Senior Notes due 2027 in cash at a price equal to 101% of the principal amount of the Senior Notes due 2027 to be repurchased, plus accrued and unpaid interest, if any, to the date of purchase.
Use of Proceeds and Loss on Early Extinguishment of Debt. On March 3, 2017, the Company completed a cash tender offer for $370.3 million of the 6.875% Senior Notes due 2022 and the remaining $154.7 million was called on March 31, 2017 for redemption on May 1, 2017. The tender offer and redemption, as well as underwriting fees associated with the new issuance, were primarily funded with the proceeds from the issuance of the Senior Notes due 2027, as well as cash on hand. The Company recorded a $22.8 million loss on early extinguishment of debt in 2017. The loss includes $21.9 million of tender and call premiums on the retired debt.
Short-term Borrowings
Short-term borrowings consist of term loans and revolving credit facilities at various foreign subsidiaries that the Company expects to either pay over the next 12 months or refinance at the end of their applicable terms. Certain of these borrowings are guaranteed by stand-by letters of credit issued under the Company's amended and restated senior secured revolving credit facility.
Principal Payments on Debt
The table below sets forth, as of November 24, 2019, the Company's required aggregate short-term and long-term debt principal payments (inclusive of premium and discount):
(Dollars in thousands) | |||||
2020 | $ | 7,621 | |||
2021 | — | ||||
2022 | — | ||||
2023 | — | ||||
2024 | — | ||||
Thereafter | 1,016,976 | ||||
Total future debt principal payments | $ | 1,024,597 | |||
Interest Rates on Borrowings
The Company’s weighted-average interest rate on average borrowings outstanding during 2019, 2018 and 2017 was 5.31%, 5.01% and 5.60%, respectively. The weighted-average interest rate on average borrowings outstanding includes the amortization of capitalized issuance costs, including underwriting fees and other expenses, and excludes interest on obligations to participants under deferred compensation plans.
Dividends and Restrictions
The terms of the indentures relating to the Company's unsecured notes and its amended and restated senior secured revolving credit facility agreement contain covenants that restrict the Company's ability to pay dividends to its stockholders. For information about the Company's dividend payments, see Note 14. As of November 24, 2019, and at the time the dividends were paid, the Company met the requirements of its debt instruments.
Subsidiaries of the Company that are not wholly-owned subsidiaries and that are "restricted subsidiaries" under the Company’s indentures are permitted under the indentures to pay dividends to all stockholders either on a pro rata basis or on a basis that results in the receipt by the Company or a restricted subsidiary that is the parent of the restricted subsidiary of dividends or distributions of greater value than it would receive on a pro rata basis.
93
LEVI STRAUSS & CO. AND SUBSIDIARIES
NOTES TO CONSOLIDATED FINANCIAL STATEMENTS — (continued)
FOR THE YEARS ENDED NOVEMBER 24, 2019, NOVEMBER 25, 2018 AND NOVEMBER 26, 2017
The terms of the indentures relating to the Company's unsecured notes and its amended and restated senior secured revolving credit facility agreement contain covenants that restrict (in each case subject to certain exceptions) the Company or any restricted subsidiary from entering into any arrangements that would restrict the payment of dividends or of any obligation owed by the restricted subsidiary to the Company or any other restricted subsidiary, the making of any loans or advances to the Company or any other restricted subsidiary, or transferring any of its property to the Company or any other restricted subsidiary.
NOTE 7: GUARANTEES
Indemnification agreements. In the ordinary course of business, the Company enters into agreements containing indemnification provisions under which the Company agrees to indemnify the other party for specified claims and losses. For example, the Company's trademark license agreements, real estate leases, consulting agreements, logistics outsourcing agreements, securities purchase agreements and credit agreements typically contain such provisions. This type of indemnification provision obligates the Company to pay certain amounts associated with claims brought against the other party as the result of trademark infringement, negligence or willful misconduct of Company employees, breach of contract by the Company including inaccuracy of representations and warranties, specified lawsuits in which the Company and the other party are co-defendants, product claims and other matters. These amounts generally are not readily quantifiable; the maximum possible liability or amount of potential payments that could arise out of an indemnification claim depends entirely on the specific facts and circumstances associated with the claim. The Company has insurance coverage that minimizes the potential exposure to certain of such claims. The Company also believes that the likelihood of material payment obligations under these agreements to third parties is low.
Covenants. The Company's long-term debt agreements and the Second Amended and Restated Credit Agreement contain customary covenants restricting its activities as well as those of its subsidiaries, including limitations on its and its subsidiaries' ability to sell assets; engage in mergers; enter into capital leases or certain leases not in the ordinary course of business; enter into transactions involving related parties or derivatives; incur or prepay indebtedness or grant liens or negative pledges on its assets; make loans or other investments; pay dividends or repurchase stock or other securities; guaranty third-party obligations; make capital expenditures; and make changes in its corporate structure. For additional information, see Note 6. As of November 24, 2019, the Company was in compliance with all of these covenants.
NOTE 8: EMPLOYEE BENEFIT PLANS
Pension plans. The Company has several non-contributory defined benefit retirement plans covering eligible employees. Plan assets are invested in a diversified portfolio of securities including stocks, bonds, cash equivalents and other alternative investments including real estate investment trust funds. Benefits payable under the plans are based on years of service, final average compensation, or both. The Company retains the right to amend, curtail or discontinue any aspect of the plans, subject to local regulations.
Postretirement plans. The Company maintains plans that provide postretirement benefits to eligible employees, principally health care, to substantially all U.S. retirees and their qualified dependents. These plans were established with the intention that they would continue indefinitely. However, the Company retains the right to amend, curtail or discontinue any aspect of the plans at any time. The plans are contributory and contain certain cost-sharing features, such as deductibles and coinsurance. The Company's policy is to fund postretirement benefits as claims and premiums are paid.
94
LEVI STRAUSS & CO. AND SUBSIDIARIES
NOTES TO CONSOLIDATED FINANCIAL STATEMENTS — (continued)
FOR THE YEARS ENDED NOVEMBER 24, 2019, NOVEMBER 25, 2018 AND NOVEMBER 26, 2017
The following tables summarize activity of the Company's defined benefit pension plans and postretirement benefit plans:
Pension Benefits | Postretirement Benefits | ||||||||||||||
2019 | 2018 | 2019 | 2018 | ||||||||||||
(Dollars in thousands) | |||||||||||||||
Change in benefit obligation: | |||||||||||||||
Benefit obligation at beginning of year | $ | 1,136,720 | $ | 1,243,852 | $ | 82,907 | $ | 98,675 | |||||||
Service cost | 3,377 | 3,602 | 65 | 113 | |||||||||||
Interest cost | 41,341 | 36,070 | 3,042 | 2,718 | |||||||||||
Plan participants' contribution | 665 | 570 | 4,256 | 4,105 | |||||||||||
Actuarial loss (gain)(1) | 146,562 | (69,602 | ) | (2,903 | ) | (6,353 | ) | ||||||||
Net curtailment loss | 64 | 113 | — | — | |||||||||||
Impact of foreign currency changes | (2,210 | ) | (6,983 | ) | — | — | |||||||||
Plan settlements | (436 | ) | (63 | ) | — | — | |||||||||
Net benefits paid | (64,320 | ) | (70,839 | ) | (15,232 | ) | (16,351 | ) | |||||||
Benefit obligation at end of year | $ | 1,261,763 | $ | 1,136,720 | $ | 72,135 | $ | 82,907 | |||||||
Change in plan assets: | |||||||||||||||
Fair value of plan assets at beginning of year | 958,576 | 948,706 | — | — | |||||||||||
Actual return (loss) on plan assets(2) | 182,309 | (36,468 | ) | — | — | ||||||||||
Employer contribution(3) | 15,062 | 122,492 | 10,976 | 12,246 | |||||||||||
Plan participants' contributions | 665 | 570 | 4,256 | 4,105 | |||||||||||
Plan settlements | (436 | ) | (63 | ) | — | — | |||||||||
Impact of foreign currency changes | (694 | ) | (5,822 | ) | — | — | |||||||||
Net benefits paid | (64,320 | ) | (70,839 | ) | (15,232 | ) | (16,351 | ) | |||||||
Fair value of plan assets at end of year | 1,091,162 | 958,576 | — | — | |||||||||||
Unfunded status at end of year | $ | (170,601 | ) | $ | (178,144 | ) | $ | (72,135 | ) | $ | (82,907 | ) | |||
_____________
(1) | 2019 actuarial losses and 2018 actuarial gains in the Company's pension benefit plans resulted from changes in discount rate assumptions. Changes in financial markets during 2019 including a decrease in corporate bond yield indices, resulted in an increase in benefit obligations. Changes in financial markets during 2018 including an increase in corporate bond yield indices, resulted in a decrease in benefit obligations. |
(2) | The increase in return on plan assets in the Company's pension benefit plans in 2019 was primarily due to better-than-expected asset performance of U.S. and international equity securities. |
(3) | The decrease in employer contributions to the Company's pension benefit plans in 2019 is due to additional planned contributions for the U.S. plan made during the prior year. |
95
LEVI STRAUSS & CO. AND SUBSIDIARIES
NOTES TO CONSOLIDATED FINANCIAL STATEMENTS — (continued)
FOR THE YEARS ENDED NOVEMBER 24, 2019, NOVEMBER 25, 2018 AND NOVEMBER 26, 2017
Amounts recognized in the Company's consolidated balance sheets as of November 24, 2019 and November 25, 2018, consist of the following:
Pension Benefits | Postretirement Benefits | ||||||||||||||
2019 | 2018 | 2019 | 2018 | ||||||||||||
(Dollars in thousands) | |||||||||||||||
Unfunded status recognized on the balance sheet: | |||||||||||||||
Prepaid benefit cost | $ | 27,704 | $ | 22,738 | $ | — | $ | — | |||||||
Accrued benefit liability – current portion | (9,480 | ) | (9,390 | ) | (8,129 | ) | (8,725 | ) | |||||||
Accrued benefit liability – long-term portion | (188,825 | ) | (191,491 | ) | (64,006 | ) | (74,182 | ) | |||||||
$ | (170,601 | ) | $ | (178,143 | ) | $ | (72,135 | ) | $ | (82,907 | ) | ||||
Accumulated other comprehensive loss: | |||||||||||||||
Net actuarial loss | $ | (358,484 | ) | $ | (365,424 | ) | $ | (11,284 | ) | $ | (14,652 | ) | |||
Net prior service benefit | 291 | 351 | — | — | |||||||||||
$ | (358,193 | ) | $ | (365,073 | ) | $ | (11,284 | ) | $ | (14,652 | ) | ||||
The accumulated benefit obligation for all defined benefit plans was $1.2 billion and $1.1 billion at November 24, 2019 and November 25, 2018. Information for the Company's defined benefit plans with an accumulated or projected benefit obligation in excess of plan assets is as follows:
Pension Benefits | |||||||
2019 | 2018 | ||||||
(Dollars in thousands) | |||||||
Accumulated benefit obligations in excess of plan assets: | |||||||
Aggregate accumulated benefit obligation | $ | 1,093,503 | $ | 986,084 | |||
Aggregate fair value of plan assets | 903,556 | 792,427 | |||||
Projected benefit obligations in excess of plan assets: | |||||||
Aggregate projected benefit obligation | $ | 1,142,114 | $ | 1,028,074 | |||
Aggregate fair value of plan assets | 943,810 | 827,193 | |||||
96
LEVI STRAUSS & CO. AND SUBSIDIARIES
NOTES TO CONSOLIDATED FINANCIAL STATEMENTS — (continued)
FOR THE YEARS ENDED NOVEMBER 24, 2019, NOVEMBER 25, 2018 AND NOVEMBER 26, 2017
The components of the Company's net periodic benefit cost were as follows:
Pension Benefits | Postretirement Benefits | ||||||||||||||||||||||
2019 | 2018 | 2017 | 2019 | 2018 | 2017 | ||||||||||||||||||
(Dollars in thousands) | |||||||||||||||||||||||
Net periodic benefit cost: | |||||||||||||||||||||||
Service cost(1) | $ | 3,377 | $ | 3,602 | $ | 3,427 | $ | 65 | $ | 113 | $ | 172 | |||||||||||
Interest cost | 41,341 | 36,070 | 36,853 | 3,042 | 2,718 | 3,148 | |||||||||||||||||
Expected return on plan assets(1) | (42,098 | ) | (48,830 | ) | (42,033 | ) | — | — | — | ||||||||||||||
Amortization of prior service benefit | (61 | ) | (65 | ) | (62 | ) | — | — | — | ||||||||||||||
Amortization of actuarial loss | 13,306 | 12,650 | 13,489 | 465 | 872 | 1,271 | |||||||||||||||||
Curtailment loss | 13 | 38 | 106 | — | — | — | |||||||||||||||||
Net settlement (gain) loss | (56 | ) | (102 | ) | 126 | — | — | — | |||||||||||||||
Net periodic benefit cost | 15,822 | 3,363 | 11,906 | 3,572 | 3,703 | 4,591 | |||||||||||||||||
Changes in accumulated other comprehensive loss: | |||||||||||||||||||||||
Actuarial loss (gain) | 6,309 | 15,373 | (9,785 | ) | (2,903 | ) | (6,354 | ) | (5,516 | ) | |||||||||||||
Amortization of prior service benefit | 61 | 65 | 62 | — | — | — | |||||||||||||||||
Amortization of actuarial loss | (13,306 | ) | (12,650 | ) | (13,489 | ) | (465 | ) | (872 | ) | (1,271 | ) | |||||||||||
Net settlement gain (loss) | 56 | 102 | (126 | ) | — | — | — | ||||||||||||||||
Total recognized in accumulated other comprehensive loss | (6,880 | ) | 2,890 | (23,338 | ) | (3,368 | ) | (7,226 | ) | (6,787 | ) | ||||||||||||
Total recognized in net periodic benefit cost and accumulated other comprehensive loss | $ | 8,942 | $ | 6,253 | $ | (11,432 | ) | $ | 204 | $ | (3,523 | ) | $ | (2,196 | ) | ||||||||
_____________
(1) | Classification of service cost and expected return on plan assets related to U.S. and U.K. pension plans for 2017 have been conformed to reflect the adoption of ASU 2017-07, "Compensation-Retirement Benefits (Topic 715) Improving the Presentation of Net Periodic Cost and Net Periodic Postretirement Benefit Cost" to the 2018 and 2019 presentation requirements. |
The amounts that will be amortized from "Accumulated other comprehensive loss" into net periodic benefit cost in 2020 for the Company's defined benefit pension and postretirement benefit plans are expected to be $13.4 million and $0.3 million, respectively.
97
LEVI STRAUSS & CO. AND SUBSIDIARIES
NOTES TO CONSOLIDATED FINANCIAL STATEMENTS — (continued)
FOR THE YEARS ENDED NOVEMBER 24, 2019, NOVEMBER 25, 2018 AND NOVEMBER 26, 2017
Assumptions used in accounting for the Company's benefit plans were as follows:
Pension Benefits | Postretirement Benefits | ||||||||||
2019 | 2018 | 2017 | 2019 | 2018 | 2017 | ||||||
Weighted-average assumptions used to determine net periodic benefit cost: | |||||||||||
Discount rate | 4.1% | 3.4% | 3.8% | 4.2% | 3.4% | 3.7% | |||||
Expected long-term rate of return on plan assets | 4.6% | 5.4% | 5.8% | ||||||||
Rate of compensation increase | 3.4% | 3.4% | 3.4% | ||||||||
Weighted-average assumptions used to determine benefit obligations: | |||||||||||
Discount rate | 2.8% | 4.1% | 3.4% | 2.8% | 4.2% | 3.4% | |||||
Rate of compensation increase | 3.3% | 3.4% | 3.4% | ||||||||
Assumed health care cost trend rates were as follows: | |||||||||||
Health care trend rate assumed for next year | 5.7% | 5.9% | 6.3% | ||||||||
Rate trend to which the cost trend is assumed to decline | 4.4% | 4.4% | 4.4% | ||||||||
Year that rate reaches the ultimate trend rate | 2037 | 2037 | 2037 | ||||||||
For the Company's U.S. benefit plans, the discount rate used to determine the present value of the future pension and postretirement plan obligations was based on a yield curve constructed from a portfolio of high quality corporate bonds with various maturities. Each year's expected future benefit payments are discounted to their present value at the appropriate yield curve rate, thereby generating the overall discount rate. The Company utilized a variety of country-specific third-party bond indices to determine the appropriate discount rates to use for the benefit plans of its foreign subsidiaries.
The Company bases the overall expected long-term rate of return on assets on anticipated long-term returns of individual asset classes and each pension plans' target asset allocation strategy based on current economic conditions. For the U.S. pension plan, the expected long-term returns for each asset class are determined through a mean-variance model to estimate 20-year returns for the plan.
Health care cost trend rate assumptions are not a significant input in the calculation of the amounts reported for the Company's postretirement benefits plans. A one percentage-point change in assumed health care cost trend rates would have no significant effect on the total service and interest cost components or on the postretirement benefit obligation.
Consolidated pension plan assets relate primarily to the U.S. pension plan. The Company utilizes the services of independent third-party investment managers to oversee the management of U.S. pension plan assets.
The Company's investment strategy is to invest plan assets in a diversified portfolio of domestic and international equity securities, fixed income securities and real estate and other alternative investments with the objective to provide a regular and reliable source of assets to meet the benefit obligation of the pension plans. Prohibited investments for the U.S. pension plan include certain privately placed or other non-marketable debt instruments, letter stock, commodities or commodity contracts and derivatives of mortgage-backed securities, such as interest-only, principal-only or inverse floaters. The current target allocation percentages for the Company's U.S. pension plan assets are 25% for equity securities and real estate with an allowable deviation of plus or minus 4% and 75% for fixed income securities with an allowable deviation of plus or minus 4%.
98
LEVI STRAUSS & CO. AND SUBSIDIARIES
NOTES TO CONSOLIDATED FINANCIAL STATEMENTS — (continued)
FOR THE YEARS ENDED NOVEMBER 24, 2019, NOVEMBER 25, 2018 AND NOVEMBER 26, 2017
The fair value of the Company's pension plan assets by asset class are as follows:
Year Ended November 24, 2019 | |||||||||||||||
Asset Class | Total | Quoted Prices in Active Markets for Identical Assets (Level 1) | Significant Observable Inputs (Level 2) | Significant Unobservable Inputs (Level 3) | |||||||||||
(Dollars in thousands) | |||||||||||||||
Cash and cash equivalents | $ | 4,427 | $ | 4,427 | $ | — | $ | — | |||||||
Equity securities(1) | |||||||||||||||
U.S. large cap | 93,019 | — | 93,019 | — | |||||||||||
U.S. small cap | 13,307 | — | 13,307 | — | |||||||||||
International | 115,607 | — | 115,607 | — | |||||||||||
Fixed income securities(2) | 808,546 | — | 808,546 | — | |||||||||||
Other alternative investments | |||||||||||||||
Real estate(3) | 38,076 | — | 38,076 | — | |||||||||||
Private equity(4) | 289 | — | — | 289 | |||||||||||
Hedge fund(5) | 13,328 | — | 13,328 | — | |||||||||||
Other(6) | 4,564 | — | 4,564 | — | |||||||||||
Total investments at fair value | $ | 1,091,163 | $ | 4,427 | $ | 1,086,447 | $ | 289 | |||||||
Year Ended November 25, 2018 | |||||||||||||||
Asset Class | Total | Quoted Prices in Active Markets for Identical Assets (Level 1) | Significant Observable Inputs (Level 2) | Significant Unobservable Inputs (Level 3) | |||||||||||
(Dollars in thousands) | |||||||||||||||
Cash and cash equivalents | $ | 3,818 | $ | 3,818 | $ | — | $ | — | |||||||
Equity securities(1) | |||||||||||||||
U.S. large cap | 91,663 | — | 91,663 | — | |||||||||||
U.S. small cap | 10,871 | — | 10,871 | — | |||||||||||
International | 86,974 | — | 86,974 | — | |||||||||||
Fixed income securities(2) | 714,034 | — | 714,034 | — | |||||||||||
Other alternative investments | |||||||||||||||
Real estate(3) | 35,265 | — | 35,265 | — | |||||||||||
Private equity(4) | 383 | — | — | 383 | |||||||||||
Hedge fund(5) | 11,389 | — | 11,389 | — | |||||||||||
Other(6) | 4,179 | — | 4,179 | — | |||||||||||
Total investments at fair value | $ | 958,576 | $ | 3,818 | $ | 954,375 | $ | 383 | |||||||
_____________
(1) | Primarily comprised of equity index funds that track various market indices. |
(2) | Predominantly includes bond index funds that invest in long-term U.S. government and investment grade corporate bonds. |
(3) | Primarily comprised of investments in U.S. Real Estate Investment Trusts. |
(4) | Represents holdings in a diversified portfolio of private equity funds and direct investments in companies located primarily in North America. Fair values are determined by investment fund managers using primarily unobservable market data. |
(5) | Primarily invested in a diversified portfolio of equities, bonds, alternatives and cash with a low tolerance for capital loss. |
(6) | Primarily relates to accounts held and managed by a third-party insurance company for employee-participants in Belgium. Fair values are based on accumulated plan contributions plus a contractually-guaranteed return plus a share of any incremental investment fund profits. |
99
LEVI STRAUSS & CO. AND SUBSIDIARIES
NOTES TO CONSOLIDATED FINANCIAL STATEMENTS — (continued)
FOR THE YEARS ENDED NOVEMBER 24, 2019, NOVEMBER 25, 2018 AND NOVEMBER 26, 2017
The fair value of plan assets are composed of U.S. plan assets of $903.6 million and non-U.S. plan assets of $187.6 million. The fair values of the substantial majority of the equity, fixed income and real estate investments are based on the net asset value of commingled trust funds that passively track various market indices.
The Company's estimated future benefit payments to participants, which reflect expected future service, as appropriate are anticipated to be paid as follows:
Pension Benefits | Postretirement Benefits | Total | |||||||||
(Dollars in thousands) | |||||||||||
2020 | $ | 68,838 | $ | 9,272 | $ | 78,110 | |||||
2021 | 69,039 | 8,570 | 77,609 | ||||||||
2022 | 69,622 | 8,131 | 77,753 | ||||||||
2023 | 69,379 | 7,612 | 76,991 | ||||||||
2024 | 70,185 | 6,966 | 77,151 | ||||||||
2025-2028 | 350,538 | 26,067 | 376,605 | ||||||||
At November 24, 2019, the Company's contributions to its pension plans in 2020 are estimated to be $44 million.
100
LEVI STRAUSS & CO. AND SUBSIDIARIES
NOTES TO CONSOLIDATED FINANCIAL STATEMENTS — (continued)
FOR THE YEARS ENDED NOVEMBER 24, 2019, NOVEMBER 25, 2018 AND NOVEMBER 26, 2017
NOTE 9: EMPLOYEE INVESTMENT PLANS
The Company's Employee Savings and Investment Plan ("ESIP") is a qualified plan that covers eligible U.S. payroll employees. The Company matches 125% of ESIP participant's contributions to all funds maintained under the qualified plan up to the first 6.0% of eligible compensation. Total amounts charged to expense for the Company's employee investment plans for the years ended November 24, 2019, November 25, 2018 and November 26, 2017, were $16.3 million, $14.9 million and $13.4 million, respectively.
NOTE 10: EMPLOYEE INCENTIVE COMPENSATION PLANS
Annual Incentive Plan
The Annual Incentive Plan ("AIP") provides a cash bonus that is earned based upon the Company's business unit and consolidated financial results as measured against pre-established internal targets and upon the performance and job level of the individual. Total amounts charged to expense for this plan for the years ended November 24, 2019, November 25, 2018, and November 26, 2017 were $86.6 million, $114.3 million and $88.0 million, respectively. Total amounts accrued for this plan as of November 24, 2019, and November 25, 2018 were $87.7 million and $114.4 million, respectively.
Long-Term Incentive Plans
2016 Equity Incentive Plan ("2016 Plan"). In July 2006, the Board adopted, and the stockholders approved, the Company's 2016 Plan. The 2016 Plan was subsequently amended in 2011 and 2014 and then amended and restated by the Board and approved by the stockholders in April 2016. For more information on this plan, see Note 11.
2019 Equity Incentive Plan ("2019 Plan") and 2019 Employee Stock Purchase Plan (the "2019 ESPP"). In February 2019, the Company's stockholders approved the Company's 2019 Plan and the Company's 2019 ESPP, each of which became effective on March 20, 2019, the effective date of the IPO registration statement. For more information on these plans, see Note 11.
Cash Long-Term Incentive Plan ("LTIP"). The Company established a long-term cash incentive plan effective at the beginning of 2005. In 2017, this program was replaced by cash-settled phantom restricted stock units. Refer to Note 11 for more information. Executive officers are not participants in this plan. Performance is measured at the end of a three-year period based on the Company's performance against the following pre-established targets: (i) the target compound annual growth rate in the Company's net revenues over the three-year period; (ii) the Company's average margin of net earnings over the three-year period adjusted for certain items such as interest and taxes and total stockholder return over the three-year period relative to an expanded peer group. Awards will be paid out in the quarter following the end of the three-year period based on Company performance against the pre-established targets.
The Company recorded expense for the LTIP of $0.9 million, $4.1 million and $4.5 million for the years ended November 24, 2019, November 25, 2018 and November 26, 2017, respectively. As of November 24, 2019, all LTIP awards were fully paid. As at November 25, 2018, the Company had accrued a total $8.1 million.
101
LEVI STRAUSS & CO. AND SUBSIDIARIES
NOTES TO CONSOLIDATED FINANCIAL STATEMENTS — (continued)
FOR THE YEARS ENDED NOVEMBER 24, 2019, NOVEMBER 25, 2018 AND NOVEMBER 26, 2017
NOTE 11: STOCK-BASED INCENTIVE COMPENSATION PLANS
The Company recognized stock-based compensation expense of $79.0 million, $89.8 million and $57.1 million, and related income tax benefits of $19.5 million, $22.3 million and $22.0 million, respectively, for the years ended November 24, 2019, November 25, 2018 and November 26, 2017, respectively. As of November 24, 2019, there was $68.6 million of total unrecognized compensation cost related to unvested equity and liability awards, which cost is expected to be recognized over a weighted-average period of 2.10 years. No stock-based compensation cost has been capitalized in the accompanying consolidated financial statements.
2016 Equity Incentive Plan
Prior to the IPO, the Company granted awards under the 2016 Equity Incentive Plan (the "2016 Plan") which provided for the granting of a variety of stock awards, including stock options, restricted stock, restricted stock units ("RSUs"), stock appreciation rights ("SARs") and cash or equity settled awards to certain employees and non-employee directors. The maximum number of shares of common stock authorized for issuance under the 2016 Plan was 80.0 million shares. Upon completion of the IPO, shares that remained available for future grants under the 2016 Plan ceased to be available and the 2019 Equity Incentive Plan became effective. Awards granted before the IPO remain outstanding according to the plan’s terms. Outstanding awards under the 2016 Plan are issuable as Class B common stock and can be voluntarily converted to Class A common stock and sold to the public.
2019 Equity Incentive Plan
In March 2019, in connection with the IPO, the Company’s stockholders adopted the Company’s 2019 Equity Incentive Plan (the “2019 Plan”) which provides for the grant of a variety of stock awards, including stock options, restricted stock, restricted stock units, stock appreciation rights, and cash or equity settled awards to certain employees and non-employee directors. The maximum number of shares of Class A common stock authorized for issuance under the 2019 Plan is 40.0 million shares. At November 24, 2019, the number of shares available for future grants under the 2019 Plan is 39.4 million shares.
2019 Employee Stock Purchase Plan
In March 2019, in connection with the IPO, the Company’s stockholders adopted the Company’s 2019 Employee Stock Purchase Plan (the “2019 ESPP”), which permits participants to purchase a total of 12.0 million shares of the Company’s Class A common stock through payroll deductions up to 10% of their earnings, subject to automatic annual increases. Unless otherwise determined by the administrator, the purchase price of the shares will be 85% of the fair market value of the Class A common stock on the date of purchase. At November 24, 2019, the number of shares available for issuance under the 2019 ESPP is 11.9 million shares. ESPP did not have a material impact on the consolidated financial statements in fiscal 2019.
Shares of common stock associated with the above plans will be issued from the Company's authorized but unissued shares and are subject to the Stockholders' Agreement that governs all shares.
Under the 2016 Plan and 2019 Plan, stock awards have a maximum contractual term of ten years, and if applicable, must have an exercise price at least equal to the fair market value of the Company's common stock on the grant date. Awards generally vest according to terms determined at the time of grant, or as otherwise determined by the Board in its discretion.
Upon the exercise of a stock-settled SAR, the participant will receive shares of common stock. The number of shares of common stock issued per SAR unit exercised is equal to (i) the excess of the per-share fair market value of the Company's common stock on the date of exercise over the exercise price of the SAR, divided by (ii) the per-share fair market value of the Company's common stock on the date of exercise.
Stock-settled RSUs which include service or performance conditions are issued to certain employees. Each stock-settled RSU is converted to a share of common stock upon vesting and do not have pre-vesting "dividend equivalent rights".
Non-employee members of the Board receive RSUs annually. The RSUs additionally have "dividend equivalent rights" of which dividends paid by the Company on its common stock are credited by the equivalent addition of RSUs.
102
LEVI STRAUSS & CO. AND SUBSIDIARIES
NOTES TO CONSOLIDATED FINANCIAL STATEMENTS — (continued)
FOR THE YEARS ENDED NOVEMBER 24, 2019, NOVEMBER 25, 2018 AND NOVEMBER 26, 2017
Equity Awards
SARs. The Company grants SARs, which include service or performance conditions, to a small group of the Company's senior executives. SARs with service conditions ("Service SARs") vest from three-and-a-half to four years, and have maximum contractual lives of ten years. SARs with performance conditions ("Performance SARs") were granted prior to 2017 and are fully vested as of November 24, 2019. SARs activity during the year ended November 24, 2019 was as follows:
Service SARs | Performance SARs | ||||||||||||||||||||||||
Units | Weighted-Average Exercise Price | Weighted-Average Remaining Contractual Life (Years) | Aggregate Intrinsic Value | Units | Weighted-Average Exercise Price | Weighted-Average Remaining Contractual Life (Years) | Aggregate Intrinsic Value | ||||||||||||||||||
(Units and dollars in thousands, except weighted-average exercise price) | |||||||||||||||||||||||||
Outstanding at November 25, 2018(1) | 17,871 | $ | 6.36 | 3.4 | 9,217 | $ | 6.05 | 3.1 | |||||||||||||||||
Granted | 1,009 | 14.93 | — | — | |||||||||||||||||||||
Exercised | (4,763 | ) | 4.69 | (2,462 | ) | 4.76 | |||||||||||||||||||
Forfeited | (45 | ) | 13.3 | — | 4.31 | ||||||||||||||||||||
Performance adjustment | — | — | 879 | 6.20 | |||||||||||||||||||||
Outstanding at November 24, 2019 | 14,072 | $ | 7.51 | 3.3 | 7,634 | $ | 6.49 | 2.5 | |||||||||||||||||
Vested and expected to vest at November 24, 2019 | 14,072 | $ | 7.51 | 3.3 | $ | 133,359 | 7,634 | $ | 6.49 | 2.5 | $ | 80,176 | |||||||||||||
Exercisable at November 24, 2019 | 10,494 | $ | 6.74 | 2.5 | $ | 107,609 | 7,634 | $ | 6.49 | 2.5 | $ | 80,176 | |||||||||||||
_____________
(1) | All share and per-share data retroactively adjusted to reflect the ten-for-one stock split approved by the Company's stockholders in February 2019. Refer to Note 1 for more information. |
The aggregate intrinsic values are calculated as the difference between the exercise price of the underlying SARs and the fair value of the Company's common stock that were in-the-money at that date.
November 24, 2019 | November 25, 2018 | November 26, 2017 | |||||||||
(Dollars in thousands) | |||||||||||
Aggregate intrinsic value of Service SARs exercised during the year | $ | 54,045 | $ | 53,398 | $ | 25,572 | |||||
Aggregate intrinsic value of Performance SARs exercised during the year | $ | 27,776 | $ | 6,777 | $ | 883 | |||||
Unrecognized future compensation costs as of November 24, 2019 of $3.1 million for Service SARs are expected to be recognized over weighted-average periods of 2.11 years.
103
LEVI STRAUSS & CO. AND SUBSIDIARIES
NOTES TO CONSOLIDATED FINANCIAL STATEMENTS — (continued)
FOR THE YEARS ENDED NOVEMBER 24, 2019, NOVEMBER 25, 2018 AND NOVEMBER 26, 2017
The weighted-average grant date fair value of SARs was estimated using the Black-Scholes option valuation model. The weighted-average grant date fair values and corresponding weighted-average assumptions used in the Black-Scholes option valuation model were as follows:
Service SARs Granted | |||||||||||
2019 | 2018 | 2017 | |||||||||
Weighted-average grant date fair value(1) | $ | 4.49 | $ | 2.61 | $ | 1.61 | |||||
Weighted-average assumptions: | |||||||||||
Expected life (in years) | 5.0 | 4.9 | 4.9 | ||||||||
Expected volatility | 37.5 | % | 35.7 | % | 32.5 | % | |||||
Risk-free interest rate | 2.5 | % | 2.5 | % | 1.9 | % | |||||
Expected dividend | 2.0 | % | 2.5 | % | 2.7 | % | |||||
_____________
(1) | All share and per-share data retroactively adjusted to reflect the ten-for-one stock split that was approved by the Company's stockholders in February 2019. Refer to Note 1 for more information. |
RSUs. The Company grants RSUs, which include service or performance conditions, to a small group of the Company's senior executives and to select levels of the Company's management. RSUs with service conditions ("Service RSUs") granted during 2019 and 2018 vest in four annual equal installments of 25% beginning on the first anniversary of the date granted subject to continued employment. Service RSUs granted in 2017 cliff vest in three years subject to continued employment. RSUs with performance conditions ("Performance RSUs") vest at varying unit amounts, up to 200% of those awarded, based on the attainment of certain three-year cumulative performance goals over a three-year performance period subject to continued employment. There were no stock-settled RSUs granted to employees prior to 2017. Service and Performance RSU activity during the year ended November 24, 2019 was as follows:
Service RSUs | Performance RSUs | ||||||||||||||||
Units | Weighted-Average Grant Date Fair Value | Weighted-Average Remaining Contractual Life (Years) | Units | Weighted-Average Grant Date Fair Value | Weighted-Average Remaining Contractual Life (Years) | ||||||||||||
(Units in thousands) | |||||||||||||||||
Outstanding at November 25, 2018(1) | 1,030 | $ | 8.17 | 1.7 | 1,744 | $ | 8.08 | 1.4 | |||||||||
Granted | 685 | 16.12 | 643 | 16.16 | |||||||||||||
Vested | (110 | ) | 8.80 | — | — | ||||||||||||
Granted Replacement Awards(2) | 6,542 | 16.67 | 2,083 | 22.71 | |||||||||||||
Forfeited | (368 | ) | 16.51 | (159 | ) | 14.93 | |||||||||||
Outstanding at November 24, 2019 | 7,779 | $ | 15.56 | 1.6 | 4,311 | $ | 16.24 | 1.0 | |||||||||
_____________
(1) | All share and per-share data retroactively adjusted to reflect the ten-for-one stock split approved by the Company's stockholders in February 2019. Refer to Note 1 for more information. |
(2) | In connection with the IPO, the Company’s Board of Directors approved the cancellation of the majority of the outstanding unvested cash-settled RSUs and their concurrent replacement with similar stock-settled RSUs. Other than the form of settlement, all other terms of the awards, including their vesting schedules are the same. Refer to Note 1 for more information. |
The total fair value of Service RSU awards vested during 2019 was $1.6 million. Unrecognized future compensation cost as of November 24, 2019 of $44.7 million for Service RSUs and $16.6 million for Performance RSUs is expected to be recognized over a weighted-average period of 2.36 years and 1.49 years, respectively.
104
LEVI STRAUSS & CO. AND SUBSIDIARIES
NOTES TO CONSOLIDATED FINANCIAL STATEMENTS — (continued)
FOR THE YEARS ENDED NOVEMBER 24, 2019, NOVEMBER 25, 2018 AND NOVEMBER 26, 2017
The grant date fair value of Service and Performance RSUs was based on the fair value of the Company’s common stock at the time of grant, unless the awards were subject to market conditions, in which case the Monte Carlo simulation model was utilized. During 2019, 2018 and 2017, the weighted-average grant date fair value for Service and Performance RSUs granted without a market condition were $15.56, $9.16 and $6.49, respectively. The weighted-average grant date fair value and corresponding weighted-average assumptions used in the Monte Carlo valuation models were as follows:
Performance RSUs Granted as Replacement Awards | Performance RSUs Granted | ||||||||||||||
2019 | 2019 | 2018 | 2017 | ||||||||||||
Weighted-average grant date fair value(1) | $ | 28.78 | $ | 17.95 | $ | 10.45 | $ | 8.23 | |||||||
Weighted-average assumptions: | |||||||||||||||
Expected life (in years) | 1.5 | 2.8 | 3.0 | 3.0 | |||||||||||
Expected volatility | 36.3 | % | 37.5 | % | 37.2 | % | 33.5 | % | |||||||
Risk-free interest rate | 2.5 | % | 2.3 | % | 2.3 | % | 1.4 | % | |||||||
Expected dividend | 1.7 | % | 1.9 | % | 2.5 | % | 2.7 | % | |||||||
_____________
(1) | All share and per-share data retroactively adjusted to reflect the ten-for-one stock split approved by the Company's stockholders in February 2019. Refer to Note 1 for more information. |
RSUs to the Board of Directors. The Company grants RSUs to certain members of its Board ("Board RSUs"). The total fair value of Board RSUs granted during the year ended November 24, 2019 of $2.1 million was estimated using the fair value of the Company's common stock. The total fair value of RSUs outstanding, vested and expected to vest was $10.2 million and $10.1 million as of November 24, 2019 and November 25, 2018, respectively.
Board RSUs vest in a series of three equal installments at 13 months, 24 months and 36 months following the date of grant subject to continued service. However, if the recipient's continuous service terminates for a reason other than cause after the first vesting installment, but prior to full vesting, then the remaining unvested portion of the award becomes fully vested as of the date of such termination.
Liability Awards
In connection with the IPO, on March 19, 2019 the Company's Board of Directors approved the cancellation of the majority of the outstanding unvested cash-settled restricted stock units ("RSU's") and their concurrent replacement with similar stock-settled RSUs ("Replacement Awards"), pursuant to the Company's 2016 Equity Incentive Plan (the "2016 Plan"). RSUs for certain foreign affiliates will continue to be cash-settled. Prior to the IPO, the Company granted cash settled phantom restricted stock units ("Phantom RSUs"), which included service or performance conditions, to select levels of the Company’s management. The Phantom RSUs are recorded as liabilities and their changes in fair value are recognized over the vesting period. Upon vesting of a phantom restricted stock unit, the participant will receive a cash payout in an amount equal to the vested units multiplied by the fair value of the Company’s common stock at the end of the service or performance period.
Phantom restricted stock units with service conditions ("Phantom Service RSUs") granted during 2019 and 2018 vest in four annual equal installments of 25% beginning on the first anniversary of the date granted subject to continued employment. The Phantom Service RSUs granted in 2017 cliff vest in three years subject to continued employment. Phantom restricted stock units with performance conditions ("Phantom Performance RSUs") vest at varying unit amounts, up to 200% of those awarded, based on attainment of certain three-year cumulative performance goals and subject to continued employment. There were no Phantom Performance RSUs granted prior to 2017.
105
LEVI STRAUSS & CO. AND SUBSIDIARIES
NOTES TO CONSOLIDATED FINANCIAL STATEMENTS — (continued)
FOR THE YEARS ENDED NOVEMBER 24, 2019, NOVEMBER 25, 2018 AND NOVEMBER 26, 2017
Liability award activity during the year ended November 24, 2019 was as follows:
Phantom Service RSUs | Phantom Performance RSUs | ||||||||||||||||||||
Units | Weighted-Average Grant Date Fair Value | Fair Value At Period End | Units | Weighted-Average Grant Date Fair Value | Fair Value At Period End | ||||||||||||||||
(Units in thousands) | |||||||||||||||||||||
Outstanding at November 25, 2018(1) | 9,100 | $ | 7.59 | $ | 14.60 | 1,710 | $ | 8.22 | $ | 14.60 | |||||||||||
Granted | 1,821 | 14.95 | 504 | 14.88 | |||||||||||||||||
Vested | (3,617 | ) | 6.87 | — | — | ||||||||||||||||
Canceled(2) | (6,542 | ) | 9.81 | (2,083 | ) | 9.69 | |||||||||||||||
Performance adjustment | — | — | 4 | 6.90 | |||||||||||||||||
Forfeited | (218 | ) | 8.57 | (64 | ) | 9.45 | |||||||||||||||
Outstanding at November 24, 2019 | 544 | $ | 9.96 | $ | 16.99 | 71 | $ | 11.38 | $ | 16.99 | |||||||||||
Expected to vest at November 24, 2019 | 518 | $ | 9.84 | $ | 16.99 | 65 | $ | 11.23 | $ | 16.99 | |||||||||||
_____________
(1) | All share and per-share data retroactively adjusted to reflect the ten-for-one stock split approved by the Company's stockholders in February 2019. Refer to Note 1 for more information. |
(2) | In connection with the IPO, the Company’s Board of Directors approved the cancellation of the majority of the outstanding unvested cash-settled RSUs and their concurrent replacement with similar stock-settled RSUs. Other than the form of settlement, all other terms of the awards, including their vesting schedules are the same. Refer to Note 1 for more information. |
The total fair value of Phantom Service RSU awards vested during 2019, 2018 and 2017 was $52.9 million, $17.0 million and $9.2 million, respectively. The weighted-average fair value of Phantom Service RSUs at the grant date was estimated based on the fair value of the Company's common stock. The Company accrued for $6.9 million of Phantom Service RSUs and Phantom Performance RSUs as of November 24, 2019.
Unrecognized future compensation cost as of November 24, 2019 of $3.6 million for Phantom Service RSUs and $0.6 million for Phantom Performance RSUs are expected to be recognized over a weighted-average period of 1.61 years and 1.69 years, respectively.
NOTE 12: LONG-TERM EMPLOYEE RELATED BENEFITS
Long-term employee-related benefit liabilities primarily consist of the Company's liabilities for its deferred compensation plans.
Deferred compensation plan for executives and outside directors, established January 1, 2003. The Company has a non-qualified deferred compensation plan for executives and outside directors that was established on January 1, 2003 and amended thereafter. The deferred compensation plan obligations are payable in cash upon retirement, termination of employment and/or certain other times in a lump-sum distribution or in installments, as elected by the participant in accordance with the plan. As of November 24, 2019 and November 25, 2018, these plan liabilities totaled $52.8 million and $34.2 million. The Company held funds of $49.2 million and $34.4 million in an irrevocable grantor's rabbi trust as of November 24, 2019 and November 25, 2018, respectively, related to this plan. Rabbi trust assets are classified as available-for-sale marketable securities and are included in "Other current assets" or "Other non-current assets" on the Company's consolidated balance sheets. Unrealized gains and losses on these marketable securities are reported as a separate component of stockholders' equity and included in AOCI on the Company's consolidated balance sheets.
106
LEVI STRAUSS & CO. AND SUBSIDIARIES
NOTES TO CONSOLIDATED FINANCIAL STATEMENTS — (continued)
FOR THE YEARS ENDED NOVEMBER 24, 2019, NOVEMBER 25, 2018 AND NOVEMBER 26, 2017
Deferred compensation plan for executives, prior to January 1, 2003. The Company also maintains a non-qualified deferred compensation plan for certain management employees relating to compensation deferrals for the period prior to January 1, 2003. The rabbi trust is not a feature of this plan. As of November 24, 2019 and November 25, 2018, liabilities for this plan totaled $29.0 million and $28.4 million, respectively.
Interest earned by the participants in deferred compensation plans was $9.4 million, $0.7 million and $8.1 million for the years ended November 24, 2019, November 25, 2018 and November 26, 2017, respectively. The charges were included in "interest expense" in the Company's consolidated statements of income.
NOTE 13: COMMITMENTS AND CONTINGENCIES
Lease Commitments
The Company is obligated under operating leases and lease financing obligations for manufacturing, finishing and distribution facilities, office space, retail stores and equipment.
At November 24, 2019, future minimum payments under operating leases and lease financing obligations were as follows:
Future Minimum Payments | |||
(Dollars in thousands) | |||
2020 | $ | 234,092 | |
2021 | 203,483 | ||
2022 | 174,536 | ||
2023 | 140,278 | ||
2024 | 111,176 | ||
Thereafter | 284,114 | ||
Total future minimum lease payments | $ | 1,147,679 | |
In general, leases relating to real estate may include renewal options of various length. The San Francisco headquarters office lease contains multiple renewal options of up to 57 years. Rental expense for the years ended November 24, 2019, November 25, 2018 and November 26, 2017 was $270.2 million, $258.6 million and $220.2 million, respectively. At November 24, 2019, the lease financing obligation balance was $45.7 million, the majority of which is recorded in "Other long-term liabilities". The remaining minimum payments under the lease financing obligations are $61.6 million. The lease financing obligation balance at the end of the lease term will be approximately $34.0 million which approximates the net book value of the buildings to be relinquished to the lessor. As of November 24, 2019, and November 25, 2018, the gross carrying values of assets related to build-to-suit lease arrangements accounted for as lease financing obligations were $61.4 million and $44.6 million, respectively, with associated accumulated depreciation of $6.0 million and $3.1 million, respectively.
Forward Foreign Exchange Contracts
The Company uses over-the-counter derivative instruments to manage its exposure to foreign currencies. The Company is exposed to credit loss in the event of nonperformance by the counterparties to the forward foreign exchange contracts. However, the Company believes that its exposures are appropriately diversified across counterparties and that these counterparties are creditworthy financial institutions. See Note 5 for additional information.
Other Contingencies
Litigation. In the ordinary course of business, the Company has various pending cases involving contractual matters, facility and employee-related matters, distribution matters, product liability claims, trademark infringement and other matters. The Company does not believe any of these pending legal proceedings will have a material impact on its financial condition, results of operations or cash flows.
107
LEVI STRAUSS & CO. AND SUBSIDIARIES
NOTES TO CONSOLIDATED FINANCIAL STATEMENTS — (continued)
FOR THE YEARS ENDED NOVEMBER 24, 2019, NOVEMBER 25, 2018 AND NOVEMBER 26, 2017
Customs Duty Audits. The Company imports both raw materials and finished garments into all of its operating regions and as such, is subject to numerous countries' complex customs laws and regulations with respect to its import and export activity. While the Company is vigorously defending its position and does not believe any of the claims for customs duty and related charges have merit, the ultimate resolution of these assessments and legal proceedings are subject to risk and uncertainty.
NOTE 14: DIVIDEND
The Company paid two cash dividends totaling $113.9 million on its common stock in 2019. The first dividend was $55.0 million paid in the first quarter and the second dividend was $58.9 million paid in the fourth quarter. In 2018, two cash dividends totaling $90.0 million were paid of $45.0 million each in the first and fourth quarters of the year. In 2017, two cash dividends totaling $70.0 million were paid of $35.0 million each in the first and fourth quarters of the year. Subsequent to the Company's year end, the Board declared a cash dividend of $0.08 per share to holders of record of its Class A and Class B common stock, at the close of business on February 12, 2020. Total dividends are expected to be in the range of $130 million for fiscal 2020 and to be paid out quarterly.
The Company does not have an established annual dividend policy. The Company will continue to review its ability to pay cash dividends on an ongoing basis and dividends may be declared at the discretion of the Board depending upon, among other factors, the Company's financial condition and compliance with the terms of the Company's debt agreements.
108
LEVI STRAUSS & CO. AND SUBSIDIARIES
NOTES TO CONSOLIDATED FINANCIAL STATEMENTS — (continued)
FOR THE YEARS ENDED NOVEMBER 24, 2019, NOVEMBER 25, 2018 AND NOVEMBER 26, 2017
NOTE 15: ACCUMULATED OTHER COMPREHENSIVE LOSS
Accumulated other comprehensive income (loss) is summarized below:
Levi Strauss & Co. | Noncontrolling Interest | ||||||||||||||||||||||||||
Pension and Postretirement Benefits | Translation Adjustments | Unrealized Gain (Loss) on Marketable Securities | |||||||||||||||||||||||||
Net Investment Hedges | Foreign Currency Translation | Total | Foreign Currency Translation | Totals | |||||||||||||||||||||||
(Dollars in thousands) | |||||||||||||||||||||||||||
Accumulated other comprehensive (loss) income at November 27, 2016 | $ | (252,027 | ) | $ | (18,757 | ) | $ | (158,498 | ) | $ | 1,968 | $ | (427,314 | ) | $ | 9,433 | $ | (417,881 | ) | ||||||||
Gross changes | 30,125 | (59,945 | ) | 40,151 | 3,379 | 13,710 | 105 | 13,815 | |||||||||||||||||||
Tax | (10,279 | ) | 23,084 | (2,283 | ) | (1,299 | ) | 9,223 | — | 9,223 | |||||||||||||||||
Other comprehensive income (loss), net of tax | 19,846 | (36,861 | ) | 37,868 | 2,080 | 22,933 | 105 | 23,038 | |||||||||||||||||||
Accumulated other comprehensive (loss) income at November 26, 2017 | (232,181 | ) | (55,618 | ) | (120,630 | ) | 4,048 | (404,381 | ) | 9,538 | (394,843 | ) | |||||||||||||||
Gross changes | 4,336 | 21,280 | (43,479 | ) | (1,488 | ) | (19,351 | ) | (234 | ) | (19,585 | ) | |||||||||||||||
Tax | (1,178 | ) | (5,549 | ) | 5,487 | 388 | (852 | ) | — | (852 | ) | ||||||||||||||||
Other comprehensive (loss) income, net of tax | 3,158 | 15,731 | (37,992 | ) | (1,100 | ) | (20,203 | ) | (234 | ) | (20,437 | ) | |||||||||||||||
Accumulated other comprehensive (loss) income at November 25, 2018 | (229,023 | ) | (39,887 | ) | (158,622 | ) | 2,948 | (424,584 | ) | 9,304 | (415,280 | ) | |||||||||||||||
Gross changes | 10,248 | 19,026 | (7,562 | ) | 4,362 | 26,074 | 312 | 26,386 | |||||||||||||||||||
Tax | (2,084 | ) | (4,097 | ) | 727 | (1,022 | ) | (6,476 | ) | — | (6,476 | ) | |||||||||||||||
Other comprehensive (loss) income, net of tax | 8,164 | 14,929 | (6,835 | ) | 3,340 | 19,598 | 312 | 19,910 | |||||||||||||||||||
Accumulated other comprehensive (loss) income at November 24, 2019 | $ | (220,859 | ) | $ | (24,958 | ) | $ | (165,457 | ) | $ | 6,288 | $ | (404,986 | ) | $ | 9,616 | $ | (395,370 | ) | ||||||||
No material amounts were reclassified out of "Accumulated other comprehensive loss" into net income other than those that pertain to the Company's derivative instruments and pension and post retirement benefit plans. See Note 5 and Note 8 for additional information.
109
LEVI STRAUSS & CO. AND SUBSIDIARIES
NOTES TO CONSOLIDATED FINANCIAL STATEMENTS — (continued)
FOR THE YEARS ENDED NOVEMBER 24, 2019, NOVEMBER 25, 2018 AND NOVEMBER 26, 2017
NOTE 16: NET REVENUES
Disaggregated Revenue
The table below provides the Company's revenues disaggregated by segment and channel.
Year Ended November 24, 2019 | |||||||||||||||
Americas | Europe | Asia | Total | ||||||||||||
(Dollars in thousands) | |||||||||||||||
Net revenues by channel: | |||||||||||||||
Wholesale | $ | 2,181,168 | $ | 981,308 | $ | 498,043 | $ | 3,660,519 | |||||||
Direct-to-consumer | 875,856 | 786,748 | 439,964 | 2,102,568 | |||||||||||
Total net revenues | $ | 3,057,024 | $ | 1,768,056 | $ | 938,007 | $ | 5,763,087 | |||||||
Year Ended November 25, 2018 | |||||||||||||||
Americas | Europe | Asia | Total | ||||||||||||
(Dollars in thousands) | |||||||||||||||
Net revenues by channel: | |||||||||||||||
Wholesale | $ | 2,209,897 | $ | 925,317 | $ | 464,953 | $ | 3,600,167 | |||||||
Direct-to-consumer | 832,767 | 720,919 | 421,587 | 1,975,273 | |||||||||||
Total net revenues | $ | 3,042,664 | $ | 1,646,236 | $ | 886,540 | $ | 5,575,440 | |||||||
Year Ended November 26, 2017 | |||||||||||||||
Americas | Europe | Asia | Total | ||||||||||||
(Dollars in thousands) | |||||||||||||||
Net revenues by channel: | |||||||||||||||
Wholesale | $ | 2,050,975 | $ | 730,039 | $ | 450,063 | $ | 3,231,077 | |||||||
Direct-to-consumer | 723,075 | 582,237 | 367,641 | 1,672,953 | |||||||||||
Total net revenues | $ | 2,774,050 | $ | 1,312,276 | $ | 817,704 | $ | 4,904,030 | |||||||
At November 24, 2019, the Company did not have any material contract assets and or contract liabilities recorded in the consolidated balance sheets.
Consideration promised in the Company’s contracts with customers includes a variable amount related to anticipated sales returns, discounts and miscellaneous claims from customers. Estimates of discretionary authorized returns, discounts and claims are based on (1) historical rates, (2) specific identification of outstanding returns not yet received from customers and outstanding discounts and claims and (3) expected returns, discounts and claims not yet finalized with customers. Actual returns, discounts and claims in any future period are inherently uncertain and thus may differ from estimates recorded.
The Company treats all shipping to the Company's customers, handling and certain other distribution activities as a fulfillment cost and recognizes these costs as SG&A.
Sales and value-added taxes collected from customers and remitted to governmental authorities are presented on a net basis in the consolidated statements of income.
110
LEVI STRAUSS & CO. AND SUBSIDIARIES
NOTES TO CONSOLIDATED FINANCIAL STATEMENTS — (continued)
FOR THE YEARS ENDED NOVEMBER 24, 2019, NOVEMBER 25, 2018 AND NOVEMBER 26, 2017
NOTE 17: OTHER INCOME (EXPENSE), NET
The following table summarizes significant components of "Other income (expense), net":
Year Ended | |||||||||||
November 24, 2019 | November 25, 2018 | November 26, 2017 | |||||||||
(Dollars in thousands) | |||||||||||
Foreign exchange management gains (losses)(1) | $ | 126 | $ | 11,167 | $ | (41,167 | ) | ||||
Foreign currency transaction (losses) gains(2) | (6,231 | ) | (7,498 | ) | 7,853 | ||||||
Interest income | 17,190 | 9,400 | 3,380 | ||||||||
Investment income | 1,509 | 734 | 629 | ||||||||
Other(3) | (10,577 | ) | 1,104 | (10,585 | ) | ||||||
Total other income (expense), net(3) | $ | 2,017 | $ | 14,907 | $ | (39,890 | ) | ||||
_____________
(1) | Gains and losses on forward foreign exchange contracts primarily result from currency fluctuations relative to negotiated contract rates. Gains in 2018 were primarily due to favorable currency fluctuations relative to negotiated contract rates on positions to sell the Euro and the British Pound. Losses in 2017 were primarily due to unfavorable currency fluctuations relative to negotiated contract rates on positions to sell the Mexican Peso, the Euro and the British Pound. |
(2) | Foreign currency transaction gains and losses reflect the impact of foreign currency fluctuation on the Company's foreign currency denominated balances. Gains in 2017 were primarily due to the strengthening of the Mexican Peso and Euro against the US dollar. |
(3) | The amounts in Other income (expense), net have been conformed to reflect the adoption of ASU 2017-07, "Compensation-Retirement Benefits (Topic 715) Improving the Presentation of Net Periodic Cost and Net Periodic Postretirement Benefit Cost" and include non-service cost component of net periodic benefit costs. Refer to Note 1 for more information. The 2018 gain in Other is due to pension benefits yielding a higher expected return on assets and lower interest cost. |
111
LEVI STRAUSS & CO. AND SUBSIDIARIES
NOTES TO CONSOLIDATED FINANCIAL STATEMENTS — (continued)
FOR THE YEARS ENDED NOVEMBER 24, 2019, NOVEMBER 25, 2018 AND NOVEMBER 26, 2017
NOTE 18: INCOME TAXES
The Company's income tax expense was $82.6 million, $214.8 million and $64.2 million and the Company's effective income tax rate was 17.3%, 43.0% and 18.4% for the years ended November 24, 2019, November 25, 2018 and November 26, 2017, respectively.
On December 22, 2017, the U.S. enacted the Tax Cuts and Jobs Act (the "Tax Act"), which significantly changed U.S. tax law. The Tax Act lowered the Company’s U.S. statutory federal income tax rate from 35% to 21% effective on November 26, 2018. Beginning the first quarter of 2019, the Company's effective tax rate reflected a provision to tax Global Intangible Low-Taxed Income ("GILTI") of foreign subsidiaries and a tax benefit for Foreign Derived Intangible Income ("FDII"). In accordance with U.S. GAAP, the Company made an accounting policy election to account for the GILTI provision in the period in which it is incurred.
The decrease in the effective tax rate in 2019 as compared to 2018 was primarily driven by a $143.4 million one-time tax charge in 2018 related to the enactment of the Tax Act. Included in the charge was $95.6 million related to re-measurement of deferred tax assets and liabilities, $37.5 million from a one-time U.S. transition tax on undistributed foreign earnings, and $10.3 million related to foreign and state tax costs associated with future remittances of undistributed earnings from foreign subsidiaries. The increase in the effective tax rate in 2018 as compared to 2017 was primarily driven by a one-time tax charge related to the impact of the Tax Act described above and proportionately less tax benefit from the lower tax cost of foreign operations, partially offset by the lower U.S. federal statutory tax rate.
The Company's income tax expense differed from the amount computed by applying the U.S. federal statutory income tax rate to income before income taxes as follows:
Year Ended | |||||||||||||||||
November 24, 2019 | November 25, 2018 | November 26, 2017 | |||||||||||||||
(Dollars in thousands) | |||||||||||||||||
Income tax expense at U.S. federal statutory rate | $ | 100,293 | 21.0 | % | $ | 111,755 | 22.4 | % | $ | 122,073 | 35.0 | % | |||||
State income taxes, net of U.S. federal impact | 4,496 | 1.0 | % | 11,102 | 2.2 | % | 7,598 | 2.2 | % | ||||||||
Change in valuation allowance | (81 | ) | — | % | (9,239 | ) | (1.9 | )% | (9,624 | ) | (2.8 | )% | |||||
Impact of foreign operations(1)(2) | 7,132 | 1.5 | % | (17,149 | ) | (3.4 | )% | (43,806 | ) | (12.6 | )% | ||||||
Foreign-derived intangible income benefit ("FDII") | (11,918 | ) | (2.5 | )% | — | — | % | — | — | % | |||||||
Reassessment of tax liabilities | (6,480 | ) | (1.4 | )% | (12,552 | ) | (2.5 | )% | (5,553 | ) | (1.6 | )% | |||||
Stock-based compensation(3) | (15,730 | ) | (3.3 | )% | (10,715 | ) | (2.1 | )% | (5,602 | ) | (1.6 | )% | |||||
Other, including non-deductible expenses(1) | 4,892 | 1.0 | % | (1,783 | ) | (0.4 | )% | (861 | ) | (0.2 | )% | ||||||
Impact of US Tax Act | — | — | % | 143,359 | 28.7 | % | — | — | % | ||||||||
Total | $ | 82,604 | 17.3 | % | $ | 214,778 | 43.0 | % | $ | 64,225 | 18.4 | % | |||||
_____________
(1) | Foreign branches are included in the Impact of foreign operations. 2017 and 2018 have been conformed to the November 24, 2019 presentation. |
(2) Included in the Impact of foreign operations are foreign rates differential, GILTI and tax impact on actual and deemed repatriation of foreign earnings.
(3) | Classification of stock-based compensation for 2017 has been conformed to the November 25, 2018 and November 24, 2019 presentation. |
Impact of foreign operations. The tax rate benefit in 2019 decreased as compared to 2018 is primarily due to additional tax charges from foreign jurisdictions. Tax Act impacts (e.g. GILTI) and a lesser amount of excess tax benefit on actual and deemed repatriation of foreign earnings. The tax rate benefit in 2018 decreased as compared to 2017 primarily because the new U.S. federal income tax rate more closely aligns with the tax rates in our foreign jurisdictions.
Change in valuation allowance. The $9.2 million tax benefit in 2018 is primarily due to the release of valuation allowances on deferred tax assets of certain foreign subsidiaries, primarily in Japan where management concluded that it is more likely than not that such assets will be realized.
112
LEVI STRAUSS & CO. AND SUBSIDIARIES
NOTES TO CONSOLIDATED FINANCIAL STATEMENTS — (continued)
FOR THE YEARS ENDED NOVEMBER 24, 2019, NOVEMBER 25, 2018 AND NOVEMBER 26, 2017
Reassessment of tax liabilities. The $6.5 million tax benefit in 2019 is primarily attributable to finalization of state tax refund claims. The $12.6 million tax benefit in 2018 is primarily attributable to finalization of a foreign audit.
The U.S. and foreign components of income before income taxes were as follows:
Year Ended | |||||||||||
November 24, 2019 | November 25, 2018 | November 26, 2017 | |||||||||
(Dollars in thousands) | |||||||||||
Domestic | $ | 120,692 | $ | 151,229 | $ | 67,407 | |||||
Foreign | 356,892 | 348,793 | 281,374 | ||||||||
Total income before income taxes | $ | 477,584 | $ | 500,022 | $ | 348,781 | |||||
Income tax expense consisted of the following:
Year Ended | |||||||||||
November 24, 2019 | November 25, 2018 | November 26, 2017 | |||||||||
(Dollars in thousands) | |||||||||||
U.S. Federal | |||||||||||
Current | $ | 13,182 | $ | 12,468 | $ | 7,936 | |||||
Deferred | (22,319 | ) | 126,210 | 1,240 | |||||||
$ | (9,137 | ) | $ | 138,678 | $ | 9,176 | |||||
U.S. State | |||||||||||
Current | $ | (2,939 | ) | $ | 6,447 | $ | 3,441 | ||||
Deferred | 1,002 | 4,655 | 4,157 | ||||||||
$ | (1,937 | ) | $ | 11,102 | $ | 7,598 | |||||
Foreign | |||||||||||
Current | $ | 87,324 | $ | 61,605 | $ | 53,334 | |||||
Deferred | 6,354 | 3,393 | (5,883 | ) | |||||||
$ | 93,678 | $ | 64,998 | $ | 47,451 | ||||||
Consolidated | |||||||||||
Current | $ | 97,567 | $ | 80,520 | $ | 64,711 | |||||
Deferred | (14,963 | ) | 134,258 | (486 | ) | ||||||
Total income tax expense | $ | 82,604 | $ | 214,778 | $ | 64,225 | |||||
113
LEVI STRAUSS & CO. AND SUBSIDIARIES
NOTES TO CONSOLIDATED FINANCIAL STATEMENTS — (continued)
FOR THE YEARS ENDED NOVEMBER 24, 2019, NOVEMBER 25, 2018 AND NOVEMBER 26, 2017
Deferred Tax Assets and Liabilities
The Company's deferred tax assets and deferred tax liabilities were as follows:
November 24, 2019 | November 25, 2018 | ||||||
(Dollars in thousands) | |||||||
Deferred tax assets | |||||||
Foreign tax credit carryforwards | $ | 157,379 | $ | 133,620 | |||
State net operating loss carryforwards | 10,070 | 9,708 | |||||
Foreign net operating loss carryforwards | 45,047 | 52,327 | |||||
Employee compensation and benefit plans(1) | 141,489 | 147,347 | |||||
Advance royalties | 15,213 | 22,366 | |||||
Accrued liabilities(1) | 24,648 | 26,167 | |||||
Sales returns and allowances(1) | 22,494 | 25,715 | |||||
Inventory(1) | 11,635 | 13,030 | |||||
Property, plant and equipment(1) | 12,266 | 11,823 | |||||
Unrealized foreign exchange gains or losses | 5,527 | 5,467 | |||||
Other(1) | 9,557 | 8,718 | |||||
Total gross deferred tax assets | 455,325 | 456,288 | |||||
Less: Valuation allowance | (19,611 | ) | (21,970 | ) | |||
Deferred tax assets, net of valuation allowance | 435,714 | 434,318 | |||||
Deferred tax liabilities | |||||||
U.S. Branches(1) | (27,134 | ) | (33,735 | ) | |||
Residual tax liability on unremitted foreign earnings | (5,672 | ) | (5,737 | ) | |||
Total deferred tax liabilities | (32,806 | ) | (39,472 | ) | |||
Total net deferred tax assets | $ | 402,908 | $ | 394,846 | |||
_____________
(1) | Certain components of net deferred tax assets for 2018 have been conformed to reflect the adoption of Tax Act guidance updates issued subsequent to November 25, 2018. |
Foreign tax credit carryforwards. The foreign tax credit carryforwards at November 24, 2019, are subject to expiration through 2029 if not utilized.
Foreign net operating loss carryforwards. As of November 24, 2019, the Company had a deferred tax asset of $44.2 million for foreign net operating loss carryforwards of $168.0 million. Of these operating losses $79.9 million are subject to expiration through 2028. The remaining $88.1 million are available as indefinite carryforwards under applicable tax law.
Valuation Allowance. The following table details the changes in valuation allowance during the year ended November 24, 2019:
Valuation Allowance at November 25, 2018 | Changes in Related Gross Deferred Tax Asset | Change / (Release) | Valuation Allowance at November 24, 2019 | ||||||||||||
(Dollars in thousands) | |||||||||||||||
U.S. state net operating loss carryforwards | $ | 2,096 | $ | (494 | ) | $ | 938 | $ | 2,540 | ||||||
Foreign net operating loss carryforwards and other foreign deferred tax assets | 19,874 | (1,784 | ) | (1,019 | ) | 17,071 | |||||||||
$ | 21,970 | $ | (2,278 | ) | $ | (81 | ) | $ | 19,611 | ||||||
114
LEVI STRAUSS & CO. AND SUBSIDIARIES
NOTES TO CONSOLIDATED FINANCIAL STATEMENTS — (continued)
FOR THE YEARS ENDED NOVEMBER 24, 2019, NOVEMBER 25, 2018 AND NOVEMBER 26, 2017
At November 24, 2019, the Company's valuation allowance primarily related to its gross deferred tax assets for state and foreign net operating loss carryforwards, which reduced such assets to the amount that will more likely than not be realized.
Unremitted earnings of certain foreign subsidiaries. The Company historically provided for U.S. income taxes on the undistributed earnings of foreign subsidiaries unless they were considered indefinitely reinvested outside the United States. The Company has reevaluated its historic indefinite reinvestment assertion as a result of the enactment of the Tax Act and determined that any historical undistributed earnings through November 25, 2018 of foreign subsidiaries, as well as most of the additional undistributed earnings generated through November 2019, are no longer considered to be indefinitely reinvested. The deferred tax liability related to foreign and state tax costs associated with the future remittance of these undistributed earnings of foreign subsidiaries was $9.7 million. For the year ended November 24, 2019, management asserted indefinite reinvestment on a small portion of foreign earnings generated in fiscal year 2019. If such earnings were to be distributed to the U.S., the related foreign withholding and state tax costs would be approximately $1 million.
Uncertain Income Tax Positions
As of November 24, 2019, the Company’s total gross amount of unrecognized tax benefits was $36.6 million, of which $33.1 million could impact the effective tax rate, if recognized, as compared to November 25, 2018, when the Company’s total gross amount of unrecognized tax benefits was $26.6 million, of which $24.2 million could have impacted the effective tax rate, if recognized.
The following table reflects the changes to the Company's unrecognized tax benefits for the year ended November 24, 2019 and November 25, 2018:
November 24, 2019 | November 25, 2018 | ||||||
(Dollars in thousands) | |||||||
Unrecognized tax benefits beginning balance | $ | 26,594 | $ | 33,786 | |||
Increases related to current year tax positions | 2,432 | 3,657 | |||||
Increases related to tax positions from prior years | 3,696 | 5,686 | |||||
Decreases related to tax positions from prior years | (3,222 | ) | (13,731 | ) | |||
Settlement with tax authorities | 7,119 | — | |||||
Lapses of statutes of limitation | (45 | ) | (1,811 | ) | |||
Other, including foreign currency translation | (15 | ) | (993 | ) | |||
Unrecognized tax benefits ending balance | $ | 36,559 | $ | 26,594 | |||
The Company evaluates all domestic and foreign audit issues and believes that it is reasonably possible that total gross unrecognized tax benefits could decrease by as much as $2.2 million within the next twelve months.
As of November 24, 2019 and November 25, 2018, accrued interest and penalties primarily relating to non-U.S. jurisdictions were $1.7 million and $2.7 million, respectively.
The Company files income tax returns in the United States and in various foreign (including Belgium, Hong Kong, India, Mexico and Russia), state and local jurisdictions. With few exceptions, examinations have been completed by tax authorities or the statute of limitations has expired for United States federal, foreign, state and local income tax returns filed by the Company for years through 2008.
115
LEVI STRAUSS & CO. AND SUBSIDIARIES
NOTES TO CONSOLIDATED FINANCIAL STATEMENTS — (continued)
FOR THE YEARS ENDED NOVEMBER 24, 2019, NOVEMBER 25, 2018 AND NOVEMBER 26, 2017
NOTE 19: EARNINGS PER SHARE ATTRIBUTABLE TO COMMON STOCKHOLDERS
Basic earnings per share attributable to common stockholders is calculated by dividing net income attributable to common stockholders by the weighted-average number of common shares outstanding. Diluted earnings per share attributable to common stockholders adjusts the basic earnings per share attributable to common stockholders and the weighted-average number of common shares outstanding for the potentially dilutive impact of RSUs and stock appreciation rights using the treasury stock method. The following table sets forth the computation of the Company's basic and diluted earnings per share:
Year Ended | |||||||||||
November 24, 2019 | November 25, 2018 | November 26, 2017 | |||||||||
(Dollars in thousands, except per share amounts) | |||||||||||
Numerator: | |||||||||||
Net income attributable to Levi Strauss & Co. | $ | 394,612 | $ | 283,142 | $ | 281,403 | |||||
Denominator: | |||||||||||
Weighted-average common shares outstanding - basic | 389,082,277 | 377,139,847 | 376,177,350 | ||||||||
Dilutive effect of stock awards | 19,283,625 | 11,467,514 | 8,160,980 | ||||||||
Weighted-average common shares outstanding - diluted | 408,365,902 | 388,607,361 | 384,338,330 | ||||||||
Earnings per common share attributable to common stockholders: | |||||||||||
Basic | $ | 1.01 | $ | 0.75 | $ | 0.75 | |||||
Diluted | $ | 0.97 | $ | 0.73 | $ | 0.73 | |||||
Anti-dilutive securities excluded from calculation of diluted earnings per share attributable to common stockholders | 174,923 | 755,550 | 9,045,540 | ||||||||
NOTE 20: RELATED PARTIES
Charles V. Bergh, President and Chief Executive Officer, Peter E. Haas Jr., a director of the Company who retired in September 2019, and Marc Rosen, Executive Vice President and President of Direct-to-Consumer, are board members of the Levi Strauss Foundation, which is not a consolidated entity of the Company. Seth R. Jaffe, Executive Vice President and General Counsel, is Vice President of the Levi Strauss Foundation. During fiscal years 2019, 2018, and 2017, the Company donated $9.7 million, $7.5 million, and $7.3 million, respectively, to the Levi Strauss Foundation.
116
LEVI STRAUSS & CO. AND SUBSIDIARIES
NOTES TO CONSOLIDATED FINANCIAL STATEMENTS — (continued)
FOR THE YEARS ENDED NOVEMBER 24, 2019, NOVEMBER 25, 2018 AND NOVEMBER 26, 2017
NOTE 21: BUSINESS SEGMENT INFORMATION
The Company manages its business according to three regional segments: the Americas, Europe and Asia. The Company considers its chief executive officer to be the Company’s chief operating decision maker. The Company’s chief operating decision maker manages business operations, evaluates performance and allocates resources based on the regional segments’ net revenues and operating income. The Company reports net trade receivables and inventories by segment as that information is used by the chief operating decision maker in assessing segment performance. The Company does not report its other assets by segment as that information is not used by the chief operating decision maker in assessing segment performance.
Business segment information for the Company is as follows:
Year Ended | |||||||||||
November 24, 2019 | November 25, 2018 | November 26, 2017 | |||||||||
(Dollars in thousands) | |||||||||||
Net revenues: | |||||||||||
Americas | $ | 3,057,024 | $ | 3,042,664 | $ | 2,774,050 | |||||
Europe | 1,768,056 | 1,646,236 | 1,312,276 | ||||||||
Asia | 938,007 | 886,540 | 817,704 | ||||||||
Total net revenues | $ | 5,763,087 | $ | 5,575,440 | $ | 4,904,030 | |||||
Operating income: | |||||||||||
Americas | $ | 545,084 | $ | 551,380 | $ | 529,310 | |||||
Europe | 353,082 | 292,903 | 198,662 | ||||||||
Asia | 85,824 | 86,573 | 78,257 | ||||||||
Regional operating income | 983,990 | 930,856 | 806,229 | ||||||||
Corporate expenses(1)(2) | 417,315 | 390,445 | 326,162 | ||||||||
Total operating income | 566,675 | 540,411 | 480,067 | ||||||||
Interest expense | (66,248 | ) | (55,296 | ) | (68,603 | ) | |||||
Underwriter commission paid on behalf of selling stockholders | (24,860 | ) | — | — | |||||||
Loss on early extinguishment of debt | — | — | (22,793 | ) | |||||||
Other income (expense), net(2) | 2,017 | 14,907 | (39,890 | ) | |||||||
Income before income taxes | $ | 477,584 | $ | 500,022 | $ | 348,781 | |||||
____
(1) Included in Corporate expenses for the year ended November 26, 2017 is the recognition of $8.3 million of stock-based compensation expense related to prior periods, for the correction of the periods used for the recognition of expense associated with employees eligible to vest in awards after retirement. Refer to Note 1 for more information.
(2) | The amounts in Corporate expenses and Other income (expense), net prior to fiscal year 2019 have been conformed to reflect the adoption of ASU 2017-07, "Compensation-Retirement Benefits (Topic 715) Improving the Presentation of Net Periodic Cost and Net Periodic Postretirement Benefit Cost" and include non-service cost component of net periodic benefit costs. Refer to Note 1 for more information. |
117
LEVI STRAUSS & CO. AND SUBSIDIARIES
NOTES TO CONSOLIDATED FINANCIAL STATEMENTS — (continued)
FOR THE YEARS ENDED NOVEMBER 24, 2019, NOVEMBER 25, 2018 AND NOVEMBER 26, 2017
Year Ended | |||||||||||
November 24, 2019 | November 25, 2018 | November 26, 2017 | |||||||||
(Dollars in thousands) | |||||||||||
Depreciation and amortization expense: | |||||||||||
Americas | $ | 45,884 | $ | 43,478 | $ | 37,802 | |||||
Europe | 23,595 | 22,658 | 17,479 | ||||||||
Asia | 12,110 | 10,750 | 9,836 | ||||||||
Corporate | 42,353 | 43,319 | 52,270 | ||||||||
Total depreciation and amortization expense | $ | 123,942 | $ | 120,205 | $ | 117,387 | |||||
November 24, 2019 | |||||||||||||||||||
Americas | Europe | Asia | Unallocated | Consolidated Total | |||||||||||||||
(Dollars in thousands) | |||||||||||||||||||
Assets: | |||||||||||||||||||
Trade receivables, net | $ | 457,979 | $ | 176,962 | $ | 130,073 | $ | 17,832 | $ | 782,846 | |||||||||
Inventories | 456,611 | 180,949 | 157,892 | 88,740 | 884,192 | ||||||||||||||
All other assets | — | — | — | 2,565,380 | 2,565,380 | ||||||||||||||
Total assets | $ | 4,232,418 | |||||||||||||||||
November 25, 2018 | |||||||||||||||||||
Americas | Europe | Asia | Unallocated | Consolidated Total | |||||||||||||||
(Dollars in thousands) | |||||||||||||||||||
Assets: | |||||||||||||||||||
Trade receivables, net | $ | 362,825 | $ | 102,989 | $ | 54,266 | $ | 14,084 | $ | 534,164 | |||||||||
Inventories | 468,258 | 188,430 | 148,335 | 78,750 | 883,773 | ||||||||||||||
All other assets | — | — | — | 2,124,723 | 2,124,723 | ||||||||||||||
Total assets | $ | 3,542,660 | |||||||||||||||||
118
LEVI STRAUSS & CO. AND SUBSIDIARIES
NOTES TO CONSOLIDATED FINANCIAL STATEMENTS — (continued)
FOR THE YEARS ENDED NOVEMBER 24, 2019, NOVEMBER 25, 2018 AND NOVEMBER 26, 2017
Geographic information for the Company was as follows:
Year Ended | |||||||||||
November 24, 2019 | November 25, 2018 | November 26, 2017 | |||||||||
(Dollars in thousands) | |||||||||||
Net revenues: | |||||||||||
United States | $ | 2,525,325 | $ | 2,546,907 | $ | 2,347,860 | |||||
Foreign countries | 3,237,762 | 3,028,533 | 2,556,170 | ||||||||
Total net revenues | $ | 5,763,087 | $ | 5,575,440 | $ | 4,904,030 | |||||
Net deferred tax assets: | |||||||||||
United States | $ | 327,980 | $ | 313,644 | $ | 450,270 | |||||
Foreign countries | 79,925 | 84,147 | 87,653 | ||||||||
Total net deferred tax assets | $ | 407,905 | $ | 397,791 | $ | 537,923 | |||||
Long-lived assets: | |||||||||||
United States | $ | 376,883 | $ | 335,705 | $ | 312,656 | |||||
Foreign countries | 194,762 | 154,767 | 141,660 | ||||||||
Total long-lived assets | $ | 571,645 | $ | 490,472 | $ | 454,316 | |||||
119
LEVI STRAUSS & CO. AND SUBSIDIARIES
NOTES TO CONSOLIDATED FINANCIAL STATEMENTS — (continued)
FOR THE YEARS ENDED NOVEMBER 24, 2019, NOVEMBER 25, 2018 AND NOVEMBER 26, 2017
NOTE 22: QUARTERLY FINANCIAL DATA (UNAUDITED)
Set forth below are the consolidated statements of operations for the first, second, third and fourth quarters of 2019 and 2018.
Year Ended November 24, 2019 | First Quarter | Second Quarter | Third Quarter | Fourth Quarter | |||||||||||
(Dollars in thousands, except per share amounts) | |||||||||||||||
Net revenues | $ | 1,434,458 | $ | 1,312,940 | $ | 1,447,081 | $ | 1,568,608 | |||||||
Cost of goods sold | 651,650 | 612,517 | 680,335 | 717,212 | |||||||||||
Gross profit | 782,808 | 700,423 | 766,746 | 851,396 | |||||||||||
Selling, general and administrative expenses | 581,896 | 637,525 | 595,528 | 719,749 | |||||||||||
Operating income | 200,912 | 62,898 | 171,218 | 131,647 | |||||||||||
Interest expense | (17,544 | ) | (15,126 | ) | (15,292 | ) | (18,286 | ) | |||||||
Underwriter commission paid on behalf of selling | — | (24,860 | ) | — | — | ||||||||||
Other (expense) income, net | (1,646 | ) | 3,166 | (4,369 | ) | 4,866 | |||||||||
Income before income taxes | 181,722 | 26,078 | 151,557 | 118,227 | |||||||||||
Income tax expense (benefit)(1) | 35,271 | (2,429 | ) | 27,340 | 22,422 | ||||||||||
Net income | 146,451 | 28,507 | 124,217 | 95,805 | |||||||||||
Net loss (income) attributable to noncontrolling interest | 126 | (277 | ) | 292 | (509 | ) | |||||||||
Net income attributable to Levi Strauss & Co. | $ | 146,577 | $ | 28,230 | $ | 124,509 | $ | 95,296 | |||||||
Earnings per common share attributable to common stockholders(2): | |||||||||||||||
Basic | $ | 0.39 | $ | 0.07 | $ | 0.32 | $ | 0.24 | |||||||
Diluted | $ | 0.37 | $ | 0.07 | $ | 0.30 | $ | 0.23 | |||||||
Weighted-average common shares outstanding - diluted | |||||||||||||||
Basic | 377,077,111 | 389,518,461 | 394,169,688 | 394,670,867 | |||||||||||
Diluted | 393,234,825 | 409,332,997 | 413,639,749 | 411,984,817 | |||||||||||
Cash dividends declared per share | $ | 0.29 | $ | — | $ | — | $ | 0.01 | |||||||
_____________
(1) | The Income tax benefit in the second quarter is due to lower income taxes from less operating income and an excess tax benefit recognized related to the exercise of employee stock-based compensation. |
(2) | The sum of the quarterly earnings per share may not equal the full-year amount, as the computations of the weighted-average number of common basic and diluted shares outstanding for each quarter and the full year are performed independently. |
120
LEVI STRAUSS & CO. AND SUBSIDIARIES
NOTES TO CONSOLIDATED FINANCIAL STATEMENTS — (continued)
FOR THE YEARS ENDED NOVEMBER 24, 2019, NOVEMBER 25, 2018 AND NOVEMBER 26, 2017
Year Ended November 25, 2018 | First Quarter | Second Quarter | Third Quarter | Fourth Quarter | |||||||||||
(Dollars in thousands, except per share amounts) | |||||||||||||||
Net revenues | $ | 1,343,685 | $ | 1,245,742 | $ | 1,394,153 | $ | 1,591,860 | |||||||
Cost of goods sold | 605,561 | 574,865 | 652,591 | 744,448 | |||||||||||
Gross profit | 738,124 | 670,877 | 741,562 | 847,412 | |||||||||||
Selling, general and administrative expenses(2) | 563,202 | 593,595 | 582,146 | 718,621 | |||||||||||
Operating income | 174,922 | 77,282 | 159,416 | 128,791 | |||||||||||
Interest expense | (15,497 | ) | (14,465 | ) | (15,697 | ) | (9,637 | ) | |||||||
Other (expense) income, net(2) | (10,400 | ) | 12,895 | (3,839 | ) | 16,251 | |||||||||
Income before income taxes | 149,025 | 75,712 | 139,880 | 135,405 | |||||||||||
Income tax expense (benefit)(3) | 167,654 | (1,320 | ) | 10,299 | 38,145 | ||||||||||
Net (loss) income | (18,629 | ) | 77,032 | 129,581 | 97,260 | ||||||||||
Net (income) loss attributable to noncontrolling interest | (383 | ) | (2,100 | ) | 543 | (162 | ) | ||||||||
Net (loss) income attributable to Levi Strauss & Co. | $ | (19,012 | ) | $ | 74,932 | $ | 130,124 | $ | 97,098 | ||||||
Earnings per common share attributable to common stockholders(1): | |||||||||||||||
Basic | $ | (0.05 | ) | $ | 0.20 | $ | 0.34 | $ | 0.26 | ||||||
Diluted | $ | (0.05 | ) | $ | 0.19 | $ | 0.33 | $ | 0.25 | ||||||
Weighted-average common shares outstanding - diluted | |||||||||||||||
Basic | 376,165,783 | 377,132,162 | 377,742,492 | 376,968,560 | |||||||||||
Diluted | 376,165,783 | 387,764,580 | 390,586,032 | 391,088,937 | |||||||||||
Cash dividends declared per share | $ | 0.24 | $ | — | $ | — | $ | — | |||||||
_____________
(1) | The sum of the quarterly earnings per share may not equal the full-year amount, as the computations of the weighted-average number of common basic and diluted shares outstanding for each quarter and the full year are performed independently. |
(2) | The amounts in Selling, general and administrative expenses and Other income (expense), net in 2018 have been conformed to reflect the adoption of ASU 2017-07, "Compensation-Retirement Benefits (Topic 715) Improving the Presentation of Net Periodic Cost and Net Periodic Postretirement Benefit Cost" and include non-service cost component of net periodic benefit costs. Refer to Note 1 for more information. |
(3) | The Income tax expense in the first quarter is due to the one-time tax charge recorded in relation to the newly enacted Tax Act. The Income tax benefit in the second quarter is due to lower income taxes from less operating income and the release of tax reserves as tax audits were finalized. |
121
LEVI STRAUSS & CO. AND SUBSIDIARIES
NOTES TO CONSOLIDATED FINANCIAL STATEMENTS — (continued)
FOR THE YEARS ENDED NOVEMBER 24, 2019, NOVEMBER 25, 2018 AND NOVEMBER 26, 2017
NOTE 23: SUBSEQUENT EVENTS
The Jeans Company Acquisition
On December 17, 2019, the Company completed its acquisition of all operating assets related to Levi’s® and Dockers® brands from The Jeans Company ("TJC"), LS&Co's distributor in Chile, Peru and Bolivia, for $52 million, plus transaction costs. The assets acquired included 78 Levi’s® and Dockers® retail stores, distribution with the region’s leading multi-brand retailers, and the logistical operations in these markets, which the Company anticipates will accelerate growth within the Americas region.
122
Item 9. | CHANGES IN AND DISAGREEMENTS WITH ACCOUNTANTS ON ACCOUNTING AND FINANCIAL DISCLOSURE |
None.
Item 9A. | CONTROLS AND PROCEDURES |
Evaluation of disclosure controls and procedures
We have evaluated, under the supervision and with the participation of management, including our chief executive officer and our chief financial officer, the effectiveness of the design and operation of our disclosure controls and procedures (as defined in Rules 13a-15(e) and 15d-15(e) under the Securities and Exchange Act of 1934 (the "Exchange Act") as of November 24, 2019. Based on that evaluation, our chief executive officer and our chief financial officer concluded that as of November 24, 2019, our disclosure controls and procedures were effective at the reasonable assurance level.
Management's annual report on internal control over financial reporting
We maintain a system of internal control over financial reporting that is designed to provide reasonable assurance that our books and records accurately reflect our transactions and that our established policies and procedures are followed. Because of inherent limitations, internal control over financial reporting may not prevent or detect misstatements. Also, projections of any evaluation of effectiveness to future periods are subject to the risk that controls may become inadequate because of changes in conditions, or that the degree of compliance with the policies or procedures may deteriorate.
Our management is responsible for establishing and maintaining adequate internal control over financial reporting (as defined in Rule 13a-15(f) under the Exchange Act). Our management assessed the effectiveness of our internal control over financial reporting and concluded that our internal control over financial reporting was effective as of November 24, 2019. In making this assessment, our management used the criteria set forth by the Committee of Sponsoring Organizations of the Treadway Commission (“COSO”) in Internal Control-Integrated Framework (2013).
Changes in internal controls
We maintain a system of internal control over financial reporting that is designed to provide reasonable assurance that our books and records accurately reflect our transactions and that our established policies and procedures are followed. There were no changes to our internal control over financial reporting during our last fiscal quarter that have materially affected, or are reasonably likely to materially affect, our internal control over financial reporting.
Item 9B. | OTHER INFORMATION |
On January 28, 2020, our Board adopted and approved a Senior Executive Severance Plan (the “Severance Plan”), effective January 28, 2020, for eligible executives who are direct reports to, and including, our President and Chief Executive Officer. The Severance Plan supersedes our prior Severance Plan for our Worldwide Leadership Team (“WLT Severance Plan”). Except as noted below, the Severance Plan provides for the same benefits as the WLT Severance Plan, a summary of which is set forth in our Proxy Statement for the 2019 Annual Meeting of Stockholders, under the heading “Potential Payments Upon Termination, Change In Control or Corporate Transaction - Severance Plan”, which was filed with the Securities and Exchange Commission on June 5, 2019 and is subject to and qualified in its entirety by the WLT Severance Plan, a copy of which is attached hereto as Exhibit 10.18 and incorporated herein by reference.
The Severance Plan also provides that eligible employees who terminate employment without cause or for Good Reason are deemed to continue employment during the severance period for determining vesting with respect to performance-based long-term incentive awards, with such awards, if vested, being paid on a pro-rata basis measured from the beginning of the performance period through the employee’s actual date of separation. The Severance Plan also provides that “Good Reason” as defined under the plan would include a material reduction in the eligible employee’s target annual bonus, except to the extent such reduction applied to all eligible employees.
The above description is a summary of the terms of the Severance Plan and is subject to and qualified in its entirety by the Severance Plan, a copy of which is attached hereto as Exhibit 10.21 and incorporated herein by reference.
123
PART III
Item 10. | DIRECTORS, EXECUTIVE OFFICERS AND CORPORATE GOVERNANCE |
Information required by this item regarding directors and director nominees, executive officers, the board of directors and its committees, certain corporate governance matters, and compliance with Section 16(a) of the Exchange Act is incorporated by reference to the information set forth in the definitive proxy statement for our 2020 Annual Meeting of Stockholders (the “2020 Proxy Statement”).
Item 11. | EXECUTIVE COMPENSATION |
Information required by this item regarding executive compensation is incorporated by reference to the information set forth in our 2020 Proxy Statement.
Item 12. | SECURITY OWNERSHIP OF CERTAIN BENEFICIAL OWNERS AND MANAGEMENT AND RELATED STOCKHOLDER MATTERS |
Information required by this item regarding security ownership of certain beneficial owners and management and securities authorized for issuance under our equity compensation plans is incorporated by reference to the information set forth in our 2020 Proxy Statement.
Item 13. | CERTAIN RELATIONSHIPS AND RELATED TRANSACTIONS, AND DIRECTOR INDEPENDENCE |
Information required by this item regarding certain relationships and related transactions and director independence is incorporated by reference to the information set forth in our 2020 Proxy Statement.
Item 14. | PRINCIPAL ACCOUNTANT FEES AND SERVICES |
Information required by this item regarding principal accounting fees and services is incorporated by reference to the information set forth in our 2020 Proxy Statement.
124
PART IV
Item 15. | EXHIBITS, FINANCIAL STATEMENT SCHEDULES |
List the following documents filed as a part of the report:
1. Financial Statements
The following consolidated financial statements of the Registrant are included in Item 8:
Report of Independent Registered Public Accounting Firm
Consolidated Balance Sheets
Consolidated Statements of Income
Consolidated Statements of Comprehensive Income
Consolidated Statements of Stockholders' Equity
Consolidated Statements of Cash Flows
Notes to Consolidated Financial Statements
2. Financial Statement Schedule
Schedule II – Valuation and Qualifying Accounts
All other schedules have been omitted because they are inapplicable, not required or the information is included in the Consolidated Financial Statements or Notes thereto.
Incorporated by Reference | ||||||
Exhibit Number | Description of Document | Form | SEC File No. | Exhibit | Filing Date | Filed Herewith |
3.1 | 8-K | 001-06631 | 3.1 | 3/25/2019 | ||
3.2 | 8-K | 001-06631 | 3.2 | 3/25/2019 | ||
4.1 | Reference is made to Exhibits 3.1 through 3.2 | |||||
4.2 | S-1/A | 333-229630 | 4.1 | 3/11/2019 | ||
4.3 | S-1 | 333-229630 | 4.2 | 2/13/2019 | ||
4.4 | S-1 | 333-229630 | 4.3 | 2/13/2019 | ||
4.5 | S-1 | 333-229630 | 4.4 | 2/13/2019 | ||
4.6 | S-1 | 333-229630 | 4.5 | 2/13/2019 | ||
4.7 | S-1/A | 333-229630 | 4.6 | 3/6/2019 | ||
4.8 | X | |||||
10.1* | S-1 | 333-229630 | 10.3 | 2/13/2019 | ||
125
10.2* | S-1 | 333-229630 | 10.4 | 2/13/2019 | ||
10.3* | S-1 | 333-229630 | 10.5 | 2/13/2019 | ||
10.4* | S-1 | 333-229630 | 10.6 | 2/13/2019 | ||
10.5* | S-1 | 333-229630 | 10.7 | 2/13/2019 | ||
10.6* | S-1/A | 333-229630 | 10.8 | 3/11/2019 | ||
10.7* | S-1/A | 333-229630 | 10.9 | 3/11/2019 | ||
10.8 | X | |||||
10.9 | X | |||||
10.10 | X | |||||
10.11 | X | |||||
10.12 | X | |||||
10.13 | X | |||||
10.14* | S-1 | 333-229630 | 10.10 | 2/13/2019 | ||
10.15* | S-1 | 333-229630 | 10.11 | 2/13/2019 | ||
10.16* | S-1 | 333-229630 | 10.12 | 2/13/2019 | ||
10.17* | S-1 | 333-229630 | 10.13 | 2/13/2019 | ||
10.18* | S-1 | 333-229630 | 10.14 | 2/13/2019 | ||
10.19** | X | |||||
10.20* | S-1 | 333-229630 | 10.15 | 2/13/2019 | ||
10.21* | S-1 | 333-229630 | 10.16 | 2/13/2019 | ||
10.22* | S-1 | 333-229630 | 10.17 | 2/13/2019 | ||
10.23* | S-1 | 333-229630 | 10.18 | 2/13/2019 | ||
10.24* | S-1 | 333-229630 | 10.19 | 2/13/2019 | ||
10.25* | S-1 | 333-229630 | 10.20 | 2/13/2019 | ||
10.26* | S-1 | 333-229630 | 10.21 | 2/13/2019 | ||
126
10.27* | S-1 | 333-229630 | 10.22 | 2/13/2019 | ||
10.28* | S-1 | 333-229630 | 10.23 | 2/13/2019 | ||
10.29* | S-1 | 333-229630 | 10.24 | 2/13/2019 | ||
10.30* | S-1 | 333-229630 | 10.25 | 2/13/2019 | ||
10.31* | S-1 | 333-229630 | 10.26 | 2/13/2019 | ||
10.32 | S-1 | 333-229630 | 10.27 | 2/13/2019 | ||
10.33 | S-1 | 333-229630 | 10.28 | 2/13/2019 | ||
10.34 | S-1 | 333-229630 | 10.29 | 2/13/2019 | ||
10.35 | S-1 | 333-229630 | 10.30 | 2/13/2019 | ||
10.36 | S-1 | 333-229630 | 10.31 | 2/13/2019 | ||
10.37* | 10-Q | 001-06631 | 10.5 | 7/9/2019 | ||
10.38* | 10-Q | 001-00631 | 10.1 | 10/8/2019 | ||
21.1 | X | |||||
23.1 | X | |||||
31.1 | X | |||||
31.2 | X | |||||
32.1† | X | |||||
101.INS | XBRL Instance Document | X | ||||
101.SCH | XBRL Taxonomy Extension Schema Document | X | ||||
101.CAL | XBRL Taxonomy Extension Calculation Linkbase Document | X | ||||
127
101.DEF | XBRL Taxonomy Extension Definition Linkbase Document | X | ||||
101.LAB | XBRL Taxonomy Extension Label Linkbase Document | X | ||||
101.PRE | XBRL Taxonomy Extension Presentation Linkbase Document | X | ||||
* | Indicates management contract or compensatory plan or arrangement. |
** | Portions of this exhibit have been redacted and filed separately with the Commission, pursuant to a request for confidential treatment granted by the Commission. |
† | The certifications attached as Exhibit 32.1 accompany this Annual Report on Form 10-K are not deemed filed with the Commission and are not to be incorporated by reference into any filing of Levi Strauss & Co. under the Securities Act of 1933, as amended, or the Securities Exchange Act of 1934, as amended, whether made before or after the date of this Annual Report on Form 10-K, irrespective of any general incorporation language contained in such filing. |
128
SCHEDULE II | |||||||||||||||
LEVI STRAUSS & CO. AND SUBSIDIARIES | |||||||||||||||
VALUATION AND QUALIFYING ACCOUNTS | |||||||||||||||
Allowance for Doubtful Accounts | Balance at Beginning of Period | Additions Charged to Expenses | Deductions(1) | Balance at End of Period | |||||||||||
(Dollars in thousands) | |||||||||||||||
November 24, 2019 | $ | 10,037 | $ | (978 | ) | $ | 2,887 | $ | 6,172 | ||||||
November 25, 2018 | $ | 11,726 | $ | 2,284 | $ | 3,973 | $ | 10,037 | |||||||
November 26, 2017 | $ | 11,974 | $ | 1,645 | $ | 1,893 | $ | 11,726 | |||||||
Sales Returns | Balance at Beginning of Period | Additions Charged to Net Sales | Deductions(1) | Balance at End of Period | |||||||||||
(Dollars in thousands) | |||||||||||||||
November 24, 2019(2) | $ | 53,684 | $ | 259,866 | $ | 313,550 | $ | — | |||||||
November 25, 2018 | $ | 47,401 | $ | 245,665 | $ | 239,382 | $ | 53,684 | |||||||
November 26, 2017 | $ | 36,457 | $ | 211,741 | $ | 200,797 | $ | 47,401 | |||||||
Sales Discounts and Incentives | Balance at Beginning of Period | Additions Charged to Net Sales | Deductions(1) | Balance at End of Period | |||||||||||
(Dollars in thousands) | |||||||||||||||
November 24, 2019(2) | $ | 120,704 | $ | 351,686 | $ | 470,634 | $ | 1,756 | |||||||
November 25, 2018 | $ | 135,139 | $ | 357,929 | $ | 372,364 | $ | 120,704 | |||||||
November 26, 2017 | $ | 105,477 | $ | 342,169 | $ | 312,507 | $ | 135,139 | |||||||
Valuation Allowance Against Deferred Tax Assets | Balance at Beginning of Period | Charges/(Releases) to Tax Expense | (Additions) / Deductions | Balance at End of Period | |||||||||||
(Dollars in thousands) | |||||||||||||||
November 24, 2019 | $ | 21,970 | $ | (81 | ) | $ | 2,278 | $ | 19,611 | ||||||
November 25, 2018 | $ | 38,692 | $ | (16,242 | ) | $ | 480 | $ | 21,970 | ||||||
November 26, 2017 | $ | 68,212 | $ | (19,301 | ) | $ | 10,219 | $ | 38,692 | ||||||
_____________
(1) | The charges to the accounts are for the purposes for which the allowances were created. |
(2) | In accordance with ASU 2014-09, “Revenue from Contracts with Customers”, adopted in 2019, allowances for estimated returns, discounts and retailer promotions and other similar incentives are presented as other accrued liabilities rather than netted within accounts receivable. Refer to Note 1 for more information. |
129
Item 16. | FORM 10-K SUMMARY. |
None.
130
SIGNATURES
Pursuant to the requirements of Section 13 or 15(d) of the Securities Exchange Act of 1934, the registrant has duly caused this report to be signed on its behalf by the undersigned, thereunto duly authorized.
Date: | January 30, 2020 | LEVI STRAUSS & CO. | |
(Registrant) | |||
By: | /s/ HARMIT SINGH | ||
Harmit Singh Executive Vice President and Chief Financial Officer (Principal Financial Officer) | |||
131
KNOW ALL PERSONS BY THESE PRESENTS, that each person whose signature appears below constitutes and appoints Charles V. Bergh, Harmit Singh and Seth R. Jaffe, and each of them, as his or her true and lawful attorneys-in-fact and agents, with full power of substitution for him or her, and in his or her name in any and all capacities, to sign any and all amendments to this Annual Report on Form 10-K, and to file the same, with exhibits thereto and other documents in connection therewith, with the U.S. Securities and Exchange Commission, granting unto said attorneys-in-fact and agents, and each of them, full power and authority to do and perform each and every act and thing requisite and necessary to be done therewith, as fully to all intents and purposes as he or she might or could do in person, hereby ratifying and confirming all that said attorneys-in-fact and agents, and either of them, his or her substitute or substitutes, may lawfully do or cause to be done by virtue hereof.
Pursuant to the requirements of the Securities Exchange Act of 1934, this report has been signed below by the following persons on behalf of the registrant and in the capacities and on the dates indicated.
Signature | Title | ||
/s/ STEPHEN C. NEAL | Chairperson of the Board | Date: | January 30, 2020 |
Stephen C. Neal | |||
/s/ CHARLES V. BERGH | Director, President and | Date: | January 30, 2020 |
Charles V. Bergh | Chief Executive Officer | ||
(Principal Executive Officer) | |||
/s/ TROY ALSTEAD | Director | Date: | January 30, 2020 |
Troy Alstead | |||
/s/ JILL BERAUD | Director | Date: | January 30, 2020 |
Jill Beraud | |||
/s/ ROBERT A. ECKERT | Director | Date: | January 30, 2020 |
Robert A. Eckert | |||
/s/ SPENCER C. FLEISCHER | Director | Date: | January 30, 2020 |
Spencer C. Fleischer | |||
/s/ DAVID A. FRIEDMAN | Director | Date: | January 30, 2020 |
David A. Friedman | |||
/s/ YAEL GARTEN | Director | Date: | January 30, 2020 |
Yael Garten | |||
/s/ CHRISTOPHER J. MCCORMICK | Director | Date: | January 30, 2020 |
Christopher J. McCormick | |||
/s/ JENNY MING | Director | Date: | January 30, 2020 |
Jenny Ming | |||
/s/ PATRICIA SALAS PINEDA | Director | Date: | January 30, 2020 |
Patricia Salas Pineda | |||
/s/ JOSHUA E. PRIME | Director | Date: | January 30, 2020 |
Joshua E. Prime | |||
/s/ GAVIN BROCKETT | Senior Vice President and Global Controller | Date: | January 30, 2020 |
Gavin Brockett | (Principal Accounting Officer) | ||
/s/ HARMIT SINGH | Executive Vice President and Chief Financial Officer | Date: | January 30, 2020 |
Harmit Singh | (Principal Financial Officer) | ||
132