Attached files
| file | filename |
|---|---|
| 8-K - 8-K - BYLINE BANCORP, INC. | by-8k_20200123.htm |
Q4 2019 Financial Results Exhibit 99.1
Forward-Looking Statements This communication contains forward-looking statements within the meaning of the U.S. federal securities laws. Forward-looking statements include, without limitation, statements concerning plans, estimates, calculations, forecasts and projections with respect to the anticipated future performance of the Company. These statements are often, but not always, made through the use of words or phrases such as ‘‘may’’, ‘‘might’’, ‘‘should’’, ‘‘could’’, ‘‘predict’’, ‘‘potential’’, ‘‘believe’’, ‘‘expect’’, ‘‘continue’’, ‘‘will’’, ‘‘anticipate’’, ‘‘seek’’, ‘‘estimate’’, ‘‘intend’’, ‘‘plan’’, ‘‘projection’’, ‘‘would’’, ‘‘annualized’’, “target” and ‘‘outlook’’, or the negative version of those words or other comparable words or phrases of a future or forward-looking nature. Forward-looking statements involve estimates and known and unknown risks, and reflect various assumptions and involve elements of subjective judgement and analysis, which may or may not prove to be correct, and which are subject to uncertainties and contingencies outside the control of Byline and its respective affiliates, directors, employees and other representatives, which could cause actual results to differ materially from those presented in this communication. No representations, warranties or guarantees are or will be made by Byline as to the reliability, accuracy or completeness of any forward-looking statements contained in this communication or that such forward-looking statements are or will remain based on reasonable assumptions. You should not place undue reliance on any forward-looking statements contained in this communication. Certain risks and important factors that could affect Byline’s future results are identified in its Annual Report on Form 10-K and other reports filed with the Securities and Exchange Commission, including among other things under the heading “Risk Factors” in such Annual Report on Form 10-K. Any forward-looking statement speaks only as of the date on which it is made, and Byline undertakes no obligation to update any forward-looking statement, whether to reflect events or circumstances after the date on which the statement is made, to reflect new information or the occurrence of unanticipated events, or otherwise unless required under the federal securities laws.
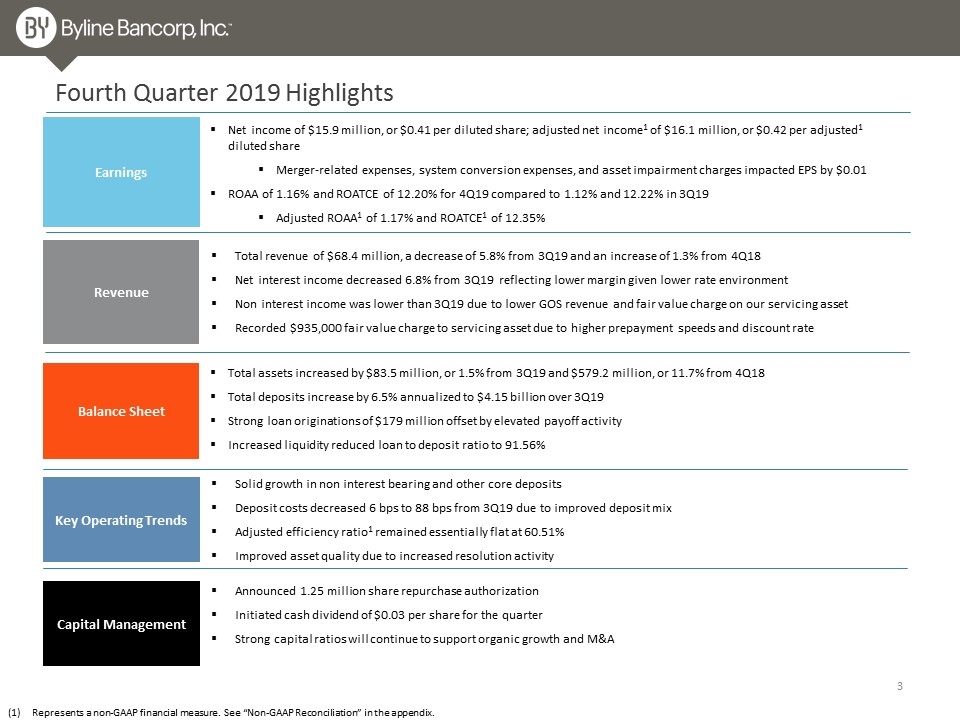
Fourth Quarter 2019 Highlights Balance Sheet Earnings Revenue Key Operating Trends Total revenue of $68.4 million, a decrease of 5.8% from 3Q19 and an increase of 1.3% from 4Q18 Net interest income decreased 6.8% from 3Q19 reflecting lower margin given lower rate environment Non interest income was lower than 3Q19 due to lower GOS revenue and fair value charge on our servicing asset Recorded $935,000 fair value charge to servicing asset due to higher prepayment speeds and discount rate Solid growth in non interest bearing and other core deposits Deposit costs decreased 6 bps to 88 bps from 3Q19 due to improved deposit mix Adjusted efficiency ratio1 remained essentially flat at 60.51% Improved asset quality due to increased resolution activity Capital Management Announced 1.25 million share repurchase authorization Initiated cash dividend of $0.03 per share for the quarter Strong capital ratios will continue to support organic growth and M&A Represents a non-GAAP financial measure. See “Non-GAAP Reconciliation” in the appendix. Net income of $15.9 million, or $0.41 per diluted share; adjusted net income1 of $16.1 million, or $0.42 per adjusted1 diluted share Merger-related expenses, system conversion expenses, and asset impairment charges impacted EPS by $0.01 ROAA of 1.16% and ROATCE of 12.20% for 4Q19 compared to 1.12% and 12.22% in 3Q19 Adjusted ROAA1 of 1.17% and ROATCE1 of 12.35% Total assets increased by $83.5 million, or 1.5% from 3Q19 and $579.2 million, or 11.7% from 4Q18 Total deposits increase by 6.5% annualized to $4.15 billion over 3Q19 Strong loan originations of $179 million offset by elevated payoff activity Increased liquidity reduced loan to deposit ratio to 91.56%
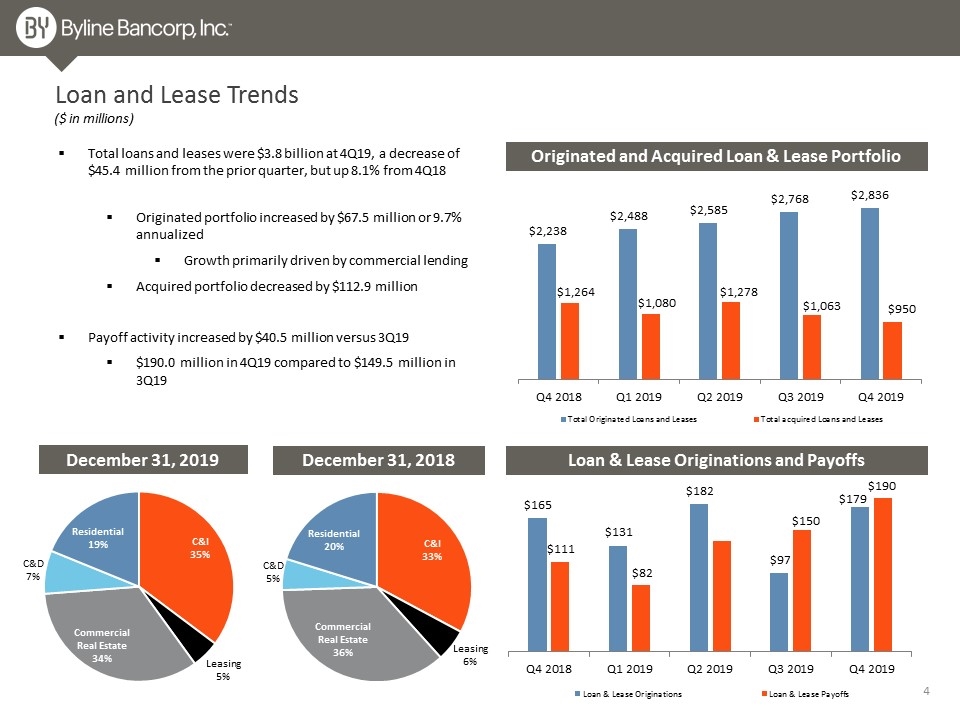
Loan and Lease Trends Loan & Lease Originations and Payoffs December 31, 2018 December 31, 2019 ($ in millions) Originated and Acquired Loan & Lease Portfolio Total loans and leases were $3.8 billion at 4Q19, a decrease of $45.4 million from the prior quarter, but up 8.1% from 4Q18 Originated portfolio increased by $67.5 million or 9.7% annualized Growth primarily driven by commercial lending Acquired portfolio decreased by $112.9 million Payoff activity increased by $40.5 million versus 3Q19 $190.0 million in 4Q19 compared to $149.5 million in 3Q19
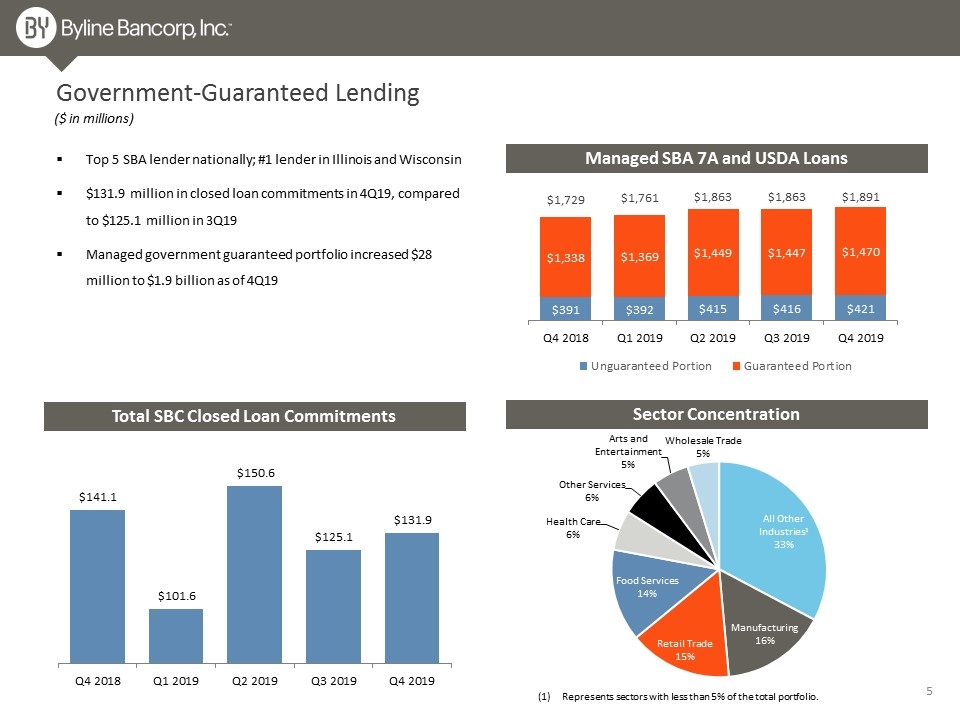
Government-Guaranteed Lending Managed SBA 7A and USDA Loans Top 5 SBA lender nationally; #1 lender in Illinois and Wisconsin $131.9 million in closed loan commitments in 4Q19, compared to $125.1 million in 3Q19 Managed government guaranteed portfolio increased $28 million to $1.9 billion as of 4Q19 Sector Concentration Represents sectors with less than 5% of the total portfolio. ($ in millions) Total SBC Closed Loan Commitments
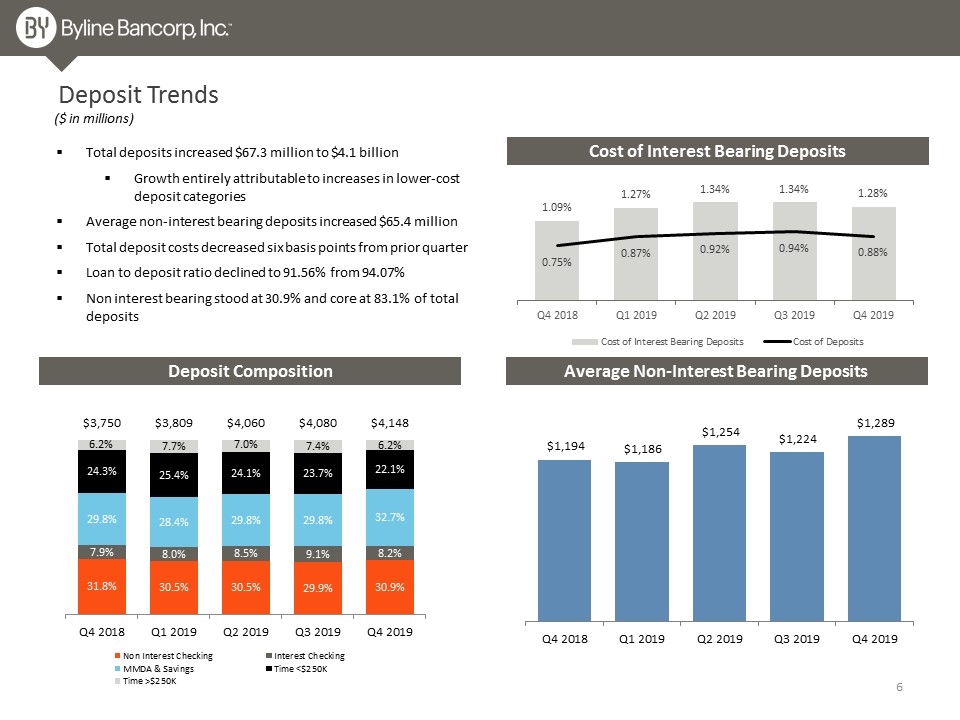
Total deposits increased $67.3 million to $4.1 billion Growth entirely attributable to increases in lower-cost deposit categories Average non-interest bearing deposits increased $65.4 million Total deposit costs decreased six basis points from prior quarter Loan to deposit ratio declined to 91.56% from 94.07% Non interest bearing stood at 30.9% and core at 83.1% of total deposits Deposit Trends Average Non-Interest Bearing Deposits ($ in millions) Deposit Composition Cost of Interest Bearing Deposits
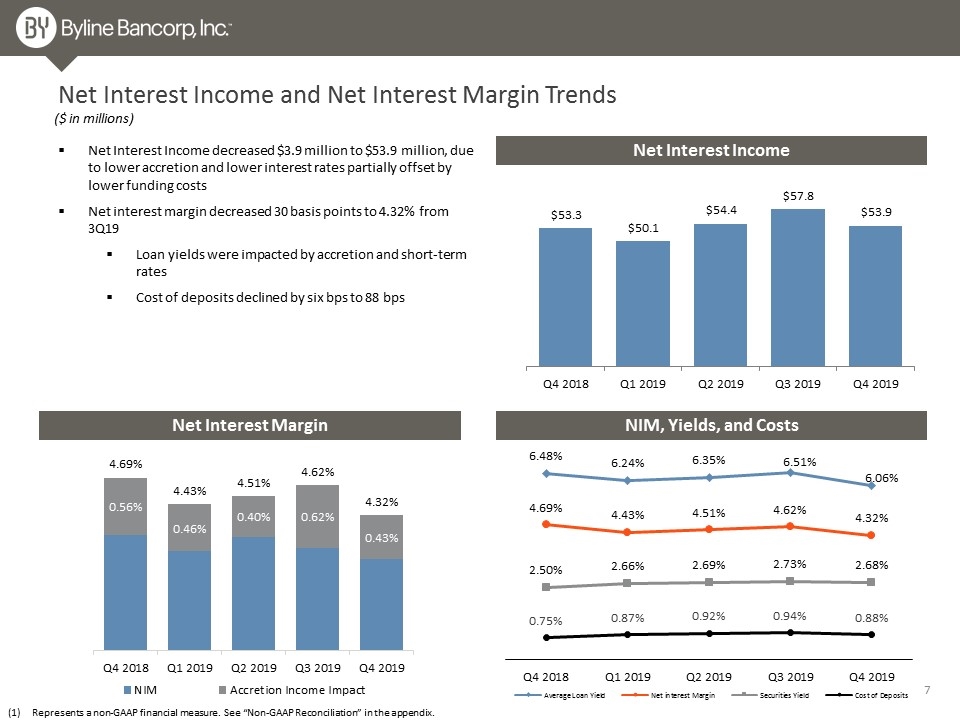
Net Interest Income and Net Interest Margin Trends Net Interest Income decreased $3.9 million to $53.9 million, due to lower accretion and lower interest rates partially offset by lower funding costs Net interest margin decreased 30 basis points to 4.32% from 3Q19 Loan yields were impacted by accretion and short-term rates Cost of deposits declined by six bps to 88 bps Net Interest Margin Net Interest Income ($ in millions) NIM, Yields, and Costs Represents a non-GAAP financial measure. See “Non-GAAP Reconciliation” in the appendix.
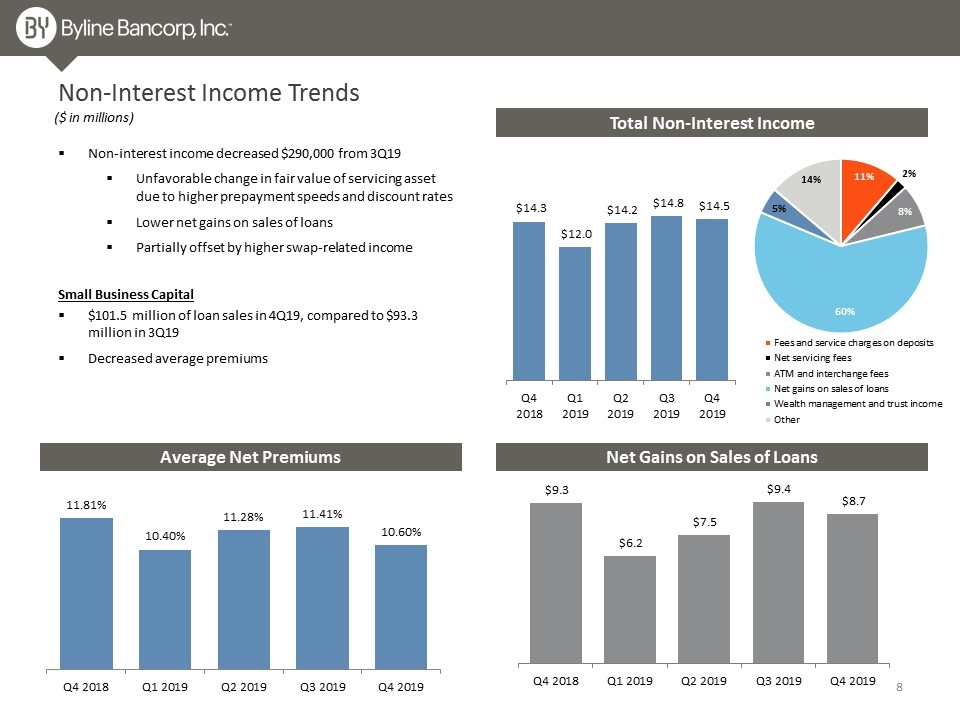
Total Non-Interest Income Non-Interest Income Trends Non-interest income decreased $290,000 from 3Q19 Unfavorable change in fair value of servicing asset due to higher prepayment speeds and discount rates Lower net gains on sales of loans Partially offset by higher swap-related income ($ in millions) Average Net Premiums Net Gains on Sales of Loans $101.5 million of loan sales in 4Q19, compared to $93.3 million in 3Q19 Decreased average premiums Small Business Capital
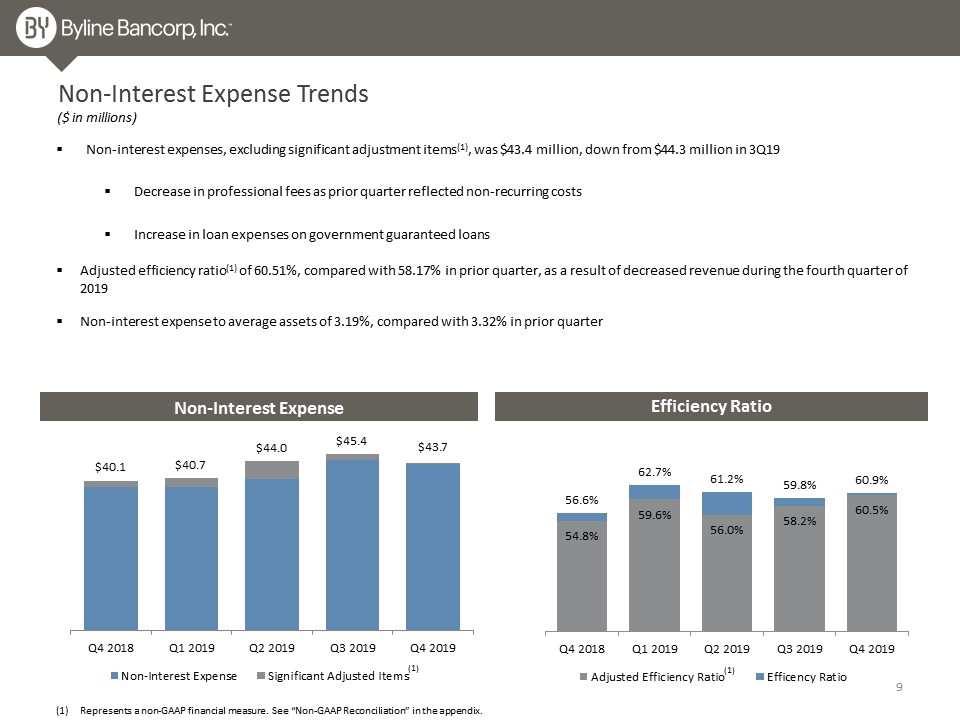
Non-Interest Expense Trends Non-interest expenses, excluding significant adjustment items(1), was $43.4 million, down from $44.3 million in 3Q19 Decrease in professional fees as prior quarter reflected non-recurring costs Increase in loan expenses on government guaranteed loans Adjusted efficiency ratio(1) of 60.51%, compared with 58.17% in prior quarter, as a result of decreased revenue during the fourth quarter of 2019 Non-interest expense to average assets of 3.19%, compared with 3.32% in prior quarter ($ in millions) Efficiency Ratio Non-Interest Expense Represents a non-GAAP financial measure. See “Non-GAAP Reconciliation” in the appendix. (1) (1)
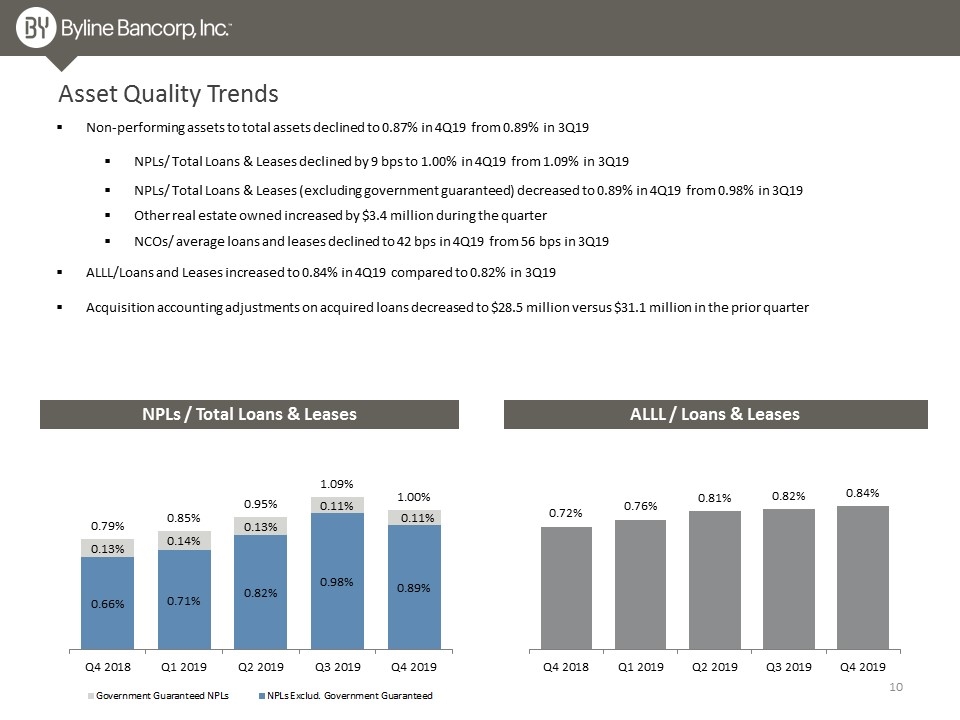
Asset Quality Trends Non-performing assets to total assets declined to 0.87% in 4Q19 from 0.89% in 3Q19 NPLs/ Total Loans & Leases declined by 9 bps to 1.00% in 4Q19 from 1.09% in 3Q19 NPLs/ Total Loans & Leases (excluding government guaranteed) decreased to 0.89% in 4Q19 from 0.98% in 3Q19 Other real estate owned increased by $3.4 million during the quarter NCOs/ average loans and leases declined to 42 bps in 4Q19 from 56 bps in 3Q19 ALLL/Loans and Leases increased to 0.84% in 4Q19 compared to 0.82% in 3Q19 Acquisition accounting adjustments on acquired loans decreased to $28.5 million versus $31.1 million in the prior quarter NPLs / Total Loans & Leases ALLL / Loans & Leases
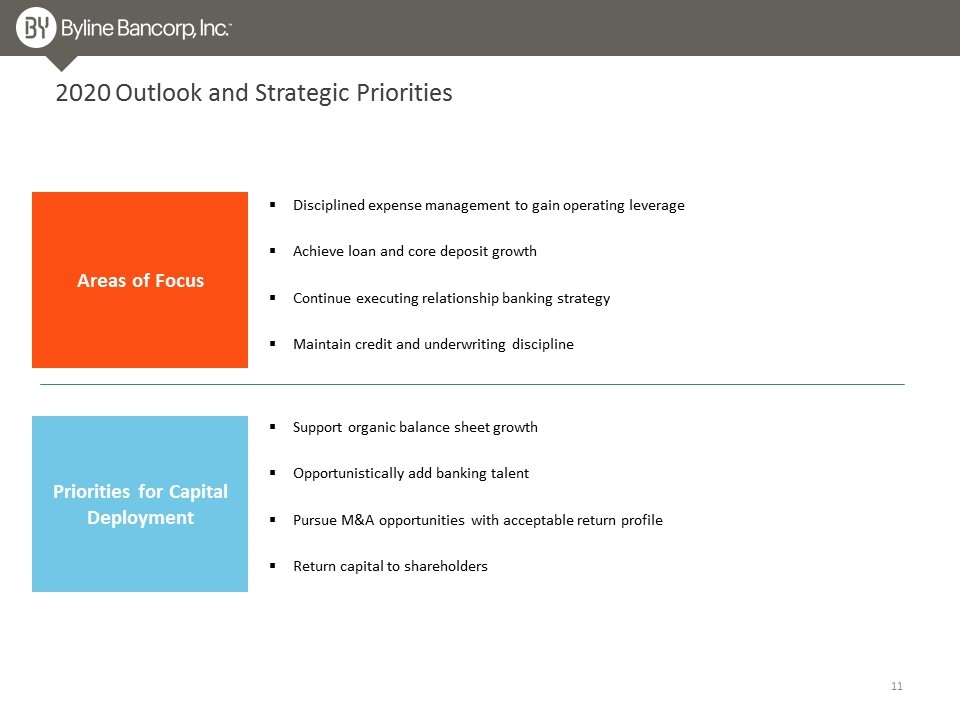
2020 Outlook and Strategic Priorities Areas of Focus Priorities for Capital Deployment Disciplined expense management to gain operating leverage Achieve loan and core deposit growth Continue executing relationship banking strategy Maintain credit and underwriting discipline Support organic balance sheet growth Opportunistically add banking talent Pursue M&A opportunities with acceptable return profile Return capital to shareholders

Appendix
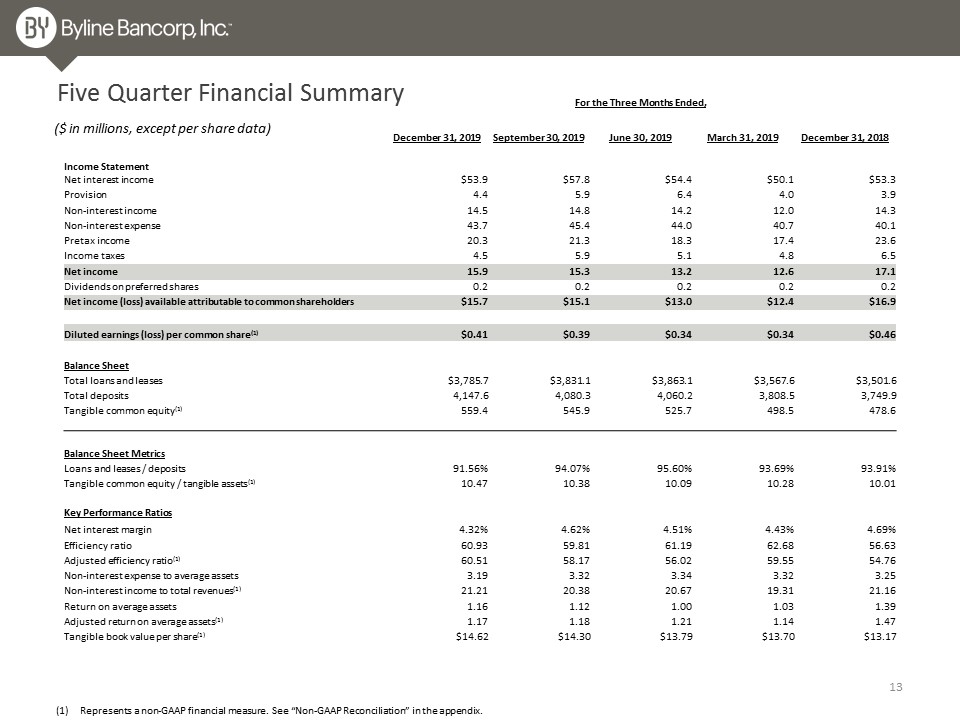
Five Quarter Financial Summary ($ in millions, except per share data) Represents a non-GAAP financial measure. See “Non-GAAP Reconciliation” in the appendix. For the Three Months Ended, December 31, 2019 September 30, 2019 June 30, 2019 March 31, 2019 December 31, 2018 Income Statement Net interest income $53.9 $57.8 $54.4 $50.1 $53.3 Provision 4.4 5.9 6.4 4.0 3.9 Non-interest income 14.5 14.8 14.2 12.0 14.3 Non-interest expense 43.7 45.4 44.0 40.7 40.1 Pretax income 20.3 21.3 18.3 17.4 23.6 Income taxes 4.5 5.9 5.1 4.8 6.5 Net income 15.9 15.3 13.2 12.6 17.1 Dividends on preferred shares 0.2 0.2 0.2 0.2 0.2 Net income (loss) available attributable to common shareholders $15.7 $15.1 $13.0 $12.4 $16.9 Diluted earnings (loss) per common share(1) $0.41 $0.39 $0.34 $0.34 $0.46 Balance Sheet Total loans and leases $3,785.7 $3,831.1 $3,863.1 $3,567.6 $3,501.6 Total deposits 4,147.6 4,080.3 4,060.2 3,808.5 3,749.9 Tangible common equity(1) 559.4 545.9 525.7 498.5 478.6 Balance Sheet Metrics Loans and leases / deposits 91.56% 94.07% 95.60% 93.69% 93.91% Tangible common equity / tangible assets(1) 10.47 10.38 10.09 10.28 10.01 Key Performance Ratios Net interest margin 4.32% 4.62% 4.51% 4.43% 4.69% Efficiency ratio 60.93 59.81 61.19 62.68 56.63 Adjusted efficiency ratio(1) 60.51 58.17 56.02 59.55 54.76 Non-interest expense to average assets 3.19 3.32 3.34 3.32 3.25 Non-interest income to total revenues(1) 21.21 20.38 20.67 19.31 21.16 Return on average assets 1.16 1.12 1.00 1.03 1.39 Adjusted return on average assets(1) 1.17 1.18 1.21 1.14 1.47 Tangible book value per share(1) $14.62 $14.30 $13.79 $13.70 $13.17
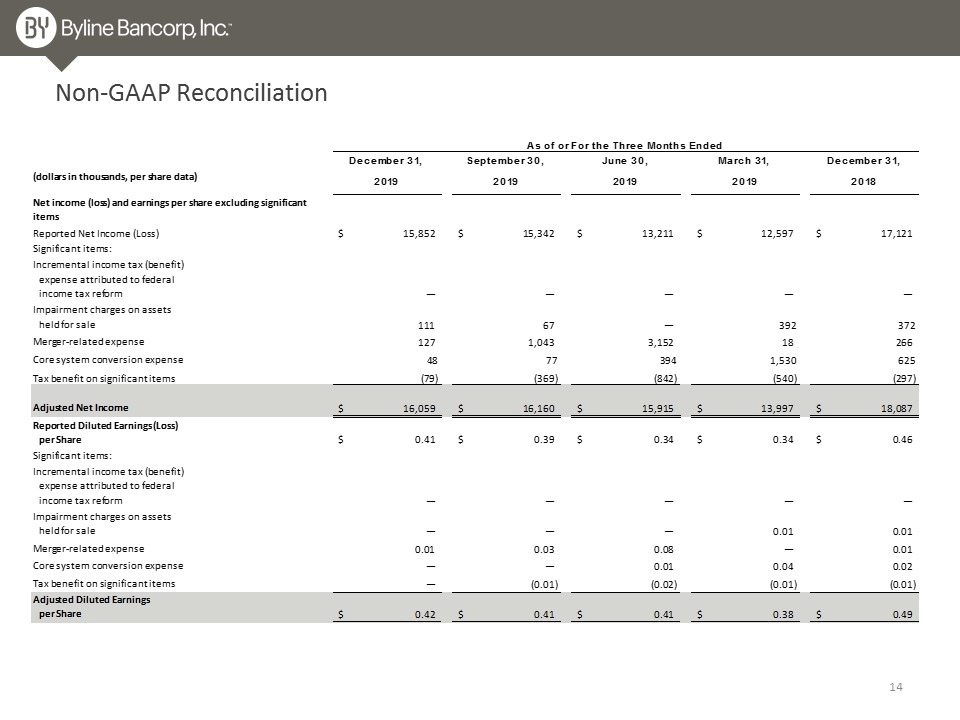
Non-GAAP Reconciliation
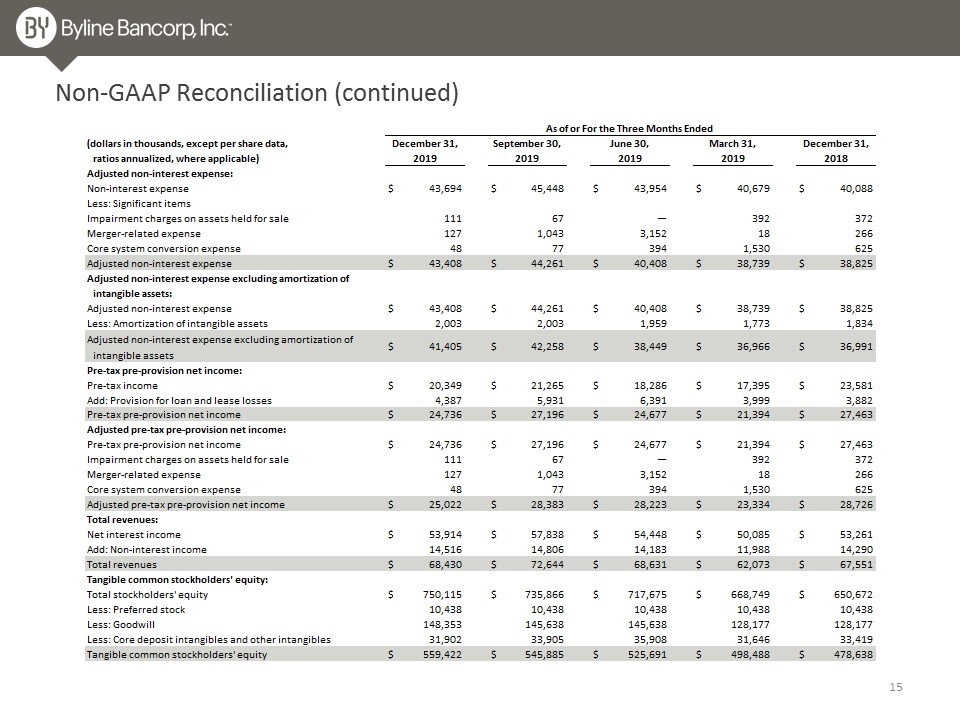
Non-GAAP Reconciliation (continued)
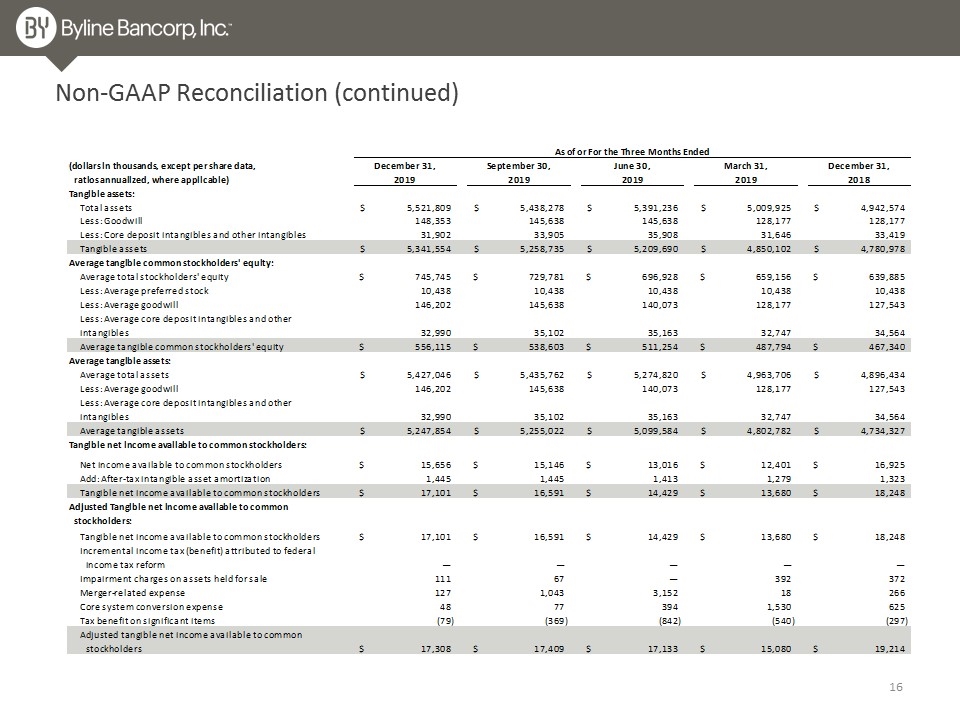
Non-GAAP Reconciliation (continued)
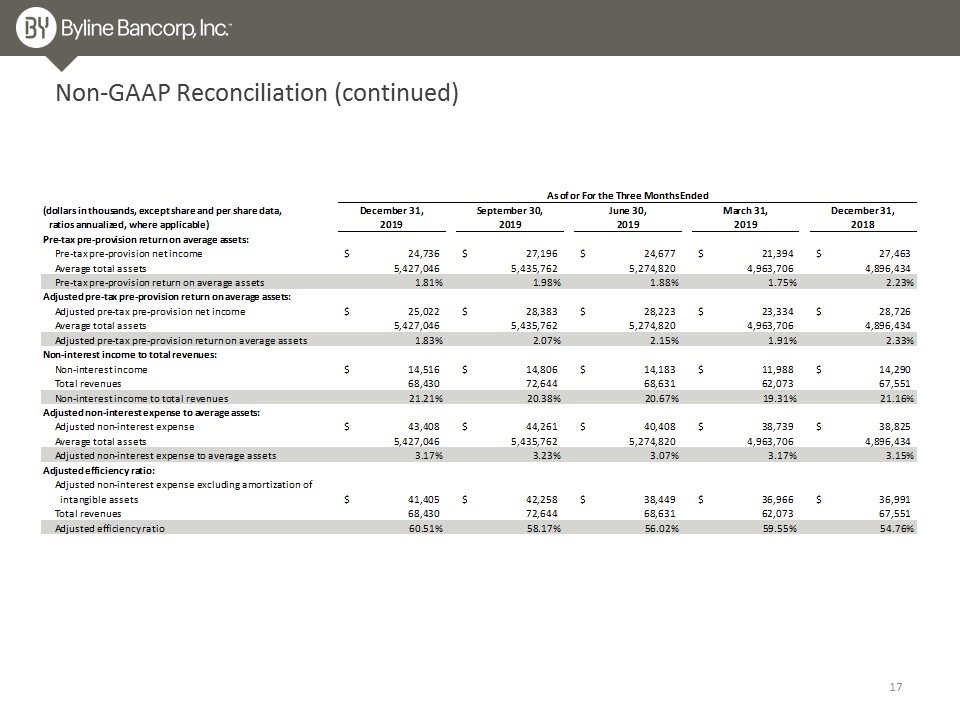
Non-GAAP Reconciliation (continued)
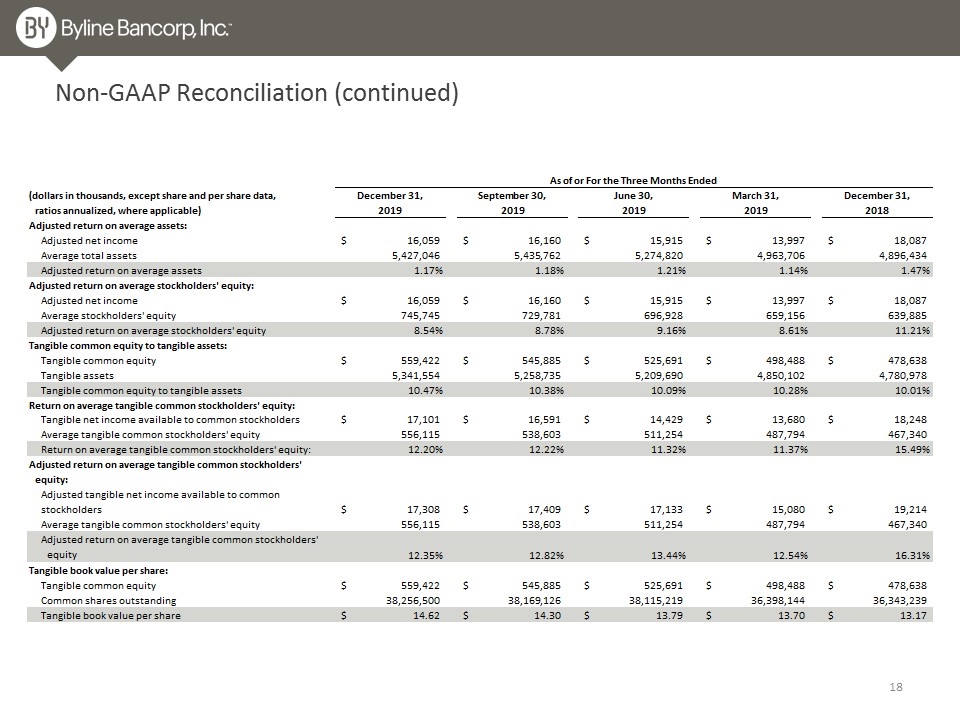
Non-GAAP Reconciliation (continued)
