Attached files
| file | filename |
|---|---|
| EX-99.1 - EXHIBIT 99.1 - WESTERN ALLIANCE BANCORPORATION | pressrelease-12312019.htm |
| 8-K - 8-K - WESTERN ALLIANCE BANCORPORATION | coverpage-pressrelease.htm |
EARNINGS CALL 4th QUARTER 2019 January 24, 2020
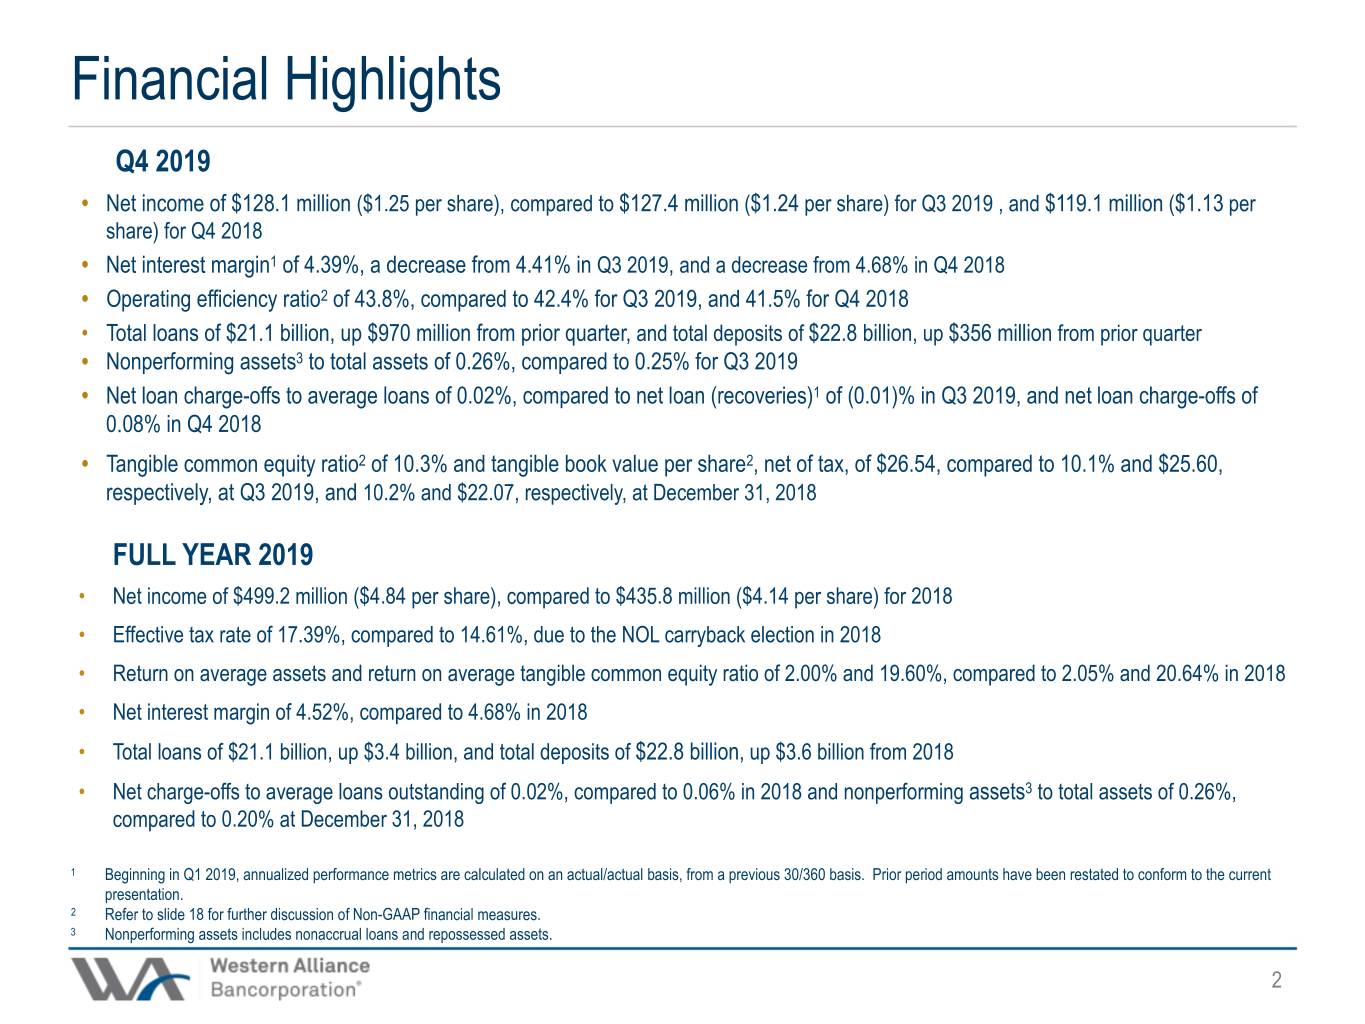
Financial Highlights Q4 2019 • Net income of $128.1 million ($1.25 per share), compared to $127.4 million ($1.24 per share) for Q3 2019 , and $119.1 million ($1.13 per share) for Q4 2018 • Net interest margin1 of 4.39%, a decrease from 4.41% in Q3 2019, and a decrease from 4.68% in Q4 2018 • Operating efficiency ratio2 of 43.8%, compared to 42.4% for Q3 2019, and 41.5% for Q4 2018 • Total loans of $21.1 billion, up $970 million from prior quarter, and total deposits of $22.8 billion, up $356 million from prior quarter • Nonperforming assets3 to total assets of 0.26%, compared to 0.25% for Q3 2019 • Net loan charge-offs to average loans of 0.02%, compared to net loan (recoveries)1 of (0.01)% in Q3 2019, and net loan charge-offs of 0.08% in Q4 2018 • Tangible common equity ratio2 of 10.3% and tangible book value per share2, net of tax, of $26.54, compared to 10.1% and $25.60, respectively, at Q3 2019, and 10.2% and $22.07, respectively, at December 31, 2018 FULL YEAR 2019 • Net income of $499.2 million ($4.84 per share), compared to $435.8 million ($4.14 per share) for 2018 • Effective tax rate of 17.39%, compared to 14.61%, due to the NOL carryback election in 2018 • Return on average assets and return on average tangible common equity ratio of 2.00% and 19.60%, compared to 2.05% and 20.64% in 2018 • Net interest margin of 4.52%, compared to 4.68% in 2018 • Total loans of $21.1 billion, up $3.4 billion, and total deposits of $22.8 billion, up $3.6 billion from 2018 • Net charge-offs to average loans outstanding of 0.02%, compared to 0.06% in 2018 and nonperforming assets3 to total assets of 0.26%, compared to 0.20% at December 31, 2018 1 Beginning in Q1 2019, annualized performance metrics are calculated on an actual/actual basis, from a previous 30/360 basis. Prior period amounts have been restated to conform to the current presentation. 2 Refer to slide 18 for further discussion of Non-GAAP financial measures. 2 3 Nonperforming assets includes nonaccrual loans and repossessed assets. 2
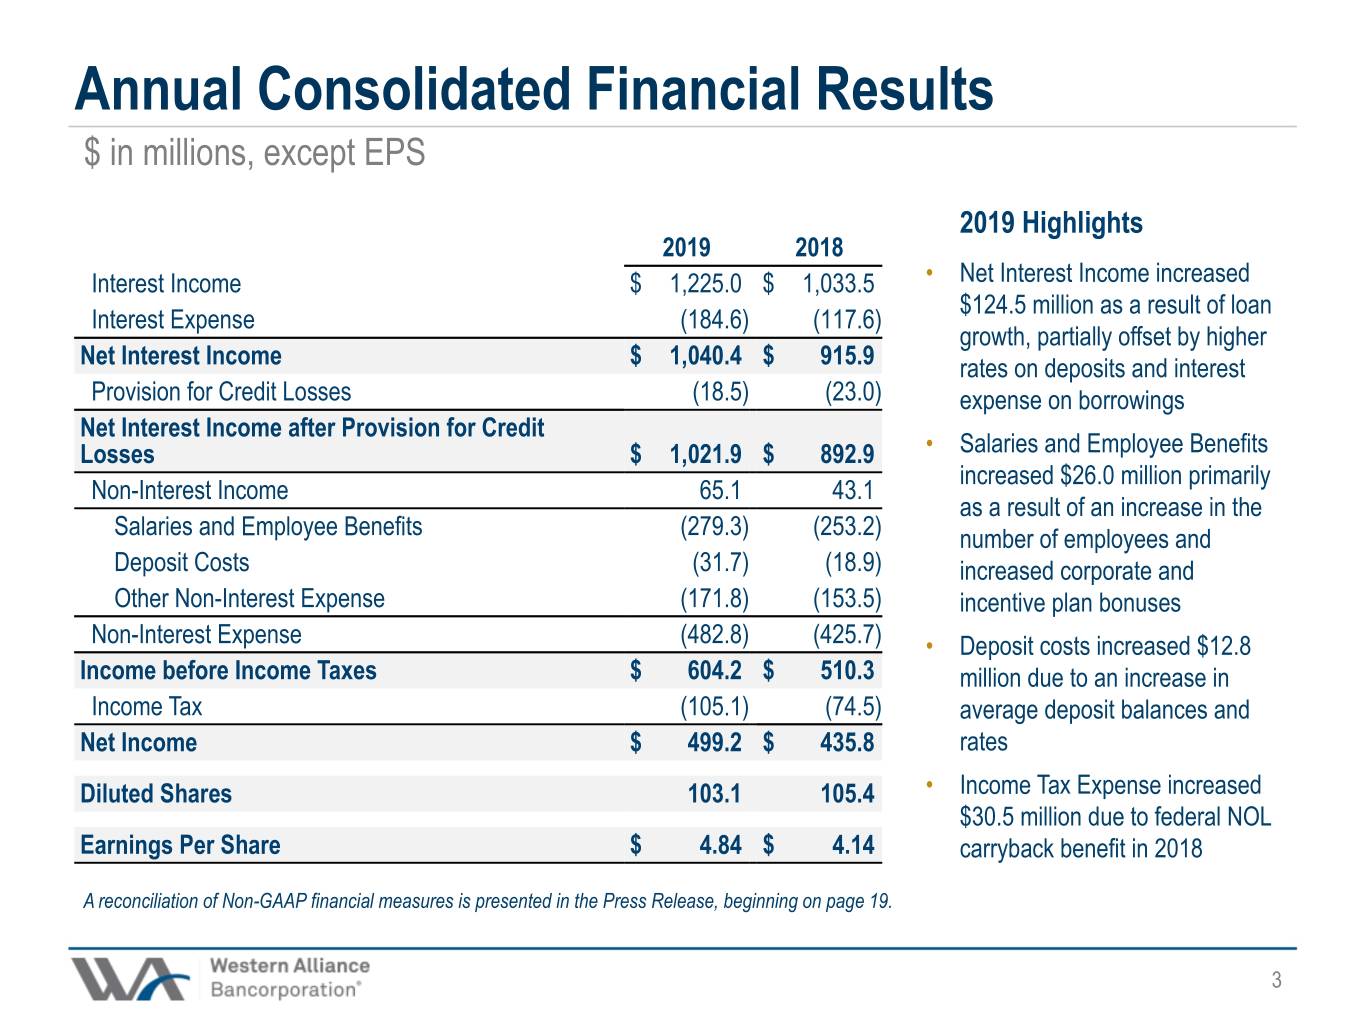
Annual Consolidated Financial Results $ in millions, except EPS 2019 Highlights 2019 2018 Interest Income $ 1,225.0 $ 1,033.5 • Net Interest Income increased $124.5 million as a result of loan Interest Expense (184.6) (117.6) growth, partially offset by higher Net Interest Income $ 1,040.4 $ 915.9 rates on deposits and interest Provision for Credit Losses (18.5) (23.0) expense on borrowings Net Interest Income after Provision for Credit Losses $ 1,021.9 $ 892.9 • Salaries and Employee Benefits increased $26.0 million primarily Non-Interest Income 65.1 43.1 as a result of an increase in the Salaries and Employee Benefits (279.3) (253.2) number of employees and Deposit Costs (31.7) (18.9) increased corporate and Other Non-Interest Expense (171.8) (153.5) incentive plan bonuses Non-Interest Expense (482.8) (425.7) • Deposit costs increased $12.8 Income before Income Taxes $ 604.2 $ 510.3 million due to an increase in Income Tax (105.1) (74.5) average deposit balances and Net Income $ 499.2 $ 435.8 rates Diluted Shares 103.1 105.4 • Income Tax Expense increased $30.5 million due to federal NOL Earnings Per Share $ 4.84 $ 4.14 carryback benefit in 2018 A reconciliation of Non-GAAP financial measures is presented in the Press Release, beginning on page 19. 3 3
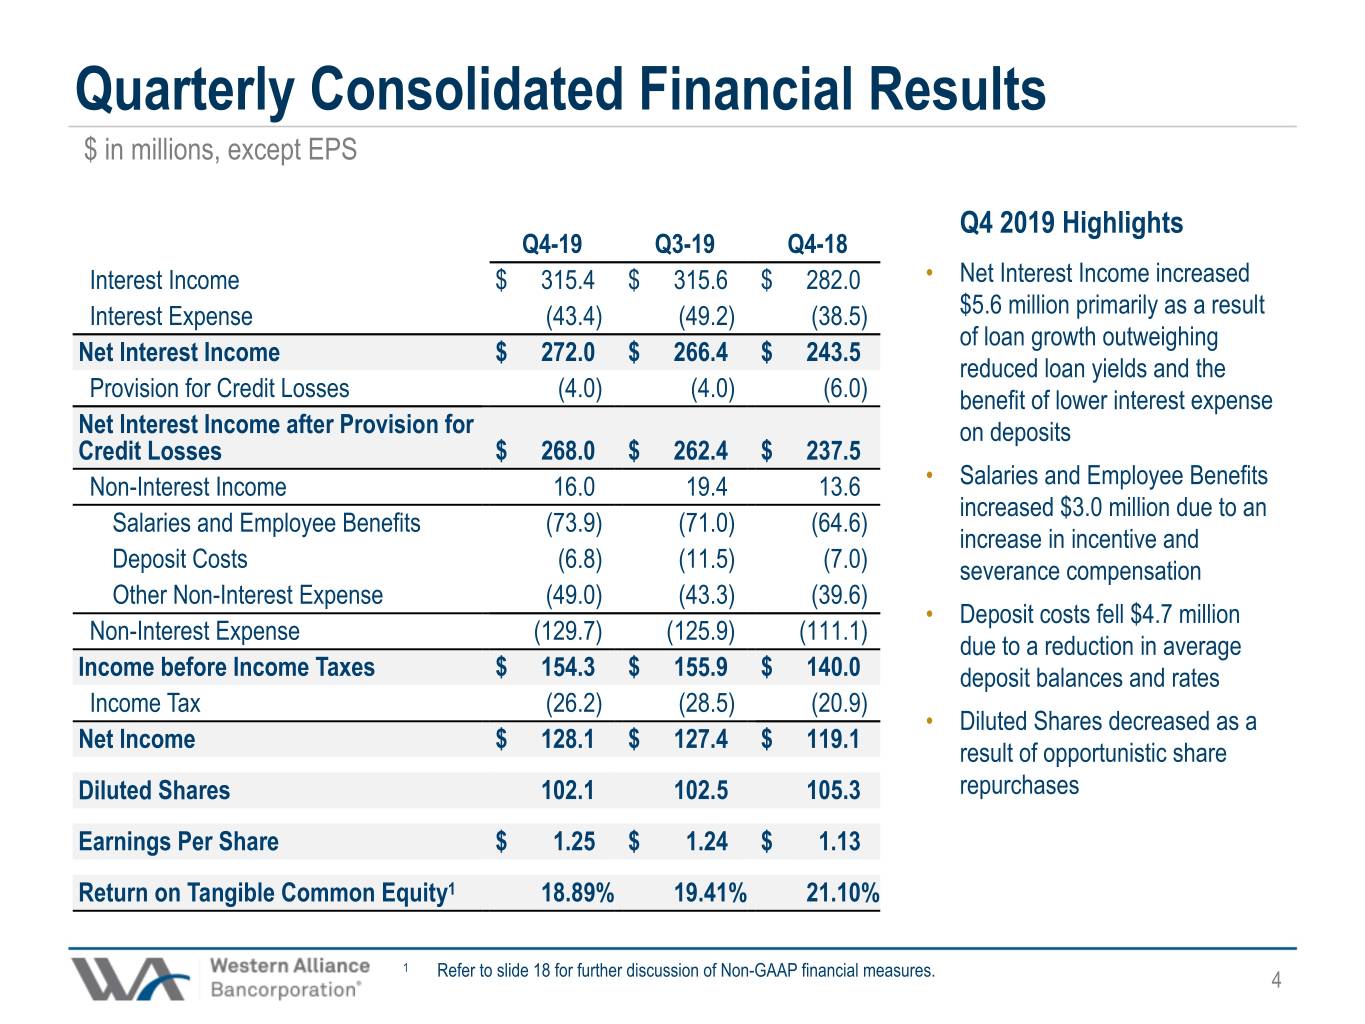
Quarterly Consolidated Financial Results $ in millions, except EPS Q4 2019 Highlights Q4-19 Q3-19 Q4-18 Interest Income $ 315.4 $ 315.6 $ 282.0 • Net Interest Income increased Interest Expense (43.4) (49.2) (38.5) $5.6 million primarily as a result of loan growth outweighing Net Interest Income $ 272.0 $ 266.4 $ 243.5 reduced loan yields and the Provision for Credit Losses (4.0) (4.0) (6.0) benefit of lower interest expense Net Interest Income after Provision for on deposits Credit Losses $ 268.0 $ 262.4 $ 237.5 Non-Interest Income 16.0 19.4 13.6 • Salaries and Employee Benefits increased $3.0 million due to an Salaries and Employee Benefits (73.9) (71.0) (64.6) increase in incentive and Deposit Costs (6.8) (11.5) (7.0) severance compensation Other Non-Interest Expense (49.0) (43.3) (39.6) • Deposit costs fell $4.7 million Non-Interest Expense (129.7) (125.9) (111.1) due to a reduction in average Income before Income Taxes $ 154.3 $ 155.9 $ 140.0 deposit balances and rates Income Tax (26.2) (28.5) (20.9) • Diluted Shares decreased as a Net Income $ 128.1 $ 127.4 $ 119.1 result of opportunistic share Diluted Shares 102.1 102.5 105.3 repurchases Earnings Per Share $ 1.25 $ 1.24 $ 1.13 Return on Tangible Common Equity1 18.89% 19.41% 21.10% 4 1 Refer to slide 18 for further discussion of Non-GAAP financial measures. 4

Net Interest Drivers1 $ in billions, unless otherwise indicated Total Investments and Yield Loans and Yield Q4 2019 Highlights 5.92% 6.02% 5.98% • Flattening yield curve reduced 5.79% investment portfolio yields and 3.46% 3.47% 5.58% 3.34% incremental yield on new loans 3.08% 2.96% • Loan yields decreased 21 basis points following declines $19.3 $20.2 $21.1 $17.7 $18.1 across most loan types, mainly $3.8 $3.7 $3.9 $4.1 $4.0 driven by a decline in LIBOR Q4-18 Q1-19 Q2-19 Q3-19 Q4-19 Q4-18 Q1-19 Q2-19 Q3-19 Q4-19 • Cost of interest-bearing deposits decreased 22 basis points due to repricing efforts Interest Bearing Deposits Deposits, Borrowings, and in a lower rate environment, and Cost Cost of Liability Funding driving total cost of funds 0.93% 0.78% 0.89% 0.87% 0.75% down 12 basis points to 0.75% 1.35% 1.30% $0.4 $0.4 $0.4 1.12% 1.23% 1.08% $0.9 $0.4 $8.8 $8.5 $7.5 $7.7 $8.7 $13.7 $14.3 $14.3 $11.7 $12.5 $12.8 $11.7 $12.5 $12.8 $13.7 Non-Interest Bearing Deposits Total Borrowings Q4-18 Q1-19 Q2-19 Q3-19 Q4-19 Q4-18 Q1-19 Q2-19 Q3-19 Q4-19 5 1 Beginning in Q1 2019, yields and costs are calculated on an actual/actual basis, from a previous 30/360 5 basis. Prior period amounts have been restated to conform to the current presentation.

Net Interest Income $ in millions Net Interest Income1, NIM2, and Highlights Average Interest Earning Assets • NIM declined 2 basis points from the prior quarter, driven by the loan mix shift $272.0 $266.4 • Net Interest Income for the quarter grew through the $254.7 $243.5 $247.3 NIM compression by 2.1% • A 29 basis point decline in the NIM from Q4-18 was the result of 3 Fed rate cuts totaling totaling 75 basis points in 2019 4.68% 4.71% 4.59% • Despite NIM compression, Net Interest Income grew by 11.7% from Q4-18 4.41% 4.39% $21,173 $21,818 $22,786 $24,548 $25,147 Q4-18 Q1-19 Q2-19 Q3-19 Q4-19 NIM Net Interest Income Avg Int Earning Assets 6 1 Includes quarterly accretion from acquired loans, which was $2.5 million for Q4-19. 2 Beginning in Q1 2019, NIM is calculated on an actual/actual basis, from a previous 30/360 basis. Prior 6 period amounts have been restated to conform to the current presentation.

Interest Rate Environment Percentage Increase/(Decrease) to Net Interest Income Q4 2019 Highlights Down 100bps • Nearly 68% of loans are variable rate Scenario ◦ $9.7 billion, or 68%, of variable rate loans Shock Ramp1 have interest rate floors ◦ 35% of variable rate loans (with floors) are at their floors (1.7)% • Deposit repricing lags loan repricing (3.8)% • Interest rate sensitivity in down shock scenario reduced by 1.0% from Q3-19 Up 100bps Scenario 6.1% 3.6% 1 Assumes a gradual monthly parallel shift of -8.3bps over a 12-month period 2 Assumes a gradual monthly parallel shift of +8.3bps over a 12-month period Shock Ramp2 7 7

Operating Expenses and Efficiency1 $ in millions Operating Expenses and Efficiency Ratio Q4 2019 Highlights • The operating efficiency ratio1 increased 140 43.8% basis points to 43.8% compared to the prior quarter and 230 basis points over the same 42.4% 42.4% 42.0% period last year 41.5% • Decreased efficiency in the second half of 2019 was driven by declining margin • Operating expenses increased from the prior quarter primarily due to $4.1 million in non- recurring expenses related to technology and $128.7 compensation costs $122.6 $114.8 $109.6 $112.8 • If Q4-18 margin were adjusted to current margin levels, the Q4-18 efficiency ratio would be flat to the current level Q4-18 Q1-19 Q2-19 Q3-19 Q4-19 Efficiency Ratio Operating Expenses 8 1 Refer to slide 18 for further discussion of Non-GAAP financial measures. 8 8

Operating Pre-Provision Net Revenue1, Net Income, and ROA2 $ in millions Q4 2019 Highlights • Operating PPNR ROA1 decreased 6 basis points from the prior quarter 2.63% 2.58% 2.54% and 25 basis points from Q4-18 2.44% 2.38% • Decline in Operating PPNR ROA1 2.11% 2.12% 2.05% 1.94% 1.92% from Q4-18 was directly impacted by margin decline of 29 basis points • ROA decreased 2 basis points from the prior quarter and 19 basis $159.9 points from Q4-18 $148.5 $147.1 $152.5 $158.8 $119.1 $120.8 $122.9 $127.4 $128.1 • Decline in ROA from Q4-18 was impacted by after-tax adjustment of margin decline Q4-18 Q1-19 Q2-19 Q3-19 Q4-19 Operating PPNR Operating PPNR ROA Net Income ROA 9 1 Refer to slide 18 for further discussion of Non-GAAP financial measures. 2 Beginning in Q1 2019, ROA is calculated on an actual/actual basis, from a previous 30/360 basis. Prior 9 period amounts have been restated to conform to the current presentation.
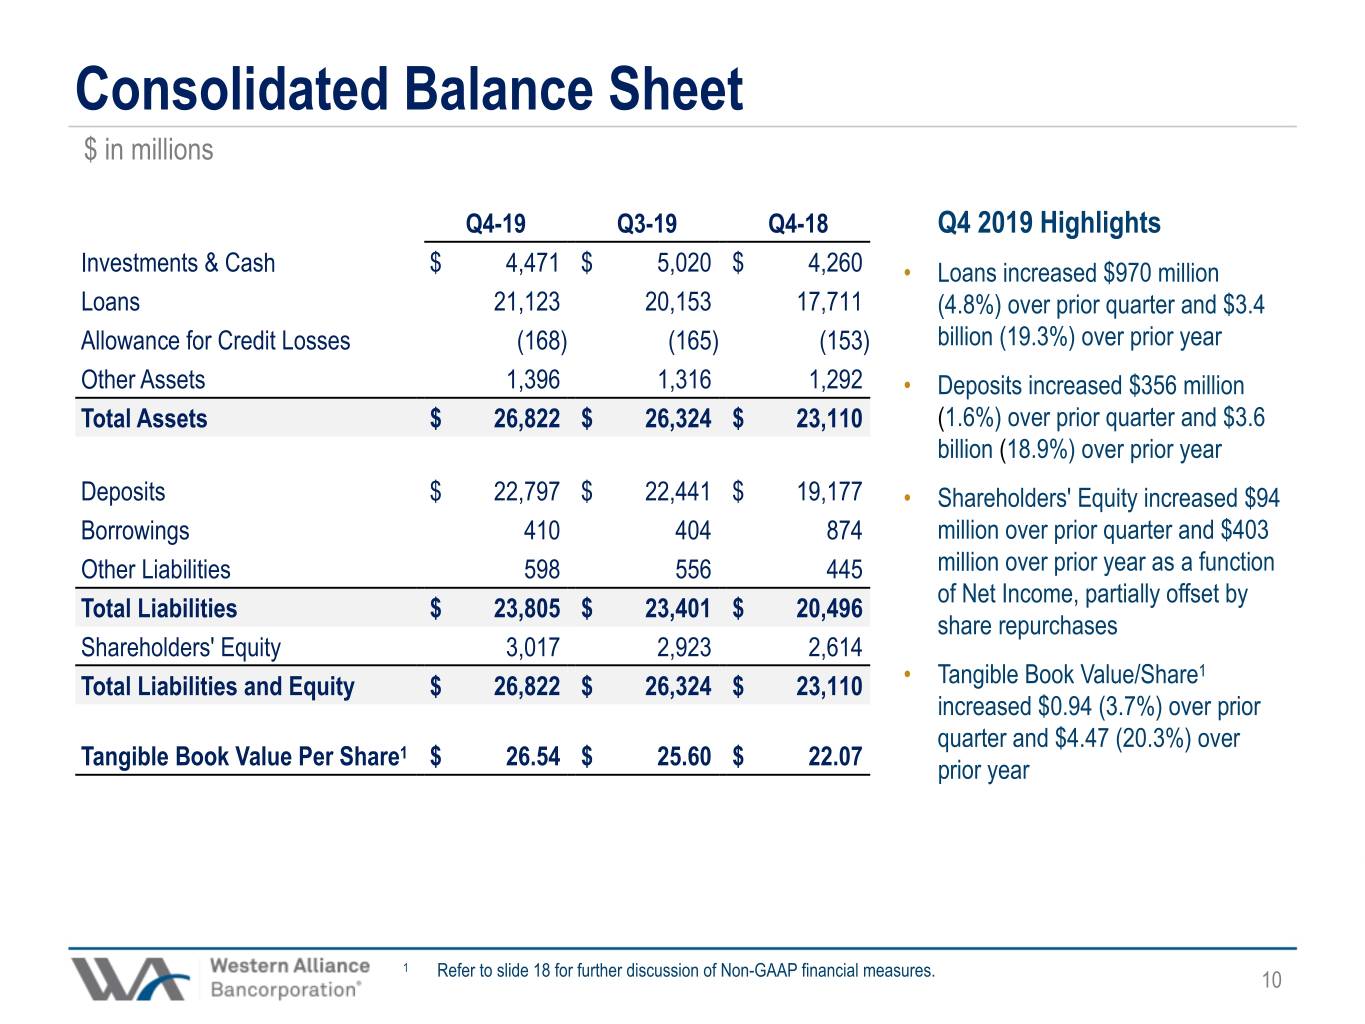
Consolidated Balance Sheet $ in millions Q4-19 Q3-19 Q4-18 Q4 2019 Highlights Investments & Cash $ 4,471 $ 5,020 $ 4,260 • Loans increased $970 million Loans 21,123 20,153 17,711 (4.8%) over prior quarter and $3.4 Allowance for Credit Losses (168) (165) (153) billion (19.3%) over prior year Other Assets 1,396 1,316 1,292 • Deposits increased $356 million Total Assets $ 26,822 $ 26,324 $ 23,110 (1.6%) over prior quarter and $3.6 billion (18.9%) over prior year Deposits $ 22,797 $ 22,441 $ 19,177 • Shareholders' Equity increased $94 Borrowings 410 404 874 million over prior quarter and $403 Other Liabilities 598 556 445 million over prior year as a function of Net Income, partially offset by Total Liabilities $ 23,805 $ 23,401 $ 20,496 share repurchases Shareholders' Equity 3,017 2,923 2,614 1 Total Liabilities and Equity $ 26,822 $ 26,324 $ 23,110 • Tangible Book Value/Share increased $0.94 (3.7%) over prior quarter and $4.47 (20.3%) over Tangible Book Value Per Share1 $ 26.54 $ 25.60 $ 22.07 prior year 10 1 Refer to slide 18 for further discussion of Non-GAAP financial measures. 1010
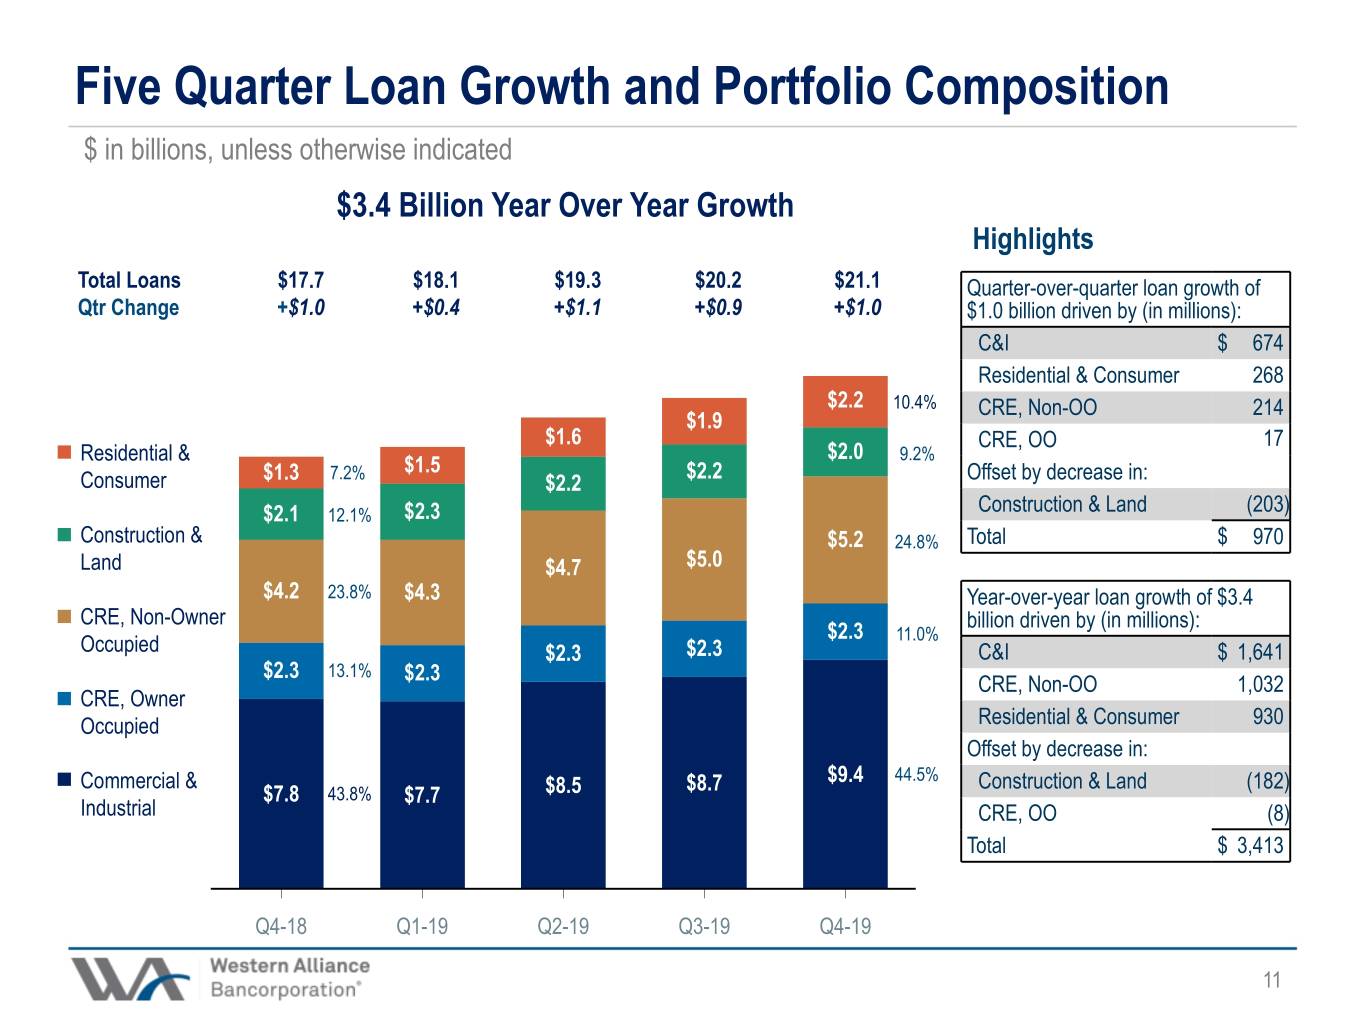
Five Quarter Loan Growth and Portfolio Composition $ in billions, unless otherwise indicated $3.4 Billion Year Over Year Growth Highlights Total Loans $17.7 $18.1 $19.3 $20.2 $21.1 Quarter-over-quarter loan growth of Qtr Change +$1.0 +$0.4 +$1.1 +$0.9 +$1.0 $1.0 billion driven by (in millions): C&I $ 674 Residential & Consumer 268 $2.2 10.4% CRE, Non-OO 214 $1.9 $1.6 CRE, OO 17 Residential & $2.0 9.2% 7.2% $1.5 $2.2 Consumer $1.3 $2.2 Offset by decrease in: $2.1 12.1% $2.3 Construction & Land (203) Construction & $5.2 24.8% Total $ 970 Land $4.7 $5.0 $4.2 23.8% $4.3 Year-over-year loan growth of $3.4 CRE, Non-Owner billion driven by (in millions): $2.3 11.0% Occupied $2.3 $2.3 C&I $ 1,641 $2.3 13.1% $2.3 CRE, Non-OO 1,032 CRE, Owner Occupied Residential & Consumer 930 Offset by decrease in: Commercial & $8.7 $9.4 44.5% Construction & Land (182) $7.8 43.8% $7.7 $8.5 Industrial CRE, OO (8) Total $ 3,413 Q4-18 Q1-19 Q2-19 Q3-19 Q4-19 11 1111

Five Quarter Deposit Growth and Composition $ in billions, unless otherwise indicated $3.6 Billion Year Over Year Growth Highlights Total Deposits $19.2 $20.2 $21.4 $22.4 $22.8 Quarter-over-quarter deposit growth Qtr Change +$0.3 +$1.0 +$1.2 +$1.0 +$0.4 of $0.4 billion driven by (in millions): CDs $ 260 Interest Bearing DDA 252 $2.4 10.4% $2.1 Savings and MMDA 62 $2.3 Offset by decreases in: CDs $2.2 $1.8 9.6% Non-Interest Bearing DDA (218) Savings and Total $ 356 MMDA $9.1 $9.1 40.0% $7.9 Year-over-year deposit growth of $3.6 Interest Bearing $7.3 38.2% $7.8 billion driven by all deposit types (in DDA millions): Savings and MMDA $ 1,790 Non-Interest $2.5 $2.5 $2.8 12.1% Non-Interest Bearing DDA 1,082 Bearing DDA $2.6 13.3% $2.5 CDs 542 Interest-Bearing DDA 205 Total $ 3,619 $8.7 $8.7 $8.5 37.5% $7.5 38.9% $7.7 Q4-18 Q1-19 Q2-19 Q3-19 Q4-19 12 1212

Adversely Graded Loans and Non-Performing Assets1 $ in millions $439 Asset Quality Ratios $399 $358 $341 $316 $234 $134 $198 $89 Adversely $180 Graded Loans 1.72% 1.57% 1.64% 1.43% $181 $162 $131 $139 1.31% $91 $52 0.26% 0.27% 0.25% 0.26% NPAs $28 $44 $50 $56 0.20% $18 $18 $18 $16 $14 Q4-18 Q1-19 Q2-19 Q3-19 Q4-19 Q4-18 Q1-19 Q2-19 Q3-19 Q4-19 Special Mention Loans Non-Performing Loans Adversely Graded Assets to Total Assets Classified Accruing Loans OREO NPAs to Total Assets Accruing TDRs total $28.4 million as of 12/31/2019 13 1 Amounts are net of total PCI credit and interest rate discounts of $4.4 million as of 12/31/2019 1313
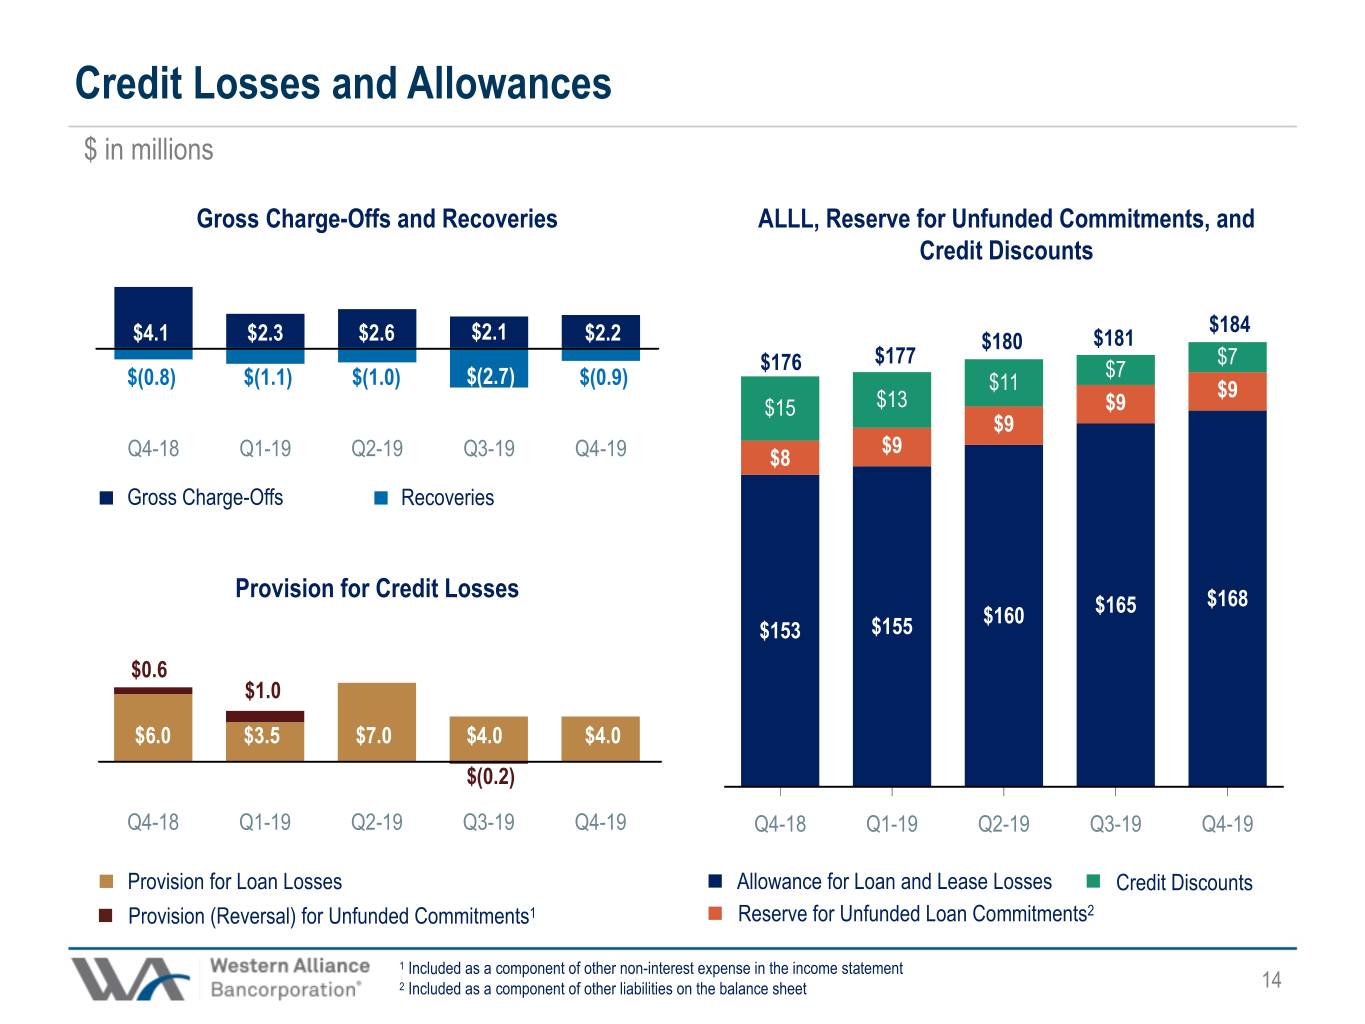
Credit Losses and Allowances $ in millions Gross Charge-Offs and Recoveries ALLL, Reserve for Unfunded Commitments, and Credit Discounts $184 $4.1 $2.3 $2.6 $2.1 $2.2 $180 $181 $176 $177 $7 $(0.8) $(1.1) $(1.0) $(2.7) $(0.9) $7 $11 $9 $15 $13 $9 $9 $9 Q4-18 Q1-19 Q2-19 Q3-19 Q4-19 $8 Gross Charge-Offs Recoveries Provision for Credit Losses $168 $160 $165 $153 $155 $0.6 $1.0 $6.0 $3.5 $7.0 $4.0 $4.0 $(0.2) Q4-18 Q1-19 Q2-19 Q3-19 Q4-19 Q4-18 Q1-19 Q2-19 Q3-19 Q4-19 Provision for Loan Losses Allowance for Loan and Lease Losses Credit Discounts Provision (Reversal) for Unfunded Commitments1 Reserve for Unfunded Loan Commitments2 14 1 Included as a component of other non-interest expense in the income statement 2 Included as a component of other liabilities on the balance sheet 1414
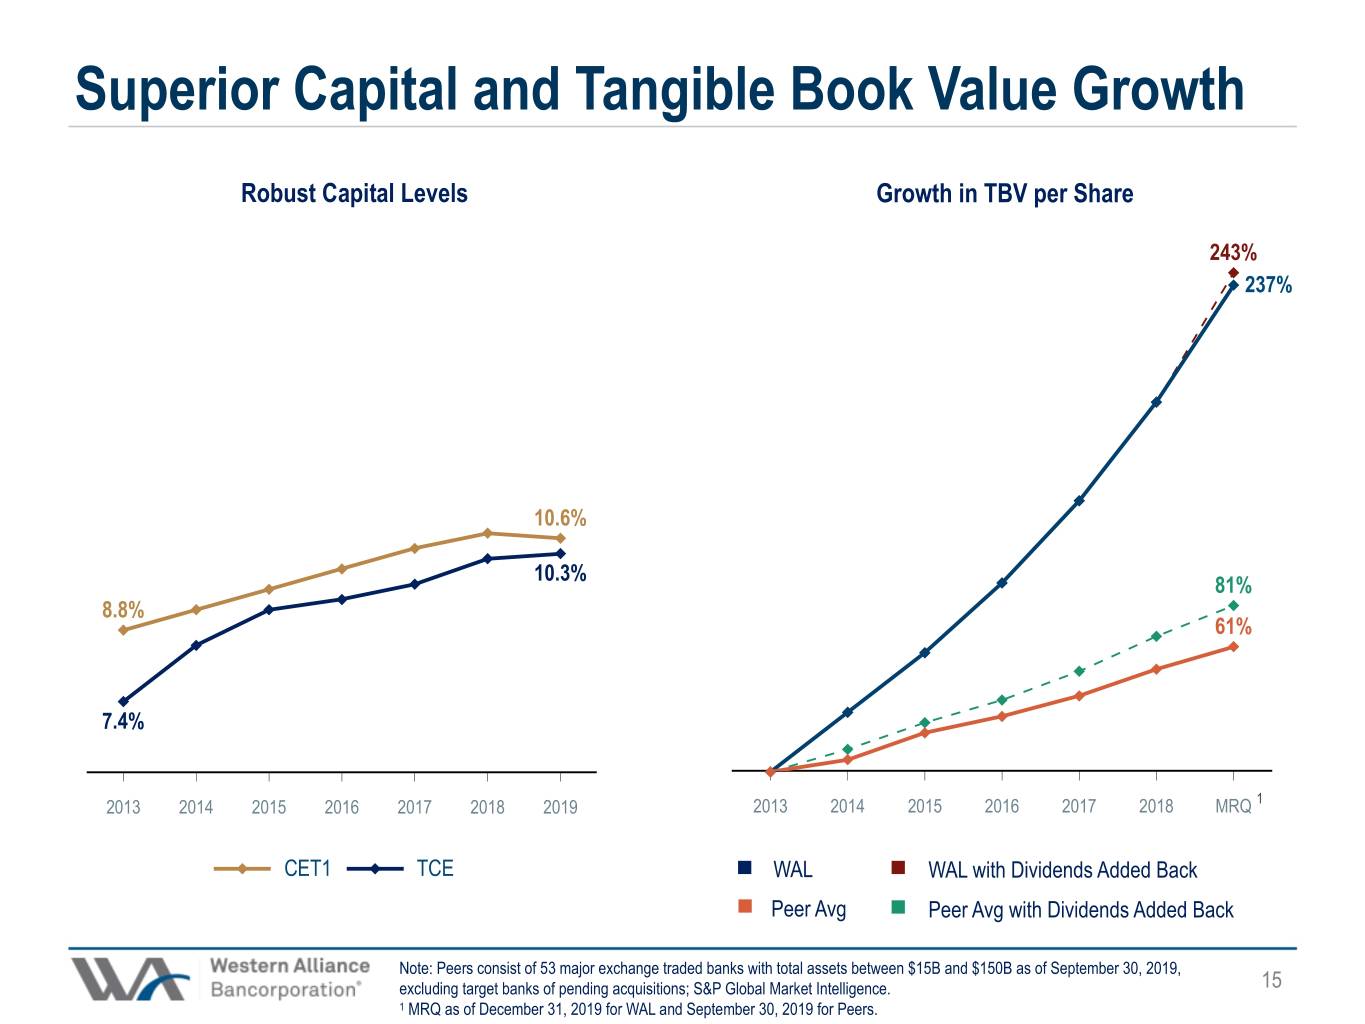
Superior Capital and Tangible Book Value Growth Robust Capital Levels Growth in TBV per Share 243% 237% 10.6% 10.3% 81% 8.8% 61% 7.4% 2013 2014 2015 2016 2017 2018 2019 2013 2014 2015 2016 2017 2018 MRQ 1 CET1 TCE WAL WAL with Dividends Added Back Peer Avg Peer Avg with Dividends Added Back15 Note: Peers consist of 53 major exchange traded banks with total assets between $15B and $150B as of September 30, 2019, excluding target banks of pending acquisitions; S&P Global Market Intelligence. 1515 1 MRQ as of December 31, 2019 for WAL and September 30, 2019 for Peers.

Management Outlook • Loan and Deposit Growth • Interest Margin • Operating Leverage • Asset Quality • Earnings 16 1616
Questions and Answers 1717

Forward-Looking Statements This presentation contains forward-looking statements that relate to expectations, beliefs, projections, future plans and strategies, anticipated events or trends, and similar expressions concerning matters that are not historical facts. Examples of forward-looking statements include, among others, statements we make regarding our expectations with regard to our business, financial and operating results, future economic performance and dividends, and the expected impact to the Company’s allowance and provision for credit losses and capital levels upon the adoption of the new current expected credit loss (CECL) accounting standard. The forward-looking statements contained herein reflect our current views about future events and financial performance and are subject to risks, uncertainties, assumptions, and changes in circumstances that may cause our actual results to differ significantly from historical results and those expressed in any forward-looking statement. Some factors that could cause actual results to differ materially from historical or expected results include, among others: the risk factors discussed in the Company’s Annual Report on Form 10-K for the year ended December 31, 2018 as filed with the Securities and Exchange Commission; changes in general economic conditions, either nationally or locally in the areas in which we conduct or will conduct our business; inflation, interest rate, market and monetary fluctuations; increases in competitive pressures among financial institutions and businesses offering similar products and services; higher defaults on our loan portfolio than we expect; changes in management’s estimate of the adequacy of the allowance for credit losses; legislative or regulatory changes or changes in accounting principles, policies, or guidelines (including changes related to the impact of CECL); supervisory actions by regulatory agencies which may limit our ability to pursue certain growth opportunities, including expansion through acquisitions; additional regulatory requirements resulting from our continued growth; management’s estimates and projections of interest rates and interest rate policy; the execution of our business plan; and other factors affecting the financial services industry generally or the banking industry in particular. Any forward-looking statement made by us in this presentation is based only on information currently available to us and speaks only as of the date on which it is made. We do not intend to have and disclaim any duty or obligation to update or revise any industry information or forward-looking statements, whether written or oral, that may be made from time to time, set forth in this presentation to reflect new information, future events or otherwise. Non-GAAP Financial Measures This presentation contains both financial measures based on GAAP and non-GAAP based financial measures, which are used where management believes them to be helpful in understanding the Company’s results of operations or financial position. Where non-GAAP financial measures are used, the comparable GAAP financial measure, as well as the reconciliation to the comparable GAAP financial measure, can be found in the Company's press release as of and for the quarter ended December 31, 2019. These disclosures should not be viewed as a substitute for operating results determined in accordance with GAAP, nor are they necessarily comparable to non-GAAP performance measures that may be presented by other companies.18 1818 18
