Attached files
| file | filename |
|---|---|
| 8-K - 8-K - Global Eagle Entertainment Inc. | d871343d8k.htm |

Exhibit 99.1 Needham Growth Conference January 15, 2020 Investor PresentationExhibit 99.1 Needham Growth Conference January 15, 2020 Investor Presentation

Forward-Looking Statements We may make forward-looking statements in this presentation within the meaning of the Private Securities Litigation Reform Act of 1995. These forward-looking statements include, without limitation, statements with respect to our expected EBITDA, Adjusted EBITDA, free cash flow, revenue and margin growth in future periods, our aviation-connectivity installations in future periods, the impact of the Boeing 737 MAX aircraft grounding on our financial performance, our business and financial-performance outlook and goals (including our assumptions therein relating to growth in fleet count, ARPA growth, opex savings, stable capex spend and lower satellite-bandwidth spend in future periods), industry, business strategy, plans, the potential sale of certain businesses and assets, business and M&A integration activities, capital expenditures, operating-expense and cost-structure improvements and reductions, future operations, margins, profitability, future efficiencies and other financial and operating information. These statements may be preceded by, followed by or include the words “may,” “might,” “will,” “will likely result,” “should,” “estimate,” “plan,” “project,” “forecast,” “intend,” “expect,” “anticipate,” “believe,” “seek,” “continue,” “target” or similar expressions. These forward-looking statements are based on information available to us as of the date they were made, and should not be relied upon as representing our views as of any subsequent date. These forward-looking statements are subject to a number of risks and uncertainties, including without limitation those risks and uncertainties described in our most recent annual report on Form 10-K, quarterly reports on Form 10-Q and the other documents we filed with the Securities and Exchange Commission. As a result, our actual results or performance may be materially different from those expressed or implied by these forward-looking statements. We do not undertake any obligation to update forward-looking statements to reflect events or circumstances after the date they were made, whether as a result of new information, future events or otherwise, except as may be required under applicable securities laws. 2 Investor PresentationForward-Looking Statements We may make forward-looking statements in this presentation within the meaning of the Private Securities Litigation Reform Act of 1995. These forward-looking statements include, without limitation, statements with respect to our expected EBITDA, Adjusted EBITDA, free cash flow, revenue and margin growth in future periods, our aviation-connectivity installations in future periods, the impact of the Boeing 737 MAX aircraft grounding on our financial performance, our business and financial-performance outlook and goals (including our assumptions therein relating to growth in fleet count, ARPA growth, opex savings, stable capex spend and lower satellite-bandwidth spend in future periods), industry, business strategy, plans, the potential sale of certain businesses and assets, business and M&A integration activities, capital expenditures, operating-expense and cost-structure improvements and reductions, future operations, margins, profitability, future efficiencies and other financial and operating information. These statements may be preceded by, followed by or include the words “may,” “might,” “will,” “will likely result,” “should,” “estimate,” “plan,” “project,” “forecast,” “intend,” “expect,” “anticipate,” “believe,” “seek,” “continue,” “target” or similar expressions. These forward-looking statements are based on information available to us as of the date they were made, and should not be relied upon as representing our views as of any subsequent date. These forward-looking statements are subject to a number of risks and uncertainties, including without limitation those risks and uncertainties described in our most recent annual report on Form 10-K, quarterly reports on Form 10-Q and the other documents we filed with the Securities and Exchange Commission. As a result, our actual results or performance may be materially different from those expressed or implied by these forward-looking statements. We do not undertake any obligation to update forward-looking statements to reflect events or circumstances after the date they were made, whether as a result of new information, future events or otherwise, except as may be required under applicable securities laws. 2 Investor Presentation

Legal Disclaimers Trademarks This presentation may contain trademarks, service marks, trade names and copyrights of other companies, which are the property of their respective owners. Solely for convenience, some of the trademarks, service marks, trade names and copyrights referred to in this presentation may be listed without the TM, SM © or ® symbols, but we will assert, to the fullest extent under applicable law, the rights of the applicable owners, if any, to these trademarks, service marks, trade names and copyrights. Historical and Projected Financial Information The financial information contained in this presentation has been taken from or prepared based on our historical financial statements for the periods presented. This presentation contains financial forecasts, which were prepared in good faith by us on a basis believed to be reasonable. Such financial forecasts have not been prepared in conformity with generally accepted accounting principles (“GAAP”). Our independent auditors have not audited, reviewed, compiled or performed any procedures with respect to the projections for the purpose of their inclusion in this presentation, and accordingly, they have not expressed an opinion nor provided any other form of assurance with respect thereto for the purpose of this presentation. These projections are for illustrative purposes only and should not be relied upon as being necessarily indicative of future results. Certain of the above-mentioned projected information has been provided for purposes of providing comparisons with historical data. The assumptions and estimates underlying the prospective financial information are inherently uncertain and are subject to a wide variety of significant business, economic and competitive risks and uncertainties that could cause actual results to differ materially from those contained in the prospective financial information. Projections are inherently uncertain due to a number of factors outside of our control. Accordingly, there can be no assurance that the prospective results are indicative of our future performance or that actual results will not differ materially from those presented in the prospective financial information. Inclusion of the prospective financial information in this presentation should not be regarded as a representation by any person that the results contained in the prospective financial information will be achieved. 3 Investor PresentationLegal Disclaimers Trademarks This presentation may contain trademarks, service marks, trade names and copyrights of other companies, which are the property of their respective owners. Solely for convenience, some of the trademarks, service marks, trade names and copyrights referred to in this presentation may be listed without the TM, SM © or ® symbols, but we will assert, to the fullest extent under applicable law, the rights of the applicable owners, if any, to these trademarks, service marks, trade names and copyrights. Historical and Projected Financial Information The financial information contained in this presentation has been taken from or prepared based on our historical financial statements for the periods presented. This presentation contains financial forecasts, which were prepared in good faith by us on a basis believed to be reasonable. Such financial forecasts have not been prepared in conformity with generally accepted accounting principles (“GAAP”). Our independent auditors have not audited, reviewed, compiled or performed any procedures with respect to the projections for the purpose of their inclusion in this presentation, and accordingly, they have not expressed an opinion nor provided any other form of assurance with respect thereto for the purpose of this presentation. These projections are for illustrative purposes only and should not be relied upon as being necessarily indicative of future results. Certain of the above-mentioned projected information has been provided for purposes of providing comparisons with historical data. The assumptions and estimates underlying the prospective financial information are inherently uncertain and are subject to a wide variety of significant business, economic and competitive risks and uncertainties that could cause actual results to differ materially from those contained in the prospective financial information. Projections are inherently uncertain due to a number of factors outside of our control. Accordingly, there can be no assurance that the prospective results are indicative of our future performance or that actual results will not differ materially from those presented in the prospective financial information. Inclusion of the prospective financial information in this presentation should not be regarded as a representation by any person that the results contained in the prospective financial information will be achieved. 3 Investor Presentation

Management Presentation Josh Marks Chief Executive Officer Christian Mezger Chief Financial Officer Peter Lopez VP Finance & Investor Relations 4 Investor PresentationManagement Presentation Josh Marks Chief Executive Officer Christian Mezger Chief Financial Officer Peter Lopez VP Finance & Investor Relations 4 Investor Presentation
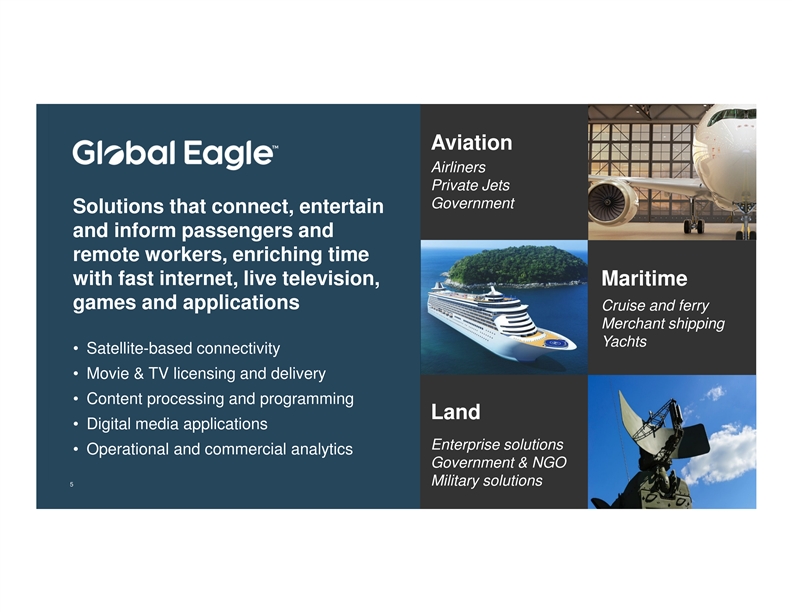
Aviation Airliners Private Jets Government Solutions that connect, entertain and inform passengers and remote workers, enriching time with fast internet, live television, Maritime games and applications Cruise and ferry Merchant shipping Yachts • Satellite-based connectivity • Movie & TV licensing and delivery • Content processing and programming Land • Digital media applications Enterprise solutions • Operational and commercial analytics Government & NGO 5 Military solutions Investor PresentationAviation Airliners Private Jets Government Solutions that connect, entertain and inform passengers and remote workers, enriching time with fast internet, live television, Maritime games and applications Cruise and ferry Merchant shipping Yachts • Satellite-based connectivity • Movie & TV licensing and delivery • Content processing and programming Land • Digital media applications Enterprise solutions • Operational and commercial analytics Government & NGO 5 Military solutions Investor Presentation
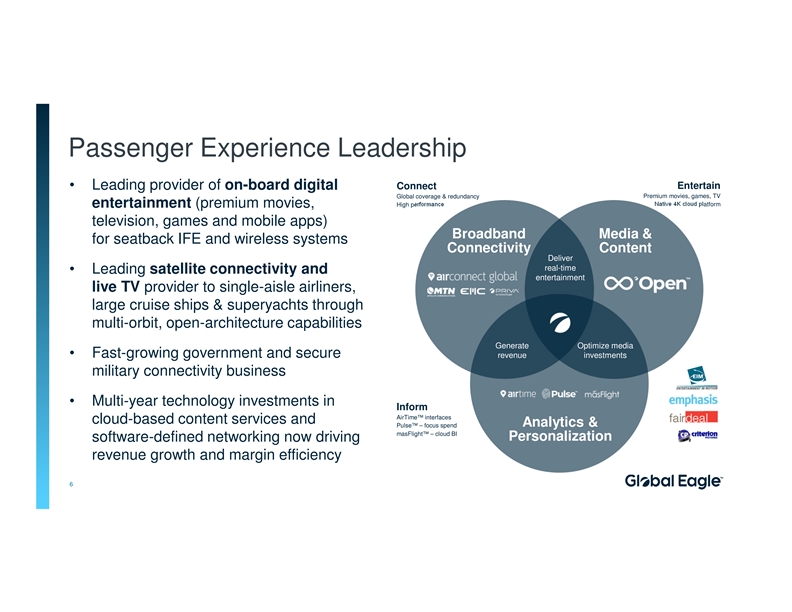
Passenger Experience Leadership Connect Entertain • Leading provider of on-board digital Global coverage & redundancy Premium movies, games, TV Native 4K cloud platform High performance entertainment (premium movies, television, games and mobile apps) Broadband Media & for seatback IFE and wireless systems Connectivity Content Deliver real-time • Leading satellite connectivity and entertainment live TV provider to single-aisle airliners, large cruise ships & superyachts through multi-orbit, open-architecture capabilities Generate Optimize media • Fast-growing government and secure revenue investments military connectivity business • Multi-year technology investments in Inform AirTime™ interfaces cloud-based content services and Analytics & Pulse™ – focus spend masFlight™ – cloud BI Personalization software-defined networking now driving revenue growth and margin efficiency 6 Investor PresentationPassenger Experience Leadership Connect Entertain • Leading provider of on-board digital Global coverage & redundancy Premium movies, games, TV Native 4K cloud platform High performance entertainment (premium movies, television, games and mobile apps) Broadband Media & for seatback IFE and wireless systems Connectivity Content Deliver real-time • Leading satellite connectivity and entertainment live TV provider to single-aisle airliners, large cruise ships & superyachts through multi-orbit, open-architecture capabilities Generate Optimize media • Fast-growing government and secure revenue investments military connectivity business • Multi-year technology investments in Inform AirTime™ interfaces cloud-based content services and Analytics & Pulse™ – focus spend masFlight™ – cloud BI Personalization software-defined networking now driving revenue growth and margin efficiency 6 Investor Presentation

Winning in IFC: Innovation, Focus and Capabilities Disciplined focus on B737/A320 fleets for efficiency and specialization • Connected entertainment focus – full IFEC solution Norwegian with broadband connectivity, live television, games, B737 Fleet movies, analytics and back-office automation Icelandair Turkish B757/767 Fleet LOT A320 Fleet • Aircraft focus on Boeing 737 and Airbus A320 fleets B737 Fleet B737 Fleet Southwest B737 Fleet • Geographic focus on North America to Middle East Air France A320 Fleet • Maximize network utilization and efficiency FlyDubai B737 Fleet Active fleets and contracted backlog • Satellite redundancy and scalability High Performance Capabilities Connected Entertainment Experiences • 1,100+ shipsets installed • Internet & messaging • Up to 500 Mbps/aircraft • On-demand movies • Proven designs • Live television • Repair & line support • Games & music 7 Investor PresentationWinning in IFC: Innovation, Focus and Capabilities Disciplined focus on B737/A320 fleets for efficiency and specialization • Connected entertainment focus – full IFEC solution Norwegian with broadband connectivity, live television, games, B737 Fleet movies, analytics and back-office automation Icelandair Turkish B757/767 Fleet LOT A320 Fleet • Aircraft focus on Boeing 737 and Airbus A320 fleets B737 Fleet B737 Fleet Southwest B737 Fleet • Geographic focus on North America to Middle East Air France A320 Fleet • Maximize network utilization and efficiency FlyDubai B737 Fleet Active fleets and contracted backlog • Satellite redundancy and scalability High Performance Capabilities Connected Entertainment Experiences • 1,100+ shipsets installed • Internet & messaging • Up to 500 Mbps/aircraft • On-demand movies • Proven designs • Live television • Repair & line support • Games & music 7 Investor Presentation

Boeing 737 MAX 1 Return of MAX expected to boost revenue, Adjusted EBITDA and Cash Flow Impact of MAX grounding Impact of Boeing manufacturing halt • Anticipated impact when MAX re-enters service: • Boeing suspended MAX production from January, impacting our MAX connectivity equipment installations • ~$3 million per-quarter increase in revenue • Expect to carry an additional quarter of inventory or • ~$2 million per quarter increase in Adjusted EBITDA approximately $4-5 million of additional inventory • ~$2-3 million per quarter increase in cash flow • Expect inventory levels to normalize approximately one quarter after production resumes; working with Boeing, • MAX Connectivity service revenue is important factor to Global Eagle suppliers and customers to minimize impact generate positive free cash flow on a sustainable basis • Expect lower equipment revenue during 1Q20 due to • Do not expect service revenue to start until 2Q20 production delays • Major MAX customers: Southwest, flydubai and LOT Polish • 10-15 aircraft per quarter, $4-5 million impact to revenue • MAX grounding primarily impacts Connectivity service • Expect accelerated installations once production resumes revenue, secondary impact to Media & Content revenue 1 8 See the “Non-GAAP Reconciliations” and “Non-GAAP Financial Investor Presentation Measures” slides in the back of this presentation.Boeing 737 MAX 1 Return of MAX expected to boost revenue, Adjusted EBITDA and Cash Flow Impact of MAX grounding Impact of Boeing manufacturing halt • Anticipated impact when MAX re-enters service: • Boeing suspended MAX production from January, impacting our MAX connectivity equipment installations • ~$3 million per-quarter increase in revenue • Expect to carry an additional quarter of inventory or • ~$2 million per quarter increase in Adjusted EBITDA approximately $4-5 million of additional inventory • ~$2-3 million per quarter increase in cash flow • Expect inventory levels to normalize approximately one quarter after production resumes; working with Boeing, • MAX Connectivity service revenue is important factor to Global Eagle suppliers and customers to minimize impact generate positive free cash flow on a sustainable basis • Expect lower equipment revenue during 1Q20 due to • Do not expect service revenue to start until 2Q20 production delays • Major MAX customers: Southwest, flydubai and LOT Polish • 10-15 aircraft per quarter, $4-5 million impact to revenue • MAX grounding primarily impacts Connectivity service • Expect accelerated installations once production resumes revenue, secondary impact to Media & Content revenue 1 8 See the “Non-GAAP Reconciliations” and “Non-GAAP Financial Investor Presentation Measures” slides in the back of this presentation.

Media & Content Portfolio Digital content sourcing & distribution, from studio to seatback integration 1 Content licensing #1 Independent Global Content Distributor Curating, programming and licensing movies, TV, audio and live events for mobility Movie and television licensing & distribution Dynamic content selection – self-service capability Streamlined metadata: more titles in less time 1 #1 Global Content Service Provider Content Our cloud backbone revolutionizes processing Processing 10 petabytes of distribution from studio to passenger media for 1 billion passengers Content editing, integration (seatback & wireless IFE) • Before – monthly cycles, fixed library for each fleet and metadata • Now – cloud-based digital architecture streamlines 1 ingestion, compliance, processing and integration #1 Global Seatback Games & UI/UX Developer Digital media UX/UI SDKs • Differentiates passenger IFE experiences Digital advertising, games, Portal Design • 4K data processing and digital distribution mobile apps and UX design Games Advertising for on-board entertainment • Personalized content (route, day and end-user) Seatback 1 9 Source: Management estimates Investor PresentationMedia & Content Portfolio Digital content sourcing & distribution, from studio to seatback integration 1 Content licensing #1 Independent Global Content Distributor Curating, programming and licensing movies, TV, audio and live events for mobility Movie and television licensing & distribution Dynamic content selection – self-service capability Streamlined metadata: more titles in less time 1 #1 Global Content Service Provider Content Our cloud backbone revolutionizes processing Processing 10 petabytes of distribution from studio to passenger media for 1 billion passengers Content editing, integration (seatback & wireless IFE) • Before – monthly cycles, fixed library for each fleet and metadata • Now – cloud-based digital architecture streamlines 1 ingestion, compliance, processing and integration #1 Global Seatback Games & UI/UX Developer Digital media UX/UI SDKs • Differentiates passenger IFE experiences Digital advertising, games, Portal Design • 4K data processing and digital distribution mobile apps and UX design Games Advertising for on-board entertainment • Personalized content (route, day and end-user) Seatback 1 9 Source: Management estimates Investor Presentation

Maritime, Enterprise & Government: Vertical Markets Maritime, Enterprise & Government Cruise & Large Commercial Enterprise Government Large Ferry Yachts Maritime Provides Connectivity, Provides Connectivity Provides Connectivity Provides enterprise Connectivity for Content & Live TV for for superyachts (2- for commercial connectivity for government, military passengers and crew 25+ crew members) shipping and oil & gas enterprises/NGOs and intelligence 10 Investor PresentationMaritime, Enterprise & Government: Vertical Markets Maritime, Enterprise & Government Cruise & Large Commercial Enterprise Government Large Ferry Yachts Maritime Provides Connectivity, Provides Connectivity Provides Connectivity Provides enterprise Connectivity for Content & Live TV for for superyachts (2- for commercial connectivity for government, military passengers and crew 25+ crew members) shipping and oil & gas enterprises/NGOs and intelligence 10 Investor Presentation

Strategic Review Update Exploring options for MEG operating unit and JVs • Maritime, Enterprise and Government business unit • Evaluating the potential sale of all or part of the business • Working with Barclays Capital • Status: Active • Joint Venture interest • Evaluating the potential sale of 49% interest • Majority owner is managing the sale, advised by Drake Star Partners • Status: Active • If we complete either transaction, majority of proceeds will be used to retire debt 11 Investor PresentationStrategic Review Update Exploring options for MEG operating unit and JVs • Maritime, Enterprise and Government business unit • Evaluating the potential sale of all or part of the business • Working with Barclays Capital • Status: Active • Joint Venture interest • Evaluating the potential sale of 49% interest • Majority owner is managing the sale, advised by Drake Star Partners • Status: Active • If we complete either transaction, majority of proceeds will be used to retire debt 11 Investor Presentation

Transformation Timeline Run a healthy core business and drive profitable growth 1H 2H 1H 2018 2019 2019 2020 Drive Aviation & MEG Air France Focus MEG Turkish Airlines Drive scale high-speed IFC business lines high-speed IFC efficiencies Connectivity leadership Begin Open™ Win & implement Transition first Deploy Open™ to Innovate and lead in development major CSP deals airlines to Open™ add’l customers Media & Content services Phase II – focus Phase III – focus Phase I – simplify Amend term loan Improve margin and on gross margin on workflow structure & team with new liquidity cash flow generation and opex & procurement INITIATED Strengthen back-office Complete ERP Data-driven Simplify and Continuous integration ops improvement streamline ops improvement and operational platforms 12 Investor PresentationTransformation Timeline Run a healthy core business and drive profitable growth 1H 2H 1H 2018 2019 2019 2020 Drive Aviation & MEG Air France Focus MEG Turkish Airlines Drive scale high-speed IFC business lines high-speed IFC efficiencies Connectivity leadership Begin Open™ Win & implement Transition first Deploy Open™ to Innovate and lead in development major CSP deals airlines to Open™ add’l customers Media & Content services Phase II – focus Phase III – focus Phase I – simplify Amend term loan Improve margin and on gross margin on workflow structure & team with new liquidity cash flow generation and opex & procurement INITIATED Strengthen back-office Complete ERP Data-driven Simplify and Continuous integration ops improvement streamline ops improvement and operational platforms 12 Investor Presentation

Phase III Transformation Update Planning completed, 1Q20 implementation, 2Q20 initial realization • Cross-functional teams driving multiple initiatives across the company • Using data analytics to drive spend optimization (Content & Connectivity) improving procurement, optimizing business processes • Leveraging increased IFC backlog and content technology to capture margin opportunities while improving customer value • Financial Impact • Expect FY20 in-year benefit of $10+ million • Approximately 60% COGS and 40% Opex • Benefits expected to build quarterly throughout the year beginning 2Q20 • Savings expected to drive continued improvement in free cash flow 13 Investor PresentationPhase III Transformation Update Planning completed, 1Q20 implementation, 2Q20 initial realization • Cross-functional teams driving multiple initiatives across the company • Using data analytics to drive spend optimization (Content & Connectivity) improving procurement, optimizing business processes • Leveraging increased IFC backlog and content technology to capture margin opportunities while improving customer value • Financial Impact • Expect FY20 in-year benefit of $10+ million • Approximately 60% COGS and 40% Opex • Benefits expected to build quarterly throughout the year beginning 2Q20 • Savings expected to drive continued improvement in free cash flow 13 Investor Presentation
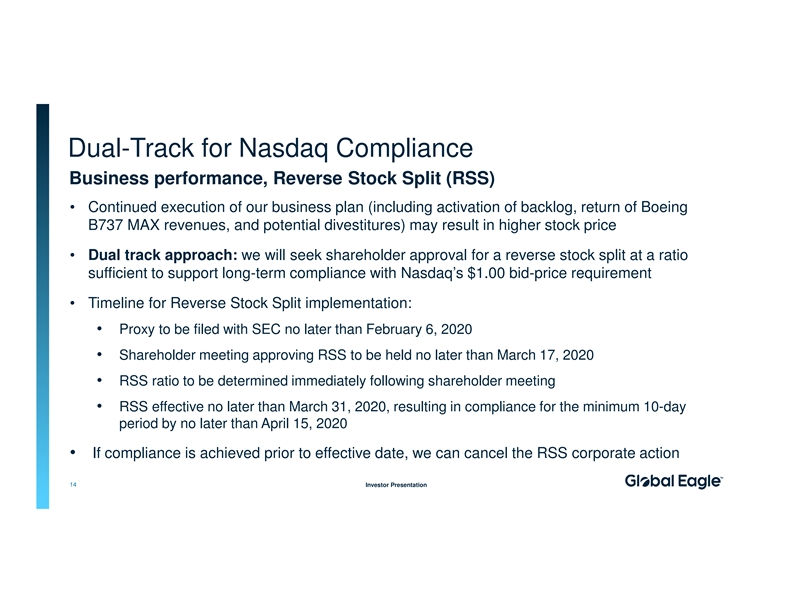
Dual-Track for Nasdaq Compliance Business performance, Reverse Stock Split (RSS) • Continued execution of our business plan (including activation of backlog, return of Boeing B737 MAX revenues, and potential divestitures) may result in higher stock price • Dual track approach: we will seek shareholder approval for a reverse stock split at a ratio sufficient to support long-term compliance with Nasdaq’s $1.00 bid-price requirement • Timeline for Reverse Stock Split implementation: • Proxy to be filed with SEC no later than February 6, 2020 • Shareholder meeting approving RSS to be held no later than March 17, 2020 • RSS ratio to be determined immediately following shareholder meeting • RSS effective no later than March 31, 2020, resulting in compliance for the minimum 10-day period by no later than April 15, 2020 • If compliance is achieved prior to effective date, we can cancel the RSS corporate action 14 Investor PresentationDual-Track for Nasdaq Compliance Business performance, Reverse Stock Split (RSS) • Continued execution of our business plan (including activation of backlog, return of Boeing B737 MAX revenues, and potential divestitures) may result in higher stock price • Dual track approach: we will seek shareholder approval for a reverse stock split at a ratio sufficient to support long-term compliance with Nasdaq’s $1.00 bid-price requirement • Timeline for Reverse Stock Split implementation: • Proxy to be filed with SEC no later than February 6, 2020 • Shareholder meeting approving RSS to be held no later than March 17, 2020 • RSS ratio to be determined immediately following shareholder meeting • RSS effective no later than March 31, 2020, resulting in compliance for the minimum 10-day period by no later than April 15, 2020 • If compliance is achieved prior to effective date, we can cancel the RSS corporate action 14 Investor Presentation
Financial Overview Investor PresentationFinancial Overview Investor Presentation

Financial Highlights Improving profitability and cash flow to address leverage • Stable liquidity: ended FY19 with $23 million cash, $61 million total liquidity 1 • Meeting guidance: achieved $25 million Adjusted EBITDA in 3Q19, a quarter early 1 • Improving leverage: Net Debt/Adj. EBITDA improved 0.7x thru 3Q19 • New opportunity: expect Phase III savings of $10+ million in FY20 • Progress on becoming free cash flow positive on a sustainable basis • Expect to achieve positive free cash flow on a sustainable basis through either Phase III realization or Boeing 737 MAX return to service • Would use strategic divestment proceeds to de-lever balance sheet 1 16 See the “Non-GAAP Reconciliations” and “Non-GAAP Financial Investor Presentation Measures” slides in the back of this presentation.Financial Highlights Improving profitability and cash flow to address leverage • Stable liquidity: ended FY19 with $23 million cash, $61 million total liquidity 1 • Meeting guidance: achieved $25 million Adjusted EBITDA in 3Q19, a quarter early 1 • Improving leverage: Net Debt/Adj. EBITDA improved 0.7x thru 3Q19 • New opportunity: expect Phase III savings of $10+ million in FY20 • Progress on becoming free cash flow positive on a sustainable basis • Expect to achieve positive free cash flow on a sustainable basis through either Phase III realization or Boeing 737 MAX return to service • Would use strategic divestment proceeds to de-lever balance sheet 1 16 See the “Non-GAAP Reconciliations” and “Non-GAAP Financial Investor Presentation Measures” slides in the back of this presentation.
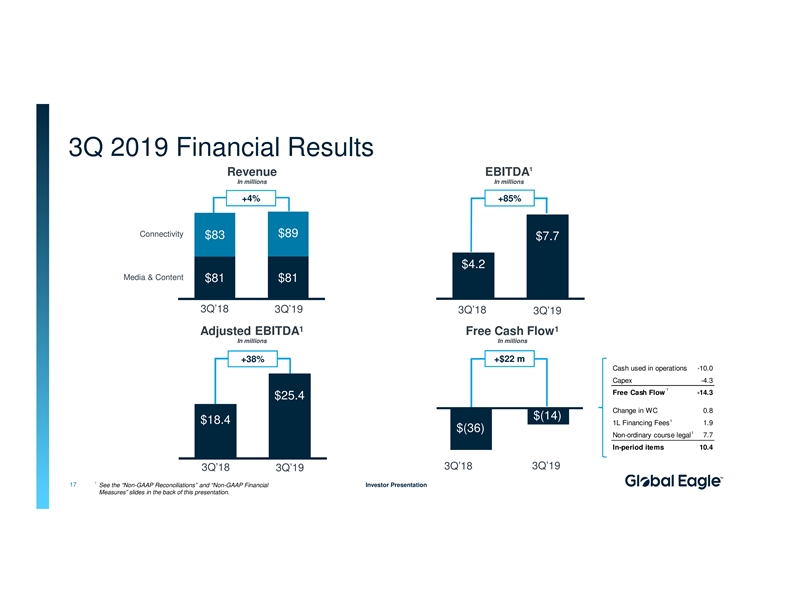
3Q 2019 Financial Results 1 Revenue EBITDA In millions In millions +4% +85% Connectivity $89 $83 $7.7 $4.2 Media & Content $81 $81 3Q’18 3Q’19 3Q’18 3Q’19 1 1 Adjusted EBITDA Free Cash Flow In millions In millions +38% +$22 m Cash used in operations -10.0 Capex -4.3 1 Free Cash Flow -14.3 $25.4 Change in WC 0.8 $(14) 1 $18.4 1L Financing Fees 1.9 $(36) 1 Non-ordinary course legal 7.7 In-period items 10.4 3Q’19 3Q’18 3Q’18 3Q’19 1 17 See the “Non-GAAP Reconciliations” and “Non-GAAP Financial Investor Presentation Measures” slides in the back of this presentation.3Q 2019 Financial Results 1 Revenue EBITDA In millions In millions +4% +85% Connectivity $89 $83 $7.7 $4.2 Media & Content $81 $81 3Q’18 3Q’19 3Q’18 3Q’19 1 1 Adjusted EBITDA Free Cash Flow In millions In millions +38% +$22 m Cash used in operations -10.0 Capex -4.3 1 Free Cash Flow -14.3 $25.4 Change in WC 0.8 $(14) 1 $18.4 1L Financing Fees 1.9 $(36) 1 Non-ordinary course legal 7.7 In-period items 10.4 3Q’19 3Q’18 3Q’18 3Q’19 1 17 See the “Non-GAAP Reconciliations” and “Non-GAAP Financial Investor Presentation Measures” slides in the back of this presentation.

Transformation Continues Track record of execution PHASE II COMPLETED Travel & • Phase I - completed: FY18 reduced operating Labor Entertainment expenses including management layers $34.3 $28.0 $3.4 • Impact: $20 million annualized benefit $1.6 • Phase II - completed: reduced ~200 roles (15%) with continued integration, lower professional 3Q'18 3Q'19 3Q'18 3Q'19 services and lower travel & entertainment Professional • Impact: $40+ million annualized benefit P Ph ha as se e IIIIII P P la la nn 1 Services $9.9 • Phase III - initiated: Applying data analytics to $7.6 Additional drive spend optimization, improved procurement, Business Process business process optimization, and sales & Reengineering and Procurement operations planning 3Q'18 3Q'19 Savings in 2020 • Expected Impact: Additional $10+ million FY20 1 18 3Q’19 Professional Services excludes non-ordinary course legal fees Investor PresentationTransformation Continues Track record of execution PHASE II COMPLETED Travel & • Phase I - completed: FY18 reduced operating Labor Entertainment expenses including management layers $34.3 $28.0 $3.4 • Impact: $20 million annualized benefit $1.6 • Phase II - completed: reduced ~200 roles (15%) with continued integration, lower professional 3Q'18 3Q'19 3Q'18 3Q'19 services and lower travel & entertainment Professional • Impact: $40+ million annualized benefit P Ph ha as se e IIIIII P P la la nn 1 Services $9.9 • Phase III - initiated: Applying data analytics to $7.6 Additional drive spend optimization, improved procurement, Business Process business process optimization, and sales & Reengineering and Procurement operations planning 3Q'18 3Q'19 Savings in 2020 • Expected Impact: Additional $10+ million FY20 1 18 3Q’19 Professional Services excludes non-ordinary course legal fees Investor Presentation

Near Term Operational Milestones Key data points to monitor our continued progress 1 Expect minimum of $25 million of Adjusted EBITDA in 4Q19 2 • FY19 exit rate of $100 million per year Generate positive free cash flow on a sustainable basis upon 737 MAX return • Revenue growth, cost actions and the return of the MAX expected to drive improvement 1 • Expect Boeing 737 MAX service revenue of $3 million, Adjusted EBITDA of $2 million and $2-3 million increase in cash flow per quarter upon return • Capex improvement as previous growth investments now completed 1 Additional FY20 improvements in EBITDA, cost structure and cash flow • Expect Phase III savings of $10+ million in FY20 1 See the “Non-GAAP Reconciliations” and “Non-GAAP Financial Measures” slides in the back of this presentation. 2 19 Investor Presentation FY19 exit rate is calculated by annualizing $25 million expected 4Q19 Adjusted EBITDANear Term Operational Milestones Key data points to monitor our continued progress 1 Expect minimum of $25 million of Adjusted EBITDA in 4Q19 2 • FY19 exit rate of $100 million per year Generate positive free cash flow on a sustainable basis upon 737 MAX return • Revenue growth, cost actions and the return of the MAX expected to drive improvement 1 • Expect Boeing 737 MAX service revenue of $3 million, Adjusted EBITDA of $2 million and $2-3 million increase in cash flow per quarter upon return • Capex improvement as previous growth investments now completed 1 Additional FY20 improvements in EBITDA, cost structure and cash flow • Expect Phase III savings of $10+ million in FY20 1 See the “Non-GAAP Reconciliations” and “Non-GAAP Financial Measures” slides in the back of this presentation. 2 19 Investor Presentation FY19 exit rate is calculated by annualizing $25 million expected 4Q19 Adjusted EBITDA

Improving Leverage Strong Adjusted EBITDA growth is driving Debt/Adj. EBITDA lower 1 Improving Net Debt/ • Net Debt/Adjusted EBITDA declined 0.7x thru 3Q19 1 Adj. EBITDA Ratio 1 • Key drivers of Adjusted EBITDA growth Adj. EBITDA (LTM) $83.6 • Execution on IFC backlog $76.7 $74.3 • Media & Content growth • Maritime/Enterprise/Gov’t margin recovery 1Q19 2Q19 3Q19 • Back-office efficiencies and cost controls Net Debt/ 1 Adj. EBITDA (LTM) • We believe 6.5x Net Debt/Adjusted EBITDA is an 9.6x 9.4x important milestone for lenders and rating agencies 8.9x • Improving free cash flow generation could accelerate deleverage 1Q19 2Q19 3Q19 1 20 See the “Non-GAAP Reconciliations” and “Non-GAAP Financial Investor Presentation Measures” slides in the back of this presentation.Improving Leverage Strong Adjusted EBITDA growth is driving Debt/Adj. EBITDA lower 1 Improving Net Debt/ • Net Debt/Adjusted EBITDA declined 0.7x thru 3Q19 1 Adj. EBITDA Ratio 1 • Key drivers of Adjusted EBITDA growth Adj. EBITDA (LTM) $83.6 • Execution on IFC backlog $76.7 $74.3 • Media & Content growth • Maritime/Enterprise/Gov’t margin recovery 1Q19 2Q19 3Q19 • Back-office efficiencies and cost controls Net Debt/ 1 Adj. EBITDA (LTM) • We believe 6.5x Net Debt/Adjusted EBITDA is an 9.6x 9.4x important milestone for lenders and rating agencies 8.9x • Improving free cash flow generation could accelerate deleverage 1Q19 2Q19 3Q19 1 20 See the “Non-GAAP Reconciliations” and “Non-GAAP Financial Investor Presentation Measures” slides in the back of this presentation.

IIn nv ve es st to or r P Pr re es se en nt ta at tiio on n © Global EagleIIn nv ve es st to or r P Pr re es se en nt ta at tiio on n © Global Eagle

Non-GAAP Reconciliations Three Months Ended Nine Months Ended September 30, September 30, Net loss to Adjusted EBITDA reconciliation 2019 2018 2019 2018 Net loss $ (41,274) $ (43,228) $ (117,343) $ (127,423) Interest expense, net 2 3,881 2 0,048 67,487 55,399 Income tax expense 4,308 2,852 7,755 1,865 Depreciation and amortization 20,789 24,482 64,265 74,517 EBITDA 7,704 4,154 22,164 4,358 Depreciation and amortization from equity method investments 2,191 2,415 6,485 7,122 Change in fair value of financial instruments 6 196 (932) 287 Other expense, net 202 588 4 86 936 Stock-based compensation expense 1,744 3,918 5,360 9,785 Strategic-transaction, integration and realignment expenses 2,837 4,259 12,738 13,113 Internal-control and delayed audit expenses 2,414 2,057 8,222 19,610 Loss on disposal of fixed assets 26 419 3 83 4 03 Non-ordinary-course legal expenses 7,685 409 8,867 409 Losses on significant customer bankruptcies 249 - 2,188 - Expenses incurred in connection with grounded aircraft 301 - 6 33 - Adjusted EBITDA $ 25,359 $ 18,415 $ 66,594 $ 56,023 Three Months Ended Nine Months Ended September 30, September 30, Cash Flow from Operations to Free Cash Flow reconciliation 2019 2018 2019 2018 Cash used in operations $ (9,972) $ (26,638) $ ( 8,000) $ (69,465) Purchases of property and equipment (4,346) (9,051) (17,788) (33,523) Free Cash Flow $ (14,318) $ (35,689) $ (25,788) $ (102,988) 22 Investor PresentationNon-GAAP Reconciliations Three Months Ended Nine Months Ended September 30, September 30, Net loss to Adjusted EBITDA reconciliation 2019 2018 2019 2018 Net loss $ (41,274) $ (43,228) $ (117,343) $ (127,423) Interest expense, net 2 3,881 2 0,048 67,487 55,399 Income tax expense 4,308 2,852 7,755 1,865 Depreciation and amortization 20,789 24,482 64,265 74,517 EBITDA 7,704 4,154 22,164 4,358 Depreciation and amortization from equity method investments 2,191 2,415 6,485 7,122 Change in fair value of financial instruments 6 196 (932) 287 Other expense, net 202 588 4 86 936 Stock-based compensation expense 1,744 3,918 5,360 9,785 Strategic-transaction, integration and realignment expenses 2,837 4,259 12,738 13,113 Internal-control and delayed audit expenses 2,414 2,057 8,222 19,610 Loss on disposal of fixed assets 26 419 3 83 4 03 Non-ordinary-course legal expenses 7,685 409 8,867 409 Losses on significant customer bankruptcies 249 - 2,188 - Expenses incurred in connection with grounded aircraft 301 - 6 33 - Adjusted EBITDA $ 25,359 $ 18,415 $ 66,594 $ 56,023 Three Months Ended Nine Months Ended September 30, September 30, Cash Flow from Operations to Free Cash Flow reconciliation 2019 2018 2019 2018 Cash used in operations $ (9,972) $ (26,638) $ ( 8,000) $ (69,465) Purchases of property and equipment (4,346) (9,051) (17,788) (33,523) Free Cash Flow $ (14,318) $ (35,689) $ (25,788) $ (102,988) 22 Investor Presentation
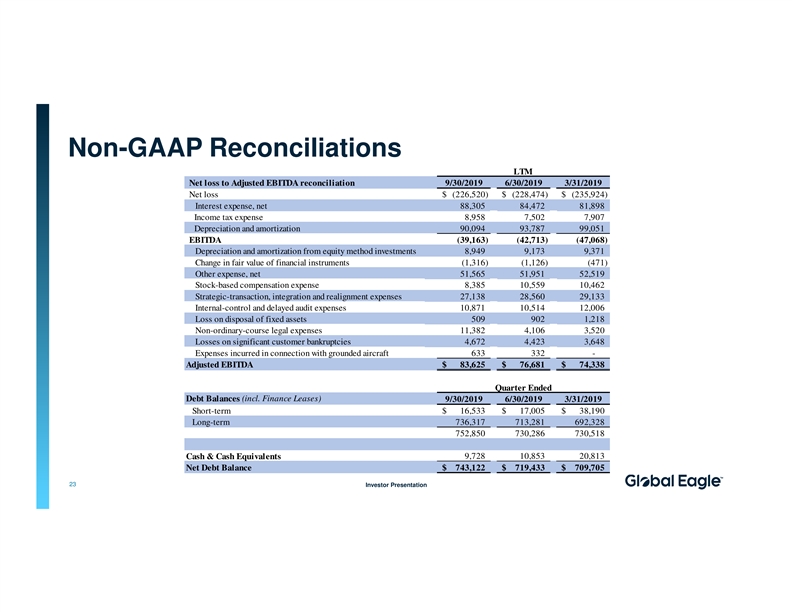
Non-GAAP Reconciliations LTM Net loss to Adjusted EBITDA reconciliation 9/30/2019 6/30/2019 3/31/2019 Net loss $ (226,520) $ (228,474) $ (235,924) Interest expense, net 88,305 84,472 81,898 Income tax expense 8,958 7 ,502 7,907 Depreciation and amortization 90,094 93,787 99,051 EBITDA (39,163) (42,713) (47,068) Depreciation and amortization from equity method investments 8,949 9 ,173 9 ,371 Change in fair value of financial instruments (1,316) (1,126) (471) Other expense, net 51,565 51,951 52,519 Stock-based compensation expense 8,385 10,559 10,462 Strategic-transaction, integration and realignment expenses 27,138 28,560 29,133 Internal-control and delayed audit expenses 10,871 10,514 12,006 Loss on disposal of fixed assets 509 902 1,218 Non-ordinary-course legal expenses 11,382 4 ,106 3 ,520 Losses on significant customer bankruptcies 4 ,672 4 ,423 3 ,648 Expenses incurred in connection with grounded aircraft 633 332 - Adjusted EBITDA $ 83,625 $ 76,681 $ 74,338 Quarter Ended (incl. Finance Leases) Debt Balances 9/30/2019 6/30/2019 3/31/2019 Short-term $ 16,533 $ 17,005 $ 38,190 Long-term 736,317 713,281 692,328 752,850 730,286 730,518 Cash & Cash Equivalents 9,728 10,853 20,813 Net Debt Balance $ 743,122 $ 719,433 $ 709,705 23 Investor PresentationNon-GAAP Reconciliations LTM Net loss to Adjusted EBITDA reconciliation 9/30/2019 6/30/2019 3/31/2019 Net loss $ (226,520) $ (228,474) $ (235,924) Interest expense, net 88,305 84,472 81,898 Income tax expense 8,958 7 ,502 7,907 Depreciation and amortization 90,094 93,787 99,051 EBITDA (39,163) (42,713) (47,068) Depreciation and amortization from equity method investments 8,949 9 ,173 9 ,371 Change in fair value of financial instruments (1,316) (1,126) (471) Other expense, net 51,565 51,951 52,519 Stock-based compensation expense 8,385 10,559 10,462 Strategic-transaction, integration and realignment expenses 27,138 28,560 29,133 Internal-control and delayed audit expenses 10,871 10,514 12,006 Loss on disposal of fixed assets 509 902 1,218 Non-ordinary-course legal expenses 11,382 4 ,106 3 ,520 Losses on significant customer bankruptcies 4 ,672 4 ,423 3 ,648 Expenses incurred in connection with grounded aircraft 633 332 - Adjusted EBITDA $ 83,625 $ 76,681 $ 74,338 Quarter Ended (incl. Finance Leases) Debt Balances 9/30/2019 6/30/2019 3/31/2019 Short-term $ 16,533 $ 17,005 $ 38,190 Long-term 736,317 713,281 692,328 752,850 730,286 730,518 Cash & Cash Equivalents 9,728 10,853 20,813 Net Debt Balance $ 743,122 $ 719,433 $ 709,705 23 Investor Presentation

Non-GAAP Financial Measures To supplement our consolidated financial statements, which are prepared and presented in accordance with accounting principles generally accepted in the United States, or GAAP, we present EBITDA, Adjusted EBITDA and free cash flow, which are non-GAAP financial measures, as measures of our performance. The presentations of EBITDA, Adjusted EBITDA and free cash flow are not intended to be considered in isolation from, or as a substitute for, or superior to, net income (loss), cash flows from operations or any other performance measures derived in accordance with GAAP or as an alternative to net cash provided by operating activities or any other measures of our cash flows or liquidity. For a reconciliation of EBITDA, Adjusted EBITDA and free cash flow to its most comparable measure under GAAP, please see the table entitled “Non-GAAP Reconciliations” on the prior slide. Further, we note that Adjusted EBITDA as presented herein is defined and calculated differently than the “Consolidated EBITDA” definition in our senior secured credit agreement and in our second lien notes, which Consolidated EBITDA definition we use for financial-covenant-compliance purposes and as a measure of our liquidity. We have not provided a reconciliation of forward-looking non-GAAP measures, primarily due to the variability and difficulty in making accurate forecasts and projections, as not all of the information necessary for a quantitative reconciliation is available to us without unreasonable efforts. EBITDA, Adjusted EBITDA and free cash flow are three of the primary measures used by our management and Board of Directors to understand and evaluate our financial performance and operating trends, including period to period comparisons, to prepare and approve our annual budget and to develop short- and long-term operational plans. Additionally, Adjusted EBITDA is one of the primary measures used by the Compensation Committee of our Board of Directors to establish the funding targets for (and subsequent funding of) our Annual Incentive Plan bonuses for our employees. We believe our presentation of EBITDA, Adjusted EBITDA and free cash flow is useful to investors both because it allows for greater transparency with respect to key metrics used by our management in their financial and operational decision-making and because our management frequently uses it in discussions with investors, commercial bankers, securities analysts and other users of our financial statements. We define Adjusted EBITDA as EBITDA (net income (loss) before (a) interest expense (income), (b) income tax expense (benefit) and (c) depreciation and amortization), as further adjusted to exclude (when applicable in the period) (1) change in fair value of financial instruments, (2) other (income) expense, including (gains) losses from foreign-currency-transaction (gains) and from other investments, which include impairment charges relating to our joint ventures, (3) goodwill impairment expense, (4) stock-based compensation expense, (5) strategic-transaction, integration and realignment expenses (as described below), (6) auditor and third-party professional fees and expenses related to our internal-control deficiencies (and the remediation thereof) and complications in our audit process relating to our control environment, (7) (gain) loss on disposal and impairment of fixed assets, (8) non-ordinary-course legal expenses (as described below), (9) losses related to significant customer bankruptcies or financial distress (as described below) and (10) expenses incurred in connection with grounded aircraft resulting from orders, airworthiness directives and other regulations issued by U.S. and foreign civil aviation authorities. Management does not consider these items to be indicative of our core operating results. 24 Investor PresentationNon-GAAP Financial Measures To supplement our consolidated financial statements, which are prepared and presented in accordance with accounting principles generally accepted in the United States, or GAAP, we present EBITDA, Adjusted EBITDA and free cash flow, which are non-GAAP financial measures, as measures of our performance. The presentations of EBITDA, Adjusted EBITDA and free cash flow are not intended to be considered in isolation from, or as a substitute for, or superior to, net income (loss), cash flows from operations or any other performance measures derived in accordance with GAAP or as an alternative to net cash provided by operating activities or any other measures of our cash flows or liquidity. For a reconciliation of EBITDA, Adjusted EBITDA and free cash flow to its most comparable measure under GAAP, please see the table entitled “Non-GAAP Reconciliations” on the prior slide. Further, we note that Adjusted EBITDA as presented herein is defined and calculated differently than the “Consolidated EBITDA” definition in our senior secured credit agreement and in our second lien notes, which Consolidated EBITDA definition we use for financial-covenant-compliance purposes and as a measure of our liquidity. We have not provided a reconciliation of forward-looking non-GAAP measures, primarily due to the variability and difficulty in making accurate forecasts and projections, as not all of the information necessary for a quantitative reconciliation is available to us without unreasonable efforts. EBITDA, Adjusted EBITDA and free cash flow are three of the primary measures used by our management and Board of Directors to understand and evaluate our financial performance and operating trends, including period to period comparisons, to prepare and approve our annual budget and to develop short- and long-term operational plans. Additionally, Adjusted EBITDA is one of the primary measures used by the Compensation Committee of our Board of Directors to establish the funding targets for (and subsequent funding of) our Annual Incentive Plan bonuses for our employees. We believe our presentation of EBITDA, Adjusted EBITDA and free cash flow is useful to investors both because it allows for greater transparency with respect to key metrics used by our management in their financial and operational decision-making and because our management frequently uses it in discussions with investors, commercial bankers, securities analysts and other users of our financial statements. We define Adjusted EBITDA as EBITDA (net income (loss) before (a) interest expense (income), (b) income tax expense (benefit) and (c) depreciation and amortization), as further adjusted to exclude (when applicable in the period) (1) change in fair value of financial instruments, (2) other (income) expense, including (gains) losses from foreign-currency-transaction (gains) and from other investments, which include impairment charges relating to our joint ventures, (3) goodwill impairment expense, (4) stock-based compensation expense, (5) strategic-transaction, integration and realignment expenses (as described below), (6) auditor and third-party professional fees and expenses related to our internal-control deficiencies (and the remediation thereof) and complications in our audit process relating to our control environment, (7) (gain) loss on disposal and impairment of fixed assets, (8) non-ordinary-course legal expenses (as described below), (9) losses related to significant customer bankruptcies or financial distress (as described below) and (10) expenses incurred in connection with grounded aircraft resulting from orders, airworthiness directives and other regulations issued by U.S. and foreign civil aviation authorities. Management does not consider these items to be indicative of our core operating results. 24 Investor Presentation
Non-GAAP Financial Measures (continued) “Losses related to significant customer bankruptcies or financial distress” includes (1) our provision for bad debt associated with significant bankruptcies or financial distress of our customers, (2) the costs (e.g., content acquisition fees) that we incurred to maintain service to those customers during their bankruptcy proceedings in order to preserve the customer relationship and (3) costs relating to providing services to customers for whom we recognize revenue on a cash basis due to their financial distress. “Non-ordinary-course legal expenses” includes third-party professional fees and expenses and estimated loss contingencies, provisions for legal settlements and other expenses associated with non-ordinary-course employment, corporate and intellectual-property-infringement disputes. “Strategic-transaction, integration and realignment expenses” includes (1) transaction and procurement-related expenses and costs (including third-party professional fees) attributable to acquisition, financing, investment and other strategic-transaction activities (including for new product and proof-of-concept testing), (2) integration and realignment expenses and allowances, (3) employee-severance, -retention and -relocation expenses, (4) purchase-accounting adjustments for deferred revenue, costs and credits associated with companies and businesses that we have acquired through our M&A activities and (5) estimated loss contingencies, provisions for legal settlements and other expenses related to claims at companies or businesses that we acquired through our M&A activities for underlying liabilities that pre-dated our acquisition of those companies or businesses. We define free cash flow as cash flows from operating activities less capital expenditures. Free cash flow does not represent our residual cash flow available for discretionary expenditures, since we have mandatory debt service requirements and other non-discretionary expenditures that are not deducted from the measure. We define net debt as current portion of short and long-term debt and finance leases less cash and cash equivalents. 25 Investor PresentationNon-GAAP Financial Measures (continued) “Losses related to significant customer bankruptcies or financial distress” includes (1) our provision for bad debt associated with significant bankruptcies or financial distress of our customers, (2) the costs (e.g., content acquisition fees) that we incurred to maintain service to those customers during their bankruptcy proceedings in order to preserve the customer relationship and (3) costs relating to providing services to customers for whom we recognize revenue on a cash basis due to their financial distress. “Non-ordinary-course legal expenses” includes third-party professional fees and expenses and estimated loss contingencies, provisions for legal settlements and other expenses associated with non-ordinary-course employment, corporate and intellectual-property-infringement disputes. “Strategic-transaction, integration and realignment expenses” includes (1) transaction and procurement-related expenses and costs (including third-party professional fees) attributable to acquisition, financing, investment and other strategic-transaction activities (including for new product and proof-of-concept testing), (2) integration and realignment expenses and allowances, (3) employee-severance, -retention and -relocation expenses, (4) purchase-accounting adjustments for deferred revenue, costs and credits associated with companies and businesses that we have acquired through our M&A activities and (5) estimated loss contingencies, provisions for legal settlements and other expenses related to claims at companies or businesses that we acquired through our M&A activities for underlying liabilities that pre-dated our acquisition of those companies or businesses. We define free cash flow as cash flows from operating activities less capital expenditures. Free cash flow does not represent our residual cash flow available for discretionary expenditures, since we have mandatory debt service requirements and other non-discretionary expenditures that are not deducted from the measure. We define net debt as current portion of short and long-term debt and finance leases less cash and cash equivalents. 25 Investor Presentation