Attached files
| file | filename |
|---|---|
| 8-K - 8-K - PATRICK INDUSTRIES INC | patkjanuary2020investo.htm |

August 2019 - Draft p Investor Presentation (Mockup version) Investor Presentation January 2020

Forward-Looking Statements This presentation contains certain statements related to future results or states our intentions, beliefs and expectations or predictions for the future which are forward-looking statements as that term is defined in the Private Securities Litigation Reform Act of 1995. These forward-looking statements are subject to certain risks and uncertainties that could cause actual results to differ materially from either historical or anticipated results depending on a variety of factors. Further information concerning the Company and its business, including factors that potentially could materially affect the Company’s financial results, is contained in the Company’s filings with the Securities and Exchange Commission. This presentation includes market and industry data, forecasts and valuations that have been obtained from independent consultant reports, publicly available information, various industry publications and other published industry sources. Although we believe these sources are reliable, we have not independently verified the information and cannot make any representation as to the accuracy or completeness of such information. We disclaim any obligation or undertaking to disseminate any updates or revisions to any forward- looking statements contained in this presentation or to reflect any change in our expectations after the date of this presentation or any change in events, conditions or circumstances on which any statement is based. Use Of Non-GAAP Financial Measures This presentation contains non-GAAP financial measures. These measures, the purposes for which management uses them, why management believes they are useful to investors, and a reconciliation to the most directly comparable GAAP financial measures can be found in the Appendix of this presentation. All references to profit measures and earnings per share on a comparable basis exclude items that affect comparability. PATK LISTED NASDAQ 2

Company Highlights & Overview PATK LISTED NASDAQ
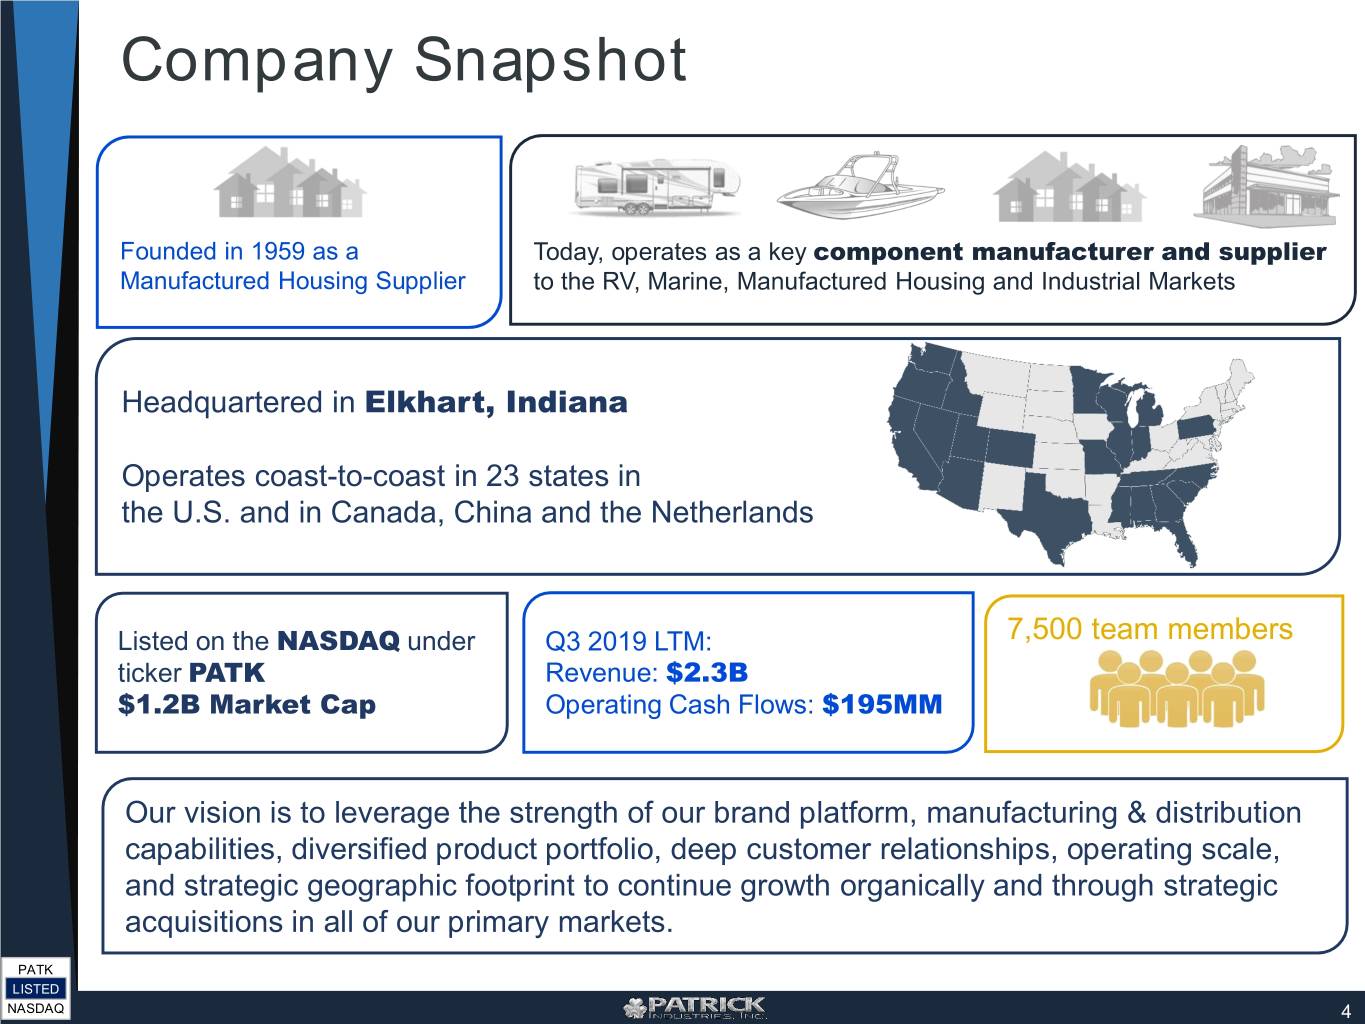
Company Snapshot Founded in 1959 as a Today, operates as a key component manufacturer and supplier Manufactured Housing Supplier to the RV, Marine, Manufactured Housing and Industrial Markets Headquartered in Elkhart, Indiana Operates coast-to-coast in 23 states in the U.S. and in Canada, China and the Netherlands Listed on the NASDAQ under Q3 2019 LTM: 7,500 team members ticker PATK Revenue: $2.3B $1.2B Market Cap Operating Cash Flows: $195MM Our vision is to leverage the strength of our brand platform, manufacturing & distribution capabilities, diversified product portfolio, deep customer relationships, operating scale, and strategic geographic footprint to continue growth organically and through strategic acquisitions in all of our primary markets. PATK LISTED NASDAQ 4

Market Platform Over the last several years, we have strategically engaged in diversifying our market position in order to align our revenue stream with wholesale and retail trends across all four of our primary end markets Sales Composition 2016 2017 2018 RV – 72% RV – 69% RV – 63% Marine – 3% Marine – 7% Marine – 12% MH – 13% MH – 13% MH – 12% Industrial – 12% Industrial – 11% Industrial – 13% Lifestyle & Leisure Housing & Industrial RV Marine MH Industrial Manufactured Travel Trailer, Fifth Pontoon, Fiberglass, Residential Housing, Wheel, Folding Trailer, Housing, Modular Commercial Fixtures, Ski & Wake, Aluminum Housing, Modular Class A, B, C Institutional Furniture Structure 56% of 9M 2019 Sales 14% of 9M 2019 Sales 18% of 9M 2019 Sales 12% of 9M 2019 Sales PATK LISTED NASDAQ 5

Strategic End Markets Overview Lifestyle & Leisure Housing & Industrial RV Marine Manufactured Industrial Housing Net Sales $1,299 million $339 million $400 million $281 million (LTM 9/29/19) Portfolio of Expertise Lamination/Custom Components Hardwoods/Softwoods/Cabinetry Thermoforming/Plastics Countertops & Fabrication Metal Fabrication/Fuel Tanks Electrical Systems/Wire Harnesses Electronics & Appliances Full Body Paint Wiring Marine Canvas and Towers Fiberglass Distribution & Design Center Geographic Reach / Industry Concentration PATK Portfolio of products is highly leverageable across business lines LISTED NASDAQ 6

Indicators and Demographics PATK LISTED NASDAQ

Macro Economic Indicators While we have been experiencing some secular recalibration in each of our markets, we believe there are solid fundamental indicators that signal opportunities for growth in all of our end markets as we start the new year Good Caution Commentary Interest Rates Three rate cuts in 2019 Housing Starts Up 1% Nov-YTD Fuel prices remain advantageous; Fuel Prices Mideast tension may cause volatility Consumer confidence remains at Consumer Confidence high levels Capacity & competitive landscape Credit Availability within consumer financing Strong wage growth & sustainment Wages & Employment of record unemployment Slight decline, but expect interest Cars & Truck Sales rate cuts to stabilize demand in 2020 Inventories stabilizing; starting to Dealer Inventories hear that there is an undersupply Consumer Debt Consumer debt continuing to rise Political uncertainty domestically; ` Global Political Environment trade talks trending positive Fundamental Demographics Strong long-term fundamentals PATK LISTED NASDAQ 8

Favorable Demographic Trends A key population demographic supporting the industries we serve indicates future market upside potential US Population age 35 – 44 50,000 Key Key population population demographic is demographic poised to return to 48,000 begins to growth after a 14 decline year decline 46,000 44,000 42,000 40,000 38,000 36,000 2025 2030 1990 1991 1992 1993 1994 1995 1996 1997 1998 1999 2000 2001 2002 2003 2004 2005 2006 2007 2008 2009 2010 2011 2012 2013 2014 2015 2016 2017 2018 2019 2020 2021 2022 2023 2024 2026 2027 2028 2029 US population age 35-44 (000's) This segment of the population is in the family building and wealth forming stages of the life cycle, settling into permanent housing, and allocating a portion of disposable income to discretionary purchases and high ticket items PATK Sources: Euromonitor & RVIA LISTED NASDAQ 9
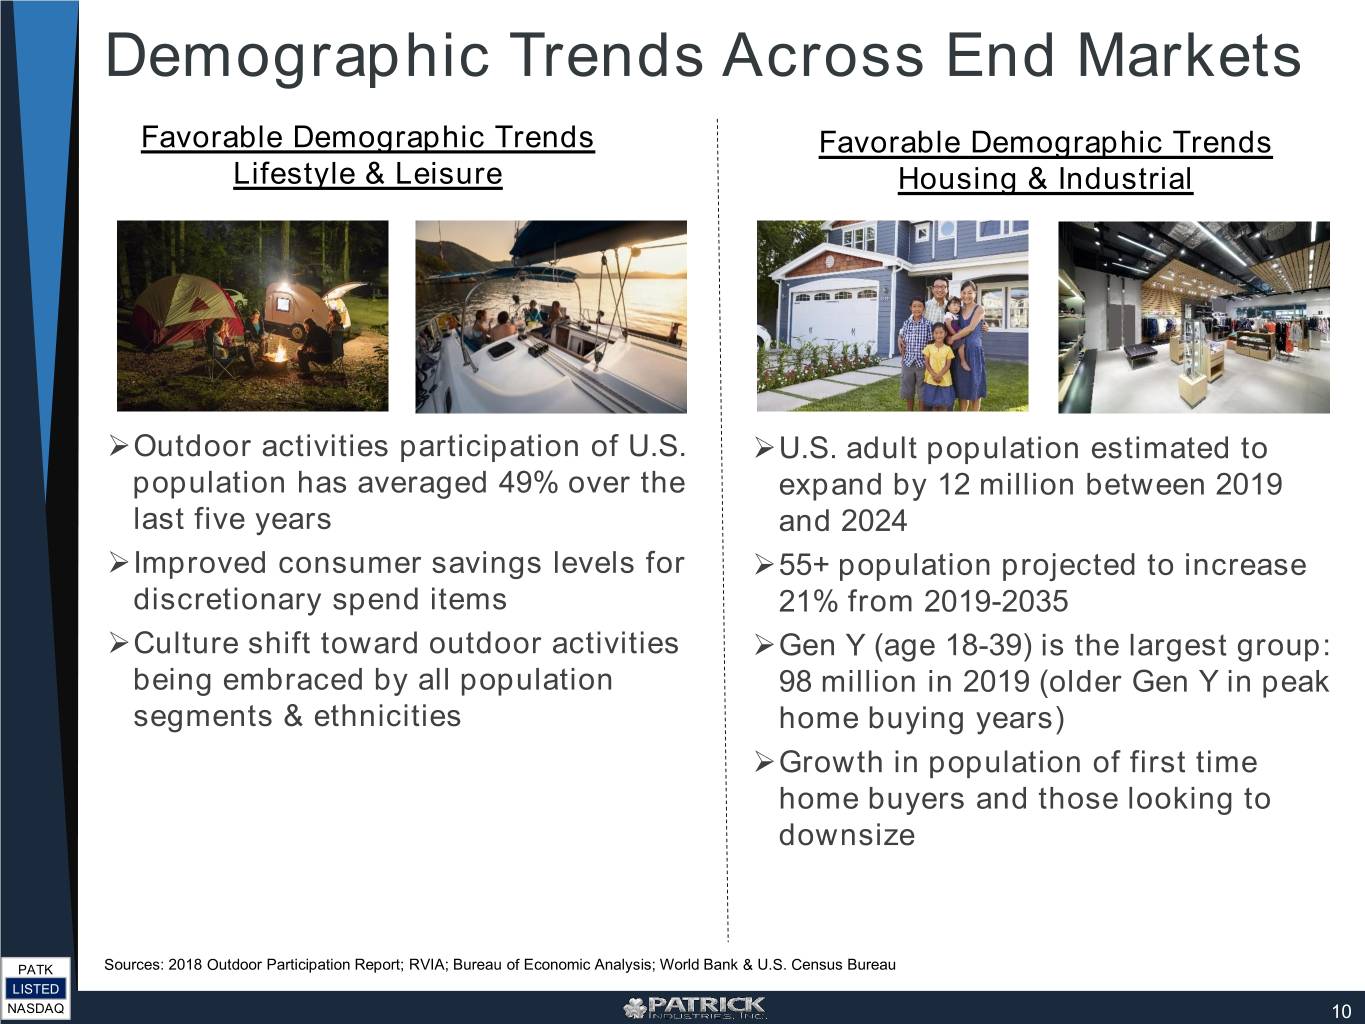
Demographic Trends Across End Markets Favorable Demographic Trends Favorable Demographic Trends Lifestyle & Leisure Housing & Industrial Outdoor activities participation of U.S. U.S. adult population estimated to population has averaged 49% over the expand by 12 million between 2019 last five years and 2024 Improved consumer savings levels for 55+ population projected to increase discretionary spend items 21% from 2019-2035 Culture shift toward outdoor activities Gen Y (age 18-39) is the largest group: being embraced by all population 98 million in 2019 (older Gen Y in peak segments & ethnicities home buying years) Growth in population of first time home buyers and those looking to downsize PATK Sources: 2018 Outdoor Participation Report; RVIA; Bureau of Economic Analysis; World Bank & U.S. Census Bureau LISTED NASDAQ 10

Industry Trends PATK LISTED NASDAQ
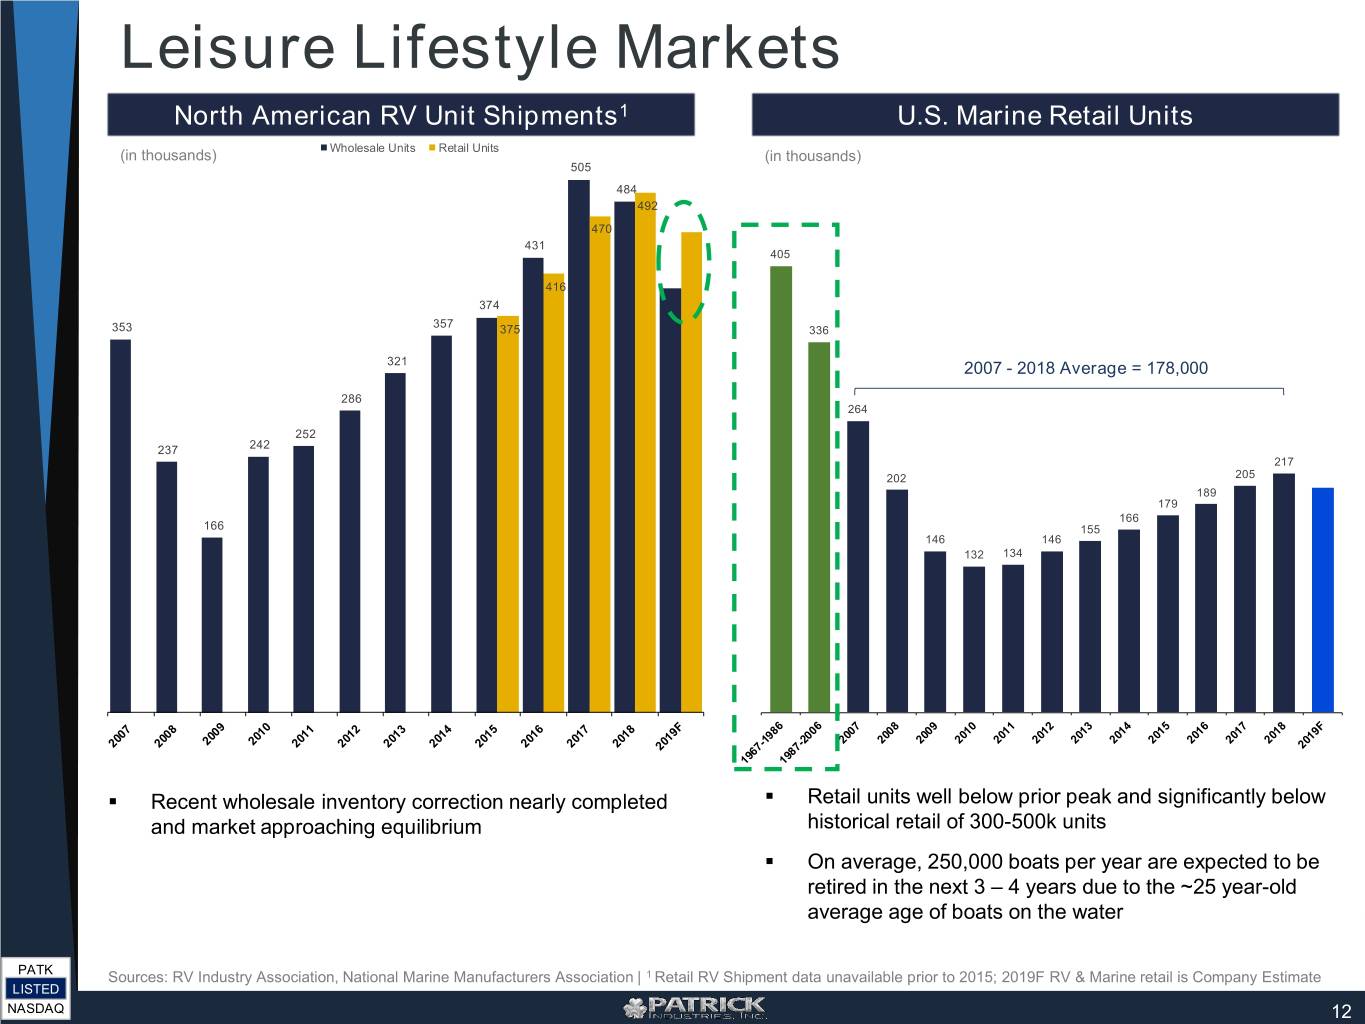
Leisure Lifestyle Markets North American RV Unit Shipments1 U.S. Marine Retail Units Wholesale Units Retail Units (in thousands) (in thousands) 505 484 492 470 431 405 416 374 357 353 375 336 321 2007 - 2018 Average = 178,000 286 264 252 237 242 217 202 205 189 179 166 166 155 146 146 132 134 . Recent wholesale inventory correction nearly completed . Retail units well below prior peak and significantly below and market approaching equilibrium historical retail of 300-500k units . On average, 250,000 boats per year are expected to be retired in the next 3 – 4 years due to the ~25 year-old average age of boats on the water PATK Sources: RV Industry Association, National Marine Manufacturers Association | 1 Retail RV Shipment data unavailable prior to 2015; 2019F RV & Marine retail is Company Estimate LISTED NASDAQ 12

RV Industry Trends RV Market The prior 18 month RV trends continued into the third quarter with wholesale shipment declines still outpacing retail leaving dealer unit inventories at their lowest point since 2014 RV Shipments (shipments in thousands) Wholesale Retail 173.1 162.7 159.6 139.9 137.1 143.3 135.6 126.6 134.5 133.5 120.9 121.6 116.6 RVIA projects 107.1 105.0 100.0 96.6 89.9 93.4 87.2 80.6 79.1 wholesale units of 402k for 2019 and a range of 360k to 405k for FY 2020 Q1-17 Q2-17 Q3-17 Q4-17 Q1-18 Q2-18 Q3-18 Q4-18 Q1-19 Q2-19 Q3-19E* Q4-19E Quarterly Retail Shipments Over / (Under) Wholesale (33.7) 27.2 18.3 (46.0) (40.5) 38.6 36.2 (25.9) (10.1) 43.0 40.2 Anticipate ~121k units will have been pulled out of inventory since the initial de-stocking began RV Wholesale Shipment Trends 24% 19% 19% 19% 15% 11% 12% 12% 13% 8% 3% 4% 4% The RV wholesale declines -1% hit a trough in Q1 ‘19 and -12% -13% -13% the declines are expected to -17% continue to decelerate -27% The average normal RV Q1-15 Q2-15 Q3-15 Q4-15 Q1-16 Q2-16 Q3-16 Q4-16 Q1-18 Q2-18 Q3-18 Q4-18 Q1-19 Q2-19 Q3-19 Q2-17 Q3-17 Q4-17 Q1-17 cycle is approximately 8 to Q4-19E PATK *Q3 retail is adjusted with Company estimate for historical lag analysis; Q4-19E is Company Estimate 12 quarters LISTED NASDAQ 13

RV Retail & Inventories RV Market RV Shipments Change YoY Wholesale Retail 40% Wholesale +5% Wholesale +15% Wholesale +17% Wholesale -4% Q3'19 YTD Wholesale -18% Retail +13% Retail +11% Retail +13% Retail +4% Q3'19 YTD Retail -7% 30% 20% 10% The destocking that has 0% -7% occurred over the last 18 months has positioned -10% wholesale shipments to be resilient if there were to be a -20% -17% modest decline in retail 3.6 demand in 2020 -30% Q3-15 Q4-15 Q1-16 Q4-16 Q1-17 Q2-17 Q1-18 Q2-18 Q3-18 Q2-19 Q1-15 Q2-15 Q2-16 Q3-16 Q3-17 Q4-17 Q4-18 Q1-19 Q3-19E Q4-19E FY FY 2019E Dealer Inventory 3.6 Weeks on Hand TTM Inventory Turns 40 35 Reduced dealer inventories 2.7 and weeks on hand (Q3- 30 1.8 19E weeks on hand down 25 4.4 weeks vs. prior 4 year 0.9 20 Q3 average) 0.0 15 Q4-15 Q1-16 Q4-16 Q1-17 Q2-17 Q1-18 Q2-18 Q2-19 Q1-15 Q2-15 Q3-15 Q2-16 Q3-16 Q3-17 Q4-17 Q3-18 Q4-18 Q1-19 Q3-19E Q4-19E PATK Sources: RV wholesale shipments: RVIA; Retail shipments: SSI; Q3’19E/Q4’19E Retail / FY2019E (Company Estimates) LISTED NASDAQ 14
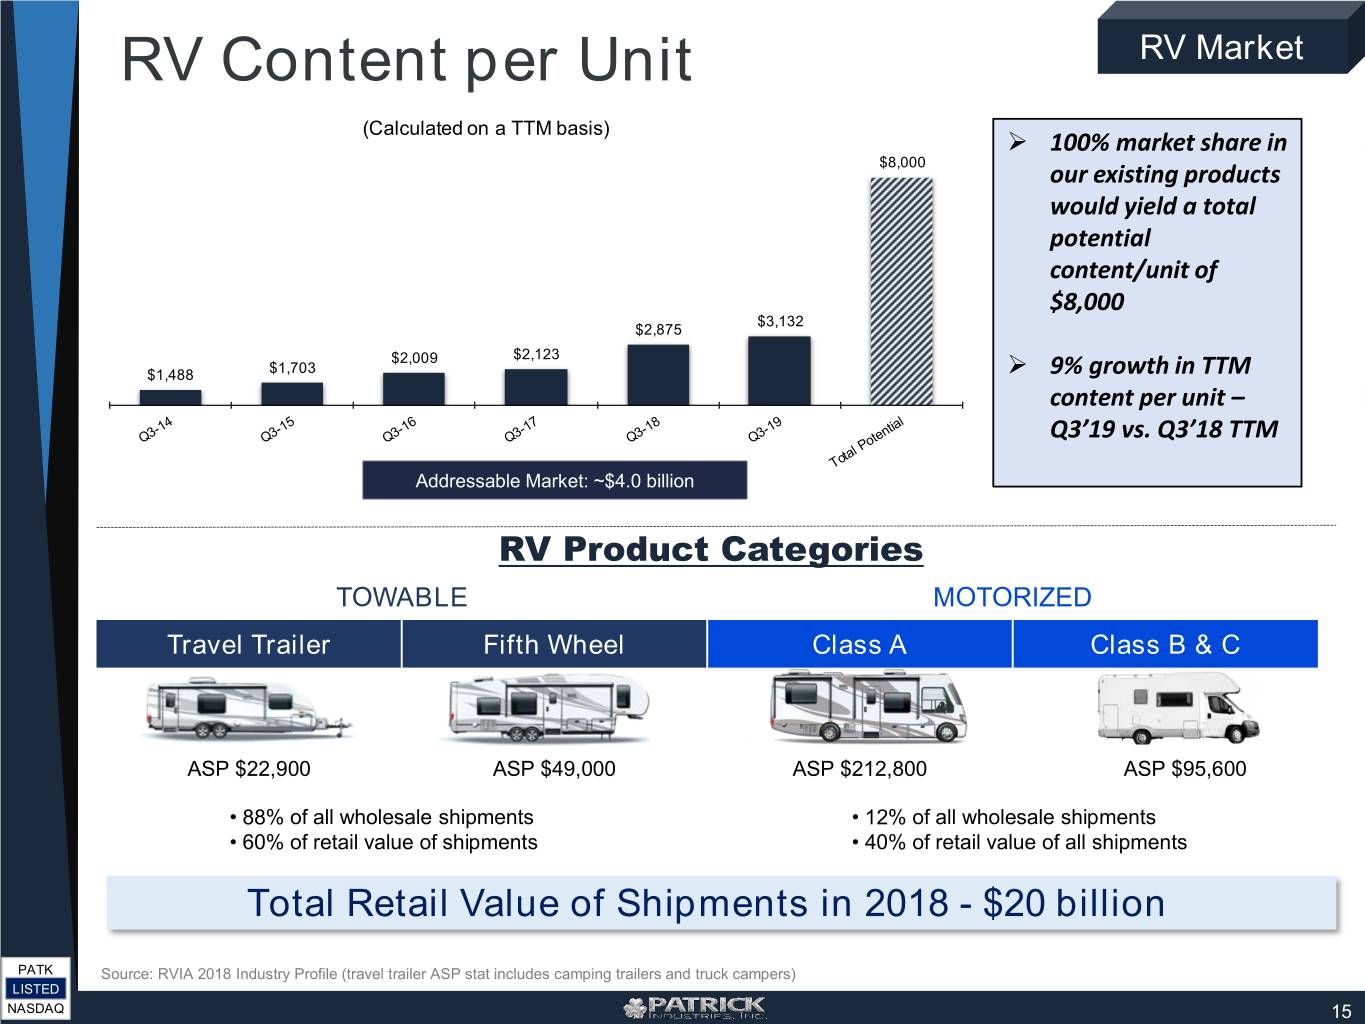
RV Content per Unit RV Market Folding Camper (Calculated on a TTM basis) 100% Truckmarket Camper share in $8,000 our existing products wouldMotorized: yield a total Type B potentialType C content/unit Total B & ofC $8,000 $3,132 $2,875 ASP -2017 Towables: $2,009 $2,123 $1,488 $1,703 9% growthTravel Trailer in TTM contentFolding per Camper unit – Truck Camper Q3’19 vs. Q3’18 TTM Addressable Market: ~$4.0 billion RV Product Categories TOWABLE MOTORIZED Travel Trailer Fifth Wheel Class A Class B & C ASP $22,900 ASP $49,000 ASP $212,800 ASP $95,600 • 88% of all wholesale shipments • 12% of all wholesale shipments • 60% of retail value of shipments • 40% of retail value of all shipments Total Retail Value of Shipments in 2018 - $20 billion PATK Source: RVIA 2018 Industry Profile (travel trailer ASP stat includes camping trailers and truck campers) LISTED NASDAQ 15

Marine Industry Trends Marine Market Marine continues to have strong fundamental consumer demand, combined with aging boat inventories and the replacement cycle. Marine dealers and OEMs began to destock inventory in Q3 in reaction to first half of the year retail headwinds from volatile interest rates and difficult weather conditions Marine Wholesale / Retail Shipment Trends Expect dealers and 10%10% OEMs to remain focused 6% 6% 5% 5% 3% 4% 3% on inventory reduction in reaction to challenging 0% weather in the first half that impacted retail – Q3 -5% -8% -7% wholesale shipments -12% down and expect to see 2015 2016 2017 2018 Q1-19 Q2-19 Q3-19E* Q4-19E* the same in Q4. Marine Whsle Marine Retail Marine Shipment Categories Ski & Wake 5% Aluminum 28% Fiberglass 38% *Q3-19E & Q4-19E = Company Estimates Pontoon PATK 29% LISTED NASDAQ 16

Marine Content per Unit Marine Market (Powerboat Retail Unit - Calculated on a TTM Basis) 100% market share in our $9,000 existing products would yield a total potential content/unit of $9,000 55% growth in $1,623 $1,049 TTM content $417 $82 $144 per unit – Q3’19 vs. Q3’18 TTM Addressable Market: ~$1.9 billion Marine Powerboat Product Categories Our products are primarily used in the traditional powerboat market which we view as the following four categories: Pontoon Ski & Wake Fiberglass Aluminum ASP $39,200 ASP $104,300 ASP $75,500 ASP $22,700 28% of market 5% of market 36% of market 31% of market U.S. expenditures on boats, engines and accessories totaled $42 billion in 2018 PATK Source: NMMA 2018 Statistical Abstracts LISTED NASDAQ 17

MH Industry Trends MH Market Declining interest rates, reduced commodities and pent-up demand for quality, affordable housing should help drive opportunities for MH growth in Q4 MH Wholesale Shipment Trends 24% 23% 16% 14% 15% 15% 13% 11% 9% 9% 9% 7% 7% 7% 5% 2% -4% -9% -12% Q1-15 Q2-15 Q3-15 Q4-15 Q1-16 Q2-16 Q3-16 Q4-16 Q1-17 Q2-17 Q3-17 Q4-17 Q1-18 Q2-18 Q3-18 Q4-18 Q1-19 Q2-19 Q3-19 Q4-19E PATK *Q4-19E = Company Estimate LISTED NASDAQ 18
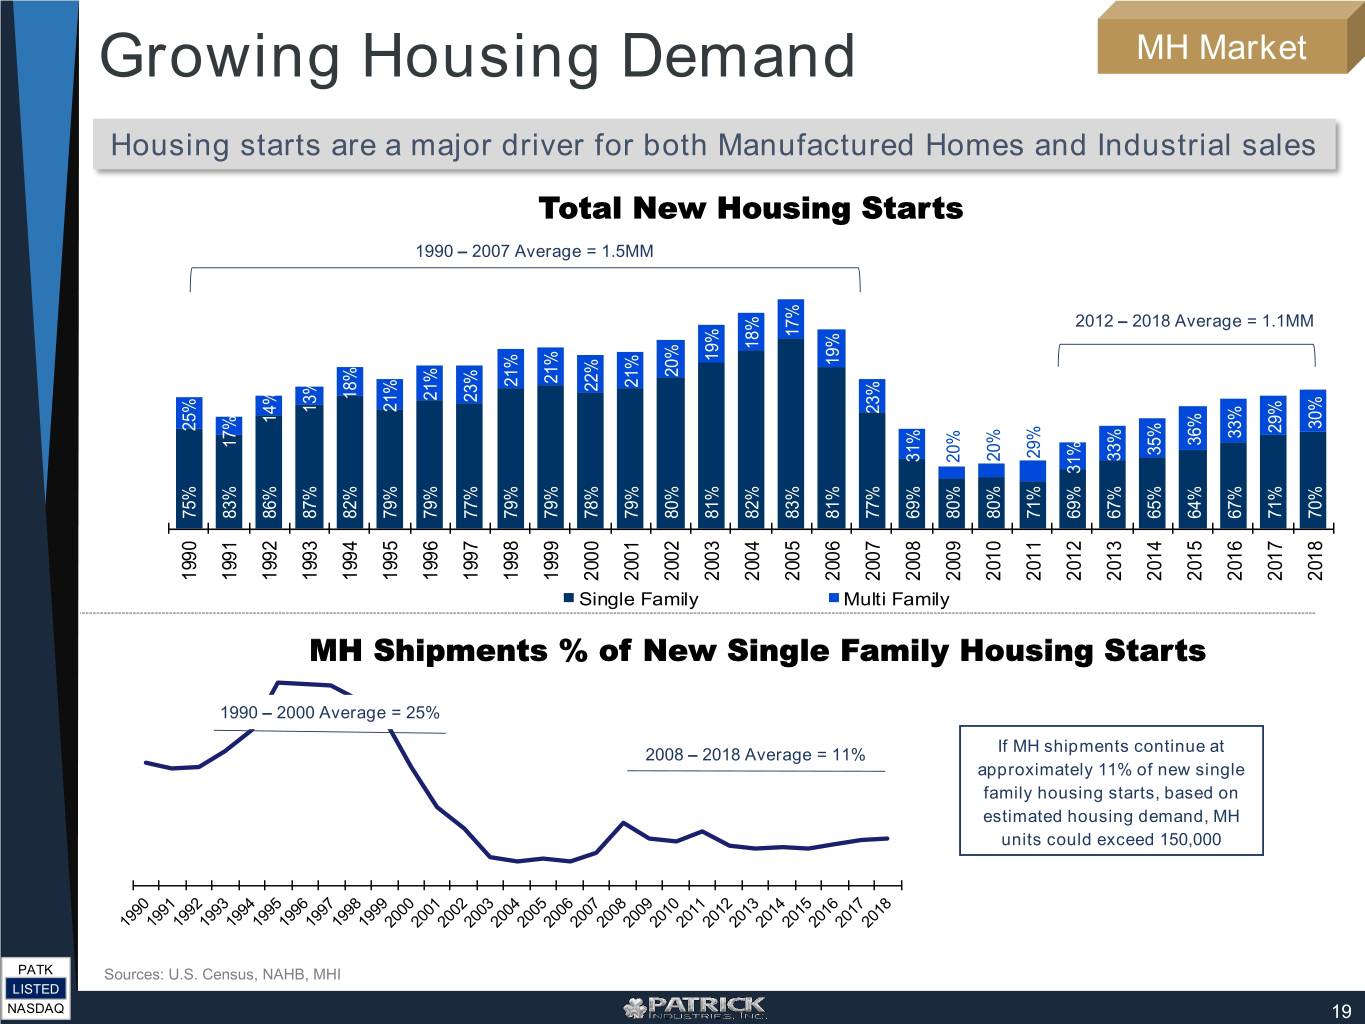
Growing Housing Demand MH Market Housing starts are a major driver for both Manufactured Homes and Industrial sales Total New Housing Starts 1990 – 2007 Average = 1.5MM 2012 – 2018 Average = 1.1MM 17% 18% 19% 19% 20% 21% 21% 21% 22% 18% 21% 23% 21% 13% 23% 14% 30% 25% 29% 33% 36% 17% 35% 29% 33% 20% 31% 20% 31% 75% 83% 86% 87% 82% 79% 79% 77% 79% 79% 78% 79% 80% 81% 82% 83% 81% 77% 69% 80% 80% 71% 69% 67% 65% 64% 67% 71% 70% 1990 1991 1992 1993 1994 1995 1996 1997 1998 1999 2000 2001 2002 2003 2004 2005 2006 2007 2008 2009 2010 2011 2012 2013 2014 2015 2016 2017 2018 Single Family Multi Family MH Shipments % of New Single Family Housing Starts 1990 – 2000 Average = 25% If MH shipments continue at 2008 – 2018 Average = 11% approximately 11% of new single family housing starts, based on estimated housing demand, MH units could exceed 150,000 PATK Sources: U.S. Census, NAHB, MHI LISTED NASDAQ 19

MH Content per Unit MH Market (Calculated on a TTM basis) 100% market share in our existing products would yield a total $11,000 potential content/unit of $11,000 65% growth in $4,327 TTM content per unit – $2,628 $1,820 $1,901 $2,159 Q3’19 vs. Q3’18 TTM Addressable Market: ~$1.05 billion Single-Section Homes Multi-Section Homes 50% of 2017 market 50% of 2017 market Avg. Sales Price (2017): $48,300 Avg. Sales Price (2017): $92,800 PATK Source: MHI / IBTS LISTED NASDAQ 20

Housing Market Trends Industrial Market Lower interest rates, reduced commodities, and strength in the overall economy are driving new housing starts growth in Q4 New Housing Start Trends 17% 16% 13% 12% 7% 7% 8% 8% 5% 4% 4% 2% 2% 1% 0% -2% -1% -6% -8% Q1-15 Q2-15 Q3-15 Q4-16 Q1-17 Q2-17 Q3-17 Q4-18 Q1-19 Q2-19 Q3-19 Q4-15 Q1-16 Q2-16 Q3-16 Q4-17 Q1-18 Q2-18 Q3-18 Q4-19E PATK *Q4-19E = Company Estimate LISTED NASDAQ 21

Growth Initiatives & Capital Allocation Strategy PATK LISTED NASDAQ

Organic and Strategic Growth Strong sales growth continues to be evident and reflects organic and strategic impact leading to more balanced and diverse end-markets Sales Growth Trends Sales Mix ($ in millions) 11% 11% 12% 11% 13% 12% Total CAGR = 32% 15% 14% 13% 13% 12% 18% 1% 2% 3% 7% +38% 12% $2,319 $2,263 14% +34% $1,636 +33% $1,222 +25% 73% 73% 72% 69% 63% +24% $920 56% $736 2014 2015 2016 2017 2018 LTM 09/29/19 2014 2015 2016 2017 2018 9M'19 RV Marine MH Industrial Drivers of organic revenue growth: New products and product lines extensions With strategic acquisitions into diverse end- Geographic expansions markets, our third quarter 2019 year to date Large brands platform sales composition was 56% RV and 44% non- Cross pollination across all end markets RV vs. 73% and 27%, respectively, in 2014 Outperformance vs. industry PATK LISTED NASDAQ 23

Cash Flow Generation and Growth ($ in millions except per share data) Strong free cash flow generation provides flexibility across operational, financial and strategic objectives Cash Flow from Free Cash Flow* Free Cash Flow per Share* Operating Activities* $7.03 89% $6.81 84% 86% 77% $200 $195 74% $166 $164 64% $3.57 $3.14 $97 $100 $2.53 $82 $77 $67 $59 $1.62 $46 $39 2014 2015 2016 2017 2018 LTM 2014 2015 2016 2017 2018 LTM 2014 2015 2016 2017 2018 LTM 9/29/19 9/29/19 9/29/19 Cash Flow from Operating Activities Free cash flow is calculated as operating cash flow less Free cash flow divided by weighted average diluted shares capital expenditures outstanding % Conversion % Conversion is operating cash flow as a % of EBITDA* PATK *See Appendix for reconciliations to GAAP LISTED NASDAQ 24

Capital Allocation Strategy Our capital allocation strategy is centered around the utilization of strong cash flows, a balanced disciplined leverage position, and capital resources to grow and reinvest in the business model Historical Capital Allocation $ in millions $93 $171 $160 $274 $485 $48 Acquisitions 7% 5% 10% 8% 7% 13% 3% 15% 22% 46% Stock Repurchases 7% 87% 92% 78% 82% 71% 47% Geographic Expansions 2014 2015 2016 2017 2018 9M 2019 Acquisitions Stock Buybacks CapEx Capital Expenditures $195MM LTM Operating Cash Flow 2.30x $500MM Dividends leverage credit capacity Note 1: Financial metrics as of 9/29/19 PATK Note 2: Adopted dividend policy in December 2019 and paid first quarterly dividend for Q4’19 on 12/30/19 LISTED NASDAQ 25

Capital Deployment Strategically and opportunistically deployed approximately $1.1B of capital over the last 5 years, while maintaining a disciplined leverage profile Capital Deployment Highlights $1.1B capital deployed . Strong cash flow generation $ in millions $485 . Flexible balance sheet and efficient capital structure . Comfortable leverage $274 profile of 2.3x as of 2.0 - 2.75x 9/29/19 $171 $160 . Tremendous liquidity with over $500MM of $48 capacity under current credit facility as of 2015 2018 2017 2016 9/29/19 Capital Deployed Leverage 2019 Q3 YTD Q3 2019 PATK LISTED NASDAQ 26


Appendix PATK LISTED NASDAQ
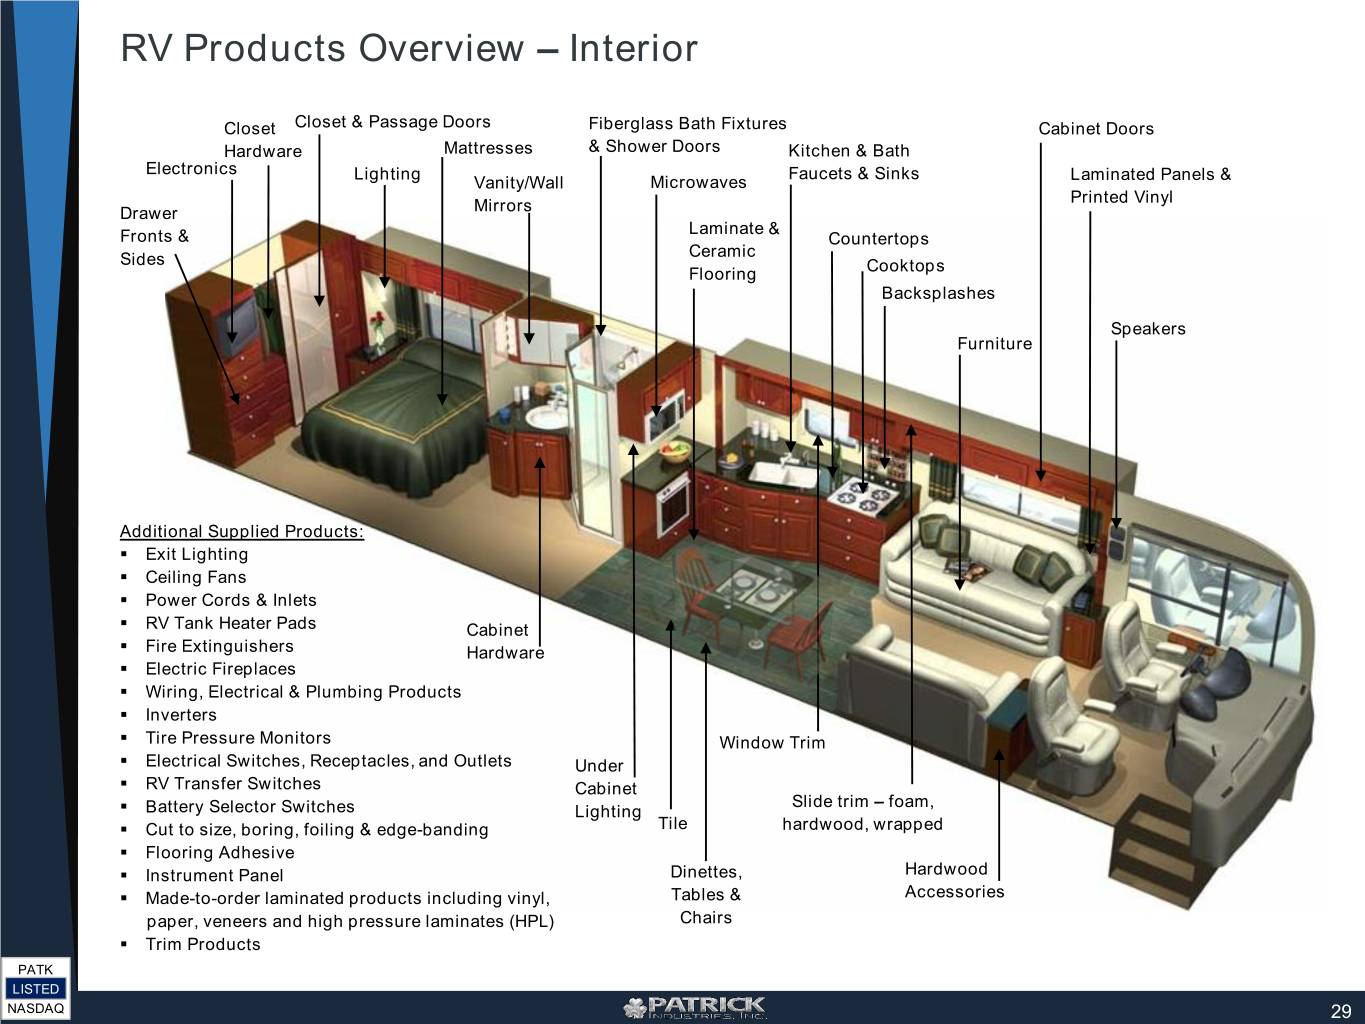
RV Products Overview – Interior Closet Closet & Passage Doors Fiberglass Bath Fixtures Cabinet Doors Hardware Mattresses & Shower Doors Kitchen & Bath Electronics Lighting Faucets & Sinks Vanity/Wall Microwaves Laminated Panels & Printed Vinyl Drawer Mirrors Laminate & Fronts & Countertops Sides Ceramic Flooring Cooktops Backsplashes Speakers Furniture Additional Supplied Products: . Exit Lighting . Ceiling Fans . Power Cords & Inlets . RV Tank Heater Pads Cabinet . Fire Extinguishers Hardware . Electric Fireplaces . Wiring, Electrical & Plumbing Products . Inverters . Tire Pressure Monitors Window Trim . Electrical Switches, Receptacles, and Outlets Under . RV Transfer Switches Cabinet Slide trim – foam, . Battery Selector Switches Lighting . Cut to size, boring, foiling & edge-banding Tile hardwood, wrapped . Flooring Adhesive . Instrument Panel Dinettes, Hardwood . Made-to-order laminated products including vinyl, Tables & Accessories paper, veneers and high pressure laminates (HPL) Chairs . Trim Products PATK LISTED NASDAQ 29

RV Products Overview – Exterior Dash Panels Front and Bow Trusses Exterior Speakers Rear Caps Additional Product Lines: . Softwoods . Full Body Paint . Aluminum Gauges . Steel Gauges . Mill Finish & Pre- Painted Aluminum and Steel . Slit & Embossed Steel . FRP Coil & Sheet . Trim Panels . Fuel Systems RV Power Cords & Inlets RV Grills & Accessories Aluminum & FRP Side Walls Motion Sensing Fender Skirts Lights Laminated Side Walls LED Lighting Paint & Paint Mask PATK LISTED NASDAQ 30

Marine Products Overview Electronics Helms Boat covers, tops, towers & frames Ladders Wire Harnesses Wire Screens Electronics Dash Assemblies Aluminum Fuel & Holding Tanks Dash Assemblies Seats Handrails Wire Harnesses Boat Hull Design & Tooling Aluminum Fuel & PATK Holding Tanks LISTED NASDAQ 31
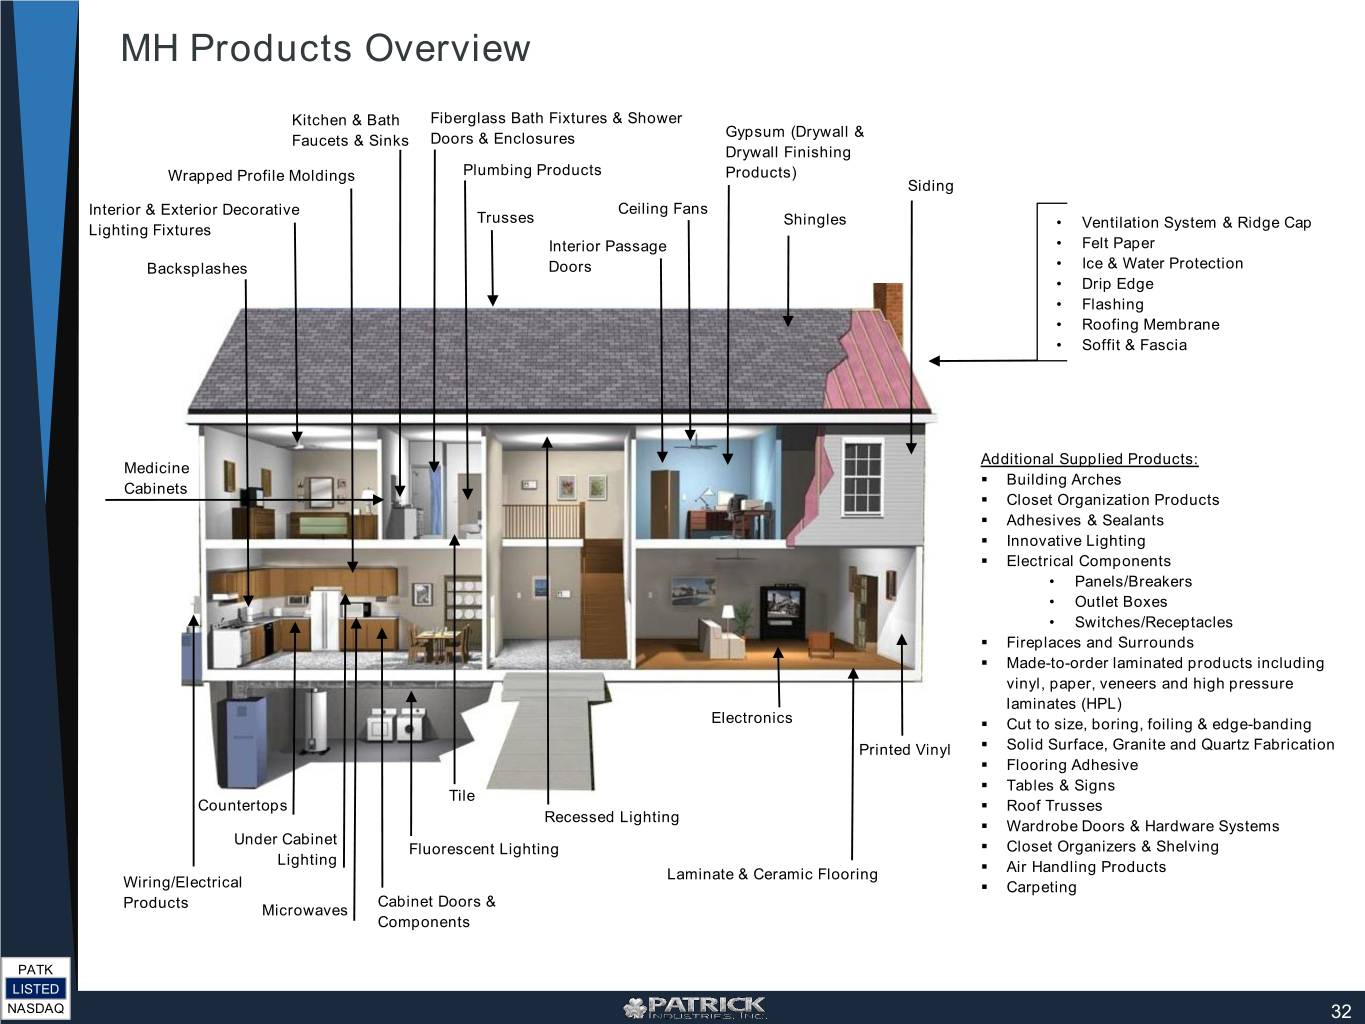
MH Products Overview Kitchen & Bath Fiberglass Bath Fixtures & Shower Gypsum (Drywall & Faucets & Sinks Doors & Enclosures Drywall Finishing Wrapped Profile Moldings Plumbing Products Products) Siding Interior & Exterior Decorative Ceiling Fans Trusses Shingles Lighting Fixtures • Ventilation System & Ridge Cap Interior Passage • Felt Paper Backsplashes Doors • Ice & Water Protection • Drip Edge • Flashing • Roofing Membrane • Soffit & Fascia Additional Supplied Products: Medicine . Building Arches Cabinets . Closet Organization Products . Adhesives & Sealants . Innovative Lighting . Electrical Components • Panels/Breakers • Outlet Boxes • Switches/Receptacles . Fireplaces and Surrounds . Made-to-order laminated products including vinyl, paper, veneers and high pressure laminates (HPL) Electronics . Cut to size, boring, foiling & edge-banding Printed Vinyl . Solid Surface, Granite and Quartz Fabrication . Flooring Adhesive . Tables & Signs Tile Countertops . Roof Trusses Recessed Lighting . Wardrobe Doors & Hardware Systems Under Cabinet Fluorescent Lighting . Closet Organizers & Shelving Lighting Laminate & Ceramic Flooring . Air Handling Products Wiring/Electrical . Carpeting Cabinet Doors & Products Microwaves Components PATK LISTED NASDAQ 32

Non-GAAP Reconciliations Reconciliation of Cash Flow from Operations to Free Cash Flow ($ in millions) 2014 2015 2016 2017 2018 LTM 9/29/19 Cash Flow from Operations $ 46 $ 67 $ 97 $ 100 $ 200 $ 195 Less: Capital Expenditures (7) (8) (15) (22) (34) (31) Free Cash Flow $ 39 $ 59 $ 82 $ 77 $ 166 $ 164 Reconciliation of Net Income to EBITDA ($ in millions) 2014 2015 2016 2017 2018 LTM 9/29/19 Net income $ 31 $ 42 $ 56 $ 86 $ 120 $ 97 Add: Depreciation & amortization 10 17 24 33 55 61 Interest expense, net 2 4 7 9 26 35 Income taxes 19 24 28 27 32 26 EBITDA $ 62 $ 87 $ 115 $ 155 $ 233 $ 219 Reconciliation of % Conversion (Cash Flow as % of EBITDA) ($ in millions) 2014 2015 2016 2017 2018 LTM 9/29/19 Cash Flow from Operations $ 46 $ 67 $ 97 $ 100 $ 200 $ 195 EBITDA $ 62 $ 87 $ 115 $ 155 $ 233 $ 219 % Conversion 74% 77% 84% 64% 86% 89% Reconciliation of Free Cash Flow Per Share ($ / # shares in millions except per share data) 2014 2015 2016 2017 2018 LTM 9/29/19 Free Cash Flow $ 39 $ 59 $ 82 $ 77 $ 166 $ 164 Divided by: Weighted Average Diluted Shares Outstanding 24.1 23.3 22.9 24.6 24.3 23.3 Free Cash Flow Per Share $ 1.62 $ 2.53 $ 3.57 $ 3.14 $ 6.81 $ 7.03 Use of Non-GAAP Financial Information Free Cash Flow, Earnings before interest, taxes, depreciation and amortization (“EBITDA”), % Conversion, and Free Cash Flow Per Share are non-GAAP financial measures. In addition to reporting financial results in accordance with accounting principles generally accepted in the United States, we provide non-GAAP operating results adjusted for certain items and other one-time items. We adjust for the items listed above in all periods presented, unless the impact is clearly immaterial to our financial statements. We utilize the adjusted results to review our ongoing operations without the effect of these adjustments and for comparison to budgeted operating results. We believe the adjusted results are useful to investors because they help them compare our results to previous periods and provide important insights into underlying trends in the business and how management oversees our business operations on a day-to-day basis. PATK LISTED NASDAQ 33
