Attached files
| file | filename |
|---|---|
| 8-K - FORM 8-K - DEERE & CO | tm201335d1_8k.htm |
Exhibit 99.1
 CES ANALYST DAY JANUARY 2020, LAS VEGAS, NV
 Safe Harbor Statement & Disclosures Commentary and discussion from the CES analyst day and these slides may include forward-looking statements and information concerning the company’s plans and projections for the future, including estimates and assumptions with respect to economic, political, technological, weather, market acceptance, acquisitions and divestitures of businesses, anticipated transaction costs, the integration of new businesses, anticipated benefits of acquisitions, and other factors that impact our businesses and customers. They also may include financial measures that are not in conformance with accounting principles generally accepted in the United States of America (GAAP). Words such as “forecast,” “projection,” “outlook,” “prospects,” “expected,” “estimated,” “will,” “plan,” “anticipate,” “intend,” “believe,” or other similar words or phrases often identify forward-looking statements. Actual results may differ materially from those projected in these forward-looking statements based on a number of factors and uncertainties. Additional information concerning factors that could cause actual results to differ materially, and other important information about non-GAAP financial measures, is contained in the company’s most recent Form 10-K and periodic reports filed with the U.S. Securities and Exchange Commission, and is incorporated by reference herein. Investors should refer to and consider the incorporated information on risks and uncertainties in addition to the information presented here. The company, except as required by law, undertakes no obligation to update or revise its forward-looking statements whether as a result of new developments or otherwise. The CES analyst day and these slides are not an offer to sell or a solicitation of offers to buy any of the company’s securities.
 CES Analyst Day 8:30 - 9:15 - 10:00 11:00 9:15 — Presentation (May, Campbell) 10:00 — Q&A (May, Campbell, Jepsen) - 11:00 — Transportation to CES Booth - 12:15 — Booth Tour
 PRIORITIES OUTCOMES Focused capital allocation – – – Intensify precision ag investments Aftermarket and Retrofit Address low-performing products Financial Operational Sustainability – – – Aligned cost structure – – Organizational design for future Optimize footprint
 PRODUCTION SYSTEMS APPROACH LEADS TO INNOVATIONS LIKE THESE
 The All New 8R Tractor Ultimate Precision Ag Tractor: – – – – Integrated GPS receiver with Gen 4 display 5-year JD-Link connectivity AutoTrac activation with turn automation Sensor technology for automation Scalable Modular Architecture: – – First of next-generation tractors Designed to scale across tractor platform Integrated High-Power Electrification: – – Industry-first Electric Infinitely Variable Transmission (E-IVT) Electric implement drive capability Agronomics: – – Industry-first 4-track for rigid-frame, row-crop tractor Preserves soil health
 Automation to Autonomy TODAY’S TECH JOB EXECUTION TOMORROW’S TECH FORWARD PERCEPTION
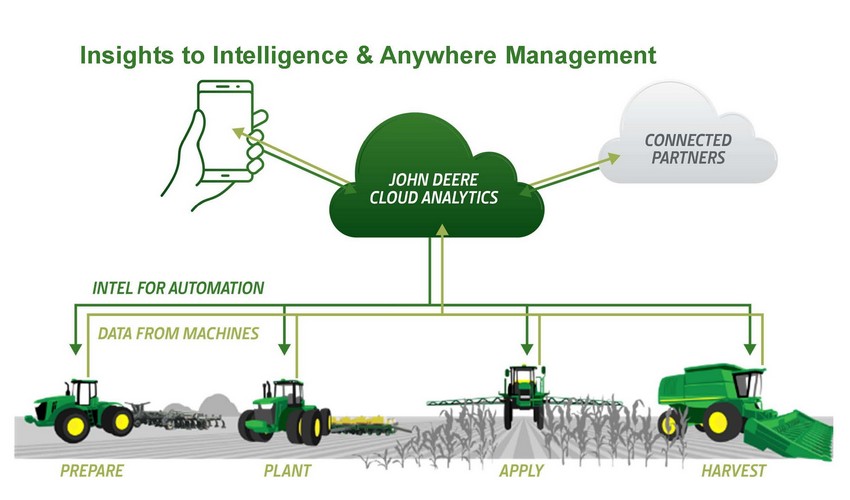 Insights to Intelligence & Anywhere Management
 Plant-level Management Plant-level Management: – Machines optimize conditions for individual plant FIELD PLANT LEVEL ZONE Competencies Required: ROW – – – Machine learning Computer Vision Robotics See & Spray: – See & Spray is first application of plant-level management Leverages existing suite of proprietary and foundational Deere technologies See and Spray just the beginning for use of machine learning in ag equipment – –
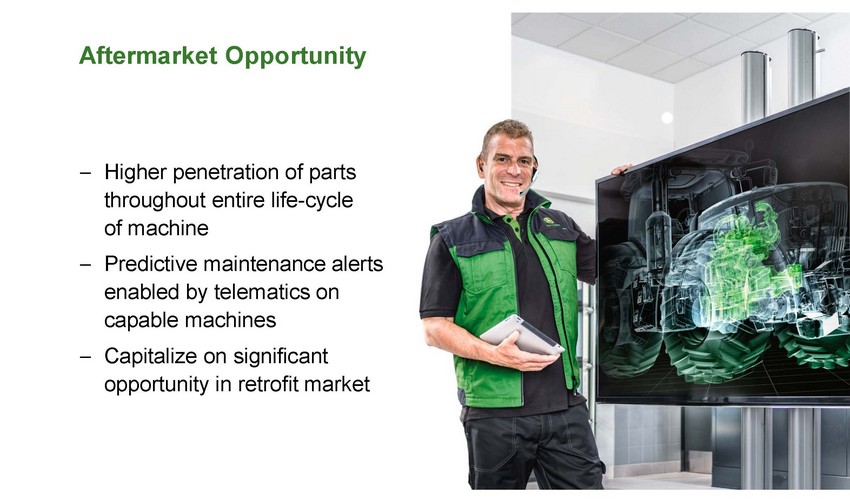 Aftermarket Opportunity – Higher penetration of parts throughout entire life-cycle of machine Predictive maintenance alerts enabled by telematics on capable machines Capitalize on significant opportunity in retrofit market – –
 Repositioning Organization to Capture Opportunity Ahead Industry is changing… AUTOMATED. EASY TO USE. MORE PRECISE. BIGGER. FASTER. STRONGER. Deere is aligning organization to meet the challenge AUTONOMY | EMPOWERMENT | ACCOUNTABILITY
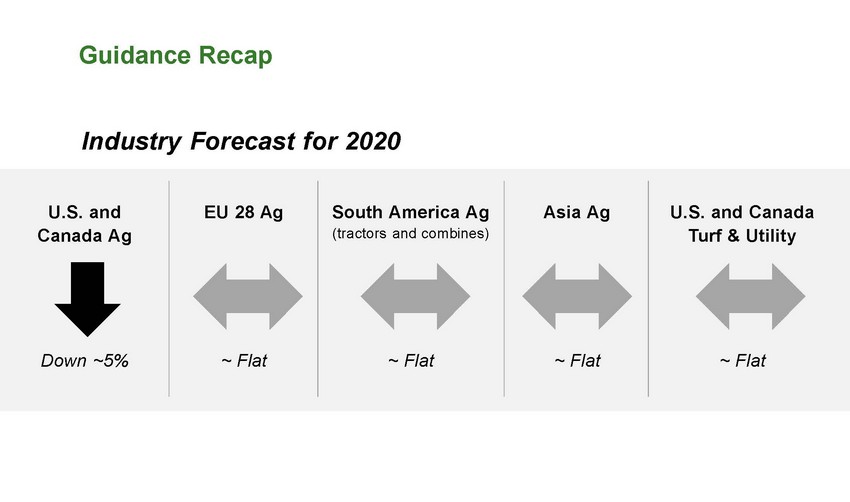 Guidance Recap Industry Forecast for 2020 U.S. and Canada Ag EU 28 Ag South America Ag (tractors and combines) Asia Ag U.S. and Canada Turf & Utility Down ~5% ~ Flat ~ Flat ~ Flat ~ Flat
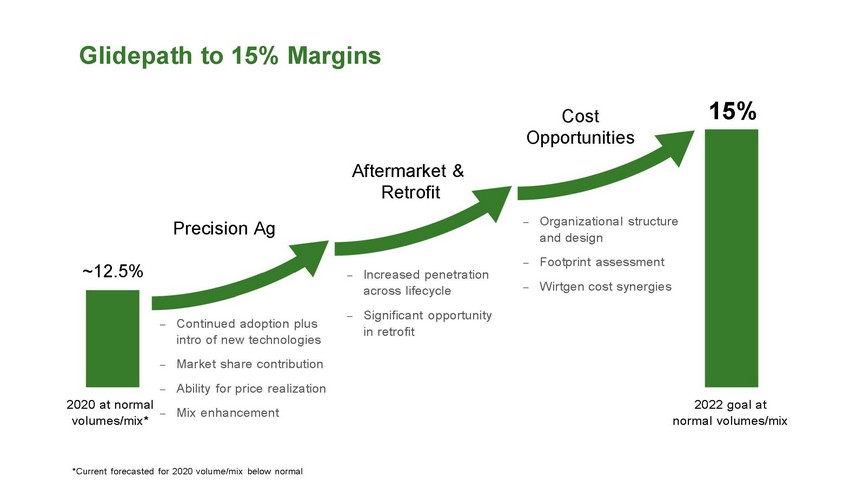 Glidepath to 15% Margins 15% Cost Opportunities Aftermarket Retrofit & Organizational structure and design Footprint assessment W irtgen cost synergies – Precision Ag – ~12.5% Increased penetration across lifecycle Significant opportunity in retrofit – – – – Continued adoption plus intro of new technologies – Market share contribution – Ability for price realization – Mix enhancement 2020 at normal volumes/mix* 2022 goal at normal volumes/mix *Current forecasted for 2020 volume/mix below normal
 Operational Outcomes Priorities Operational Outcomes – – Greater emphasis on differentiation Operations more responsive to changing market conditions More efficient structure to serve global markets Focused R&D and investments Agile organization with optimized footprint –
 Uniquely Positioned to Deliver Sustainable Outcomes
 ARE YOU READY FOR.•.
 JOHN DEERE