Attached files
| file | filename |
|---|---|
| 8-K - 8-K - TRUIST FINANCIAL CORP | tfc-20191223.htm |
EX99.1
Supplemental Historical Financial Information
Effective December 6, 2019, Truist Financial Corporation ("Truist," previously, BB&T Corporation, "BB&T") completed its previously announced merger of equals with SunTrust Banks, Inc. ("SunTrust") pursuant to an Agreement and Plan of Merger dated as of February 7, 2019 and amended as of June 14, 2019. At the closing, SunTrust merged with and into BB&T, with BB&T surviving the merger as the surviving corporation. Also in connection with the closing, BB&T changed its name from BB&T Corporation to Truist.
Effective December 31, 2019, Truist intends to make certain financial reporting changes and reclassifications with respect to the presentation of its financial statements on a prospective basis, which changes and reclassifications relate to the completion of the merger of BB&T and SunTrust.
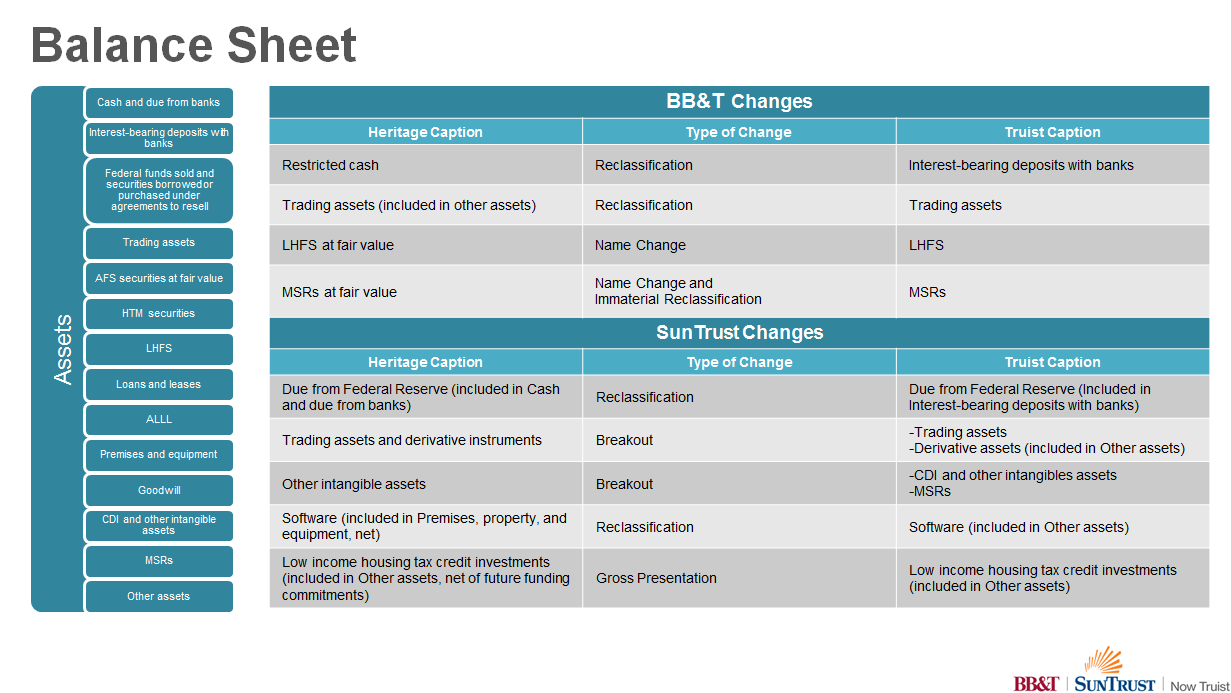
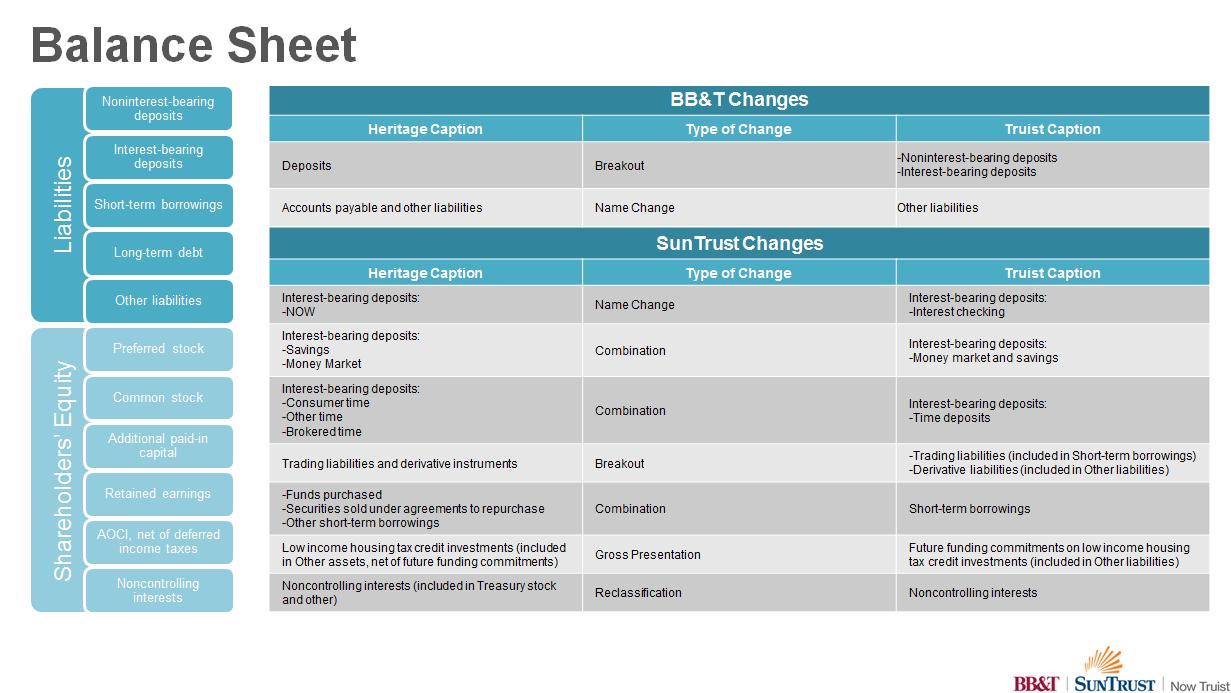
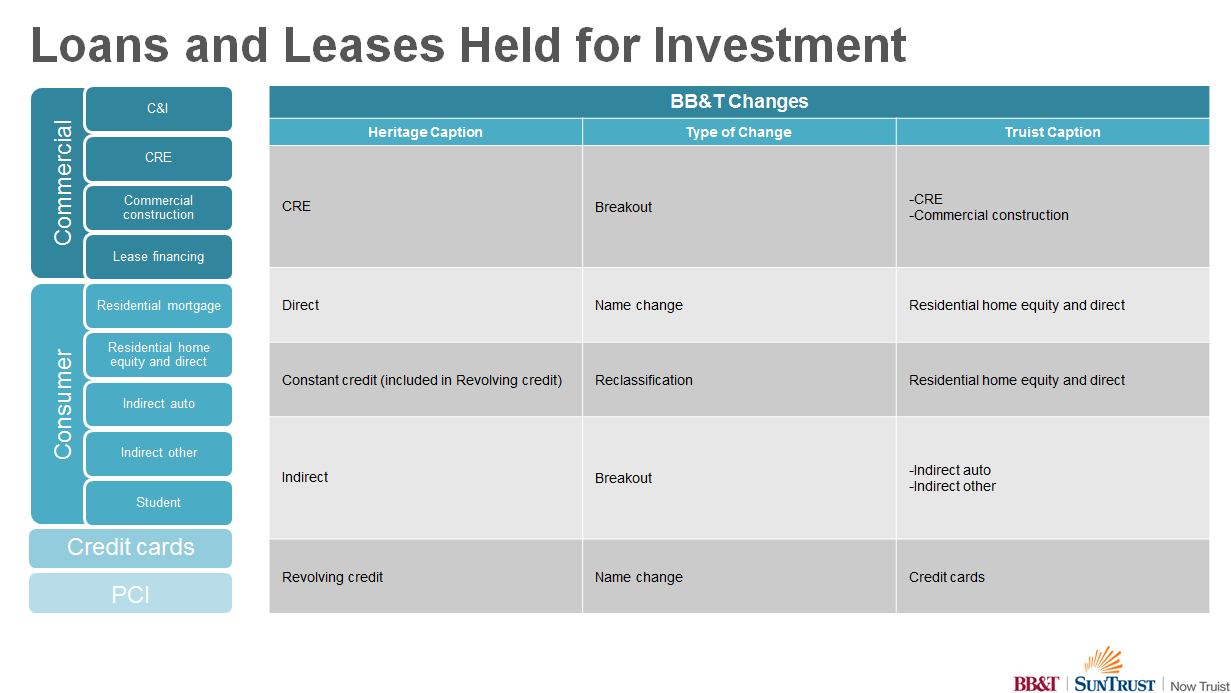
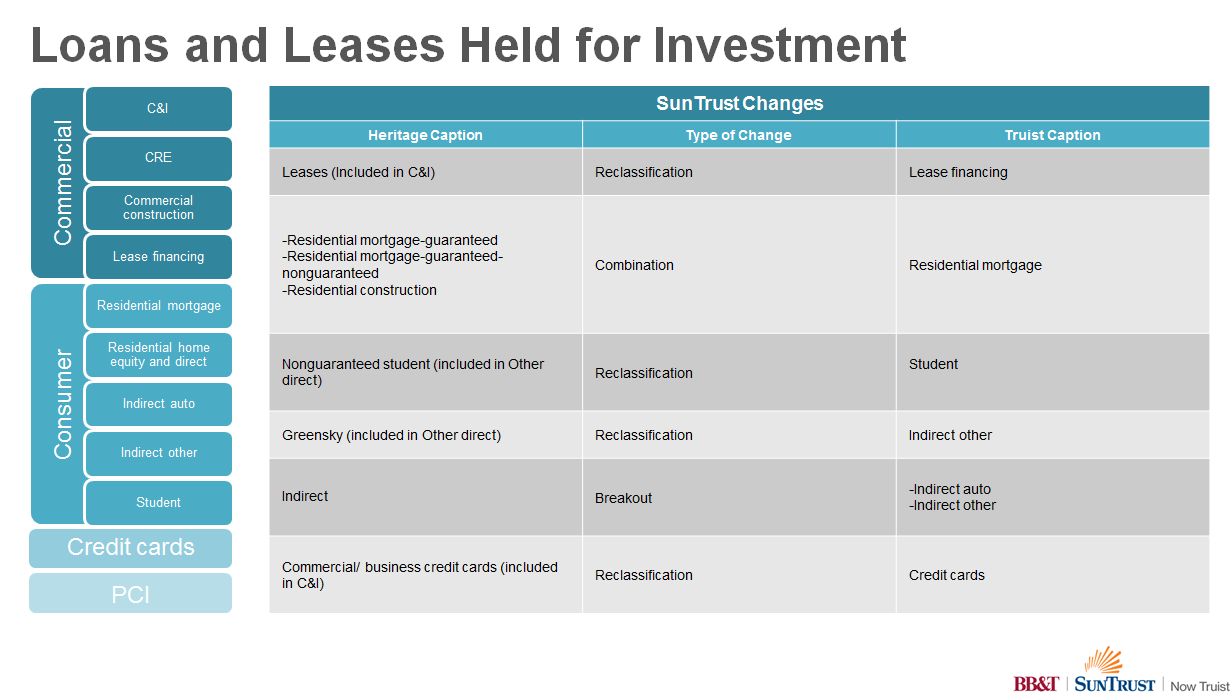
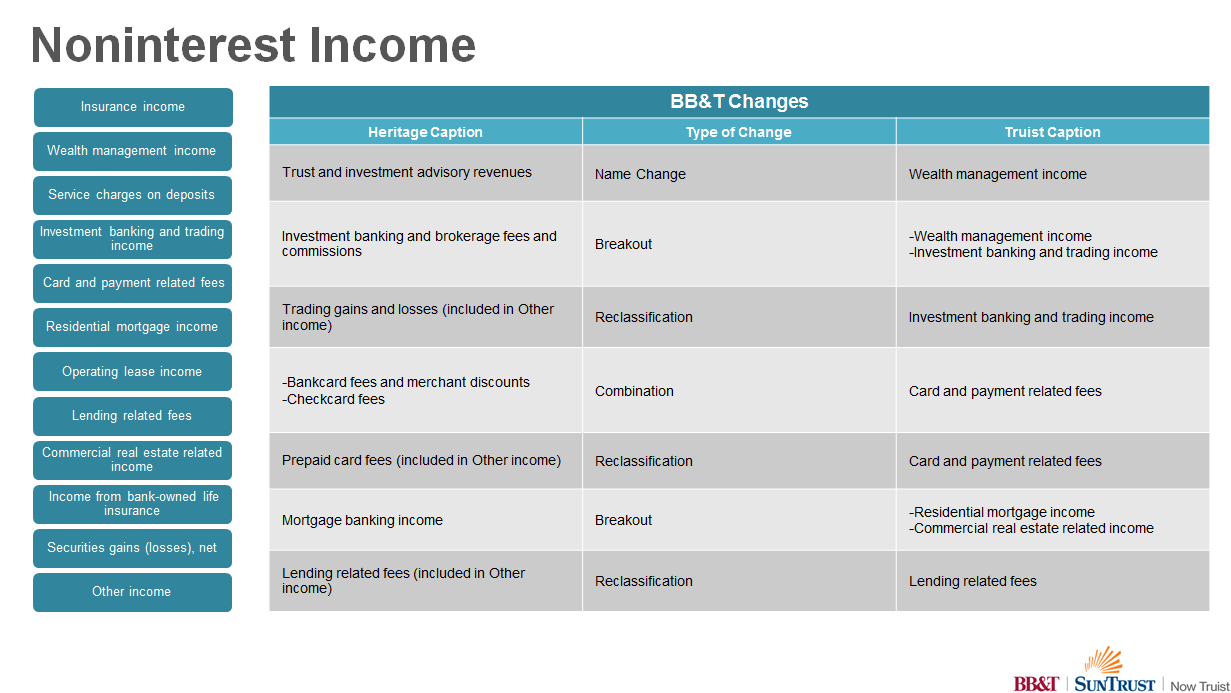
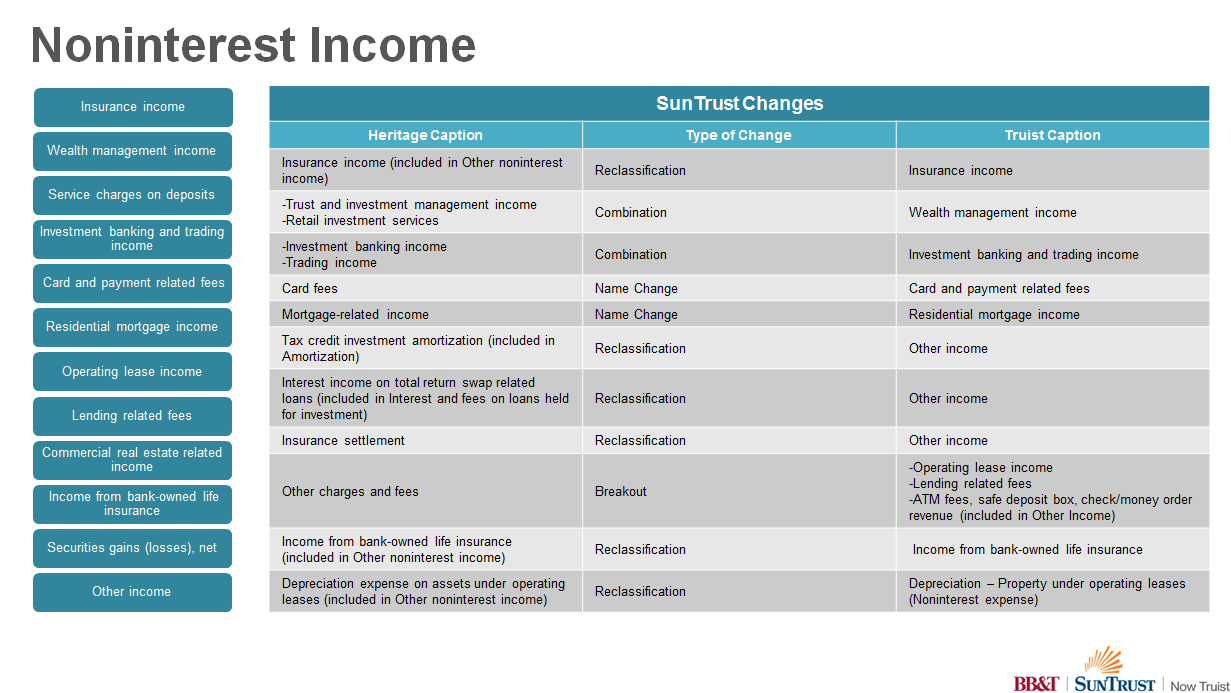
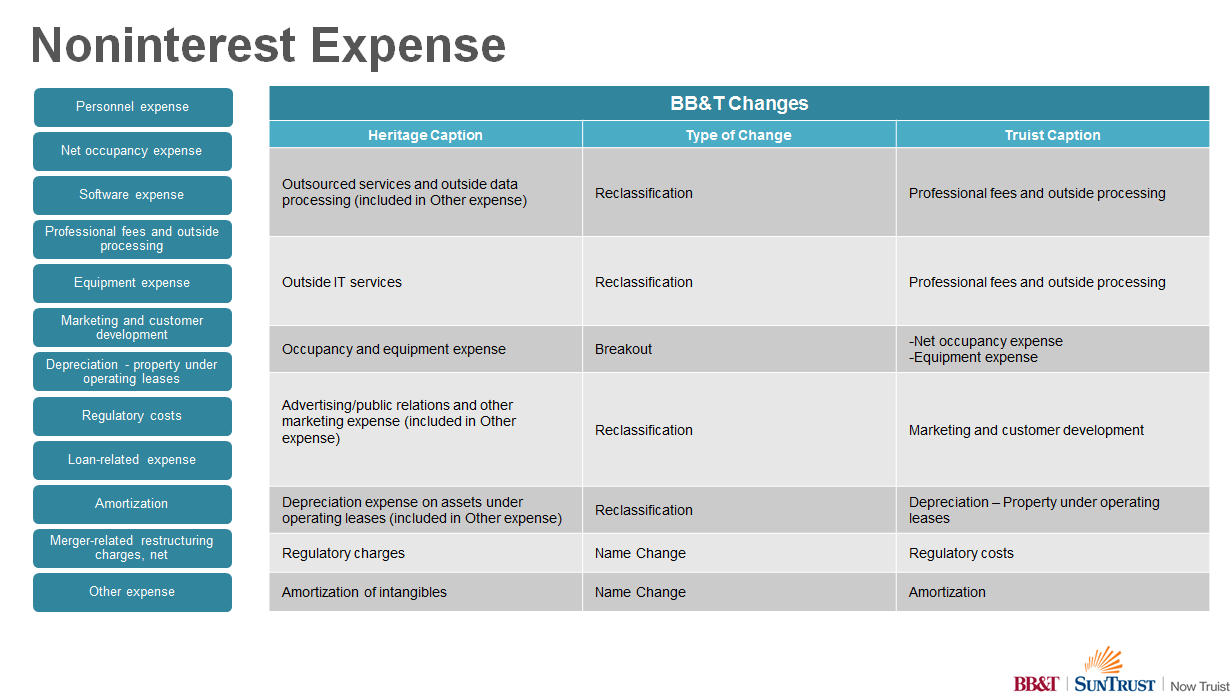
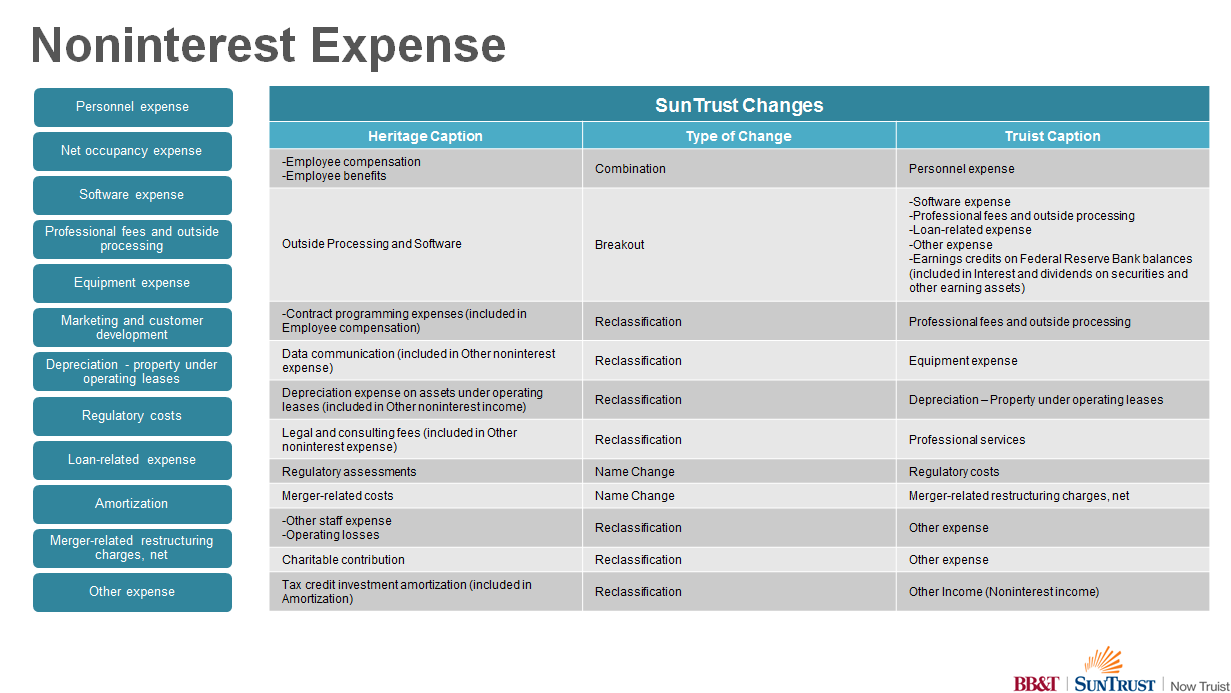
Truist is providing this supplemental historical financial information which conforms the historical financial statement presentation of SunTrust and BB&T for the periods presented to the new financial statement presentation anticipated to be effective December 31, 2019. A mapping of the changes to financial presentation are included in Appendix 1. This information is presented on a combined basis with BB&T and SunTrust financial information included in Appendix 2. The supplemental historical financial information does not revise or restate the previously reported consolidated financial statements of BB&T and SunTrust for any period.
The unaudited combined financial information contained herein does not reflect:
•future costs of any integration activities or benefits that may result from the realization of cost savings from operating efficiencies, or any other synergies that may result from the merger;
•application of the acquisition method of accounting under the provisions of the Financial Accounting Standards Board (FASB) Accounting Standards Codification, which we refer to as ASC 805, "Business Combinations," to reflect estimated merger consideration in exchange for 100% of all outstanding shares of SunTrust common stock; and
•the divestiture of 30 SunTrust branches, including related assets and liabilities, to be acquired by First Horizon Bank, a wholly owned subsidiary of First Horizon National Corporation, to satisfy regulatory requirements in connection with the merger.
This information is being provided for illustrative purposes only to indicate the manner in which Truist intends to present financial information and does not purport to represent what the combined company's actual results of operations or financial position would have been had the merger been completed at an earlier date, nor is it necessarily indicative of the combined company's future results of operations or financial position for any future period. This information is not intended to comply with Regulation S-X Article 11 or U.S. generally accepted accounting principles. Management believes this combined financial information will be useful to the investment community in understanding how to analyze the combined Truist's financial results for future periods.
This information is preliminary and based on data available at the time of the Form 8-K filing to which this information is included as a exhibit. The combined company is continuing to finalize its review of accounting policies and financial information. As a result of that review, additional differences could be identified between the financial presentation of the two companies. As a result of the foregoing, the adjustments reflected in this information are preliminary, and are subject to change as additional information becomes available and as additional analysis is performed. These preliminary adjustments have been made solely for the purpose of providing the illustrative unaudited combined financial information included herein.
Truist is under no obligation to, and disclaims any duty to, update the selected financial information included herein.
1
| Historical Unaudited Combined Ending Balance Sheets | |||||||||||||||||||||||||||||
| BB&T Corporation and SunTrust Banks, Inc. | |||||||||||||||||||||||||||||
| Sept. 30 | June 30 | March 31 | Dec. 31 | Sept. 30 | |||||||||||||||||||||||||
| (Dollars in millions) | 2019 | 2019 | 2019 | 2018 | 2018 | ||||||||||||||||||||||||
| Assets | |||||||||||||||||||||||||||||
| Cash and due from banks | $ | 3,842 | $ | 3,434 | $ | 3,614 | $ | 5,296 | $ | 4,139 | |||||||||||||||||||
| Interest-bearing deposits with banks | 6,932 | 2,896 | 3,652 | 4,364 | 5,110 | ||||||||||||||||||||||||
| Federal funds sold and securities borrowed or purchased under agreements to resell | 1,428 | 1,399 | 1,638 | 1,822 | 1,509 | ||||||||||||||||||||||||
| Trading assets | 5,734 | 6,582 | 6,755 | 5,258 | 5,723 | ||||||||||||||||||||||||
| Securities available for sale at fair value | 67,355 | 58,289 | 58,168 | 56,480 | 55,270 | ||||||||||||||||||||||||
| Securities held to maturity at amortized cost | 18,768 | 19,487 | 20,095 | 20,552 | 21,082 | ||||||||||||||||||||||||
| Loans and leases: | |||||||||||||||||||||||||||||
| Commercial: | |||||||||||||||||||||||||||||
| Commercial and industrial | 132,876 | 131,731 | 130,368 | 128,281 | 123,324 | ||||||||||||||||||||||||
| CRE | 26,584 | 25,631 | 24,607 | 24,073 | 23,591 | ||||||||||||||||||||||||
| Commercial construction | 5,933 | 6,111 | 6,673 | 6,790 | 7,630 | ||||||||||||||||||||||||
| Lease financing | 6,395 | 6,362 | 6,228 | 6,082 | 5,862 | ||||||||||||||||||||||||
| Consumer: | |||||||||||||||||||||||||||||
| Residential mortgage | 57,708 | 61,996 | 60,667 | 60,872 | 59,657 | ||||||||||||||||||||||||
| Residential home equity and direct | 28,930 | 28,766 | 28,443 | 28,519 | 28,338 | ||||||||||||||||||||||||
| Indirect auto | 24,116 | 23,647 | 23,147 | 22,192 | 21,811 | ||||||||||||||||||||||||
| Indirect other | 11,463 | 11,017 | 10,246 | 10,209 | 10,116 | ||||||||||||||||||||||||
| Student | 7,931 | 7,973 | 8,105 | 8,011 | 7,829 | ||||||||||||||||||||||||
| Credit card | 5,545 | 5,520 | 5,365 | 5,357 | 5,250 | ||||||||||||||||||||||||
| PCI | 387 | 421 | 441 | 466 | 497 | ||||||||||||||||||||||||
| Total loans and leases held for investment | 307,868 | 309,175 | 304,290 | 300,852 | 293,905 | ||||||||||||||||||||||||
| Loans held for sale (1) | 3,448 | 3,466 | 2,615 | 2,456 | 2,983 | ||||||||||||||||||||||||
| Total loans and leases | 311,316 | 312,641 | 306,905 | 303,308 | 296,888 | ||||||||||||||||||||||||
| Allowance for loan and lease losses | (3,272) | (3,276) | (3,204) | (3,173) | (3,161) | ||||||||||||||||||||||||
| Premises and equipment | 3,575 | 3,529 | 3,629 | 3,748 | 3,275 | ||||||||||||||||||||||||
| Goodwill | 16,163 | 16,161 | 16,149 | 16,149 | 16,163 | ||||||||||||||||||||||||
| Core deposit and other intangible assets | 690 | 725 | 739 | 771 | 803 | ||||||||||||||||||||||||
| Mortgage servicing rights (1) | 2,565 | 2,765 | 2,998 | 3,171 | 3,318 | ||||||||||||||||||||||||
| Other assets | 29,615 | 29,196 | 27,647 | 24,133 | 24,785 | ||||||||||||||||||||||||
| Total assets | $ | 464,711 | $ | 453,828 | $ | 448,785 | $ | 441,879 | $ | 434,904 | |||||||||||||||||||
| Liabilities | |||||||||||||||||||||||||||||
| Deposits: | |||||||||||||||||||||||||||||
| Noninterest-bearing deposits | $ | 93,027 | $ | 92,404 | $ | 93,464 | $ | 93,795 | $ | 95,611 | |||||||||||||||||||
| Interest-bearing deposits | 236,924 | 228,345 | 228,552 | 229,993 | 219,418 | ||||||||||||||||||||||||
| Total deposits | 329,951 | 320,749 | 322,016 | 323,788 | 315,029 | ||||||||||||||||||||||||
| Short-term borrowings | 18,655 | 20,956 | 18,040 | 15,144 | 18,758 | ||||||||||||||||||||||||
| Long-term debt | 45,889 | 42,840 | 42,124 | 38,781 | 37,525 | ||||||||||||||||||||||||
| Other liabilities | 11,424 | 11,657 | 10,899 | 9,708 | 9,446 | ||||||||||||||||||||||||
| Total liabilities | 405,919 | 396,202 | 393,079 | 387,421 | 380,758 | ||||||||||||||||||||||||
| Shareholders' Equity | |||||||||||||||||||||||||||||
| Shareholders' equity, excluding noncontrolling interests | 58,622 | 57,462 | 55,545 | 54,299 | 53,986 | ||||||||||||||||||||||||
| Noncontrolling interests | 170 | 164 | 161 | 159 | 160 | ||||||||||||||||||||||||
| Total shareholders' equity | 58,792 | 57,626 | 55,706 | 54,458 | 54,146 | ||||||||||||||||||||||||
| Total liabilities and shareholders' equity | $ | 464,711 | $ | 453,828 | $ | 448,785 | $ | 441,879 | $ | 434,904 | |||||||||||||||||||
| (1) Includes amounts at cost and fair value. | |||||||||||||||||||||||||||||
2
| Historical Unaudited Combined Statements of Income | |||||||||||||||||||||||||||||
| BB&T Corporation and SunTrust Banks, Inc. | |||||||||||||||||||||||||||||
| Quarter Ended | |||||||||||||||||||||||||||||
| Sept. 30 | June 30 | March 31 | Dec. 31 | Sept. 30 | |||||||||||||||||||||||||
| (Dollars in millions) | 2019 | 2019 | 2019 | 2018 | 2018 | ||||||||||||||||||||||||
| Interest Income | |||||||||||||||||||||||||||||
| Interest and fees on loans and leases | $ | 3,600 | $ | 3,607 | $ | 3,536 | $ | 3,486 | $ | 3,333 | |||||||||||||||||||
| Interest and dividends on securities | 530 | 523 | 523 | 513 | 495 | ||||||||||||||||||||||||
| Interest on other earning assets | 98 | 96 | 104 | 86 | 79 | ||||||||||||||||||||||||
| Total interest income | 4,228 | 4,226 | 4,163 | 4,085 | 3,907 | ||||||||||||||||||||||||
| Interest Expense | |||||||||||||||||||||||||||||
| Interest on deposits | 564 | 542 | 502 | 434 | 365 | ||||||||||||||||||||||||
| Interest on long-term debt | 343 | 343 | 317 | 309 | 276 | ||||||||||||||||||||||||
| Interest on other borrowings | 106 | 117 | 101 | 85 | 63 | ||||||||||||||||||||||||
| Total interest expense | 1,013 | 1,002 | 920 | 828 | 704 | ||||||||||||||||||||||||
| Net Interest Income | 3,215 | 3,224 | 3,243 | 3,257 | 3,203 | ||||||||||||||||||||||||
| Provision for credit losses | 249 | 299 | 308 | 233 | 196 | ||||||||||||||||||||||||
| Net Interest Income After Provision for Credit Losses | 2,966 | 2,925 | 2,935 | 3,024 | 3,007 | ||||||||||||||||||||||||
| Noninterest Income | |||||||||||||||||||||||||||||
| Insurance income | 489 | 568 | 512 | 490 | 450 | ||||||||||||||||||||||||
| Wealth management income | 336 | 327 | 308 | 323 | 326 | ||||||||||||||||||||||||
| Service charges on deposits | 329 | 320 | 308 | 331 | 327 | ||||||||||||||||||||||||
| Investment banking and trading income | 241 | 238 | 211 | 217 | 221 | ||||||||||||||||||||||||
| Card and payment related fees | 215 | 221 | 210 | 218 | 207 | ||||||||||||||||||||||||
| Residential mortgage income | 186 | 177 | 149 | 143 | 139 | ||||||||||||||||||||||||
| Operating lease income | 80 | 80 | 81 | 84 | 83 | ||||||||||||||||||||||||
| Lending related fees | 74 | 76 | 72 | 68 | 77 | ||||||||||||||||||||||||
| Commercial real estate related income | 64 | 72 | 38 | 96 | 47 | ||||||||||||||||||||||||
| Income from bank-owned life insurance | 43 | 47 | 43 | 42 | 39 | ||||||||||||||||||||||||
| Securities gains (losses), net | 4 | (42) | — | 2 | — | ||||||||||||||||||||||||
| Other income | 114 | 326 | 88 | 66 | 133 | ||||||||||||||||||||||||
| Total noninterest income | 2,175 | 2,410 | 2,020 | 2,080 | 2,049 | ||||||||||||||||||||||||
| Noninterest Expense | |||||||||||||||||||||||||||||
| Personnel expense | 1,928 | 1,894 | 1,872 | 1,868 | 1,816 | ||||||||||||||||||||||||
| Net occupancy expense | 224 | 218 | 224 | 222 | 209 | ||||||||||||||||||||||||
| Software expense | 230 | 217 | 220 | 210 | 204 | ||||||||||||||||||||||||
| Professional fees and outside processing | 246 | 201 | 187 | 262 | 237 | ||||||||||||||||||||||||
| Equipment expense | 109 | 112 | 118 | 119 | 117 | ||||||||||||||||||||||||
| Marketing and customer development | 84 | 78 | 71 | 77 | 78 | ||||||||||||||||||||||||
| Depreciation - property under operating leases | 70 | 64 | 65 | 67 | 67 | ||||||||||||||||||||||||
| Regulatory costs | 37 | 36 | 37 | 25 | 76 | ||||||||||||||||||||||||
| Loan-related expense | 48 | 54 | 48 | 52 | 52 | ||||||||||||||||||||||||
| Amortization | 29 | 32 | 32 | 34 | 33 | ||||||||||||||||||||||||
| Merger-related restructuring and charges, net | 56 | 31 | 125 | 76 | 18 | ||||||||||||||||||||||||
| Other expense | 287 | 484 | 295 | 286 | 251 | ||||||||||||||||||||||||
| Total noninterest expense | 3,348 | 3,421 | 3,294 | 3,298 | 3,158 | ||||||||||||||||||||||||
| Earnings | |||||||||||||||||||||||||||||
| Income before income taxes | 1,793 | 1,914 | 1,661 | 1,806 | 1,898 | ||||||||||||||||||||||||
| Provision for income taxes | 340 | 339 | 281 | 341 | 305 | ||||||||||||||||||||||||
| Net income | 1,453 | 1,575 | 1,380 | 1,465 | 1,593 | ||||||||||||||||||||||||
| Noncontrolling interests | 5 | 1 | 8 | 9 | 9 | ||||||||||||||||||||||||
| Preferred stock dividends | 116 | 69 | 69 | 70 | 69 | ||||||||||||||||||||||||
| Net income available to common shareholders | $ | 1,332 | $ | 1,505 | $ | 1,303 | $ | 1,386 | $ | 1,515 | |||||||||||||||||||
3
Appendix 1: Financial Statement Caption Mapping
4
Appendix 1: Financial Statement Caption Mapping
5
Appendix 1: Financial Statement Caption Mapping
6
Appendix 1: Financial Statement Caption Mapping
7
Appendix 1: Financial Statement Caption Mapping
8
Appendix 1: Financial Statement Caption Mapping
9
Appendix 1: Financial Statement Caption Mapping
10
Appendix 1: Financial Statement Caption Mapping
11
Appendix 2: Heritage Company Historical Detail
| Historical Unaudited Ending Balance Sheets | |||||||||||||||||||||||||||||||||||||||||||||||||||||||||||
| September 30, 2019 | June 30, 2019 | March 31, 2019 | December 31, 2018 | September 30, 2018 | |||||||||||||||||||||||||||||||||||||||||||||||||||||||
| (Dollars in millions) | BB&T | SunTrust | Combined | BB&T | SunTrust | Combined | BB&T | SunTrust | Combined | BB&T | SunTrust | Combined | BB&T | SunTrust | Combined | ||||||||||||||||||||||||||||||||||||||||||||
| Assets | |||||||||||||||||||||||||||||||||||||||||||||||||||||||||||
| Cash and due from banks | $ | 2,027 | $ | 1,815 | $ | 3,842 | $ | 1,831 | $ | 1,603 | $ | 3,434 | $ | 1,873 | $ | 1,741 | $ | 3,614 | $ | 2,753 | $ | 2,543 | $ | 5,296 | $ | 2,123 | $ | 2,016 | $ | 4,139 | |||||||||||||||||||||||||||||
| Interest-bearing deposits with banks | 877 | 6,055 | 6,932 | 722 | 2,174 | 2,896 | 847 | 2,805 | 3,652 | 1,091 | 3,273 | 4,364 | 895 | 4,215 | 5,110 | ||||||||||||||||||||||||||||||||||||||||||||
| Federal funds sold and securities borrowed or purchased under agreements to resell | 114 | 1,314 | 1,428 | 148 | 1,251 | 1,399 | 252 | 1,386 | 1,638 | 143 | 1,679 | 1,822 | 135 | 1,374 | 1,509 | ||||||||||||||||||||||||||||||||||||||||||||
| Trading assets | 400 | 5,334 | 5,734 | 1,429 | 5,153 | 6,582 | 1,524 | 5,231 | 6,755 | 391 | 4,867 | 5,258 | 669 | 5,054 | 5,723 | ||||||||||||||||||||||||||||||||||||||||||||
| Securities available for sale at fair value | 35,997 | 31,358 | 67,355 | 25,802 | 32,487 | 58,289 | 26,315 | 31,853 | 58,168 | 25,038 | 31,442 | 56,480 | 24,286 | 30,984 | 55,270 | ||||||||||||||||||||||||||||||||||||||||||||
| Securities held to maturity at amortized cost | 18,768 | — | 18,768 | 19,487 | — | 19,487 | 20,095 | — | 20,095 | 20,552 | — | 20,552 | 21,082 | — | 21,082 | ||||||||||||||||||||||||||||||||||||||||||||
| Loans and leases: | |||||||||||||||||||||||||||||||||||||||||||||||||||||||||||
| Commercial: | |||||||||||||||||||||||||||||||||||||||||||||||||||||||||||
| Commercial and industrial | 64,324 | 68,552 | 132,876 | 63,693 | 68,038 | 131,731 | 61,978 | 68,390 | 130,368 | 61,935 | 66,346 | 128,281 | 59,722 | 63,602 | 123,324 | ||||||||||||||||||||||||||||||||||||||||||||
| CRE | 17,093 | 9,491 | 26,584 | 16,976 | 8,655 | 25,631 | 16,718 | 7,889 | 24,607 | 16,808 | 7,265 | 24,073 | 16,973 | 6,618 | 23,591 | ||||||||||||||||||||||||||||||||||||||||||||
| Commercial construction | 3,791 | 2,142 | 5,933 | 3,746 | 2,365 | 6,111 | 4,111 | 2,562 | 6,673 | 4,252 | 2,538 | 6,790 | 4,493 | 3,137 | 7,630 | ||||||||||||||||||||||||||||||||||||||||||||
| Lease financing | 2,356 | 4,039 | 6,395 | 2,203 | 4,159 | 6,362 | 2,098 | 4,130 | 6,228 | 2,018 | 4,064 | 6,082 | 2,028 | 3,834 | 5,862 | ||||||||||||||||||||||||||||||||||||||||||||
| Consumer: | |||||||||||||||||||||||||||||||||||||||||||||||||||||||||||
| Residential mortgage | 28,297 | 29,411 | 57,708 | 32,607 | 29,389 | 61,996 | 31,572 | 29,095 | 60,667 | 31,393 | 29,479 | 60,872 | 30,821 | 28,836 | 59,657 | ||||||||||||||||||||||||||||||||||||||||||||
| Residential home equity and direct | 11,646 | 17,284 | 28,930 | 11,675 | 17,091 | 28,766 | 11,646 | 16,797 | 28,443 | 11,775 | 16,744 | 28,519 | 11,808 | 16,530 | 28,338 | ||||||||||||||||||||||||||||||||||||||||||||
| Indirect auto | 11,871 | 12,245 | 24,116 | 11,756 | 11,891 | 23,647 | 11,506 | 11,641 | 23,147 | 11,282 | 10,910 | 22,192 | 11,246 | 10,565 | 21,811 | ||||||||||||||||||||||||||||||||||||||||||||
| Indirect other | 6,590 | 4,873 | 11,463 | 6,453 | 4,564 | 11,017 | 6,017 | 4,229 | 10,246 | 6,143 | 4,066 | 10,209 | 6,222 | 3,894 | 10,116 | ||||||||||||||||||||||||||||||||||||||||||||
| Student | — | 7,931 | 7,931 | — | 7,973 | 7,973 | 8,105 | 8,105 | 8,011 | 8,011 | — | 7,829 | 7,829 | ||||||||||||||||||||||||||||||||||||||||||||||
| Credit card | 3,058 | 2,487 | 5,545 | 3,056 | 2,464 | 5,520 | 2,970 | 2,395 | 5,365 | 2,941 | 2,416 | 5,357 | 2,880 | 2,370 | 5,250 | ||||||||||||||||||||||||||||||||||||||||||||
| PCI | 387 | — | 387 | 421 | — | 421 | 441 | — | 441 | 466 | — | 466 | 497 | — | 497 | ||||||||||||||||||||||||||||||||||||||||||||
| Total loans and leases held for investment | 149,413 | 158,455 | 307,868 | 152,586 | 156,589 | 309,175 | 149,057 | 155,233 | 304,290 | 149,013 | 151,839 | 300,852 | 146,690 | 147,215 | 293,905 | ||||||||||||||||||||||||||||||||||||||||||||
| Loans held for sale (1) | 1,442 | 2,006 | 3,448 | 1,237 | 2,229 | 3,466 | 834 | 1,781 | 2,615 | 988 | 1,468 | 2,456 | 1,022 | 1,961 | 2,983 | ||||||||||||||||||||||||||||||||||||||||||||
| Total loans and leases | 150,855 | 160,461 | 311,316 | 153,823 | 158,818 | 312,641 | 149,891 | 157,014 | 306,905 | 150,001 | 153,307 | 303,308 | 147,712 | 149,176 | 296,888 | ||||||||||||||||||||||||||||||||||||||||||||
| Allowance for loan and lease losses | (1,573) | (1,699) | (3,272) | (1,595) | (1,681) | (3,276) | (1,561) | (1,643) | (3,204) | (1,558) | (1,615) | (3,173) | (1,538) | (1,623) | (3,161) | ||||||||||||||||||||||||||||||||||||||||||||
| Premises and equipment | 2,022 | 1,553 | 3,575 | 2,029 | 1,500 | 3,529 | 2,078 | 1,551 | 3,629 | 2,118 | 1,630 | 3,748 | 2,154 | 1,121 | 3,275 | ||||||||||||||||||||||||||||||||||||||||||||
| Goodwill | 9,832 | 6,331 | 16,163 | 9,830 | 6,331 | 16,161 | 9,818 | 6,331 | 16,149 | 9,818 | 6,331 | 16,149 | 9,832 | 6,331 | 16,163 | ||||||||||||||||||||||||||||||||||||||||||||
| Core deposit and other intangible assets | 678 | 12 | 690 | 712 | 13 | 725 | 726 | 13 | 739 | 758 | 13 | 771 | 789 | 14 | 803 | ||||||||||||||||||||||||||||||||||||||||||||
| Mortgage servicing rights (1) | 929 | 1,636 | 2,565 | 982 | 1,783 | 2,765 | 1,049 | 1,949 | 2,998 | 1,122 | 2,049 | 3,171 | 1,193 | 2,125 | 3,318 | ||||||||||||||||||||||||||||||||||||||||||||
| Other assets | 15,824 | 13,791 | 29,615 | 15,672 | 13,524 | 29,196 | 14,776 | 12,871 | 27,647 | 13,470 | 10,663 | 24,133 | 13,553 | 11,232 | 24,785 | ||||||||||||||||||||||||||||||||||||||||||||
| Total assets | $ | 236,750 | $ | 227,961 | $ | 464,711 | $ | 230,872 | $ | 222,956 | $ | 453,828 | $ | 227,683 | $ | 221,102 | $ | 448,785 | $ | 225,697 | $ | 216,182 | $ | 441,879 | $ | 222,885 | $ | 212,019 | $ | 434,904 | |||||||||||||||||||||||||||||
| Liabilities | |||||||||||||||||||||||||||||||||||||||||||||||||||||||||||
| Deposits: | |||||||||||||||||||||||||||||||||||||||||||||||||||||||||||
| Noninterest-bearing deposits | $ | 52,667 | $ | 40,360 | $ | 93,027 | $ | 52,458 | $ | 39,946 | $ | 92,404 | $ | 53,021 | $ | 40,443 | $ | 93,464 | $ | 53,025 | $ | 40,770 | $ | 93,795 | $ | 53,646 | $ | 41,965 | $ | 95,611 | |||||||||||||||||||||||||||||
| Interest-bearing deposits | 109,613 | 127,311 | 236,924 | 107,063 | 121,282 | 228,345 | 106,745 | 121,807 | 228,552 | 108,174 | 121,819 | 229,993 | 100,910 | 118,508 | 219,418 | ||||||||||||||||||||||||||||||||||||||||||||
| Total deposits | 162,280 | 167,671 | 329,951 | 159,521 | 161,228 | 320,749 | 159,766 | 162,250 | 322,016 | 161,199 | 162,589 | 323,788 | 154,556 | 160,473 | 315,029 | ||||||||||||||||||||||||||||||||||||||||||||
| Short-term borrowings | 10,405 | 8,250 | 18,655 | 10,344 | 10,612 | 20,956 | 6,305 | 11,735 | 18,040 | 5,178 | 9,966 | 15,144 | 9,652 | 9,106 | 18,758 | ||||||||||||||||||||||||||||||||||||||||||||
| Long-term debt | 25,520 | 20,369 | 45,889 | 22,640 | 20,200 | 42,840 | 24,729 | 17,395 | 42,124 | 23,709 | 15,072 | 38,781 | 23,236 | 14,289 | 37,525 | ||||||||||||||||||||||||||||||||||||||||||||
| Other liabilities | 6,242 | 5,182 | 11,424 | 6,603 | 5,054 | 11,657 | 6,000 | 4,899 | 10,899 | 5,433 | 4,275 | 9,708 | 5,434 | 4,012 | 9,446 | ||||||||||||||||||||||||||||||||||||||||||||
| Total liabilities | 204,447 | 201,472 | 405,919 | 199,108 | 197,094 | 396,202 | 196,800 | 196,279 | 393,079 | 195,519 | 191,902 | 387,421 | 192,878 | 187,880 | 380,758 | ||||||||||||||||||||||||||||||||||||||||||||
| Shareholders' Equity | |||||||||||||||||||||||||||||||||||||||||||||||||||||||||||
| Shareholders' equity, excluding noncontrolling interests | 32,234 | 26,388 | 58,622 | 31,703 | 25,759 | 57,462 | 30,823 | 24,722 | 55,545 | 30,122 | 24,177 | 54,299 | 29,948 | 24,038 | 53,986 | ||||||||||||||||||||||||||||||||||||||||||||
| Noncontrolling interests | 69 | 101 | 170 | 61 | 103 | 164 | 60 | 101 | 161 | 56 | 103 | 159 | 59 | 101 | 160 | ||||||||||||||||||||||||||||||||||||||||||||
| Total shareholders' equity | 32,303 | 26,489 | 58,792 | 31,764 | 25,862 | 57,626 | 30,883 | 24,823 | 55,706 | 30,178 | 24,280 | 54,458 | 30,007 | 24,139 | 54,146 | ||||||||||||||||||||||||||||||||||||||||||||
| Total liabilities and shareholders' equity | $ | 236,750 | $ | 227,961 | $ | 464,711 | $ | 230,872 | $ | 222,956 | $ | 453,828 | $ | 227,683 | $ | 221,102 | $ | 448,785 | $ | 225,697 | $ | 216,182 | $ | 441,879 | $ | 222,885 | $ | 212,019 | $ | 434,904 | |||||||||||||||||||||||||||||
| (1) Includes amounts at cost and fair value. | |||||||||||||||||||||||||||||||||||||||||||||||||||||||||||
12
Appendix 2: Heritage Company Historical Detail
| Historical Unaudited Income Statements | |||||||||||||||||||||||||||||||||||||||||||||||||||||||||||
| September 30, 2019 | June 30, 2019 | March 31, 2019 | December 31, 2018 | September 30, 2018 | |||||||||||||||||||||||||||||||||||||||||||||||||||||||
| (Dollars in millions) | BB&T | SunTrust | Combined | BB&T | SunTrust | Combined | BB&T | SunTrust | Combined | BB&T | SunTrust | Combined | BB&T | SunTrust | Combined | ||||||||||||||||||||||||||||||||||||||||||||
| Interest Income | |||||||||||||||||||||||||||||||||||||||||||||||||||||||||||
| Interest and fees on loans and leases | $ | 1,886 | $ | 1,714 | $ | 3,600 | $ | 1,886 | $ | 1,721 | $ | 3,607 | $ | 1,839 | $ | 1,697 | $ | 3,536 | $ | 1,830 | $ | 1,656 | $ | 3,486 | $ | 1,772 | $ | 1,561 | $ | 3,333 | |||||||||||||||||||||||||||||
| Interest and dividends on securities | 315 | 215 | 530 | 300 | 223 | 523 | 302 | 221 | 523 | 292 | 221 | 513 | 283 | 212 | 495 | ||||||||||||||||||||||||||||||||||||||||||||
| Interest on other earning assets | 17 | 81 | 98 | 20 | 76 | 96 | 32 | 72 | 104 | 14 | 72 | 86 | 14 | 65 | 79 | ||||||||||||||||||||||||||||||||||||||||||||
| Total interest income | 2,218 | 2,010 | 4,228 | 2,206 | 2,020 | 4,226 | 2,173 | 1,990 | 4,163 | 2,136 | 1,949 | 4,085 | 2,069 | 1,838 | 3,907 | ||||||||||||||||||||||||||||||||||||||||||||
| Interest Expense | |||||||||||||||||||||||||||||||||||||||||||||||||||||||||||
| Interest on deposits | 271 | 293 | 564 | 273 | 269 | 542 | 253 | 249 | 502 | 206 | 228 | 434 | 172 | 193 | 365 | ||||||||||||||||||||||||||||||||||||||||||||
| Interest on long-term debt | 193 | 150 | 343 | 193 | 150 | 343 | 192 | 125 | 317 | 186 | 123 | 309 | 181 | 95 | 276 | ||||||||||||||||||||||||||||||||||||||||||||
| Interest on other borrowings | 54 | 52 | 106 | 50 | 67 | 117 | 32 | 69 | 101 | 39 | 46 | 85 | 29 | 34 | 63 | ||||||||||||||||||||||||||||||||||||||||||||
| Total interest expense | 518 | 495 | 1,013 | 516 | 486 | 1,002 | 477 | 443 | 920 | 431 | 397 | 828 | 382 | 322 | 704 | ||||||||||||||||||||||||||||||||||||||||||||
| Net Interest Income | 1,700 | 1,515 | 3,215 | 1,690 | 1,534 | 3,224 | 1,696 | 1,547 | 3,243 | 1,705 | 1,552 | 3,257 | 1,687 | 1,516 | 3,203 | ||||||||||||||||||||||||||||||||||||||||||||
| Provision for credit losses | 117 | 132 | 249 | 172 | 127 | 299 | 155 | 153 | 308 | 146 | 87 | 233 | 135 | 61 | 196 | ||||||||||||||||||||||||||||||||||||||||||||
| Net Interest Income After Provision for Credit Losses | 1,583 | 1,383 | 2,966 | 1,518 | 1,407 | 2,925 | 1,541 | 1,394 | 2,935 | 1,559 | 1,465 | 3,024 | 1,552 | 1,455 | 3,007 | ||||||||||||||||||||||||||||||||||||||||||||
| Noninterest Income | |||||||||||||||||||||||||||||||||||||||||||||||||||||||||||
| Insurance income | 487 | 2 | 489 | 566 | 2 | 568 | 510 | 2 | 512 | 487 | 3 | 490 | 448 | 2 | 450 | ||||||||||||||||||||||||||||||||||||||||||||
| Wealth management income | 182 | 154 | 336 | 179 | 148 | 327 | 168 | 140 | 308 | 175 | 148 | 323 | 172 | 154 | 326 | ||||||||||||||||||||||||||||||||||||||||||||
| Service charges on deposits | 188 | 141 | 329 | 181 | 139 | 320 | 171 | 137 | 308 | 185 | 146 | 331 | 183 | 144 | 327 | ||||||||||||||||||||||||||||||||||||||||||||
| Investment banking and trading income | 53 | 188 | 241 | 41 | 197 | 238 | 21 | 190 | 211 | 47 | 170 | 217 | 29 | 192 | 221 | ||||||||||||||||||||||||||||||||||||||||||||
| Card and payment related fees | 132 | 83 | 215 | 139 | 82 | 221 | 128 | 82 | 210 | 135 | 83 | 218 | 132 | 75 | 207 | ||||||||||||||||||||||||||||||||||||||||||||
| Residential mortgage income | 80 | 106 | 186 | 91 | 86 | 177 | 49 | 100 | 149 | 58 | 85 | 143 | 56 | 83 | 139 | ||||||||||||||||||||||||||||||||||||||||||||
| Operating lease income | 36 | 44 | 80 | 35 | 45 | 80 | 35 | 46 | 81 | 35 | 49 | 84 | 37 | 46 | 83 | ||||||||||||||||||||||||||||||||||||||||||||
| Lending related fees | 24 | 50 | 74 | 28 | 48 | 76 | 25 | 47 | 72 | 19 | 49 | 68 | 28 | 49 | 77 | ||||||||||||||||||||||||||||||||||||||||||||
| Commercial real estate related income | 32 | 32 | 64 | 22 | 50 | 72 | 14 | 24 | 38 | 28 | 68 | 96 | 23 | 24 | 47 | ||||||||||||||||||||||||||||||||||||||||||||
| Income from bank-owned life insurance | 29 | 14 | 43 | 34 | 13 | 47 | 28 | 15 | 43 | 28 | 14 | 42 | 27 | 12 | 39 | ||||||||||||||||||||||||||||||||||||||||||||
| Securities gains (losses), net | — | 4 | 4 | — | (42) | (42) | — | — | — | 2 | — | 2 | — | — | — | ||||||||||||||||||||||||||||||||||||||||||||
| Other income | 60 | 54 | 114 | 36 | 290 | 326 | 53 | 35 | 88 | 36 | 30 | 66 | 104 | 29 | 133 | ||||||||||||||||||||||||||||||||||||||||||||
| Total noninterest income | 1,303 | 872 | 2,175 | 1,352 | 1,058 | 2,410 | 1,202 | 818 | 2,020 | 1,235 | 845 | 2,080 | 1,239 | 810 | 2,049 | ||||||||||||||||||||||||||||||||||||||||||||
| Noninterest Expense | |||||||||||||||||||||||||||||||||||||||||||||||||||||||||||
| Personnel expense | 1,161 | 767 | 1,928 | 1,120 | 774 | 1,894 | 1,087 | 785 | 1,872 | 1,096 | 772 | 1,868 | 1,104 | 712 | 1,816 | ||||||||||||||||||||||||||||||||||||||||||||
| Net occupancy expense | 122 | 102 | 224 | 116 | 102 | 218 | 122 | 102 | 224 | 120 | 102 | 222 | 123 | 86 | 209 | ||||||||||||||||||||||||||||||||||||||||||||
| Software expense | 77 | 153 | 230 | 71 | 146 | 217 | 72 | 148 | 220 | 70 | 140 | 210 | 70 | 134 | 204 | ||||||||||||||||||||||||||||||||||||||||||||
| Professional fees and outside processing | 102 | 144 | 246 | 84 | 117 | 201 | 86 | 101 | 187 | 103 | 159 | 262 | 90 | 147 | 237 | ||||||||||||||||||||||||||||||||||||||||||||
| Equipment expense | 64 | 45 | 109 | 68 | 44 | 112 | 65 | 53 | 118 | 68 | 51 | 119 | 66 | 51 | 117 | ||||||||||||||||||||||||||||||||||||||||||||
| Marketing and customer development | 36 | 48 | 84 | 29 | 49 | 78 | 27 | 44 | 71 | 22 | 55 | 77 | 29 | 49 | 78 | ||||||||||||||||||||||||||||||||||||||||||||
| Depreciation - property under operating leases | 35 | 35 | 70 | 29 | 35 | 64 | 29 | 36 | 65 | 30 | 37 | 67 | 30 | 37 | 67 | ||||||||||||||||||||||||||||||||||||||||||||
| Regulatory costs | 20 | 17 | 37 | 19 | 17 | 36 | 18 | 19 | 37 | 18 | 7 | 25 | 37 | 39 | 76 | ||||||||||||||||||||||||||||||||||||||||||||
| Loan-related expense | 26 | 22 | 48 | 30 | 24 | 54 | 25 | 23 | 48 | 25 | 27 | 52 | 28 | 24 | 52 | ||||||||||||||||||||||||||||||||||||||||||||
| Amortization | 29 | — | 29 | 32 | — | 32 | 32 | — | 32 | 34 | — | 34 | 33 | — | 33 | ||||||||||||||||||||||||||||||||||||||||||||
| Merger-related restructuring and charges, net | 34 | 22 | 56 | 23 | 8 | 31 | 80 | 45 | 125 | 76 | — | 76 | 18 | — | 18 | ||||||||||||||||||||||||||||||||||||||||||||
| Other expense | 134 | 153 | 287 | 130 | 354 | 484 | 125 | 170 | 295 | 122 | 164 | 286 | 114 | 137 | 251 | ||||||||||||||||||||||||||||||||||||||||||||
| Total noninterest expense | 1,840 | 1,508 | 3,348 | 1,751 | 1,670 | 3,421 | 1,768 | 1,526 | 3,294 | 1,784 | 1,514 | 3,298 | 1,742 | 1,416 | 3,158 | ||||||||||||||||||||||||||||||||||||||||||||
| Earnings | |||||||||||||||||||||||||||||||||||||||||||||||||||||||||||
| Income before income taxes | 1,046 | 747 | 1,793 | 1,119 | 795 | 1,914 | 975 | 686 | 1,661 | 1,010 | 796 | 1,806 | 1,049 | 849 | 1,898 | ||||||||||||||||||||||||||||||||||||||||||||
| Provision for income taxes | 218 | 122 | 340 | 234 | 105 | 339 | 177 | 104 | 281 | 205 | 136 | 341 | 210 | 95 | 305 | ||||||||||||||||||||||||||||||||||||||||||||
| Net income | 828 | 625 | 1,453 | 885 | 690 | 1,575 | 798 | 582 | 1,380 | 805 | 660 | 1,465 | 839 | 754 | 1,593 | ||||||||||||||||||||||||||||||||||||||||||||
| Noncontrolling interests | 3 | 2 | 5 | (1) | 2 | 1 | 6 | 2 | 8 | 7 | 2 | 9 | 7 | 2 | 9 | ||||||||||||||||||||||||||||||||||||||||||||
| Preferred stock dividends | 90 | 26 | 116 | 44 | 25 | 69 | 43 | 26 | 69 | 44 | 26 | 70 | 43 | 26 | 69 | ||||||||||||||||||||||||||||||||||||||||||||
| Net income available to common shareholders | $ | 735 | $ | 597 | $ | 1,332 | $ | 842 | $ | 663 | $ | 1,505 | $ | 749 | $ | 554 | $ | 1,303 | $ | 754 | $ | 632 | $ | 1,386 | $ | 789 | $ | 726 | $ | 1,515 | |||||||||||||||||||||||||||||
13
Appendix 3: Historical Selected Items
The table below includes the selected items, other than merger-related and restructuring charges, and securities gains and losses, that were historically disclosed by BB&T and SunTrust. This information is being provided to assist the investment community in understanding the impacts of significant items on the historical unaudited combined income statements.
| Favorable (Unfavorable) | ||||||||||||||||||||||||||||||||
| BB&T | SunTrust | |||||||||||||||||||||||||||||||
| (Dollars in millions) Description | Financial Statement Caption | Pre-Tax | After-Tax at Marginal Tax Rate | Pre-Tax | After-Tax at Marginal Tax Rate | |||||||||||||||||||||||||||
| Third Quarter 2019 | ||||||||||||||||||||||||||||||||
| Incremental operating expenses related to the merger: | ||||||||||||||||||||||||||||||||
| Personnel expense | Personnel expense | $ | (39) | $ | (4) | |||||||||||||||||||||||||||
| Professional services | Professional services | (12) | — | |||||||||||||||||||||||||||||
| Other expense | Other expense | (1) | $ | (7) | ||||||||||||||||||||||||||||
| Total | $ | (52) | $ | (40) | $ | (11) | $ | (8) | ||||||||||||||||||||||||
| Redemption of preferred shares | Preferred stock dividends | $ | (46) | $ | (46) | |||||||||||||||||||||||||||
| Allowance release related to residential mortgage portfolio sale | Provision for credit losses | $ | 16 | $ | 12 | |||||||||||||||||||||||||||
| Gain on residential mortgage portfolio sale | Residential mortgage income | 4 | 3 | |||||||||||||||||||||||||||||
| Impact of mortgage portfolio sale | $ | 20 | $ | 15 | ||||||||||||||||||||||||||||
| Insurance Settlement | Other income | $ | 5 | $ | 4 | |||||||||||||||||||||||||||
| Second Quarter 2019 | ||||||||||||||||||||||||||||||||
| Insurance Settlement | Other income | $ | 205 | $ | 156 | |||||||||||||||||||||||||||
| Charitable Contribution | Other expense | $ | (205) | $ | (156) | |||||||||||||||||||||||||||
| Incremental operating expenses related to the merger: | ||||||||||||||||||||||||||||||||
| Personnel expense | Personnel expense | $ | (4) | $ | (2) | |||||||||||||||||||||||||||
| Professional services | Professional services | (5) | — | |||||||||||||||||||||||||||||
| Other expense | Other expense | — | $ | (4) | ||||||||||||||||||||||||||||
| Total | $ | (9) | $ | (7) | $ | (6) | $ | (5) | ||||||||||||||||||||||||
| First Quarter 2019 | ||||||||||||||||||||||||||||||||
| Incremental operating expenses related to the merger: | ||||||||||||||||||||||||||||||||
| Professional services | Professional services | $ | (1) | |||||||||||||||||||||||||||||
| Other expense | Other expense | (1) | ||||||||||||||||||||||||||||||
| Total | $ | (2) | $ | (1) | ||||||||||||||||||||||||||||
| Fourth Quarter 2018 | ||||||||||||||||||||||||||||||||
| Legacy pension settlement charge | Personnel expense | $ | (60) | $ | (46) | |||||||||||||||||||||||||||
| Third Quarter 2018 | ||||||||||||||||||||||||||||||||
| None | ||||||||||||||||||||||||||||||||
14