Attached files
| file | filename |
|---|---|
| EX-99.1 - EX-99.1 - Voya Financial, Inc. | d852096dex991.htm |
| 8-K - 8-K - Voya Financial, Inc. | d852096d8k.htm |

Exhibit 99.2 Voya Financial Focused on Growth – Sale of Individual Life December 18, 2019Exhibit 99.2 Voya Financial Focused on Growth – Sale of Individual Life December 18, 2019
Forward-Looking and Other Cautionary Statements This presentation and the remarks made orally contain forward-looking statements. The company does not revise or update them to reflect new information, subsequent events or changes in strategy. Forward-looking statements include statements relating to future developments in our business or expectations for our future financial performance and any statement not involving a historical fact. Forward-looking statements use words such as “anticipate,” “believe,” “estimate,” “expect,” “intend,” “plan,” and other words and terms of similar meaning in connection with a discussion of future operating or financial performance. Actual results, performance or events may differ materially from those projected in any forward-looking statement due to, among other things, (i) general economic conditions, particularly economic conditions in our core markets, (ii) performance of financial markets, including emerging markets, (iii) the frequency and severity of insured loss events, (iv) mortality and morbidity levels, (v) persistency and lapse levels, (vi) interest rates, (vii) currency exchange rates, (viii) general competitive factors, (ix) changes in laws and regulations, such as those relating to Federal taxation, state insurance regulations and NAIC regulations and guidelines, (x) changes in the policies of governments and/or regulatory authorities, and (xi) our ability to successfully manage the separation of our fixed and variable annuities businesses, including the transaction services, on the expected timeline and economic terms. Factors that may cause actual results to differ from those in any forward-looking statement also include those described under “Risk Factors” and “Management’s Discussion and Analysis of Results of Operations and Financial Condition (“MD&A”) – Trends and Uncertainties” in our Annual Report on Form 10-K for the year ended December 31, 2018, as filed with the Securities and Exchange Commission (“SEC”) on February 22, 2019, and under “MD&A – Trends and Uncertainties” in our Quarterly Report on Form 10-Q for the three months ended September 30, 2019 filed with the SEC on November 6, 2019. This presentation and the remarks made orally contain certain non-GAAP financial measures. Non-GAAP measures include Adjusted Operating Earnings, Adjusted Operating Return on Capital, Adjusted Operating Margin, and Adjusted debt-to-capital ratio. Information regarding these and other non-GAAP financial measures, including reconciliations to the most directly comparable GAAP financial measures, is provided in our quarterly earnings press releases and in our quarterly investor supplements, all of which are available at the Investor Relations section of Voya Financial’s website at investors.voya.com. 2Forward-Looking and Other Cautionary Statements This presentation and the remarks made orally contain forward-looking statements. The company does not revise or update them to reflect new information, subsequent events or changes in strategy. Forward-looking statements include statements relating to future developments in our business or expectations for our future financial performance and any statement not involving a historical fact. Forward-looking statements use words such as “anticipate,” “believe,” “estimate,” “expect,” “intend,” “plan,” and other words and terms of similar meaning in connection with a discussion of future operating or financial performance. Actual results, performance or events may differ materially from those projected in any forward-looking statement due to, among other things, (i) general economic conditions, particularly economic conditions in our core markets, (ii) performance of financial markets, including emerging markets, (iii) the frequency and severity of insured loss events, (iv) mortality and morbidity levels, (v) persistency and lapse levels, (vi) interest rates, (vii) currency exchange rates, (viii) general competitive factors, (ix) changes in laws and regulations, such as those relating to Federal taxation, state insurance regulations and NAIC regulations and guidelines, (x) changes in the policies of governments and/or regulatory authorities, and (xi) our ability to successfully manage the separation of our fixed and variable annuities businesses, including the transaction services, on the expected timeline and economic terms. Factors that may cause actual results to differ from those in any forward-looking statement also include those described under “Risk Factors” and “Management’s Discussion and Analysis of Results of Operations and Financial Condition (“MD&A”) – Trends and Uncertainties” in our Annual Report on Form 10-K for the year ended December 31, 2018, as filed with the Securities and Exchange Commission (“SEC”) on February 22, 2019, and under “MD&A – Trends and Uncertainties” in our Quarterly Report on Form 10-Q for the three months ended September 30, 2019 filed with the SEC on November 6, 2019. This presentation and the remarks made orally contain certain non-GAAP financial measures. Non-GAAP measures include Adjusted Operating Earnings, Adjusted Operating Return on Capital, Adjusted Operating Margin, and Adjusted debt-to-capital ratio. Information regarding these and other non-GAAP financial measures, including reconciliations to the most directly comparable GAAP financial measures, is provided in our quarterly earnings press releases and in our quarterly investor supplements, all of which are available at the Investor Relations section of Voya Financial’s website at investors.voya.com. 2
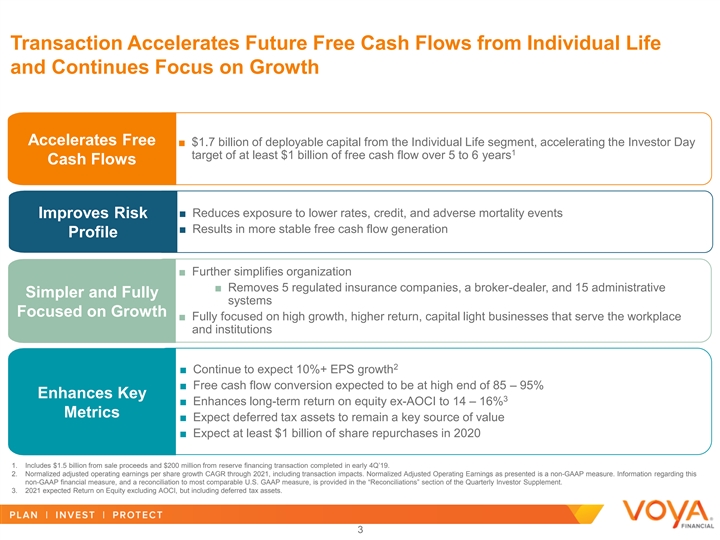
Transaction Accelerates Future Free Cash Flows from Individual Life and Continues Focus on Growth Accelerates Free ■ $1.7 billion of deployable capital from the Individual Life segment, accelerating the Investor Day 1 target of at least $1 billion of free cash flow over 5 to 6 years Cash Flows ■ Reduces exposure to lower rates, credit, and adverse mortality events Improves Risk ■ Results in more stable free cash flow generation Profile ■ Further simplifies organization ■ Removes 5 regulated insurance companies, a broker-dealer, and 15 administrative Simpler and Fully systems Focused on Growth ■ Fully focused on high growth, higher return, capital light businesses that serve the workplace and institutions 2 ■ Continue to expect 10%+ EPS growth ■ Free cash flow conversion expected to be at high end of 85 – 95% Enhances Key 3 ■ Enhances long-term return on equity ex-AOCI to 14 – 16% Metrics ■ Expect deferred tax assets to remain a key source of value ■ Expect at least $1 billion of share repurchases in 2020 1. Includes $1.5 billion from sale proceeds and $200 million from reserve financing transaction completed in early 4Q’19. 2. Normalized adjusted operating earnings per share growth CAGR through 2021, including transaction impacts. Normalized Adjusted Operating Earnings as presented is a non-GAAP measure. Information regarding this non-GAAP financial measure, and a reconciliation to most comparable U.S. GAAP measure, is provided in the “Reconciliations” section of the Quarterly Investor Supplement. 3. 2021 expected Return on Equity excluding AOCI, but including deferred tax assets. 3Transaction Accelerates Future Free Cash Flows from Individual Life and Continues Focus on Growth Accelerates Free ■ $1.7 billion of deployable capital from the Individual Life segment, accelerating the Investor Day 1 target of at least $1 billion of free cash flow over 5 to 6 years Cash Flows ■ Reduces exposure to lower rates, credit, and adverse mortality events Improves Risk ■ Results in more stable free cash flow generation Profile ■ Further simplifies organization ■ Removes 5 regulated insurance companies, a broker-dealer, and 15 administrative Simpler and Fully systems Focused on Growth ■ Fully focused on high growth, higher return, capital light businesses that serve the workplace and institutions 2 ■ Continue to expect 10%+ EPS growth ■ Free cash flow conversion expected to be at high end of 85 – 95% Enhances Key 3 ■ Enhances long-term return on equity ex-AOCI to 14 – 16% Metrics ■ Expect deferred tax assets to remain a key source of value ■ Expect at least $1 billion of share repurchases in 2020 1. Includes $1.5 billion from sale proceeds and $200 million from reserve financing transaction completed in early 4Q’19. 2. Normalized adjusted operating earnings per share growth CAGR through 2021, including transaction impacts. Normalized Adjusted Operating Earnings as presented is a non-GAAP measure. Information regarding this non-GAAP financial measure, and a reconciliation to most comparable U.S. GAAP measure, is provided in the “Reconciliations” section of the Quarterly Investor Supplement. 3. 2021 expected Return on Equity excluding AOCI, but including deferred tax assets. 3

Transaction Overview ■ Divested closed block Individual Life, Non-Retirement Annuities and pension risk businesses through sale of legal entities and reinsurance: 2 ■ SLD, SLDI, and certain subsidiaries acquired by affiliates of Resolution Life Transaction Summary ■ VRIAC, RLNY, and RLI life insurance and annuities businesses sold to affiliates of Resolution Life through reinsurance ■ Approximately $1.7 billion of deployable capital released on an accelerated timeline 1 ■ Value includes ~$1.5 billion of net proceeds from Resolution Life and ~$200 million of net proceeds from reserve financing transaction completed early 4Q’19 Value Received ■ $123 million of these net proceeds are subject to a continuing interest in future financial results over 5 years post closing 1 ■ Proceeds include a $225 million interest in the parent investment fund of Resolution Life and a $123 million investment in surplus notes issued by SLD ■ VIM to be a preferred asset manager provider to Resolution Life for at least a 7 year period Retained Interest ■ Expect pre-tax, annualized operating earnings impact from assets transferred of approximately $10 - $15 million ■ Maintain debt-to-capital ratio below 30% and RBC target ratio of 400% 2 ■ $0.9 billion after-tax charge to GAAP book value (ex. AOCI) Balance Sheet Impact 2 ■ Pro forma 3Q’19 GAAP book value per share (ex. AOCI) of $41.12 ■ Expect to close by September 30, 2020, subject to regulatory approval Timing / Approvals 1. Resolution Life Group Holdings, L.P. (a Bermuda-based fund). 2. Estimated reduction to GAAP Equity Ex AOCI at closing assuming current market conditions and reflecting both the sale of legal entities and the reinsurance impacts that comprise the overall transaction. These estimates are based upon historical financial information and are subject to change prior to transaction closing and subject to interest rate and other risks that could impact the ultimate loss recognized. 4Transaction Overview ■ Divested closed block Individual Life, Non-Retirement Annuities and pension risk businesses through sale of legal entities and reinsurance: 2 ■ SLD, SLDI, and certain subsidiaries acquired by affiliates of Resolution Life Transaction Summary ■ VRIAC, RLNY, and RLI life insurance and annuities businesses sold to affiliates of Resolution Life through reinsurance ■ Approximately $1.7 billion of deployable capital released on an accelerated timeline 1 ■ Value includes ~$1.5 billion of net proceeds from Resolution Life and ~$200 million of net proceeds from reserve financing transaction completed early 4Q’19 Value Received ■ $123 million of these net proceeds are subject to a continuing interest in future financial results over 5 years post closing 1 ■ Proceeds include a $225 million interest in the parent investment fund of Resolution Life and a $123 million investment in surplus notes issued by SLD ■ VIM to be a preferred asset manager provider to Resolution Life for at least a 7 year period Retained Interest ■ Expect pre-tax, annualized operating earnings impact from assets transferred of approximately $10 - $15 million ■ Maintain debt-to-capital ratio below 30% and RBC target ratio of 400% 2 ■ $0.9 billion after-tax charge to GAAP book value (ex. AOCI) Balance Sheet Impact 2 ■ Pro forma 3Q’19 GAAP book value per share (ex. AOCI) of $41.12 ■ Expect to close by September 30, 2020, subject to regulatory approval Timing / Approvals 1. Resolution Life Group Holdings, L.P. (a Bermuda-based fund). 2. Estimated reduction to GAAP Equity Ex AOCI at closing assuming current market conditions and reflecting both the sale of legal entities and the reinsurance impacts that comprise the overall transaction. These estimates are based upon historical financial information and are subject to change prior to transaction closing and subject to interest rate and other risks that could impact the ultimate loss recognized. 4

Transaction Accelerates Free Cash Flows From Individual Life Expected Cash Flow Generation Profile at Accelerated Cash Flows Investor Day 2018 without Transaction with Transaction $ millions $ millions ~$1,700 ~$1,500 $1,000+ ~$200 ~$200 ~$200 2019 2020 2021 2022 2023 2024 2019-2024E 1 2 Reserve Financing transaction Sale Proceeds Free cash flow generation at 70 – 80% conversion 1. From reserve financing transaction completed early 4Q’19. 2. Inclusive of retained earnings from the block between FY’19 and close. 5Transaction Accelerates Free Cash Flows From Individual Life Expected Cash Flow Generation Profile at Accelerated Cash Flows Investor Day 2018 without Transaction with Transaction $ millions $ millions ~$1,700 ~$1,500 $1,000+ ~$200 ~$200 ~$200 2019 2020 2021 2022 2023 2024 2019-2024E 1 2 Reserve Financing transaction Sale Proceeds Free cash flow generation at 70 – 80% conversion 1. From reserve financing transaction completed early 4Q’19. 2. Inclusive of retained earnings from the block between FY’19 and close. 5

Path to EPS Growth $0.36 - $0.46 $0.15 - $0.20 $0.18 - $0.22 ($0.28) - ($0.30) ($0.18) - ($0.22) $1.80 - $1.90 $1.57 q Reduce legal entities $1.45 and administrative systems $1.27 $1.27 $1.07 q Strea $ m 1li .0 ne 7 o perations and reporting q TSA / ASA revenues 3 4Q'19 Run-Rate Individual Life and Stranded Costs Cost Savings Deployment of Business Growth and Target Quarterly Quarterly Normalized Legacy Annuity Transaction Proceeds Additional Normalized Adjusted 5 2 Adjusted Operating Business Sold to Buybacks and Debt Repurchases Operating EPS by 1 4 1 EPS Repurchase 4Q'21 1. Quarterly Normalized Adjusted Operating Earnings per Share is a non-GAAP measure. Information regarding this non-GAAP financial measure, and a reconciliation to most comparable U.S. GAAP measure, is provided in the “Reconciliations” section of the Quarterly Investor Supplement. 2. Estimated earnings that beginning in 4Q’19 will be reported as either discontinued operations (for businesses in legal entities that were sold) or in non-operating results for businesses exited via reinsurance. 3. Estimated expenses that beginning in 4Q’19 will be reported in adjusted operating earnings in our Corporate Segment related to activities for which we have agreed to provide transitional services and for which we will be reimbursed under a transition services agreement upon closing of the transaction and indirect costs, such as those related to corporate and shared service functions that were previously allocated to the businesses that were sold. 4. Repurchases are spread across 4 quarters after expected close with share repurchase price target based off long-term equity growth rate assumption of 7.5%. 5. Growth is net of VIM 4Q’19 strong performance fees not expected to recur at these levels and revenue that will decrease as a result of this transaction. Includes normal course share repurchase activity assumed through 2021. 6Path to EPS Growth $0.36 - $0.46 $0.15 - $0.20 $0.18 - $0.22 ($0.28) - ($0.30) ($0.18) - ($0.22) $1.80 - $1.90 $1.57 q Reduce legal entities $1.45 and administrative systems $1.27 $1.27 $1.07 q Strea $ m 1li .0 ne 7 o perations and reporting q TSA / ASA revenues 3 4Q'19 Run-Rate Individual Life and Stranded Costs Cost Savings Deployment of Business Growth and Target Quarterly Quarterly Normalized Legacy Annuity Transaction Proceeds Additional Normalized Adjusted 5 2 Adjusted Operating Business Sold to Buybacks and Debt Repurchases Operating EPS by 1 4 1 EPS Repurchase 4Q'21 1. Quarterly Normalized Adjusted Operating Earnings per Share is a non-GAAP measure. Information regarding this non-GAAP financial measure, and a reconciliation to most comparable U.S. GAAP measure, is provided in the “Reconciliations” section of the Quarterly Investor Supplement. 2. Estimated earnings that beginning in 4Q’19 will be reported as either discontinued operations (for businesses in legal entities that were sold) or in non-operating results for businesses exited via reinsurance. 3. Estimated expenses that beginning in 4Q’19 will be reported in adjusted operating earnings in our Corporate Segment related to activities for which we have agreed to provide transitional services and for which we will be reimbursed under a transition services agreement upon closing of the transaction and indirect costs, such as those related to corporate and shared service functions that were previously allocated to the businesses that were sold. 4. Repurchases are spread across 4 quarters after expected close with share repurchase price target based off long-term equity growth rate assumption of 7.5%. 5. Growth is net of VIM 4Q’19 strong performance fees not expected to recur at these levels and revenue that will decrease as a result of this transaction. Includes normal course share repurchase activity assumed through 2021. 6

Committed to Achieving our Long-Term Targets Streamlined High End of 1 EPS Growth Target Share Repurchases Businesses FCF Conversion 3 10%+ 85 - 95% $1 billion+ High Growth, Normalized FCF Share High Return, EPS Growth Conversion Repurchases Capital Light through 2021 Ratio in 2020 Businesses 1. Normalized adjusted operating earnings per share growth through 2021. Normalized Adjusted Operating Earnings as presented is a non-GAAP measure. Information regarding this non-GAAP financial measure, and a reconciliation to most comparable U.S. GAAP measure, is provided in the “Reconciliations” section of the Quarterly Investor Supplement. 7Committed to Achieving our Long-Term Targets Streamlined High End of 1 EPS Growth Target Share Repurchases Businesses FCF Conversion 3 10%+ 85 - 95% $1 billion+ High Growth, Normalized FCF Share High Return, EPS Growth Conversion Repurchases Capital Light through 2021 Ratio in 2020 Businesses 1. Normalized adjusted operating earnings per share growth through 2021. Normalized Adjusted Operating Earnings as presented is a non-GAAP measure. Information regarding this non-GAAP financial measure, and a reconciliation to most comparable U.S. GAAP measure, is provided in the “Reconciliations” section of the Quarterly Investor Supplement. 7

Multiple Levers for Future Growth Retirement Employee Benefits Investment Management n Leverage Scale, Brand and n Expand share in faster n Leverage and deepen Culture to drive growth growing Stop Loss & distribution and external across all Markets Voluntary benefits markets intermediary relationships n Expand and deepen n Disciplined pricing and n Expand specialty distribution relationships service excellence to drive capabilities and offerings strong growth and returns n Expand use of robotics, AI n Grow customized and automation to drive n Grow voluntary solution set investment solutions enhanced customer to engage consumers more experience and efficiency broadly 8Multiple Levers for Future Growth Retirement Employee Benefits Investment Management n Leverage Scale, Brand and n Expand share in faster n Leverage and deepen Culture to drive growth growing Stop Loss & distribution and external across all Markets Voluntary benefits markets intermediary relationships n Expand and deepen n Disciplined pricing and n Expand specialty distribution relationships service excellence to drive capabilities and offerings strong growth and returns n Expand use of robotics, AI n Grow customized and automation to drive n Grow voluntary solution set investment solutions enhanced customer to engage consumers more experience and efficiency broadly 8

Appendix 9Appendix 9
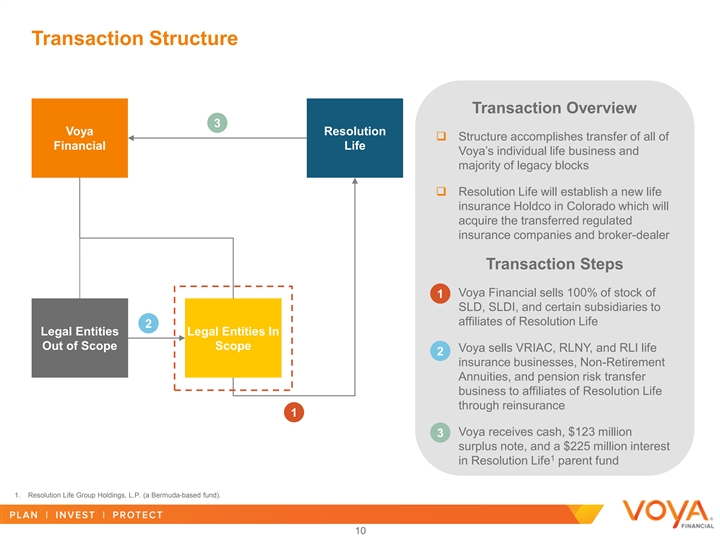
Transaction Structure Transaction Overview 3 Voya Resolution q Structure accomplishes transfer of all of Financial Life Voya’s individual life business and majority of legacy blocks q Resolution Life will establish a new life insurance Holdco in Colorado which will acquire the transferred regulated insurance companies and broker-dealer Transaction Steps q Voya Financial sells 100% of stock of 1 SLD, SLDI, and certain subsidiaries to affiliates of Resolution Life 2 Legal Entities Legal Entities In Out of Scope Scope q Voya sells VRIAC, RLNY, and RLI life 2 insurance businesses, Non-Retirement Annuities, and pension risk transfer business to affiliates of Resolution Life through reinsurance 1 q Voya receives cash, $123 million 3 surplus note, and a $225 million interest 1 in Resolution Life parent fund 1. Resolution Life Group Holdings, L.P. (a Bermuda-based fund). 10Transaction Structure Transaction Overview 3 Voya Resolution q Structure accomplishes transfer of all of Financial Life Voya’s individual life business and majority of legacy blocks q Resolution Life will establish a new life insurance Holdco in Colorado which will acquire the transferred regulated insurance companies and broker-dealer Transaction Steps q Voya Financial sells 100% of stock of 1 SLD, SLDI, and certain subsidiaries to affiliates of Resolution Life 2 Legal Entities Legal Entities In Out of Scope Scope q Voya sells VRIAC, RLNY, and RLI life 2 insurance businesses, Non-Retirement Annuities, and pension risk transfer business to affiliates of Resolution Life through reinsurance 1 q Voya receives cash, $123 million 3 surplus note, and a $225 million interest 1 in Resolution Life parent fund 1. Resolution Life Group Holdings, L.P. (a Bermuda-based fund). 10

Voya Simplified Following Transaction Transaction removes 5 regulated insurance companies, a broker-dealer, and reinsures certain life insurance Voya Financial policies, pension risk transfer business Inc. and non-retirement annuities to SLD. Voya Holdings SLD SLDI (Connecticut) (Colorado) (Arizona captive) RR4 Voya America (Missouri Equities VRIAC RLI MULIC RR2 captive) (Connecticut (Connecticut) (Minnesota) (Indiana) (Arizona captive) (AXXX reinsurer) broker-dealer) RLNY (New York) Legal Entities Sold Within Scope of Acquisition Legal Entities Remaining after Transaction 11Voya Simplified Following Transaction Transaction removes 5 regulated insurance companies, a broker-dealer, and reinsures certain life insurance Voya Financial policies, pension risk transfer business Inc. and non-retirement annuities to SLD. Voya Holdings SLD SLDI (Connecticut) (Colorado) (Arizona captive) RR4 Voya America (Missouri Equities VRIAC RLI MULIC RR2 captive) (Connecticut (Connecticut) (Minnesota) (Indiana) (Arizona captive) (AXXX reinsurer) broker-dealer) RLNY (New York) Legal Entities Sold Within Scope of Acquisition Legal Entities Remaining after Transaction 11

Strong Free Cash Flow Conversion at Higher End of 85% – 95% from our Core Businesses Projected Free Cash Flow Conversion by Segment Retirement 75 – 85% Investment Management 90 – 100% Employee Benefits 75 – 85% Corporate / Tax Asset Utilization Benefit 0 – 5% Total Free Cash Flow Conversion 85 – 95% 12Strong Free Cash Flow Conversion at Higher End of 85% – 95% from our Core Businesses Projected Free Cash Flow Conversion by Segment Retirement 75 – 85% Investment Management 90 – 100% Employee Benefits 75 – 85% Corporate / Tax Asset Utilization Benefit 0 – 5% Total Free Cash Flow Conversion 85 – 95% 12

Future Revenues less tied to Mortality and Interest Rates Adjusted Operating Revenue Adjusted Operating Revenue Pro Forma for Transaction at Investor Day 2 1 (Normalized) (Normalized) 18% 22% 46% 54% 28% 32% Fee Income Investment Spread Net Underwriting 1. 3Q’18 TTM. Normalized for prepayment and alternative income above/(below) long-term expectations. Excludes Corporate segment. 2. 3Q’19 TTM. Normalized for prepayment and alternative income above/(below) long-term expectations. Excludes Corporate segment. 13Future Revenues less tied to Mortality and Interest Rates Adjusted Operating Revenue Adjusted Operating Revenue Pro Forma for Transaction at Investor Day 2 1 (Normalized) (Normalized) 18% 22% 46% 54% 28% 32% Fee Income Investment Spread Net Underwriting 1. 3Q’18 TTM. Normalized for prepayment and alternative income above/(below) long-term expectations. Excludes Corporate segment. 2. 3Q’19 TTM. Normalized for prepayment and alternative income above/(below) long-term expectations. Excludes Corporate segment. 13