Attached files
| file | filename |
|---|---|
| 8-K - 8-K - SUPERIOR ENERGY SERVICES INC | d802817d8k.htm |
| EX-99.1 - EX-99.1 - SUPERIOR ENERGY SERVICES INC | d802817dex991.htm |
| EX-10.4 - EX-10.4 - SUPERIOR ENERGY SERVICES INC | d802817dex104.htm |
| EX-10.3 - EX-10.3 - SUPERIOR ENERGY SERVICES INC | d802817dex103.htm |
| EX-10.2 - EX-10.2 - SUPERIOR ENERGY SERVICES INC | d802817dex102.htm |
| EX-10.1 - EX-10.1 - SUPERIOR ENERGY SERVICES INC | d802817dex101.htm |
| EX-2.1 - EX-2.1 - SUPERIOR ENERGY SERVICES INC | d802817dex21.htm |
Exhibit 99.2 Strategic Update December 2019Exhibit 99.2 Strategic Update December 2019
Cautionary Note to Investors Forward-Looking Statements All statements in this presentation (and oral statements made regarding the subjects of this presentation) other than historical facts are forward-looking statements within the meaning of Section 21E of the Securities Exchange Act of 1934, as amended. These forward-looking statements rely on a number of assumptions concerning future events and are subject to a number of uncertainties and factors, many of which are outside the control of Superior Energy Services, Inc. (“Superior”), Forbes Energy Services Ltd. (“Forbes”) and Newco (as defined in this presentation), which could cause actual results to differ materially from such statements. Forward-looking information includes, but is not limited to: statements regarding the expected benefits of the proposed transaction; the anticipated completion of the proposed transaction and the timing thereof; the expected future results of operations and growth of Superior and Newco; and plans and objectives of management for future operations of Superior and Newco. While Superior believes that the assumptions concerning future events are reasonable, it cautions that there are inherent difficulties in predicting certain important factors that could impact the future performance or results of its and Newco’s business. Among the factors that could cause results to differ materially from those indicated by such forward-looking statements are: the failure to realize the anticipated costs savings, synergies and other benefits of the transaction; the possible diversion of management time on transaction-related issues; the risk that the requisite approvals to complete the transaction are not obtained or other closing conditions are not satisfied; local, regional and national economic conditions and the impact they may have on Superior, Forbes, Newco and their customers; conditions in the oil and gas industry, especially oil and natural gas prices and capital expenditures by oil and gas companies; the debt obligations of Superior and Newco following the transaction and the potential effect of limiting Superior’s and/or Newco’s ability to fund future growth and operations and increasing their respective exposure to risk during adverse economic conditions; the financial condition of Superior’s and Newco’s customers; any non-performance by customers of their contractual obligations; changes in customer, employee or supplier relationships resulting from the transaction; changes in safety, health, environmental and other regulations; the results of any reviews, investigations or other proceedings by government authorities; and the potential additional costs relating to any reviews, investigations or other proceedings by government authorities or shareholder actions. These forward-looking statements are also affected by the risk factors, forward-looking statements and challenges and uncertainties described in Superior’s Annual Report on Form 10-K for the year ended December 31, 2018, and those set forth from time to time in Superior’s filings with the Securities and Exchange Commission (the “SEC”), which are available at www.superiorenergy.com. Except as required by law, Superior expressly disclaims any intention or obligation to revise or update any forward-looking statements whether as a result of new information, future events or otherwise. Non-GAAP Measures This presentation contains the non-GAAP financial measures of Adjusted EBITDA, Free Cash Flow and Free Cash Flow Conversion. In addition, this presentation sets forth revenues, Adjusted EBITDA and Free Cash Flow for the twelve months period ending September 30, 2019. These non-GAAP financial measures are not in accordance with, or a substitute for, measures prepared in accordance with GAAP, and may be different from non-GAAP measures used by other companies. In addition, these non-GAAP measures are not based on any comprehensive set of accounting rules or principles. Non-GAAP measures have limitations in that they do not reflect all of the amounts associated with the relevant entity's results of operations that would be reflected in measures determined in accordance with GAAP. The non-GAAP financial measures presented are provided to enhance investors' overall understanding of the Company's financial performance. In addition, because Superior has reported certain non-GAAP measures in the past, Superior believes the inclusion of non-GAAP measures provides consistency in Superior's financial reporting. Please see the Appendix to this presentation for a reconciliation of such non-GAAP financial measures to the nearest GAAP measure for the relevant periods presented. No Offer or Solicitation This presentation is not intended to and does not constitute an offer to sell or the solicitation of an offer to subscribe for or buy or an invitation to purchase or subscribe for any securities or the solicitation of any vote in any jurisdiction pursuant to the proposed transaction or otherwise, nor shall there be any sale, issuance or transfer of securities in any jurisdiction in contravention of applicable law. Subject to certain exceptions to be approved by the relevant regulators or certain facts to be ascertained, the public offer will not be made directly or indirectly, in or into any jurisdiction where to do so would constitute a violation of the laws of such jurisdiction, or by use of the mails or by any means or instrumentality (including without limitation, facsimile transmission, telephone and the internet) of interstate or foreign commerce, or any facility of a national securities exchange, of any such jurisdiction. Important Additional Information Regarding the Transaction Will Be Filed With the SEC In connection with the proposed transaction, Newco will file a registration statement on Form S-4, including a joint proxy statement/prospectus of Holdco and Forbes, with the SEC. INVESTORS AND SECURITY HOLDERS OF SUPERIOR AND FORBES ARE ADVISED TO CAREFULLY READ THE REGISTRATION STATEMENT AND JOINT PROXY STATEMENT/PROSPECTUS (INCLUDING ALL AMENDMENTS AND SUPPLEMENTS THERETO) WHEN THEY BECOME AVAILABLE BECAUSE THEY WILL CONTAIN IMPORTANT INFORMATION ABOUT THE TRANSACTION, THE PARTIES TO THE TRANSACTION AND THE RISKS ASSOCIATED WITH THE TRANSACTION. A definitive joint proxy statement/prospectus will be sent to security holders of Forbes in connection with the Forbes shareholder meeting. Investors and security holders may obtain a free copy of the joint proxy statement/prospectus (when available) and other relevant documents filed by Superior, Forbes and Newco with the SEC from the SEC’s website at www.sec.gov. Security holders and other interested parties will also be able to obtain, without charge, a copy of the joint proxy statement/prospectus and other relevant documents (when available) from www.superiorenergy.com under the tab “Investors” and then under the heading “SEC Filings.” Security holders may also read and copy any reports, statements and other information filed with the SEC at the SEC public reference room at 100 F Street N.E., Room 1580, Washington D.C. 20549. Please call the SEC at (800) 732-0330 or visit the SEC’s website for further information on its public reference room. Participants in the Solicitation Superior, Forbes and their respective directors, executive officers and certain other members of management may be deemed to be participants in the solicitation of proxies from their respective security holders with respect to the transaction. Information about these persons is set forth in Superior’s proxy statement relating to its 2019 Annual Meeting of Stockholders, which was filed with the SEC on April 26, 2019, and Forbes’ proxy statement relating to its 2019 Annual Meeting of Stockholders, which was filed with the SEC on April 25, 2019, and subsequent statements of changes in beneficial ownership on file with the SEC. Security holders and investors may obtain additional information regarding the interests of such persons, which may be different than those of the respective companies’ security holders generally, by reading the joint proxy statement/prospectus and other relevant documents regarding the transaction, which will be filed with the SEC. . 2Cautionary Note to Investors Forward-Looking Statements All statements in this presentation (and oral statements made regarding the subjects of this presentation) other than historical facts are forward-looking statements within the meaning of Section 21E of the Securities Exchange Act of 1934, as amended. These forward-looking statements rely on a number of assumptions concerning future events and are subject to a number of uncertainties and factors, many of which are outside the control of Superior Energy Services, Inc. (“Superior”), Forbes Energy Services Ltd. (“Forbes”) and Newco (as defined in this presentation), which could cause actual results to differ materially from such statements. Forward-looking information includes, but is not limited to: statements regarding the expected benefits of the proposed transaction; the anticipated completion of the proposed transaction and the timing thereof; the expected future results of operations and growth of Superior and Newco; and plans and objectives of management for future operations of Superior and Newco. While Superior believes that the assumptions concerning future events are reasonable, it cautions that there are inherent difficulties in predicting certain important factors that could impact the future performance or results of its and Newco’s business. Among the factors that could cause results to differ materially from those indicated by such forward-looking statements are: the failure to realize the anticipated costs savings, synergies and other benefits of the transaction; the possible diversion of management time on transaction-related issues; the risk that the requisite approvals to complete the transaction are not obtained or other closing conditions are not satisfied; local, regional and national economic conditions and the impact they may have on Superior, Forbes, Newco and their customers; conditions in the oil and gas industry, especially oil and natural gas prices and capital expenditures by oil and gas companies; the debt obligations of Superior and Newco following the transaction and the potential effect of limiting Superior’s and/or Newco’s ability to fund future growth and operations and increasing their respective exposure to risk during adverse economic conditions; the financial condition of Superior’s and Newco’s customers; any non-performance by customers of their contractual obligations; changes in customer, employee or supplier relationships resulting from the transaction; changes in safety, health, environmental and other regulations; the results of any reviews, investigations or other proceedings by government authorities; and the potential additional costs relating to any reviews, investigations or other proceedings by government authorities or shareholder actions. These forward-looking statements are also affected by the risk factors, forward-looking statements and challenges and uncertainties described in Superior’s Annual Report on Form 10-K for the year ended December 31, 2018, and those set forth from time to time in Superior’s filings with the Securities and Exchange Commission (the “SEC”), which are available at www.superiorenergy.com. Except as required by law, Superior expressly disclaims any intention or obligation to revise or update any forward-looking statements whether as a result of new information, future events or otherwise. Non-GAAP Measures This presentation contains the non-GAAP financial measures of Adjusted EBITDA, Free Cash Flow and Free Cash Flow Conversion. In addition, this presentation sets forth revenues, Adjusted EBITDA and Free Cash Flow for the twelve months period ending September 30, 2019. These non-GAAP financial measures are not in accordance with, or a substitute for, measures prepared in accordance with GAAP, and may be different from non-GAAP measures used by other companies. In addition, these non-GAAP measures are not based on any comprehensive set of accounting rules or principles. Non-GAAP measures have limitations in that they do not reflect all of the amounts associated with the relevant entity's results of operations that would be reflected in measures determined in accordance with GAAP. The non-GAAP financial measures presented are provided to enhance investors' overall understanding of the Company's financial performance. In addition, because Superior has reported certain non-GAAP measures in the past, Superior believes the inclusion of non-GAAP measures provides consistency in Superior's financial reporting. Please see the Appendix to this presentation for a reconciliation of such non-GAAP financial measures to the nearest GAAP measure for the relevant periods presented. No Offer or Solicitation This presentation is not intended to and does not constitute an offer to sell or the solicitation of an offer to subscribe for or buy or an invitation to purchase or subscribe for any securities or the solicitation of any vote in any jurisdiction pursuant to the proposed transaction or otherwise, nor shall there be any sale, issuance or transfer of securities in any jurisdiction in contravention of applicable law. Subject to certain exceptions to be approved by the relevant regulators or certain facts to be ascertained, the public offer will not be made directly or indirectly, in or into any jurisdiction where to do so would constitute a violation of the laws of such jurisdiction, or by use of the mails or by any means or instrumentality (including without limitation, facsimile transmission, telephone and the internet) of interstate or foreign commerce, or any facility of a national securities exchange, of any such jurisdiction. Important Additional Information Regarding the Transaction Will Be Filed With the SEC In connection with the proposed transaction, Newco will file a registration statement on Form S-4, including a joint proxy statement/prospectus of Holdco and Forbes, with the SEC. INVESTORS AND SECURITY HOLDERS OF SUPERIOR AND FORBES ARE ADVISED TO CAREFULLY READ THE REGISTRATION STATEMENT AND JOINT PROXY STATEMENT/PROSPECTUS (INCLUDING ALL AMENDMENTS AND SUPPLEMENTS THERETO) WHEN THEY BECOME AVAILABLE BECAUSE THEY WILL CONTAIN IMPORTANT INFORMATION ABOUT THE TRANSACTION, THE PARTIES TO THE TRANSACTION AND THE RISKS ASSOCIATED WITH THE TRANSACTION. A definitive joint proxy statement/prospectus will be sent to security holders of Forbes in connection with the Forbes shareholder meeting. Investors and security holders may obtain a free copy of the joint proxy statement/prospectus (when available) and other relevant documents filed by Superior, Forbes and Newco with the SEC from the SEC’s website at www.sec.gov. Security holders and other interested parties will also be able to obtain, without charge, a copy of the joint proxy statement/prospectus and other relevant documents (when available) from www.superiorenergy.com under the tab “Investors” and then under the heading “SEC Filings.” Security holders may also read and copy any reports, statements and other information filed with the SEC at the SEC public reference room at 100 F Street N.E., Room 1580, Washington D.C. 20549. Please call the SEC at (800) 732-0330 or visit the SEC’s website for further information on its public reference room. Participants in the Solicitation Superior, Forbes and their respective directors, executive officers and certain other members of management may be deemed to be participants in the solicitation of proxies from their respective security holders with respect to the transaction. Information about these persons is set forth in Superior’s proxy statement relating to its 2019 Annual Meeting of Stockholders, which was filed with the SEC on April 26, 2019, and Forbes’ proxy statement relating to its 2019 Annual Meeting of Stockholders, which was filed with the SEC on April 25, 2019, and subsequent statements of changes in beneficial ownership on file with the SEC. Security holders and investors may obtain additional information regarding the interests of such persons, which may be different than those of the respective companies’ security holders generally, by reading the joint proxy statement/prospectus and other relevant documents regarding the transaction, which will be filed with the SEC. . 2
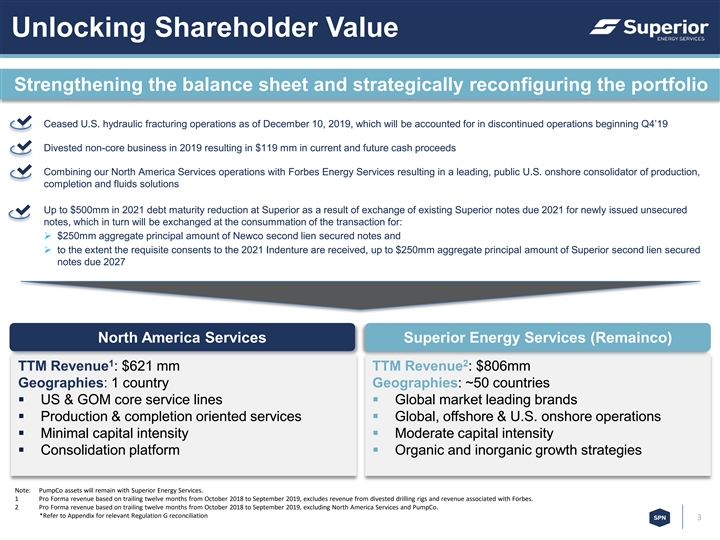
Unlocking Shareholder Value Strengthening the balance sheet and strategically reconfiguring the portfolio Ceased U.S. hydraulic fracturing operations as of December 10, 2019, which will be accounted for in discontinued operations beginning Q4’19 Divested non-core business in 2019 resulting in $119 mm in current and future cash proceeds Combining our North America Services operations with Forbes Energy Services resulting in a leading, public U.S. onshore consolidator of production, completion and fluids solutions Up to $500mm in 2021 debt maturity reduction at Superior as a result of exchange of existing Superior notes due 2021 for newly issued unsecured notes, which in turn will be exchanged at the consummation of the transaction for: Ø $250mm aggregate principal amount of Newco second lien secured notes and Ø to the extent the requisite consents to the 2021 Indenture are received, up to $250mm aggregate principal amount of Superior second lien secured notes due 2027 North America Services Superior Energy Services (Remainco) 1 2 TTM Revenue : $621 mm TTM Revenue : $806mm Geographies: 1 country Geographies: ~50 countries § US & GOM core service lines§ Global market leading brands § Production & completion oriented services§ Global, offshore & U.S. onshore operations § Minimal capital intensity§ Moderate capital intensity § Consolidation platform§ Organic and inorganic growth strategies Note: PumpCo assets will remain with Superior Energy Services. 1 Pro Forma revenue based on trailing twelve months from October 2018 to September 2019, excludes revenue from divested drilling rigs and revenue associated with Forbes. 2 Pro Forma revenue based on trailing twelve months from October 2018 to September 2019, excluding North America Services and PumpCo. *Refer to Appendix for relevant Regulation G reconciliation 3Unlocking Shareholder Value Strengthening the balance sheet and strategically reconfiguring the portfolio Ceased U.S. hydraulic fracturing operations as of December 10, 2019, which will be accounted for in discontinued operations beginning Q4’19 Divested non-core business in 2019 resulting in $119 mm in current and future cash proceeds Combining our North America Services operations with Forbes Energy Services resulting in a leading, public U.S. onshore consolidator of production, completion and fluids solutions Up to $500mm in 2021 debt maturity reduction at Superior as a result of exchange of existing Superior notes due 2021 for newly issued unsecured notes, which in turn will be exchanged at the consummation of the transaction for: Ø $250mm aggregate principal amount of Newco second lien secured notes and Ø to the extent the requisite consents to the 2021 Indenture are received, up to $250mm aggregate principal amount of Superior second lien secured notes due 2027 North America Services Superior Energy Services (Remainco) 1 2 TTM Revenue : $621 mm TTM Revenue : $806mm Geographies: 1 country Geographies: ~50 countries § US & GOM core service lines§ Global market leading brands § Production & completion oriented services§ Global, offshore & U.S. onshore operations § Minimal capital intensity§ Moderate capital intensity § Consolidation platform§ Organic and inorganic growth strategies Note: PumpCo assets will remain with Superior Energy Services. 1 Pro Forma revenue based on trailing twelve months from October 2018 to September 2019, excludes revenue from divested drilling rigs and revenue associated with Forbes. 2 Pro Forma revenue based on trailing twelve months from October 2018 to September 2019, excluding North America Services and PumpCo. *Refer to Appendix for relevant Regulation G reconciliation 3
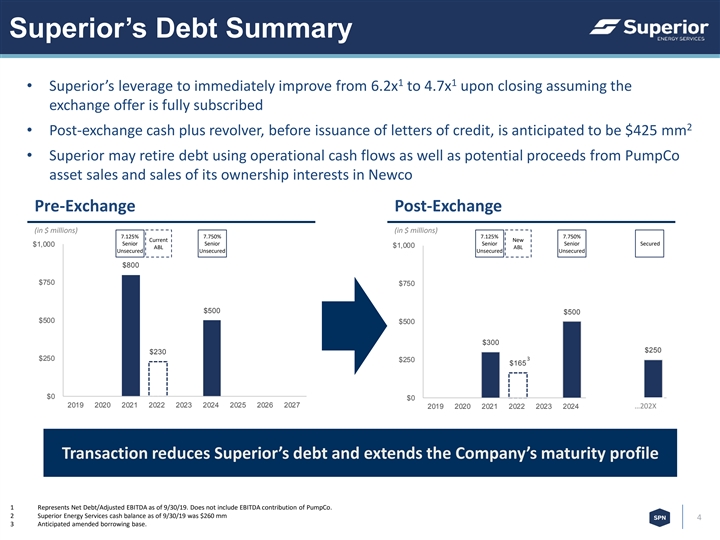
Superior’s Debt Summary 1 1 • Superior’s leverage to immediately improve from 6.2x to 4.7x upon closing assuming the exchange offer is fully subscribed 2 • Post-exchange cash plus revolver, before issuance of letters of credit, is anticipated to be $425 mm • Superior may retire debt using operational cash flows as well as potential proceeds from PumpCo asset sales and sales of its ownership interests in Newco Pre-Exchange Post-Exchange (in $ millions) (in $ millions) 7.125% 7.750% 7.125% 7.750% Current New Senior Senior Senior Senior Secured $1,000 $1,000 ABL ABL Unsecured Unsecured Unsecured Unsecured $800 $750 $750 $500 $500 $500 $500 $300 $250 $230 $250 3 $250 $165 $0 $0 2019 2020 2021 2022 2023 2024 2025 2026 2027 2019 2020 2021 2022 2023 2024 2025 2026 …220 0227 X Transaction reduces Superior’s debt and extends the Company’s maturity profile 1 Represents Net Debt/Adjusted EBITDA as of 9/30/19. Does not include EBITDA contribution of PumpCo. 2 Superior Energy Services cash balance as of 9/30/19 was $260 mm 4 3 Anticipated amended borrowing base.Superior’s Debt Summary 1 1 • Superior’s leverage to immediately improve from 6.2x to 4.7x upon closing assuming the exchange offer is fully subscribed 2 • Post-exchange cash plus revolver, before issuance of letters of credit, is anticipated to be $425 mm • Superior may retire debt using operational cash flows as well as potential proceeds from PumpCo asset sales and sales of its ownership interests in Newco Pre-Exchange Post-Exchange (in $ millions) (in $ millions) 7.125% 7.750% 7.125% 7.750% Current New Senior Senior Senior Senior Secured $1,000 $1,000 ABL ABL Unsecured Unsecured Unsecured Unsecured $800 $750 $750 $500 $500 $500 $500 $300 $250 $230 $250 3 $250 $165 $0 $0 2019 2020 2021 2022 2023 2024 2025 2026 2027 2019 2020 2021 2022 2023 2024 2025 2026 …220 0227 X Transaction reduces Superior’s debt and extends the Company’s maturity profile 1 Represents Net Debt/Adjusted EBITDA as of 9/30/19. Does not include EBITDA contribution of PumpCo. 2 Superior Energy Services cash balance as of 9/30/19 was $260 mm 4 3 Anticipated amended borrowing base.

Transaction OverviewTransaction Overview

Newco Transformative Combination Creating a leading provider of U.S. completion, production & water solutions § Superior Energy Services to combine its North America services 1 businesses (“NAM”) with Forbes Energy Services (“Forbes”) in $831 mm an all-stock combination (the combined businesses, collectively, 2 TTM Q3’19 Revenue “Newco”) § Creates a leading, public U.S. onshore consolidator of production, completion and fluids solutions § ~3,500 employees operating five service lines within six major basins; ~50% TTM Q3 2019 revenue derived from post- completion services $77 mm 3 TTM Q3’19 Adjusted EBITDA § Complimentary platforms expected to drive $23 mm of identified annualized synergies § Superior will receive 49.9% of Newco’s issued and outstanding voting Class A common stock, and 100% of Newco’s issued and outstanding non-voting Class B common stock, which will 54% collectively represent an approximate 65% economic interest in TTM Q3’19 Free Cash Flow Newco, and a 52% economic interest in Newco after giving 4 Conversion effect to the mandatory preferred shares 1 Forbes is listed on the OTCMKTS under ticker: FLSS. 2 Pro Forma revenue based on trailing twelve months from October 2018 to September 2019, including revenue associated with Forbes but excluding revenue from divested drilling rigs. 3 Pro Forma is burdened with corporate G&A allocation of $34 mm from NAM and $14 mm from Forbes. 4 Free Cash Flow conversion defined as (Adjusted EBITDA less capex) divided by Adjusted EBITDA. 6 *Refer to Appendix for relevant Regulation G reconciliationNewco Transformative Combination Creating a leading provider of U.S. completion, production & water solutions § Superior Energy Services to combine its North America services 1 businesses (“NAM”) with Forbes Energy Services (“Forbes”) in $831 mm an all-stock combination (the combined businesses, collectively, 2 TTM Q3’19 Revenue “Newco”) § Creates a leading, public U.S. onshore consolidator of production, completion and fluids solutions § ~3,500 employees operating five service lines within six major basins; ~50% TTM Q3 2019 revenue derived from post- completion services $77 mm 3 TTM Q3’19 Adjusted EBITDA § Complimentary platforms expected to drive $23 mm of identified annualized synergies § Superior will receive 49.9% of Newco’s issued and outstanding voting Class A common stock, and 100% of Newco’s issued and outstanding non-voting Class B common stock, which will 54% collectively represent an approximate 65% economic interest in TTM Q3’19 Free Cash Flow Newco, and a 52% economic interest in Newco after giving 4 Conversion effect to the mandatory preferred shares 1 Forbes is listed on the OTCMKTS under ticker: FLSS. 2 Pro Forma revenue based on trailing twelve months from October 2018 to September 2019, including revenue associated with Forbes but excluding revenue from divested drilling rigs. 3 Pro Forma is burdened with corporate G&A allocation of $34 mm from NAM and $14 mm from Forbes. 4 Free Cash Flow conversion defined as (Adjusted EBITDA less capex) divided by Adjusted EBITDA. 6 *Refer to Appendix for relevant Regulation G reconciliation
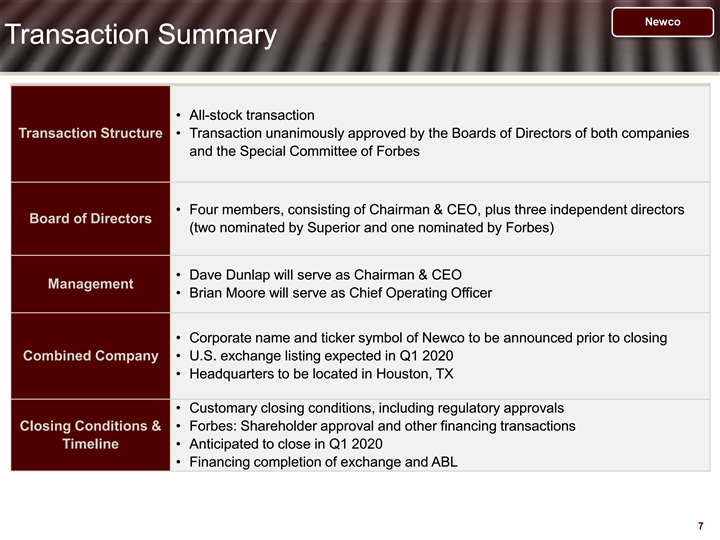
Newco Transaction Summary • All-stock transaction Transaction Structure • Transaction unanimously approved by the Boards of Directors of both companies and the Special Committee of Forbes • Four members, consisting of Chairman & CEO, plus three independent directors Board of Directors (two nominated by Superior and one nominated by Forbes) • Dave Dunlap will serve as Chairman & CEO Management • Brian Moore will serve as Chief Operating Officer • Corporate name and ticker symbol of Newco to be announced prior to closing Combined Company • U.S. exchange listing expected in Q1 2020 • Headquarters to be located in Houston, TX • Customary closing conditions, including regulatory approvals Closing Conditions & • Forbes: Shareholder approval and other financing transactions Timeline • Anticipated to close in Q1 2020 • Financing completion of exchange and ABL 7Newco Transaction Summary • All-stock transaction Transaction Structure • Transaction unanimously approved by the Boards of Directors of both companies and the Special Committee of Forbes • Four members, consisting of Chairman & CEO, plus three independent directors Board of Directors (two nominated by Superior and one nominated by Forbes) • Dave Dunlap will serve as Chairman & CEO Management • Brian Moore will serve as Chief Operating Officer • Corporate name and ticker symbol of Newco to be announced prior to closing Combined Company • U.S. exchange listing expected in Q1 2020 • Headquarters to be located in Houston, TX • Customary closing conditions, including regulatory approvals Closing Conditions & • Forbes: Shareholder approval and other financing transactions Timeline • Anticipated to close in Q1 2020 • Financing completion of exchange and ABL 7

Newco Creating a Leading U.S. Focused Services Platform Dollar amounts in millions TTM Q3’19 Revenue $1,378 $1,500 Peer Average: $620 1,200 $899 $831 900 $621 $587 $578 $548 600 $446 $342 $210 $180 300 -- WTTR NINE NewCo SPN-NAM PES KLXE QES KEG RNGR FLSS NES Newco (NAM) TTM Q3’19 EBITDA $200 Peer Average: $70 $175 1 Synergies 150 $127 $101 $100 2 100 $77 $67 $66 $50 50 $25 $18 $10 $1 -- WTTR NINE KLXE NewCo SPN-NAM PES RNGR QES NES FLSS KEG Newco (NAM) 3 FCF $33 $61 ($5) $42 $50 $7 $10 ($16) $8 ($2) ($25) FCF 3 19% 48% (5%) 54% 74% 11% 21% (65%) 46% (10%) NM Conversion Source: FactSet and Company filings. Note: Peer averages exclude Newco, Superior NAM and Forbes. 1 Identified expected annual synergies of $23 mm exclude one-time costs to achieve of ~$5 mm and transaction fees and expenses. 2 TTM EBITDA adjusted for estimated stand-alone corporate costs. 3 Free Cash Flow defined as Adjusted EBITDA less Capex. Free Cash Flow Conversion defined as Free Cash Flow divided by Adjusted EBITDA. 8 *Refer to Appendix for relevant Regulation G reconciliationNewco Creating a Leading U.S. Focused Services Platform Dollar amounts in millions TTM Q3’19 Revenue $1,378 $1,500 Peer Average: $620 1,200 $899 $831 900 $621 $587 $578 $548 600 $446 $342 $210 $180 300 -- WTTR NINE NewCo SPN-NAM PES KLXE QES KEG RNGR FLSS NES Newco (NAM) TTM Q3’19 EBITDA $200 Peer Average: $70 $175 1 Synergies 150 $127 $101 $100 2 100 $77 $67 $66 $50 50 $25 $18 $10 $1 -- WTTR NINE KLXE NewCo SPN-NAM PES RNGR QES NES FLSS KEG Newco (NAM) 3 FCF $33 $61 ($5) $42 $50 $7 $10 ($16) $8 ($2) ($25) FCF 3 19% 48% (5%) 54% 74% 11% 21% (65%) 46% (10%) NM Conversion Source: FactSet and Company filings. Note: Peer averages exclude Newco, Superior NAM and Forbes. 1 Identified expected annual synergies of $23 mm exclude one-time costs to achieve of ~$5 mm and transaction fees and expenses. 2 TTM EBITDA adjusted for estimated stand-alone corporate costs. 3 Free Cash Flow defined as Adjusted EBITDA less Capex. Free Cash Flow Conversion defined as Free Cash Flow divided by Adjusted EBITDA. 8 *Refer to Appendix for relevant Regulation G reconciliation

Newco Primary Newco Service Offerings and Key Brands Service Rigs Coiled Tubing Wireline • Provides well services, • Provides nitrogen, pumping and • Provides perforating, pipe snubbing, swabbing, and P&A plug drill-out services recovery, fishing, cased hole services • Pipe Sizes Ranging from 1 1/4” to wireline logging services and • 159 active rigs in six basins 2 5/8” Diameters P&A • TTM Q3’19 Revenue: $213 mm • TTM Q3’19 Revenue: $145 mm • 26 active E-line units • 70 active slickline units • TTM Q3’19 Revenue: $67 mm Fluid Management Rentals • Provides water transfer, disposal and • Provides flowback, accommodations, BOP’s specialty services and numerous other rentals • 684 total vacuum tractors and bobtails • Blowout preventor and accumulator packages • 191 total specialty units • Zipper and fracturing manifolds • 6,450 frac tanks • Flowback iron packages • 40 active salt water disposal wells • 1,050 accommodation units • TTM Q3’19 Revenue: $259 mm • TTM Q3’19 Revenue: $147 mm Note: Pro forma revenue based on trailing twelve months from October 2018 to September 2019, including revenue associated with Forbes but excluding revenue from divested drilling rigs. 9 *Refer to Appendix for relevant Regulation G reconciliationNewco Primary Newco Service Offerings and Key Brands Service Rigs Coiled Tubing Wireline • Provides well services, • Provides nitrogen, pumping and • Provides perforating, pipe snubbing, swabbing, and P&A plug drill-out services recovery, fishing, cased hole services • Pipe Sizes Ranging from 1 1/4” to wireline logging services and • 159 active rigs in six basins 2 5/8” Diameters P&A • TTM Q3’19 Revenue: $213 mm • TTM Q3’19 Revenue: $145 mm • 26 active E-line units • 70 active slickline units • TTM Q3’19 Revenue: $67 mm Fluid Management Rentals • Provides water transfer, disposal and • Provides flowback, accommodations, BOP’s specialty services and numerous other rentals • 684 total vacuum tractors and bobtails • Blowout preventor and accumulator packages • 191 total specialty units • Zipper and fracturing manifolds • 6,450 frac tanks • Flowback iron packages • 40 active salt water disposal wells • 1,050 accommodation units • TTM Q3’19 Revenue: $259 mm • TTM Q3’19 Revenue: $147 mm Note: Pro forma revenue based on trailing twelve months from October 2018 to September 2019, including revenue associated with Forbes but excluding revenue from divested drilling rigs. 9 *Refer to Appendix for relevant Regulation G reconciliation

Newco Newco at a Glance Services Overview Geographic Footprint § Leading provider of production (well services, fluid § Transaction significantly increases scale of services management and produced water) and completion across geographies (coiled tubing, wireline) solutions § Balanced across major basins – flexibility to adjust § Balanced exposure to shorter-cycle (completion) and people and equipment longer-cycle (production, P&A) activity TTM Q3’19 Revenue by Service TTM Q3’19 Revenue by Basin 8% 16% 18% 31% 17% 14% 22% 18% 5% 25% 26% Fluid Management Service Rigs Mid-Con South NE Rentals Coiled Tubing Rockies Offshore Permian Wireline 10Newco Newco at a Glance Services Overview Geographic Footprint § Leading provider of production (well services, fluid § Transaction significantly increases scale of services management and produced water) and completion across geographies (coiled tubing, wireline) solutions § Balanced across major basins – flexibility to adjust § Balanced exposure to shorter-cycle (completion) and people and equipment longer-cycle (production, P&A) activity TTM Q3’19 Revenue by Service TTM Q3’19 Revenue by Basin 8% 16% 18% 31% 17% 14% 22% 18% 5% 25% 26% Fluid Management Service Rigs Mid-Con South NE Rentals Coiled Tubing Rockies Offshore Permian Wireline 10
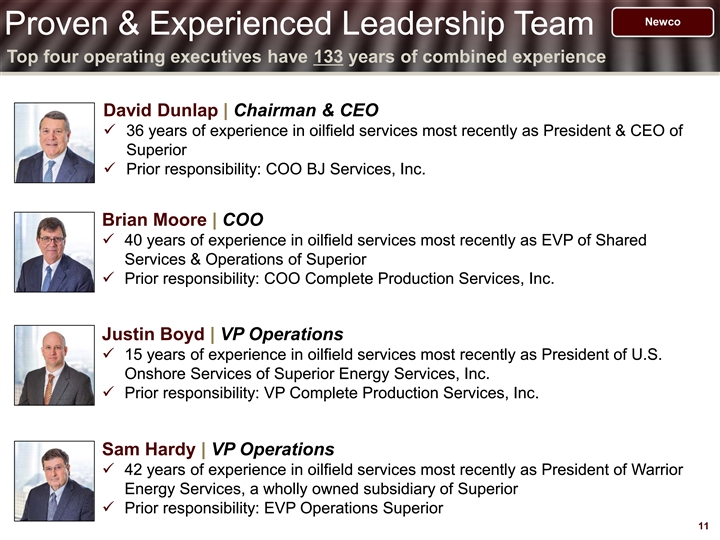
Newco Proven & Experienced Leadership Team Top four operating executives have 133 years of combined experience David Dunlap | Chairman & CEO ü 36 years of experience in oilfield services most recently as President & CEO of Superior ü Prior responsibility: COO BJ Services, Inc. Brian Moore | COO ü 40 years of experience in oilfield services most recently as EVP of Shared Services & Operations of Superior ü Prior responsibility: COO Complete Production Services, Inc. Justin Boyd | VP Operations ü 15 years of experience in oilfield services most recently as President of U.S. Onshore Services of Superior Energy Services, Inc. ü Prior responsibility: VP Complete Production Services, Inc. Sam Hardy | VP Operations ü 42 years of experience in oilfield services most recently as President of Warrior Energy Services, a wholly owned subsidiary of Superior ü Prior responsibility: EVP Operations Superior 11Newco Proven & Experienced Leadership Team Top four operating executives have 133 years of combined experience David Dunlap | Chairman & CEO ü 36 years of experience in oilfield services most recently as President & CEO of Superior ü Prior responsibility: COO BJ Services, Inc. Brian Moore | COO ü 40 years of experience in oilfield services most recently as EVP of Shared Services & Operations of Superior ü Prior responsibility: COO Complete Production Services, Inc. Justin Boyd | VP Operations ü 15 years of experience in oilfield services most recently as President of U.S. Onshore Services of Superior Energy Services, Inc. ü Prior responsibility: VP Complete Production Services, Inc. Sam Hardy | VP Operations ü 42 years of experience in oilfield services most recently as President of Warrior Energy Services, a wholly owned subsidiary of Superior ü Prior responsibility: EVP Operations Superior 11

Newco Strategic Philosophy Market & Operations Capital Deployment & Growth § Flat to further declining market § First mover for much needed consolidation environment § Predominately all equity deals § Fragmented and oversupplied market § Long life assets requiring minimal capital § Limited/no liquidity for PE-owned investment, resulting in consistent Free companies Cash Flow and expanding ROIC § Diversified product offering§ Creates a company of meaningful scale across the U.S § Laser focus on operational efficiencies § Consolidation cost savings § Impeccable operational and safety track § Desired service provider of larger operators records resulting in higher utilization § Practical application of analytical and intelligence systems & tools Capitalizing on Secular Market Dynamics 12Newco Strategic Philosophy Market & Operations Capital Deployment & Growth § Flat to further declining market § First mover for much needed consolidation environment § Predominately all equity deals § Fragmented and oversupplied market § Long life assets requiring minimal capital § Limited/no liquidity for PE-owned investment, resulting in consistent Free companies Cash Flow and expanding ROIC § Diversified product offering§ Creates a company of meaningful scale across the U.S § Laser focus on operational efficiencies § Consolidation cost savings § Impeccable operational and safety track § Desired service provider of larger operators records resulting in higher utilization § Practical application of analytical and intelligence systems & tools Capitalizing on Secular Market Dynamics 12

Newco Consistent Free Cash Flow Generation Dollar amounts in millions 1 NAM Historical Free Cash Flow 2 Conversion : 60% 31% 74% $50 100% $40 80% Superior management has demonstrated a track record of $30 60% $50 generating consistent Free Cash Flow with these assets despite a $20 40% volatile market environment $10 20% $15 $12 -- 0% 2017A 2018A TTM Q3'19 2 Free Cash Flow Free Cash Flow Conversion 1 Free Cash Flow defined as Adjusted EBITDA less capex. 2 Free Cash Flow conversion defined as Free Cash Flow divided by Adjusted EBITDA. 13 *Please see the Appendix for a reconciliation of Free Cash Flow to its nearest GAAP measure.Newco Consistent Free Cash Flow Generation Dollar amounts in millions 1 NAM Historical Free Cash Flow 2 Conversion : 60% 31% 74% $50 100% $40 80% Superior management has demonstrated a track record of $30 60% $50 generating consistent Free Cash Flow with these assets despite a $20 40% volatile market environment $10 20% $15 $12 -- 0% 2017A 2018A TTM Q3'19 2 Free Cash Flow Free Cash Flow Conversion 1 Free Cash Flow defined as Adjusted EBITDA less capex. 2 Free Cash Flow conversion defined as Free Cash Flow divided by Adjusted EBITDA. 13 *Please see the Appendix for a reconciliation of Free Cash Flow to its nearest GAAP measure.
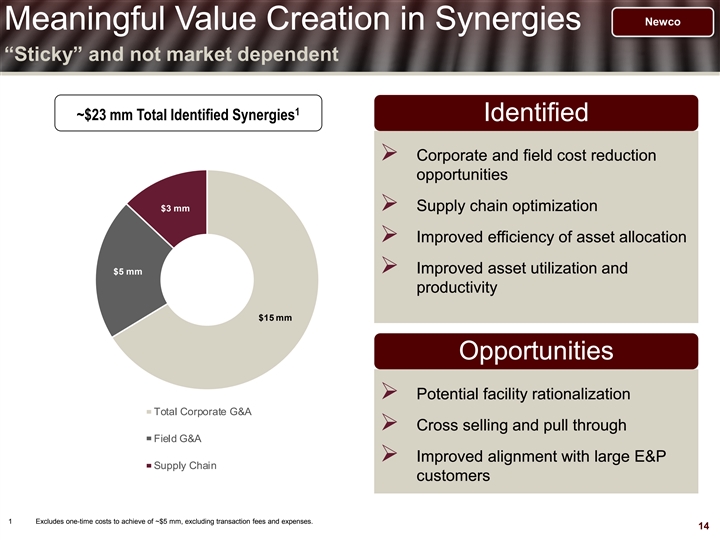
Newco Meaningful Value Creation in Synergies “Sticky” and not market dependent 1 ~$23 mm Total Identified Synergies Identified Ø Corporate and field cost reduction opportunities $3 mmØ Supply chain optimization Ø Improved efficiency of asset allocation Ø Improved asset utilization and $5 mm productivity $15 mm Opportunities Ø Potential facility rationalization Total Corporate G&A Ø Cross selling and pull through Field G&A Ø Improved alignment with large E&P Supply Chain customers 1 Excludes one-time costs to achieve of ~$5 mm, excluding transaction fees and expenses. 14Newco Meaningful Value Creation in Synergies “Sticky” and not market dependent 1 ~$23 mm Total Identified Synergies Identified Ø Corporate and field cost reduction opportunities $3 mmØ Supply chain optimization Ø Improved efficiency of asset allocation Ø Improved asset utilization and $5 mm productivity $15 mm Opportunities Ø Potential facility rationalization Total Corporate G&A Ø Cross selling and pull through Field G&A Ø Improved alignment with large E&P Supply Chain customers 1 Excludes one-time costs to achieve of ~$5 mm, excluding transaction fees and expenses. 14

1515

Market Leading, Global Franchises Brands Value-added engineering services and high- specification premium downhole tubular and accessory rentals Design, engineering, manufacturing and rental of premium bottom hole assemblies Engineering, risk management, well control and training solutions Hydraulic workover and snubbing services Design, engineering and manufacturing of premium sand control tools 16 Note: PumpCo remains a wholly owned subsidiary but will be captured in discontinued operationsMarket Leading, Global Franchises Brands Value-added engineering services and high- specification premium downhole tubular and accessory rentals Design, engineering, manufacturing and rental of premium bottom hole assemblies Engineering, risk management, well control and training solutions Hydraulic workover and snubbing services Design, engineering and manufacturing of premium sand control tools 16 Note: PumpCo remains a wholly owned subsidiary but will be captured in discontinued operations

Compelling Attributes TTM 3Q’19 Revenue by Business Market and technology leading global brands that are highly mobile and competitively Completion and Production Down Hole advantaged Services Drilling Tools 34% 40% Managed capital intensity with Well Control Services Completion organic and inorganic growth 13% Tools 13% strategies TTM 3Q’19 Revenue by Region Consistent thru-cycle Free Cash Flow provides solid financial footing US Land 28% International Will maximize potential of current 45% franchises while evaluating GOM investments in new technologies 27% and platforms 17Compelling Attributes TTM 3Q’19 Revenue by Business Market and technology leading global brands that are highly mobile and competitively Completion and Production Down Hole advantaged Services Drilling Tools 34% 40% Managed capital intensity with Well Control Services Completion organic and inorganic growth 13% Tools 13% strategies TTM 3Q’19 Revenue by Region Consistent thru-cycle Free Cash Flow provides solid financial footing US Land 28% International Will maximize potential of current 45% franchises while evaluating GOM investments in new technologies 27% and platforms 17

Consistent Historical Free Cash Flow Dollar amounts in millions 1 1 Historical EBITDA & Capex $533 $339 $229 $226 $203 $134 $140 $119 $75 $71 $43 $37 2014 2015 2016 2017 2018 TTM Q3'19 2 EBITDA CAPEX 1 Only includes Workstrings, Stabil Drill, Wild Well Control, ISS and Completion Services. 18 2 Does not include corporate overhead. *Please see the Appendix for a reconciliation of Adjusted EBITDA to its nearest GAAP measure.Consistent Historical Free Cash Flow Dollar amounts in millions 1 1 Historical EBITDA & Capex $533 $339 $229 $226 $203 $134 $140 $119 $75 $71 $43 $37 2014 2015 2016 2017 2018 TTM Q3'19 2 EBITDA CAPEX 1 Only includes Workstrings, Stabil Drill, Wild Well Control, ISS and Completion Services. 18 2 Does not include corporate overhead. *Please see the Appendix for a reconciliation of Adjusted EBITDA to its nearest GAAP measure.
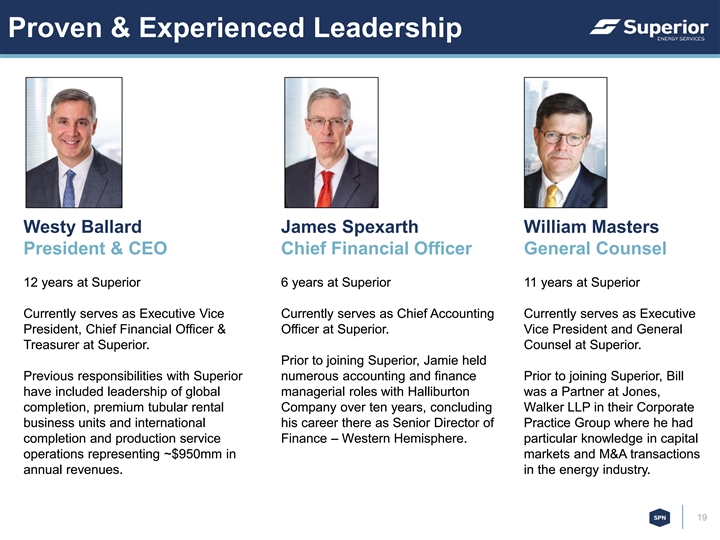
Proven & Experienced Leadership Westy Ballard James Spexarth William Masters President & CEO Chief Financial Officer General Counsel 12 years at Superior 6 years at Superior 11 years at Superior Currently serves as Executive Vice Currently serves as Chief Accounting Currently serves as Executive President, Chief Financial Officer & Officer at Superior. Vice President and General Treasurer at Superior. Counsel at Superior. Prior to joining Superior, Jamie held Previous responsibilities with Superior numerous accounting and finance Prior to joining Superior, Bill have included leadership of global managerial roles with Halliburton was a Partner at Jones, completion, premium tubular rental Company over ten years, concluding Walker LLP in their Corporate business units and international his career there as Senior Director of Practice Group where he had completion and production service Finance – Western Hemisphere. particular knowledge in capital operations representing ~$950mm in markets and M&A transactions annual revenues. in the energy industry. 19Proven & Experienced Leadership Westy Ballard James Spexarth William Masters President & CEO Chief Financial Officer General Counsel 12 years at Superior 6 years at Superior 11 years at Superior Currently serves as Executive Vice Currently serves as Chief Accounting Currently serves as Executive President, Chief Financial Officer & Officer at Superior. Vice President and General Treasurer at Superior. Counsel at Superior. Prior to joining Superior, Jamie held Previous responsibilities with Superior numerous accounting and finance Prior to joining Superior, Bill have included leadership of global managerial roles with Halliburton was a Partner at Jones, completion, premium tubular rental Company over ten years, concluding Walker LLP in their Corporate business units and international his career there as Senior Director of Practice Group where he had completion and production service Finance – Western Hemisphere. particular knowledge in capital operations representing ~$950mm in markets and M&A transactions annual revenues. in the energy industry. 19

Key Peer Benchmarking TTM 3Q’19 EBITDA Margin Median: 12.5% 30% 23.3% 20.8% 19.8% 20% 17.3% 15.8% 12.5% 11.4% 10.1% 10% 6.9% 6.8% 0% APY RemainCo SLB-US CLB HAL-US BKR-US OII OIS DRQ FI Remainco 1 TTM 3Q’19 FCF Conversion 100% 84.3% 90% 79.9% Median: 52.4% 80% 68.2% 70% 59.2% 55.8% 60% 52.4% 49.8% 50% 41.1% 40% 31.4% 30% 20% 10% (74%) 0% APY CLB SLB-US BKR-US RemainCo HAL-US DRQ OIS OII FI Remainco Source: FactSet and Company filings. Note: Median excludes Remainco. 20 1 FCF Conversion defined as (EBITDA less Capex) divided by EBITDA.Key Peer Benchmarking TTM 3Q’19 EBITDA Margin Median: 12.5% 30% 23.3% 20.8% 19.8% 20% 17.3% 15.8% 12.5% 11.4% 10.1% 10% 6.9% 6.8% 0% APY RemainCo SLB-US CLB HAL-US BKR-US OII OIS DRQ FI Remainco 1 TTM 3Q’19 FCF Conversion 100% 84.3% 90% 79.9% Median: 52.4% 80% 68.2% 70% 59.2% 55.8% 60% 52.4% 49.8% 50% 41.1% 40% 31.4% 30% 20% 10% (74%) 0% APY CLB SLB-US BKR-US RemainCo HAL-US DRQ OIS OII FI Remainco Source: FactSet and Company filings. Note: Median excludes Remainco. 20 1 FCF Conversion defined as (EBITDA less Capex) divided by EBITDA.
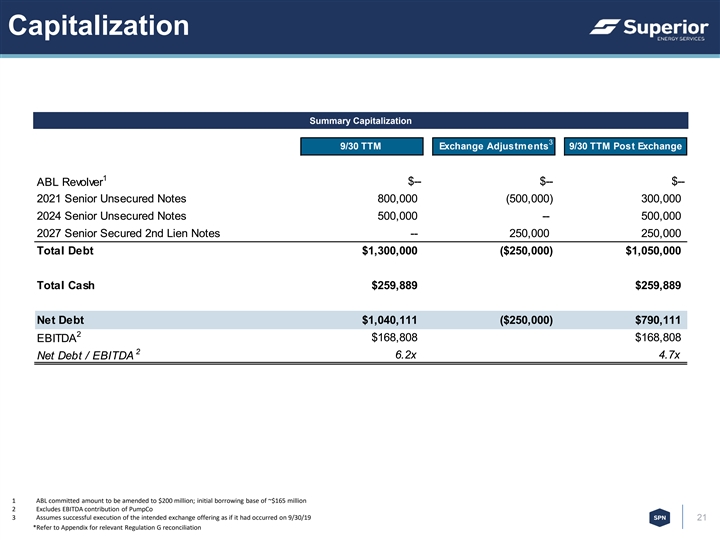
Capitalization Summary Capitalization 3 9/30 TTM Exchange Adjustments 9/30 TTM Post Exchange 1 $-- $-- $-- ABL Revolver 2021 Senior Unsecured Notes 800,000 (500,000) 300,000 2024 Senior Unsecured Notes 500,000 -- 500,000 2027 Senior Secured 2nd Lien Notes -- 250,000 250,000 Total Debt $1,300,000 ($250,000) $1,050,000 Total Cash $259,889 $259,889 Net Debt $1,040,111 ($250,000) $790,111 2 $168,808 $168,808 EBITDA 2 6.2x 4.7x Net Debt / EBITDA 1 ABL committed amount to be amended to $200 million; initial borrowing base of ~$165 million 2 Excludes EBITDA contribution of PumpCo 3 Assumes successful execution of the intended exchange offering as if it had occurred on 9/30/19 21 *Refer to Appendix for relevant Regulation G reconciliationCapitalization Summary Capitalization 3 9/30 TTM Exchange Adjustments 9/30 TTM Post Exchange 1 $-- $-- $-- ABL Revolver 2021 Senior Unsecured Notes 800,000 (500,000) 300,000 2024 Senior Unsecured Notes 500,000 -- 500,000 2027 Senior Secured 2nd Lien Notes -- 250,000 250,000 Total Debt $1,300,000 ($250,000) $1,050,000 Total Cash $259,889 $259,889 Net Debt $1,040,111 ($250,000) $790,111 2 $168,808 $168,808 EBITDA 2 6.2x 4.7x Net Debt / EBITDA 1 ABL committed amount to be amended to $200 million; initial borrowing base of ~$165 million 2 Excludes EBITDA contribution of PumpCo 3 Assumes successful execution of the intended exchange offering as if it had occurred on 9/30/19 21 *Refer to Appendix for relevant Regulation G reconciliation

Appendix Appendix

Adjusted EBITDA & FCF Reconciliation Pro Forma RemainCo For the nine months ended September 30, 2019 (unaudited) Historical Pro Forma (in thousands) Less: Pumpco Pro Forma Superior Energy Less: NAM Energy Services Adjustments RemainCo Revenues $ 1 ,329,208 $ (484,392) $ (239,911) $ - $ 6 04,905 Cost of services and rentals (exclusive of depreciation, depletion, amortization and accretion) 9 20,797 (366,344) (219,285) - 3 35,168 Depreciation, depletion, amortization and accretion 2 25,046 (56,097) (72,271) - 9 6,678 General and administrative expenses 2 08,597 (61,936) (5,582) - 1 41,079 Reduction in value of assets 4 0,952 (10,119) (23,825) - 7 ,008 Loss from operations (66,184) 1 0,104 8 1,052 - 2 4,972 Other expense: Interest expense, net (74,275) - - (1,641) (75,916) Equity in losses of NewCo - - - (40,919) (40,919) Other, net (4,476) 3 98 - - (4,078) Loss from continuing operations before taxes (144,935) 1 0,502 8 1,052 (42,560) (95,941) Income taxes 1 2,261 (9,524) 1 0,537 (5,533) 7 ,741 Net loss from continuing operations (157,196) 2 0,026 7 0,515 (37,027) (103,682) Loss from discontinued operations - - (70,515) - (70,515) Net income (loss) $ (157,196) $ 2 0,026 $ - $ (37,027) $ (174,197) Net loss from continuing operations $ (103,682) Depreciation, depletion, amortization and accretion 9 6,678 Reduction in value of assets 7 ,008 Interest expense, net 7 5,916 Equity in losses of NewCo 4 0,919 Other, net 4 ,078 Income taxes 7 ,741 Adjusted EBITDA $ 1 28,658 CapEx $ (62,572) Free cash flow $ 6 6,086 23Adjusted EBITDA & FCF Reconciliation Pro Forma RemainCo For the nine months ended September 30, 2019 (unaudited) Historical Pro Forma (in thousands) Less: Pumpco Pro Forma Superior Energy Less: NAM Energy Services Adjustments RemainCo Revenues $ 1 ,329,208 $ (484,392) $ (239,911) $ - $ 6 04,905 Cost of services and rentals (exclusive of depreciation, depletion, amortization and accretion) 9 20,797 (366,344) (219,285) - 3 35,168 Depreciation, depletion, amortization and accretion 2 25,046 (56,097) (72,271) - 9 6,678 General and administrative expenses 2 08,597 (61,936) (5,582) - 1 41,079 Reduction in value of assets 4 0,952 (10,119) (23,825) - 7 ,008 Loss from operations (66,184) 1 0,104 8 1,052 - 2 4,972 Other expense: Interest expense, net (74,275) - - (1,641) (75,916) Equity in losses of NewCo - - - (40,919) (40,919) Other, net (4,476) 3 98 - - (4,078) Loss from continuing operations before taxes (144,935) 1 0,502 8 1,052 (42,560) (95,941) Income taxes 1 2,261 (9,524) 1 0,537 (5,533) 7 ,741 Net loss from continuing operations (157,196) 2 0,026 7 0,515 (37,027) (103,682) Loss from discontinued operations - - (70,515) - (70,515) Net income (loss) $ (157,196) $ 2 0,026 $ - $ (37,027) $ (174,197) Net loss from continuing operations $ (103,682) Depreciation, depletion, amortization and accretion 9 6,678 Reduction in value of assets 7 ,008 Interest expense, net 7 5,916 Equity in losses of NewCo 4 0,919 Other, net 4 ,078 Income taxes 7 ,741 Adjusted EBITDA $ 1 28,658 CapEx $ (62,572) Free cash flow $ 6 6,086 23
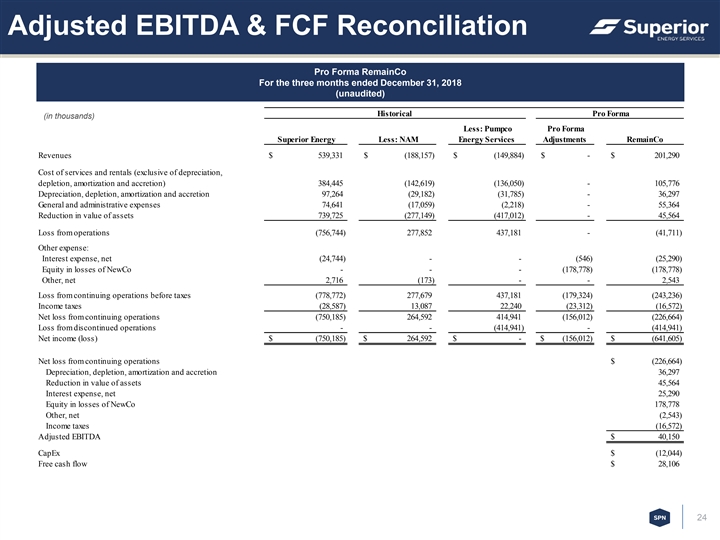
Adjusted EBITDA & FCF Reconciliation Pro Forma RemainCo For the three months ended December 31, 2018 (unaudited) Historical Pro Forma (in thousands) Less: Pumpco Pro Forma Superior Energy Less: NAM Energy Services Adjustments RemainCo Revenues $ 5 39,331 $ (188,157) $ (149,884) $ - $ 2 01,290 Cost of services and rentals (exclusive of depreciation, depletion, amortization and accretion) 3 84,445 (142,619) (136,050) - 1 05,776 Depreciation, depletion, amortization and accretion 9 7,264 (29,182) (31,785) - 3 6,297 General and administrative expenses 7 4,641 (17,059) (2,218) - 5 5,364 Reduction in value of assets 7 39,725 (277,149) (417,012) - 4 5,564 Loss from operations (756,744) 2 77,852 4 37,181 - (41,711) Other expense: Interest expense, net (24,744) - - (546) (25,290) Equity in losses of NewCo - - - (178,778) (178,778) Other, net 2 ,716 (173) - - 2 ,543 Loss from continuing operations before taxes (778,772) 2 77,679 4 37,181 (179,324) (243,236) Income taxes (28,587) 1 3,087 2 2,240 (23,312) (16,572) Net loss from continuing operations (750,185) 2 64,592 4 14,941 (156,012) (226,664) Loss from discontinued operations - - (414,941) - (414,941) Net income (loss) $ (750,185) $ 2 64,592 $ - $ (156,012) $ (641,605) Net loss from continuing operations $ (226,664) Depreciation, depletion, amortization and accretion 3 6,297 Reduction in value of assets 4 5,564 Interest expense, net 2 5,290 Equity in losses of NewCo 1 78,778 Other, net (2,543) Income taxes (16,572) Adjusted EBITDA $ 4 0,150 CapEx $ (12,044) Free cash flow $ 2 8,106 24Adjusted EBITDA & FCF Reconciliation Pro Forma RemainCo For the three months ended December 31, 2018 (unaudited) Historical Pro Forma (in thousands) Less: Pumpco Pro Forma Superior Energy Less: NAM Energy Services Adjustments RemainCo Revenues $ 5 39,331 $ (188,157) $ (149,884) $ - $ 2 01,290 Cost of services and rentals (exclusive of depreciation, depletion, amortization and accretion) 3 84,445 (142,619) (136,050) - 1 05,776 Depreciation, depletion, amortization and accretion 9 7,264 (29,182) (31,785) - 3 6,297 General and administrative expenses 7 4,641 (17,059) (2,218) - 5 5,364 Reduction in value of assets 7 39,725 (277,149) (417,012) - 4 5,564 Loss from operations (756,744) 2 77,852 4 37,181 - (41,711) Other expense: Interest expense, net (24,744) - - (546) (25,290) Equity in losses of NewCo - - - (178,778) (178,778) Other, net 2 ,716 (173) - - 2 ,543 Loss from continuing operations before taxes (778,772) 2 77,679 4 37,181 (179,324) (243,236) Income taxes (28,587) 1 3,087 2 2,240 (23,312) (16,572) Net loss from continuing operations (750,185) 2 64,592 4 14,941 (156,012) (226,664) Loss from discontinued operations - - (414,941) - (414,941) Net income (loss) $ (750,185) $ 2 64,592 $ - $ (156,012) $ (641,605) Net loss from continuing operations $ (226,664) Depreciation, depletion, amortization and accretion 3 6,297 Reduction in value of assets 4 5,564 Interest expense, net 2 5,290 Equity in losses of NewCo 1 78,778 Other, net (2,543) Income taxes (16,572) Adjusted EBITDA $ 4 0,150 CapEx $ (12,044) Free cash flow $ 2 8,106 24

Adjusted EBITDA & FCF Reconciliation Pro Forma RemainCo For the twelve months ended September 30, 2019 (unaudited) Historical Pro Forma (in thousands) Less: Pumpco Pro Forma Superior Energy Less: NAM Energy Services Adjustments RemainCo Revenues $ 1 ,868,539 $ (672,549) $ (389,795) $ - $ 8 06,195 Cost of services and rentals (exclusive of depreciation, depletion, amortization and accretion) 1 ,305,242 (508,963) (355,335) - 4 40,944 Depreciation, depletion, amortization and accretion 3 22,310 (85,279) (104,056) - 1 32,975 General and administrative expenses 283,238 (78,995) (7,800) - 1 96,443 Reduction in value of assets 7 80,677 (287,268) (440,837) - 5 2,572 Loss from operations (822,928) 287,956 5 18,233 - (16,739) Other expense: Interest expense, net (99,019) - - (2,187) (101,206) Equity in losses of NewCo - - - (219,696) (219,696) Other, net (1,760) 2 25 - - (1,535) Loss from continuing operations before taxes (923,707) 2 88,181 5 18,233 (221,883) (339,176) Income taxes (16,326) 3,563 32,777 (28,845) 20,014 Net loss from continuing operations (907,381) 284,618 4 85,456 (193,038) (359,190) Loss from discontinued operations - - (485,456) - (485,456) Net income (loss) $ (907,381) $ 284,618 $ - $ (193,038) $ (844,646) Net loss from continuing operations $ (359,190) Depreciation, depletion, amortization and accretion 1 32,975 Reduction in value of assets 52,572 Interest expense, net 1 01,206 Equity in losses of NewCo 2 19,696 Other, net 1 ,535 Income taxes 2 0,014 Adjusted EBITDA $ 1 68,808 CapEx $ (74,616) Free cash flow $ 9 4,192 25Adjusted EBITDA & FCF Reconciliation Pro Forma RemainCo For the twelve months ended September 30, 2019 (unaudited) Historical Pro Forma (in thousands) Less: Pumpco Pro Forma Superior Energy Less: NAM Energy Services Adjustments RemainCo Revenues $ 1 ,868,539 $ (672,549) $ (389,795) $ - $ 8 06,195 Cost of services and rentals (exclusive of depreciation, depletion, amortization and accretion) 1 ,305,242 (508,963) (355,335) - 4 40,944 Depreciation, depletion, amortization and accretion 3 22,310 (85,279) (104,056) - 1 32,975 General and administrative expenses 283,238 (78,995) (7,800) - 1 96,443 Reduction in value of assets 7 80,677 (287,268) (440,837) - 5 2,572 Loss from operations (822,928) 287,956 5 18,233 - (16,739) Other expense: Interest expense, net (99,019) - - (2,187) (101,206) Equity in losses of NewCo - - - (219,696) (219,696) Other, net (1,760) 2 25 - - (1,535) Loss from continuing operations before taxes (923,707) 2 88,181 5 18,233 (221,883) (339,176) Income taxes (16,326) 3,563 32,777 (28,845) 20,014 Net loss from continuing operations (907,381) 284,618 4 85,456 (193,038) (359,190) Loss from discontinued operations - - (485,456) - (485,456) Net income (loss) $ (907,381) $ 284,618 $ - $ (193,038) $ (844,646) Net loss from continuing operations $ (359,190) Depreciation, depletion, amortization and accretion 1 32,975 Reduction in value of assets 52,572 Interest expense, net 1 01,206 Equity in losses of NewCo 2 19,696 Other, net 1 ,535 Income taxes 2 0,014 Adjusted EBITDA $ 1 68,808 CapEx $ (74,616) Free cash flow $ 9 4,192 25

Adjusted EBITDA & FCF Reconciliation Pro Forma NewCo For the nine months ended September 30, 2019 (unaudited) Historical Pro Forma (in thousands) Pro Forma NAM Drilling Rigs Forbes Adjustments NewCo Revenues $ 484,392 $ (32,831) $ 153,647 $ - $ 6 05,208 Cost of services and rentals (exclusive of depreciation, amortization and accretion) 366,344 (27,396) 128,397 - 4 67,345 Depreciation, amortization and accretion 56,097 (6,421) 2 2,935 - 7 2,611 General and administrative expenses 61,936 (1,692) 17,486 - 7 7,730 Reduction in value of assets 10,119 (7,556) 19,222 - 21,785 Loss from operations (10,104) 10,234 (34,393) - (34,263) Other expense: Interest expense, net - - (19,093) 2 ,303 (16,790) Other, net ( 398) - - - (398) Loss from continuing operations before taxes (10,502) 10,234 (53,486) 2 ,303 (51,451) Income taxes 9,524 1,842 (27) 1 61 11,500 Net loss $ ( 20,026) $ 8,392 $ (53,459) $ 2,142 $ (62,951) Net loss $ (62,951) Depreciation, amortization and accretion 7 2,611 Reduction in value of assets 2 1,785 Gains on sales of assets (14,090) Restructuring costs 3,675 Interest expense, net 16,790 Other, net 398 Income taxes 11,500 Adjusted EBITDA $ 4 9,718 CapEx $ (5,827) Free cash flow $ 4 3,891 26Adjusted EBITDA & FCF Reconciliation Pro Forma NewCo For the nine months ended September 30, 2019 (unaudited) Historical Pro Forma (in thousands) Pro Forma NAM Drilling Rigs Forbes Adjustments NewCo Revenues $ 484,392 $ (32,831) $ 153,647 $ - $ 6 05,208 Cost of services and rentals (exclusive of depreciation, amortization and accretion) 366,344 (27,396) 128,397 - 4 67,345 Depreciation, amortization and accretion 56,097 (6,421) 2 2,935 - 7 2,611 General and administrative expenses 61,936 (1,692) 17,486 - 7 7,730 Reduction in value of assets 10,119 (7,556) 19,222 - 21,785 Loss from operations (10,104) 10,234 (34,393) - (34,263) Other expense: Interest expense, net - - (19,093) 2 ,303 (16,790) Other, net ( 398) - - - (398) Loss from continuing operations before taxes (10,502) 10,234 (53,486) 2 ,303 (51,451) Income taxes 9,524 1,842 (27) 1 61 11,500 Net loss $ ( 20,026) $ 8,392 $ (53,459) $ 2,142 $ (62,951) Net loss $ (62,951) Depreciation, amortization and accretion 7 2,611 Reduction in value of assets 2 1,785 Gains on sales of assets (14,090) Restructuring costs 3,675 Interest expense, net 16,790 Other, net 398 Income taxes 11,500 Adjusted EBITDA $ 4 9,718 CapEx $ (5,827) Free cash flow $ 4 3,891 26
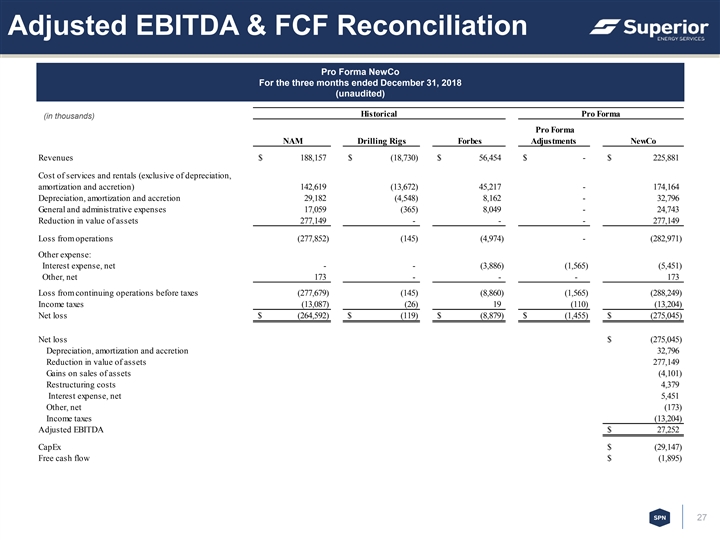
Adjusted EBITDA & FCF Reconciliation Pro Forma NewCo For the three months ended December 31, 2018 (unaudited) Historical Pro Forma (in thousands) Pro Forma NAM Drilling Rigs Forbes Adjustments NewCo Revenues $ 1 88,157 $ (18,730) $ 5 6,454 $ - $ 2 25,881 Cost of services and rentals (exclusive of depreciation, amortization and accretion) 142,619 (13,672) 4 5,217 - 1 74,164 Depreciation, amortization and accretion 29,182 (4,548) 8 ,162 - 3 2,796 General and administrative expenses 17,059 (365) 8 ,049 - 2 4,743 Reduction in value of assets 277,149 - - - 2 77,149 Loss from operations ( 277,852) (145) (4,974) - (282,971) Other expense: Interest expense, net - - (3,886) ( 1,565) (5,451) Other, net 173 - - - 1 73 Loss from continuing operations before taxes ( 277,679) (145) (8,860) ( 1,565) (288,249) Income taxes ( 13,087) (26) 1 9 ( 110) (13,204) Net loss $ ( 264,592) $ (119) $ (8,879) $ ( 1,455) $ (275,045) Net loss $ (275,045) Depreciation, amortization and accretion 3 2,796 Reduction in value of assets 2 77,149 Gains on sales of assets (4,101) Restructuring costs 4 ,379 Interest expense, net 5 ,451 Other, net (173) Income taxes (13,204) Adjusted EBITDA $ 2 7,252 CapEx $ (29,147) Free cash flow $ (1,895) 27Adjusted EBITDA & FCF Reconciliation Pro Forma NewCo For the three months ended December 31, 2018 (unaudited) Historical Pro Forma (in thousands) Pro Forma NAM Drilling Rigs Forbes Adjustments NewCo Revenues $ 1 88,157 $ (18,730) $ 5 6,454 $ - $ 2 25,881 Cost of services and rentals (exclusive of depreciation, amortization and accretion) 142,619 (13,672) 4 5,217 - 1 74,164 Depreciation, amortization and accretion 29,182 (4,548) 8 ,162 - 3 2,796 General and administrative expenses 17,059 (365) 8 ,049 - 2 4,743 Reduction in value of assets 277,149 - - - 2 77,149 Loss from operations ( 277,852) (145) (4,974) - (282,971) Other expense: Interest expense, net - - (3,886) ( 1,565) (5,451) Other, net 173 - - - 1 73 Loss from continuing operations before taxes ( 277,679) (145) (8,860) ( 1,565) (288,249) Income taxes ( 13,087) (26) 1 9 ( 110) (13,204) Net loss $ ( 264,592) $ (119) $ (8,879) $ ( 1,455) $ (275,045) Net loss $ (275,045) Depreciation, amortization and accretion 3 2,796 Reduction in value of assets 2 77,149 Gains on sales of assets (4,101) Restructuring costs 4 ,379 Interest expense, net 5 ,451 Other, net (173) Income taxes (13,204) Adjusted EBITDA $ 2 7,252 CapEx $ (29,147) Free cash flow $ (1,895) 27

Adjusted EBITDA & FCF Reconciliation Pro Forma NewCo For the twelve months ended September 30, 2019 (unaudited) Historical Pro Forma (in thousands) Pro Forma NAM Drilling Rigs Forbes Adjustments NewCo Revenues $ 6 72,549 $ (51,561) $ 210,101 $ - $ 8 31,089 Cost of services and rentals (exclusive of depreciation, amortization and accretion) 508,963 (41,068) 1 73,614 - 6 41,509 Depreciation, amortization and accretion 85,279 (10,969) 3 1,097 - 1 05,407 General and administrative expenses 78,995 (2,057) 2 5,535 - 1 02,473 Reduction in value of assets 287,268 (7,556) 1 9,222 - 2 98,934 Loss from operations ( 287,956) 10,089 (39,367) - (317,234) Other expense: Interest expense, net - - (22,979) 738 (22,241) Other, net ( 225) - - - (225) Loss from continuing operations before taxes ( 288,181) 1 0,089 (62,346) 738 (339,700) Income taxes ( 3,563) 1,816 (8) 52 (1,703) Net loss $ (284,618) $ 8,273 $ (62,338) $ 686 $ (337,997) Net loss $ (337,997) Depreciation, amortization and accretion 105,407 Reduction in value of assets 298,934 Gains on sales of assets (18,191) Restructuring costs 8 ,054 Interest expense, net 22,241 Other, net 2 25 Income taxes (1,703) Adjusted EBITDA $ 7 6,970 CapEx $ (34,974) Free cash flow $ 41,996 28Adjusted EBITDA & FCF Reconciliation Pro Forma NewCo For the twelve months ended September 30, 2019 (unaudited) Historical Pro Forma (in thousands) Pro Forma NAM Drilling Rigs Forbes Adjustments NewCo Revenues $ 6 72,549 $ (51,561) $ 210,101 $ - $ 8 31,089 Cost of services and rentals (exclusive of depreciation, amortization and accretion) 508,963 (41,068) 1 73,614 - 6 41,509 Depreciation, amortization and accretion 85,279 (10,969) 3 1,097 - 1 05,407 General and administrative expenses 78,995 (2,057) 2 5,535 - 1 02,473 Reduction in value of assets 287,268 (7,556) 1 9,222 - 2 98,934 Loss from operations ( 287,956) 10,089 (39,367) - (317,234) Other expense: Interest expense, net - - (22,979) 738 (22,241) Other, net ( 225) - - - (225) Loss from continuing operations before taxes ( 288,181) 1 0,089 (62,346) 738 (339,700) Income taxes ( 3,563) 1,816 (8) 52 (1,703) Net loss $ (284,618) $ 8,273 $ (62,338) $ 686 $ (337,997) Net loss $ (337,997) Depreciation, amortization and accretion 105,407 Reduction in value of assets 298,934 Gains on sales of assets (18,191) Restructuring costs 8 ,054 Interest expense, net 22,241 Other, net 2 25 Income taxes (1,703) Adjusted EBITDA $ 7 6,970 CapEx $ (34,974) Free cash flow $ 41,996 28

Revenue by Service Line Reconciliation Pro Forma NewCo For the twelve months ended September 30, 2019 (unaudited) Historical Pro Forma (in thousands) NAM Drilling Rigs Forbes NewCo Fluid Management $ 206,128 $ - $ 52, 547 $ 258,675 Service Rigs 116,502 - 96, 068 212,570 Coiled Tubing 83,771 - 61,486 145,257 Rentals 147,448 - - 147,448 Wireline 67,139 - - 67,139 Drilling 51,561 (51,561) - - Total $ 672,549 $ (51,561) $ 2 10,101 $ 8 31,089 Nine months ended September 30, 2019 Historical Pro Forma NAM Drilling Rigs Forbes NewCo Fluid Management $ 148,525 $ - $ 36, 294 $ 1 84,819 Service Rigs 88,661 - 73,653 162,314 Coiled Tubing 56,607 - 43,700 100,307 Rentals 107,349 - - 107,349 Wireline 50,419 - - 50,419 Drilling 32,831 (32,831) - - Total $ 484,392 $ (32,831) $ 1 53,647 $ 605,208 Three months ended December 31, 2018 Historical Pro Forma NAM Drilling Rigs Forbes NewCo Fluid Management $ 57,603 $ - $ 16, 253 $ 7 3,856 Service Rigs 27,841 - 22, 415 50,256 Coiled Tubing 27,164 - 17, 786 4 4,950 Rentals 40,099 - - 4 0,099 Wireline 16,720 - - 16,720 Drilling 18,730 (18,730) - - Total $ 188,157 $ (18,730) $ 56, 454 $ 225,881 29Revenue by Service Line Reconciliation Pro Forma NewCo For the twelve months ended September 30, 2019 (unaudited) Historical Pro Forma (in thousands) NAM Drilling Rigs Forbes NewCo Fluid Management $ 206,128 $ - $ 52, 547 $ 258,675 Service Rigs 116,502 - 96, 068 212,570 Coiled Tubing 83,771 - 61,486 145,257 Rentals 147,448 - - 147,448 Wireline 67,139 - - 67,139 Drilling 51,561 (51,561) - - Total $ 672,549 $ (51,561) $ 2 10,101 $ 8 31,089 Nine months ended September 30, 2019 Historical Pro Forma NAM Drilling Rigs Forbes NewCo Fluid Management $ 148,525 $ - $ 36, 294 $ 1 84,819 Service Rigs 88,661 - 73,653 162,314 Coiled Tubing 56,607 - 43,700 100,307 Rentals 107,349 - - 107,349 Wireline 50,419 - - 50,419 Drilling 32,831 (32,831) - - Total $ 484,392 $ (32,831) $ 1 53,647 $ 605,208 Three months ended December 31, 2018 Historical Pro Forma NAM Drilling Rigs Forbes NewCo Fluid Management $ 57,603 $ - $ 16, 253 $ 7 3,856 Service Rigs 27,841 - 22, 415 50,256 Coiled Tubing 27,164 - 17, 786 4 4,950 Rentals 40,099 - - 4 0,099 Wireline 16,720 - - 16,720 Drilling 18,730 (18,730) - - Total $ 188,157 $ (18,730) $ 56, 454 $ 225,881 29

Adjusted EBITDA & FCF Reconciliation Pro Forma NAM For the twelve months ended September 30, 2019 (unaudited) Historical Pro Forma (in thousands) NAM Drilling Rigs NAM Revenues $ 6 72,549 $ (51,561) $ 6 20,988 Cost of services and rentals (exclusive of depreciation, amortization and accretion) 508,963 (41,068) 467,895 Depreciation, amortization and accretion 85,279 (10,969) 74,310 General and administrative expenses 78,995 (2,057) 7 6,938 Reduction in value of assets 287,268 (7,556) 2 79,712 Loss from operations (287,956) 10,089 (277,867) Other expense: Other, net (225) - (225) Loss from continuing operations before taxes (288,181) 10,089 (278,092) Income taxes (3,563) 1,816 (1,747) Net loss $ ( 284,618) $ 8,273 $ (276,345) Net loss $ (276,345) Depreciation, amortization and accretion 74,310 Reduction in value of assets 279,712 Gains on sales of assets (12,499) Restructuring costs 3,443 Other, net 225 Income taxes (1,747) Adjusted EBITDA $ 67,099 CapEx $ (17,248) Free cash flow $ 49,851 30Adjusted EBITDA & FCF Reconciliation Pro Forma NAM For the twelve months ended September 30, 2019 (unaudited) Historical Pro Forma (in thousands) NAM Drilling Rigs NAM Revenues $ 6 72,549 $ (51,561) $ 6 20,988 Cost of services and rentals (exclusive of depreciation, amortization and accretion) 508,963 (41,068) 467,895 Depreciation, amortization and accretion 85,279 (10,969) 74,310 General and administrative expenses 78,995 (2,057) 7 6,938 Reduction in value of assets 287,268 (7,556) 2 79,712 Loss from operations (287,956) 10,089 (277,867) Other expense: Other, net (225) - (225) Loss from continuing operations before taxes (288,181) 10,089 (278,092) Income taxes (3,563) 1,816 (1,747) Net loss $ ( 284,618) $ 8,273 $ (276,345) Net loss $ (276,345) Depreciation, amortization and accretion 74,310 Reduction in value of assets 279,712 Gains on sales of assets (12,499) Restructuring costs 3,443 Other, net 225 Income taxes (1,747) Adjusted EBITDA $ 67,099 CapEx $ (17,248) Free cash flow $ 49,851 30

Adjusted EBITDA & FCF Reconciliation Pro Forma NAM (unaudited) For the year ended December 31, 2018 For the year ended December 31, 2017 (in thousands) Historical Pro Forma Historical Pro Forma NAM Drilling Rigs NAM NAM Drilling Rigs NAM Revenues $ 737,533 $ (71,016) $ 6 66,517 $ 630,762 $ ( 63,063) $ 567,699 Cost of services and rentals (exclusive of depreciation, amortization and accretion) 575,852 (53,215) 522,637 4 97,342 ( 46,673) 450,669 Depreciation, amortization and accretion 123,124 (18,020) 105,104 1 48,177 ( 19,950) 128,227 General and administrative expenses 84,150 (2,233) 81,917 9 3,979 ( 2,077) 91,902 Reduction in value of assets 277,610 (1,337) 276,273 3 ,914 ( 7,556) ( 3,642) Loss from operations ( 323,203) 3,789 (319,414) (112,650) 13,193 ( 99,457) Other expense: Other, net 207 - 207 316 - 316 Loss from continuing operations before taxes (322,996) 3,789 (319,207) (112,334) 13,193 ( 99,141) Income taxes ( 21,104) 682 ( 20,422) (56,886) 2,375 ( 54,511) Net loss $ (301,892) $ 3,107 $ (298,785) $ (55,448) $ 10,818 $ ( 44,630) Net loss $ (298,785) $ ( 44,630) Depreciation, amortization and accretion 105,104 128,227 Reduction in value of assets 276,273 ( 3,642) Gains on sales of assets (14,100) ( 5,664) Restructuring costs - - Other, net ( 207) ( 316) Income taxes (20,422) ( 54,511) Adjusted EBITDA $ 47,863 $ 19,464 CapEx $ (33,201) $ ( 7,879) Free cash flow $ 14,662 $ 11,585 31Adjusted EBITDA & FCF Reconciliation Pro Forma NAM (unaudited) For the year ended December 31, 2018 For the year ended December 31, 2017 (in thousands) Historical Pro Forma Historical Pro Forma NAM Drilling Rigs NAM NAM Drilling Rigs NAM Revenues $ 737,533 $ (71,016) $ 6 66,517 $ 630,762 $ ( 63,063) $ 567,699 Cost of services and rentals (exclusive of depreciation, amortization and accretion) 575,852 (53,215) 522,637 4 97,342 ( 46,673) 450,669 Depreciation, amortization and accretion 123,124 (18,020) 105,104 1 48,177 ( 19,950) 128,227 General and administrative expenses 84,150 (2,233) 81,917 9 3,979 ( 2,077) 91,902 Reduction in value of assets 277,610 (1,337) 276,273 3 ,914 ( 7,556) ( 3,642) Loss from operations ( 323,203) 3,789 (319,414) (112,650) 13,193 ( 99,457) Other expense: Other, net 207 - 207 316 - 316 Loss from continuing operations before taxes (322,996) 3,789 (319,207) (112,334) 13,193 ( 99,141) Income taxes ( 21,104) 682 ( 20,422) (56,886) 2,375 ( 54,511) Net loss $ (301,892) $ 3,107 $ (298,785) $ (55,448) $ 10,818 $ ( 44,630) Net loss $ (298,785) $ ( 44,630) Depreciation, amortization and accretion 105,104 128,227 Reduction in value of assets 276,273 ( 3,642) Gains on sales of assets (14,100) ( 5,664) Restructuring costs - - Other, net ( 207) ( 316) Income taxes (20,422) ( 54,511) Adjusted EBITDA $ 47,863 $ 19,464 CapEx $ (33,201) $ ( 7,879) Free cash flow $ 14,662 $ 11,585 31
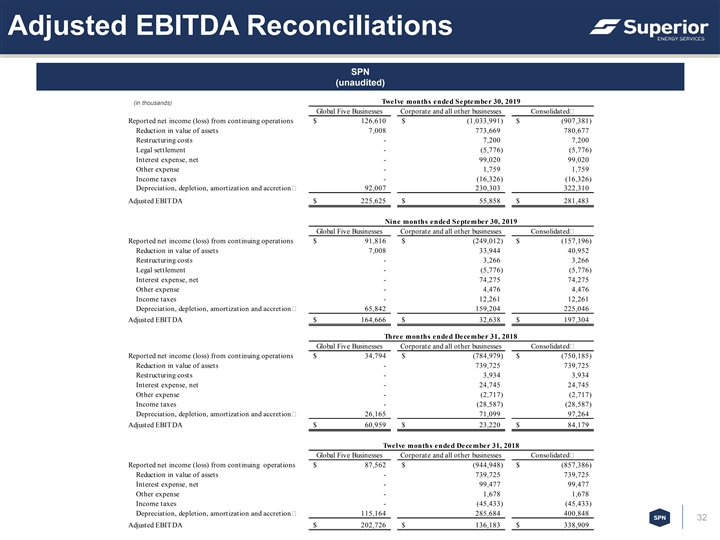
Adjusted EBITDA Reconciliations SPN (unaudited) Twelve months ended September 30, 2019 (in thousands) Global Five Businesses Corporate and all other businesses Consolidated Reported net income (loss) from continuing operations $ 126,610 $ (1,033,991) $ (907,381) Reduction in value of assets 7,008 773, 669 780,677 Restructuring costs - 7, 200 7,200 Legal settlement - (5,776) (5,776) Interest expense, net - 99, 020 99,020 Other expense - 1, 759 1,759 Income taxes - (16,326) (16,326) Depreciation, depletion, amortization and accretion 92,007 230, 303 322,310 Adjusted EBITDA $ 225,625 $ 55, 858 $ 281,483 Nine months ended September 30, 2019 Global Five Businesses Corporate and all other businesses Consolidated Reported net income (loss) from continuing operations $ 91,816 $ (249,012) $ (157,196) Reduction in value of assets 7,008 33, 944 40,952 Restructuring costs - 3, 266 3,266 Legal settlement - (5,776) (5,776) Interest expense, net - 74, 275 74,275 Other expense - 4, 476 4,476 Income taxes - 12, 261 12,261 Depreciation, depletion, amortization and accretion 65,842 159, 204 225,046 Adjusted EBITDA $ 164,666 $ 32, 638 $ 197,304 Three months ended December 31, 2018 Global Five Businesses Corporate and all other businesses Consolidated Reported net income (loss) from continuing operations $ 34,794 $ (784,979) $ (750,185) Reduction in value of assets - 739, 725 739,725 Restructuring costs - 3, 934 3,934 Interest expense, net - 24, 745 24,745 Other expense - (2,717) (2,717) Income taxes - (28,587) (28,587) Depreciation, depletion, amortization and accretion 26,165 71, 099 97,264 Adjusted EBITDA $ 60,959 $ 23, 220 $ 84,179 Twelve months ended December 31, 2018 Global Five Businesses Corporate and all other businesses Consolidated Reported net income (loss) from continuing operations $ 87,562 $ (944,948) $ (857,386) Reduction in value of assets - 739, 725 739,725 Interest expense, net - 99, 477 99,477 Other expense - 1, 678 1,678 Income taxes - (45,433) (45,433) Depreciation, depletion, amortization and accretion 115,164 285, 684 400,848 32 Adjusted EBITDA $ 202,726 $ 136, 183 $ 338,909Adjusted EBITDA Reconciliations SPN (unaudited) Twelve months ended September 30, 2019 (in thousands) Global Five Businesses Corporate and all other businesses Consolidated Reported net income (loss) from continuing operations $ 126,610 $ (1,033,991) $ (907,381) Reduction in value of assets 7,008 773, 669 780,677 Restructuring costs - 7, 200 7,200 Legal settlement - (5,776) (5,776) Interest expense, net - 99, 020 99,020 Other expense - 1, 759 1,759 Income taxes - (16,326) (16,326) Depreciation, depletion, amortization and accretion 92,007 230, 303 322,310 Adjusted EBITDA $ 225,625 $ 55, 858 $ 281,483 Nine months ended September 30, 2019 Global Five Businesses Corporate and all other businesses Consolidated Reported net income (loss) from continuing operations $ 91,816 $ (249,012) $ (157,196) Reduction in value of assets 7,008 33, 944 40,952 Restructuring costs - 3, 266 3,266 Legal settlement - (5,776) (5,776) Interest expense, net - 74, 275 74,275 Other expense - 4, 476 4,476 Income taxes - 12, 261 12,261 Depreciation, depletion, amortization and accretion 65,842 159, 204 225,046 Adjusted EBITDA $ 164,666 $ 32, 638 $ 197,304 Three months ended December 31, 2018 Global Five Businesses Corporate and all other businesses Consolidated Reported net income (loss) from continuing operations $ 34,794 $ (784,979) $ (750,185) Reduction in value of assets - 739, 725 739,725 Restructuring costs - 3, 934 3,934 Interest expense, net - 24, 745 24,745 Other expense - (2,717) (2,717) Income taxes - (28,587) (28,587) Depreciation, depletion, amortization and accretion 26,165 71, 099 97,264 Adjusted EBITDA $ 60,959 $ 23, 220 $ 84,179 Twelve months ended December 31, 2018 Global Five Businesses Corporate and all other businesses Consolidated Reported net income (loss) from continuing operations $ 87,562 $ (944,948) $ (857,386) Reduction in value of assets - 739, 725 739,725 Interest expense, net - 99, 477 99,477 Other expense - 1, 678 1,678 Income taxes - (45,433) (45,433) Depreciation, depletion, amortization and accretion 115,164 285, 684 400,848 32 Adjusted EBITDA $ 202,726 $ 136, 183 $ 338,909

Adjusted EBITDA Reconciliations (cont’d) SPN (unaudited) Twelve months ended December 31, 2017 (in thousands) Global Five Businesses Corporate and all other businesses Consolidated Reported net income (loss) from continuing operations $ 1, 562 $ (188,573) $ (187,011) Reduction in value of assets 292 13,863 14,155 Interest expense, net - 101,455 101,455 Other expense - 3,299 3,299 Income taxes - (190,740) (190,740) Depreciation, depletion, amortization and accretion 1 37,673 301,043 438,716 Adjusted EBITDA $ 1 39,527 $ 40,347 $ 179,874 Twelve months ended December 31, 2016 Global Five Businesses Corporate and all other businesses Consolidated Reported net income (loss) from continuing operations $ (90,423) $ (742,917) $ (833,340) Reduction in value of assets 40, 696 459,709 500,405 Interest expense, net - 92,753 92,753 Other expense - (22,621) (22,621) Income taxes - (267,001) (267,001) Depreciation, depletion, amortization and accretion 1 68,878 341,093 509,971 Adjusted EBITDA $ 1 19,151 $ (138,984) $ (19,833) Twelve months ended December 31, 2015 Global Five Businesses Corporate and all other businesses Consolidated Reported net income (loss) from continuing operations $ 1 38,855 $ (1,946,618) $ (1,807,763) Reduction in value of assets 14, 296 1,724,591 1,738,887 Interest expense, net - 97,318 97,318 Other expense - 9,476 9,476 Income taxes - (252,020) (252,020) Depreciation, depletion, amortization and accretion 1 86,243 425,904 612,147 Adjusted EBITDA $ 3 39,394 $ 58,651 $ 398,045 Twelve months ended December 31, 2014 Global Five Businesses Corporate and all other businesses Consolidated Reported net income (loss) from continuing operations $ 3 55,631 $ (74,841) $ 280,790 Interest expense, net - 96,734 96,734 Other expense - 7,681 7,681 Income taxes - 161,399 161,399 Depreciation, depletion, amortization and accretion 1 77,570 473,244 650,814 EBITDA $ 5 33,201 $ 664,217 $ 1,197,418 33Adjusted EBITDA Reconciliations (cont’d) SPN (unaudited) Twelve months ended December 31, 2017 (in thousands) Global Five Businesses Corporate and all other businesses Consolidated Reported net income (loss) from continuing operations $ 1, 562 $ (188,573) $ (187,011) Reduction in value of assets 292 13,863 14,155 Interest expense, net - 101,455 101,455 Other expense - 3,299 3,299 Income taxes - (190,740) (190,740) Depreciation, depletion, amortization and accretion 1 37,673 301,043 438,716 Adjusted EBITDA $ 1 39,527 $ 40,347 $ 179,874 Twelve months ended December 31, 2016 Global Five Businesses Corporate and all other businesses Consolidated Reported net income (loss) from continuing operations $ (90,423) $ (742,917) $ (833,340) Reduction in value of assets 40, 696 459,709 500,405 Interest expense, net - 92,753 92,753 Other expense - (22,621) (22,621) Income taxes - (267,001) (267,001) Depreciation, depletion, amortization and accretion 1 68,878 341,093 509,971 Adjusted EBITDA $ 1 19,151 $ (138,984) $ (19,833) Twelve months ended December 31, 2015 Global Five Businesses Corporate and all other businesses Consolidated Reported net income (loss) from continuing operations $ 1 38,855 $ (1,946,618) $ (1,807,763) Reduction in value of assets 14, 296 1,724,591 1,738,887 Interest expense, net - 97,318 97,318 Other expense - 9,476 9,476 Income taxes - (252,020) (252,020) Depreciation, depletion, amortization and accretion 1 86,243 425,904 612,147 Adjusted EBITDA $ 3 39,394 $ 58,651 $ 398,045 Twelve months ended December 31, 2014 Global Five Businesses Corporate and all other businesses Consolidated Reported net income (loss) from continuing operations $ 3 55,631 $ (74,841) $ 280,790 Interest expense, net - 96,734 96,734 Other expense - 7,681 7,681 Income taxes - 161,399 161,399 Depreciation, depletion, amortization and accretion 1 77,570 473,244 650,814 EBITDA $ 5 33,201 $ 664,217 $ 1,197,418 33