Attached files
| file | filename |
|---|---|
| EX-99.1 - EX-99.1 - Meridian Corp | ex-99d1.htm |
| EX-10.2 - EX-10.2 - Meridian Corp | ex-10d2.htm |
| EX-10.1 - EX-10.1 - Meridian Corp | ex-10d1.htm |
| EX-4.1 - EX-4.1 - Meridian Corp | ex-4d1.htm |
| 8-K - 8-K - Meridian Corp | f8-k.htm |
Exhibit 99.2
|
|
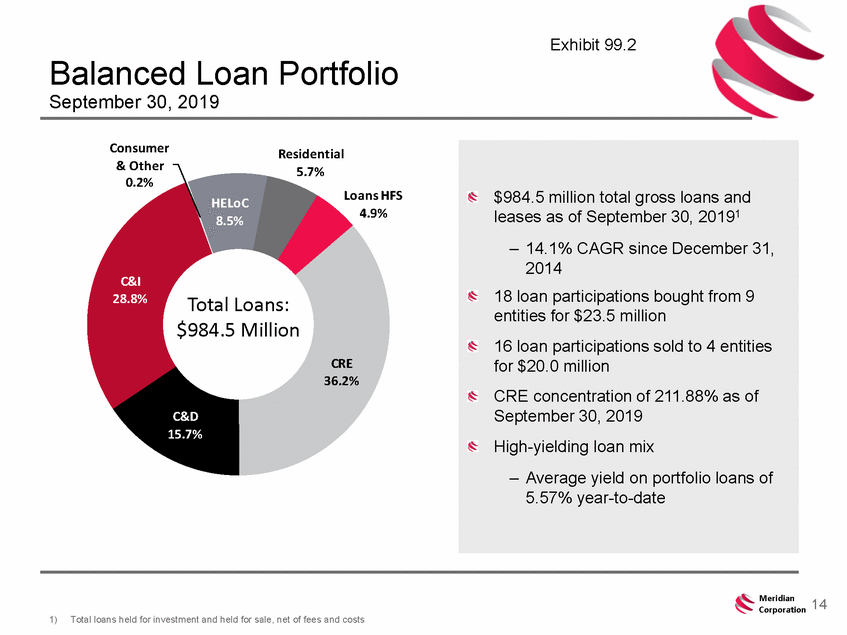
Exhibit 99.2 Balanced Loan September 30, 2019 Portfolio Consumer & Other 0.2% Residential 5.7% Loans HFS 4.9% HELoC 8.5% C&I 28.8% Total Loans: $984.5 Million CRE 36.2% C&D 15.7% Meridian Corporation 14 1)Total loans held for investment and held for sale, net of fees and costs $984.5 million total gross loans and leases as of September 30, 20191 – 14.1% CAGR since December 31, 2014 18 loan participations bought from 9 entities for $23.5 million 16 loan participations sold to 4 entities for $20.0 million CRE concentration of 211.88% as of September 30, 2019 High-yielding loan mix – Average yield on portfolio loans of 5.57% year-to-date |
|
|
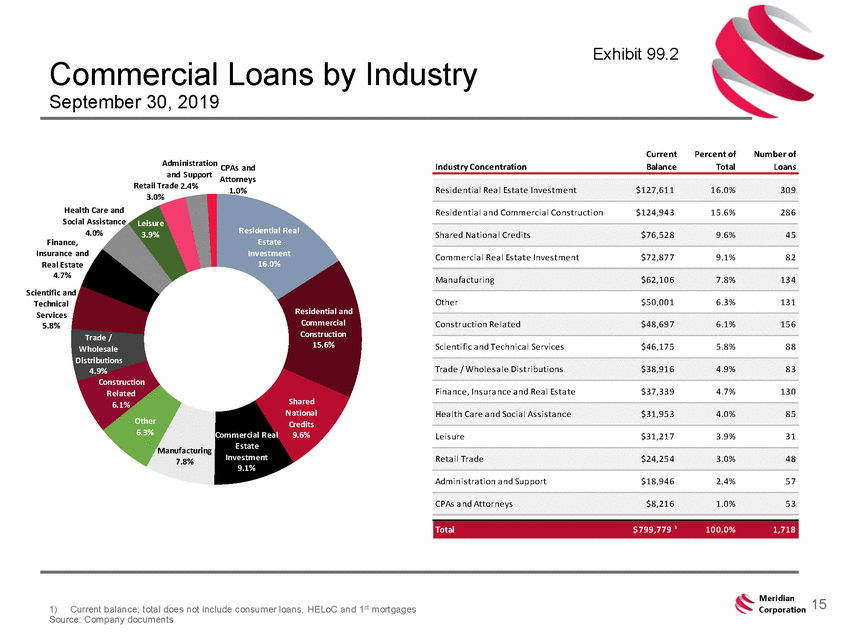
Exhibit 99.2 Commercial Loans September 30, 2019 by Industry Current Balance Percent of Total Number of Loans Administration CPAs and Industry Concentration and Support Retail Trade 2.4% 3.0% Attorneys 1.0% Health Care and Social Assistance 4.0% Finance, Insurance and Real Estate 4.7% Scientific and Technical Services 5.8% Trade / Wholesale Distributions 4.9% Res identia l a nd Commercia l Cons truction $124,943 15.6% 286 Leisure 3.9% Residential Real Estate Investment 16.0 Commercia l Rea l Es ta te Inves tment $72,877 9.1% 82 Other $50,001 6.3% 131 Residential and Commercial Construction 15.6% Scientific a nd Technica l Services $46,175 5.8% 88 Fina nce, Ins ura nce a nd Rea l Es ta te $37,339 4.7% 130 Related 6.1% Other 6.3% hared N tional Credits 9.6% Commercial Real Estate Investment 9.1% Leis ure $31,217 3.9% 31 Manufacturing 7.8% Adminis tra tion a nd Support $18,946 2.4% 57 Meridian Corporation 15 1) Current balance; total does not include consumer loans, HELoC and 1st mortgages Source: Company documents Total$799,779 ¹100.0%1,718 CPAs a nd Attorneys$8,2161.0%53 Reta il Tra de$24,2543.0%48 Hea lth Ca re a nd Socia l As s is ta nce$31,9534.0%85 Tra de / Wholes a le Dis tributions$38,9164.9%83 Cons truction Rela ted$48,6976.1%156 Ma nufa cturing$62,1067.8%134 Sha red Na tiona l Credits$76,5289.6%45 Res identia l Rea l Es ta te Inves tment$127,61116.0%309 |
|
|
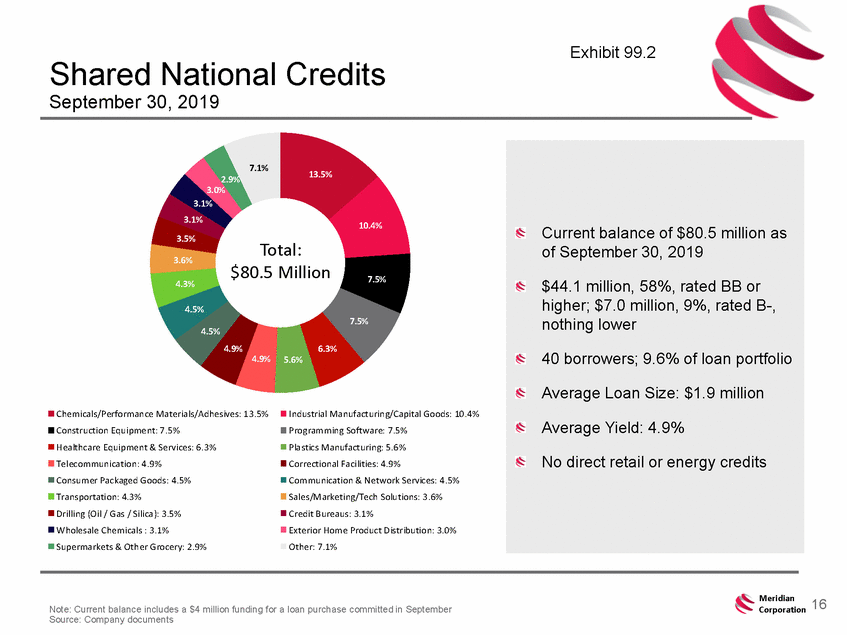
Exhibit 99.2 Shared National Credits September 30, 2019 7.1% 13.5% .9% 3.0% 3 % 10.4% Total: $80.5 Million 3.6% 7.5% 4.3% 7.5 4.5% 4.9 .3% 4.9% 5.6% Chemicals/Perfo rman ce Materials/Adhesives: 13.5% Construction Equipment: 7.5% Healthcare Equipment & Services: 6.3% Telecommunicatio n: 4.9% Consum er Packaged Goods: 4.5% Transportation: 4.3% Drilling (Oil / Gas / Silica): 3.5% Wholesale Chemicals : 3.1% Supermarkets & Oth er Grocery: 2.9% Industrial Manufact urin g/Capital Goods: 10.4% Prog ram ming Software: 7.5% Plastics M anufact uring: 5.6% Correctional Facilities: 4.9% Com munication & Network Services: 4.5% Sales/M arketing/Tech Solu tions: 3.6% Credit B ureaus: 3.1% Exterior Hom e Product Distribution: 3.0% Other: 7.1% Meridian Corporation 16 Note: Current balance includes a $4 million funding for a loan purchase committed in September Source: Company documents Current balance of $80.5 million as of September 30, 2019 $44.1 million, 58%, rated BB or higher; $7.0 million, 9%, rated B-, nothing lower 40 borrowers; 9.6% of loan portfolio Average Loan Size: $1.9 million Average Yield: 4.9% No direct retail or energy credits |
|
|
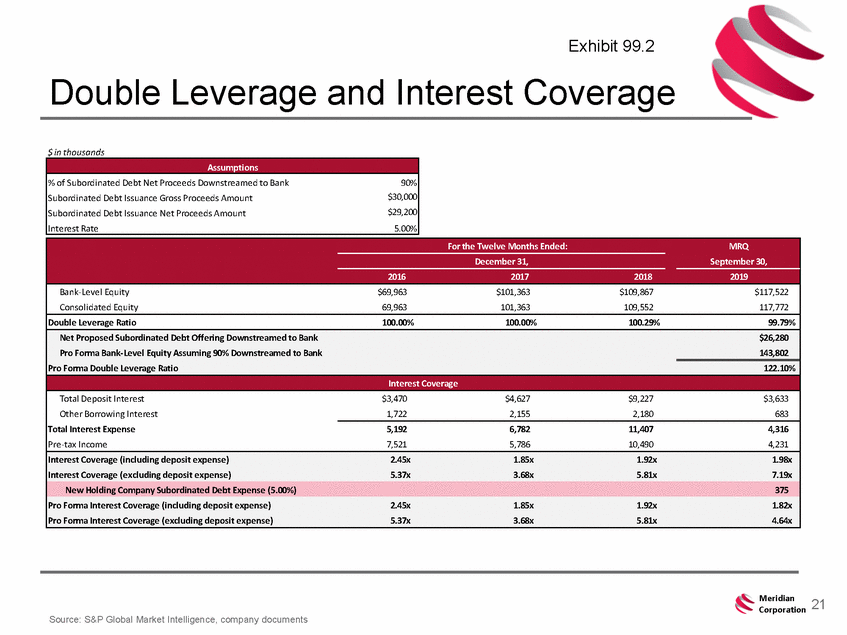
Exhibit 99.2 Double Leverage and Interest Coverage $ in thousands Meridian Corporation 21 Source: S&P Global Market Intelligence, company documents Assumptions % of Subordinated Debt Net Proceeds Downstreamed to Bank 90% Subordinated Debt Issuance Gross Proceeds Amount $30,000 Subordinated Debt Issuance Net Proceeds Amount $29,200 Interest Rate 5.00% For the Twelve Months Ended: December 31, 2016 2017 2018 MRQ September 30, 2019 Bank-Level Equity $69,963 $101,363 $109,867 $117,522 Consolidated Equity 69,963 101,363 109,552 117,772 Double Leverage Ratio 100.00% 100.00% 100.29% 99.79% Net Proposed Subordinated Debt Offering Downstreamed to Bank Pro Forma Bank-Level Equity Assuming 90% Downstreamed to Bank Pro Forma Double Leverage Ratio $26,280 143,802 122.10% Interest Coverage Total Deposit Interest Other Borrowing Interest Total Interest Expense Pre-tax Income $3,470 $4,627 $9,227 $3,633 1,722 2,155 2,180 683 5,192 6,782 11,407 4,316 7,521 5,786 10,490 4,231 Interest Coverage (including deposit expense) 2.45x 1.85x 1.92x 1.98x Interest Coverage (excluding deposit expense) 5.37x 3.68x 5.81x 7.19x New Holding Company Subordinated Debt Expense (5.00%) 375 Pro Forma Interest Coverage (including deposit expense) 2.45x 1.85x 1.92x 1.82x Pro Forma Interest Coverage (excluding deposit expense) 5.37x 3.68x 5.81x 4.64x |
|
|
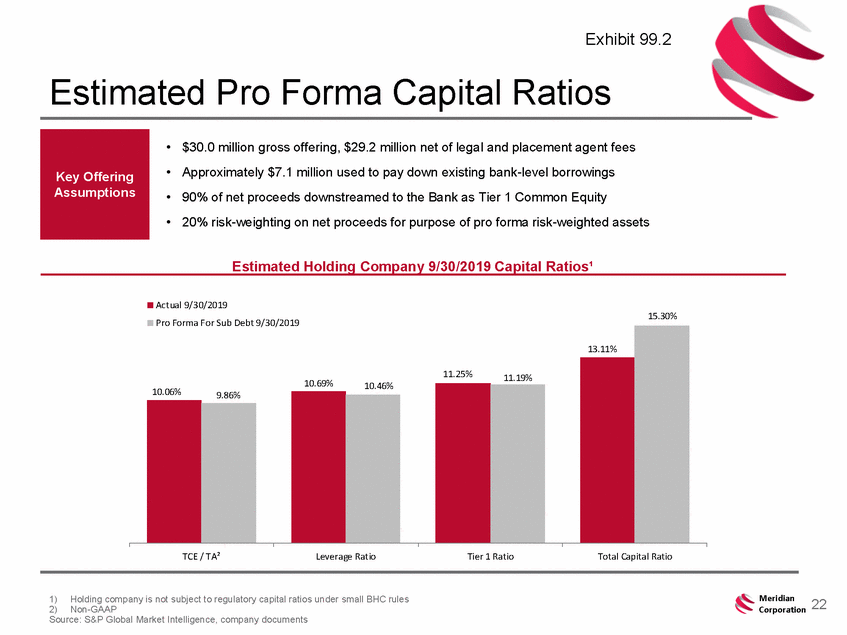
Exhibit 99.2 Estimated Pro Forma Capital Ratios • • • • $30.0 million gross offering, $29.2 million net of legal and placement agent fees Approximately $7.1 million used to pay down existing bank-level borrowings 90% of net proceeds downstreamed to the Bank as Tier 1 Common Equity 20% risk-weighting on net proceeds for purpose of pro forma risk-weighted assets Estimated Holding Company 9/30/2019 Capital Ratios¹ Actual 9/30/2019 Pro Forma For Sub Debt 9/30/2019 15.30% 11.19% 10.69% 10.46% 10.06% 9.86% TCE / TA² Leverage Ratio Tier 1 Ratio Total Capital Ratio Meridian Corporation 1)Holding company is not subject to regulatory capital ratios under small BHC rules 2)Non-GAAP Source: S&P Global Market Intelligence, company documents 22 13.11% 11.25% Key Offering Assumptions |

