Attached files
| file | filename |
|---|---|
| 8-K - FORM 8-K - QCR HOLDINGS INC | tm1925025-1_8k.htm |
Exhibit 99.1

December 2019 Investor Presentation
2 This document contains, and future oral and written statements of QCR Holdings (the “Company”) and its management may contain , f orward - looking statements within the meaning of the Private Securities Litigation Reform Act of 1995 with respect to the financial condition, results of opera tio ns, plans, objectives, future performance and business of the Company. Forward - looking statements, which may be based upon beliefs, expectations and assumptions of the C ompany’s management and on information currently available to management, are generally identifiable by the use of words such as “believe,” “expect,” “a nti cipate,” “predict,” “suggest,” “appear,” “plan,” “intend,” “estimate,” “annualize,” “may,” “will,” “would,” “could,” “should” or other similar expressions. Additiona lly , all statements in this document, including forward - looking statements, speak only as of the date they are made, and the Company undertakes no obligation to update any stat ement in light of new information or future events. A number of factors, many of which are beyond the ability of the Company to control or predict, could cause ac tua l results to differ materially from those in its forward - looking statements. These factors include, among others, the following: (i) the strength of the local, state, na tional and international economies (including the impact of tariffs, a US. Withdrawal from or significant renegotiation of trade agreements, trade wars and other changes i n t rade regulations) ; (ii) the economic impact of any future terrorist threats and attacks, and the response of the United States to any such threats and attacks; (i ii) changes in state and federal laws, regulations and governmental policies concerning the Company’s general business; (iv) changes in interest rates and prepaymen t r ates of the Company’s assets; (v) increased competition in the financial services sector and the inability to attract new customers; (vi) changes in techno log y and the ability to develop and maintain secure and reliable electronic systems; (vii) unexpected results of acquisitions, which may include failure to realize the an tic ipated benefits of an acquisition and the possibility that transaction costs may be greater than anticipated; (viii) the loss of key executives or employees; (ix) chan ges in consumer spending; (x) unexpected outcomes of existing or new litigation involving the Company; and (xi) changes in accounting policies and practices. These r isk s and uncertainties should be considered in evaluating forward - looking statements and undue reliance should not be placed on such statements. Additional info rmation concerning the Company and its business, including additional factors that could materially affect the Company’s financial results, is included in t he Company’s filings with the Securities and Exchange Commission. FORWARD - LOOKING STATEMENTS These slides contain non - GAAP financial measures. For purposes of Regulation G, a non - GAAP financial measure is a numerical meas ure of the registrant ’ s historical or future financial performance, financial position or cash flows that excludes amounts, or is subject to adjustments that have the effect of excluding amounts, that are included in the most directly comparable measure calculated and presented in accordance with GAAP in the statement of income, ba lance sheet or statement of cash flows (or equivalent statements) of the issuer; or includes amounts, or is subject to adjustments that have the effect of inc lud ing amounts, that are excluded from the most directly comparable measure so calculated and presented. In this regard, GAAP refers to generally accepted accounting princip les in the United States. Pursuant to the requirement of Regulation G, the Company has provided reconciliations within the slides, as necessary, of the non - GAAP financial measure to the most directly comparable GAAP financial measure. For more details on the Company’s non - GAAP measures, refer to the Company’s Annual Report on Form 10 - K for the year ended December 31, 2018. NON - GAAP FINANCIAL MEASURES

Corporate Overview
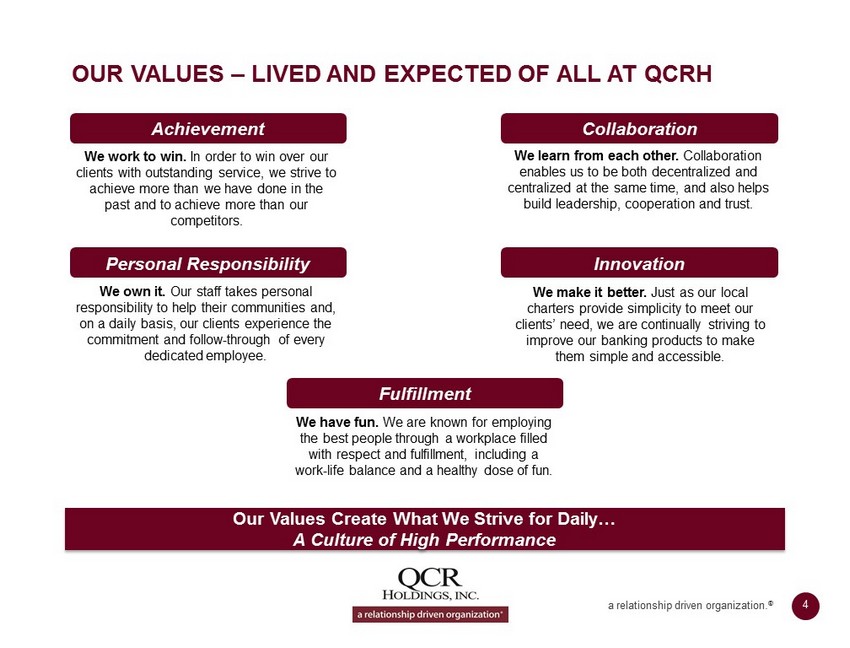
4 a relationship driven organization. ® Collaboration Achievement Personal Responsibility Innovation Fulfillment OUR VALUES – LIVED AND EXPECTED OF ALL AT QCRH We work to win. In order to win over our clients with outstanding service, we strive to achieve more than we have done in the past and to achieve more than our competitors. We learn from each other. Collaboration enables us to be both decentralized and centralized at the same time, and also helps build leadership, cooperation and trust. We own it. Our staff takes personal responsibility to help their communities and, on a daily basis, our clients experience the commitment and follow - through of every dedicated employee. We make it better. Just as our local charters provide simplicity to meet our clients’ need, we are continually striving to improve our banking products to make them simple and accessible. We have fun. We are known for employing the best people through a workplace filled with respect and fulfillment, including a work - life balance and a healthy dose of fun. Our Values Create What We Strive for Daily… A Culture of High Performance

5 a relationship driven organization. ® • Local charters provide a competitive advantage • Strong, centralized risk management function • Efficient centralized group operations • Strong credit and asset quality • Consistent adjusted net income growth • High touch service approach • Serving attractive Midwest markets • Significant expansion opportunities a relationship driven organization. ®
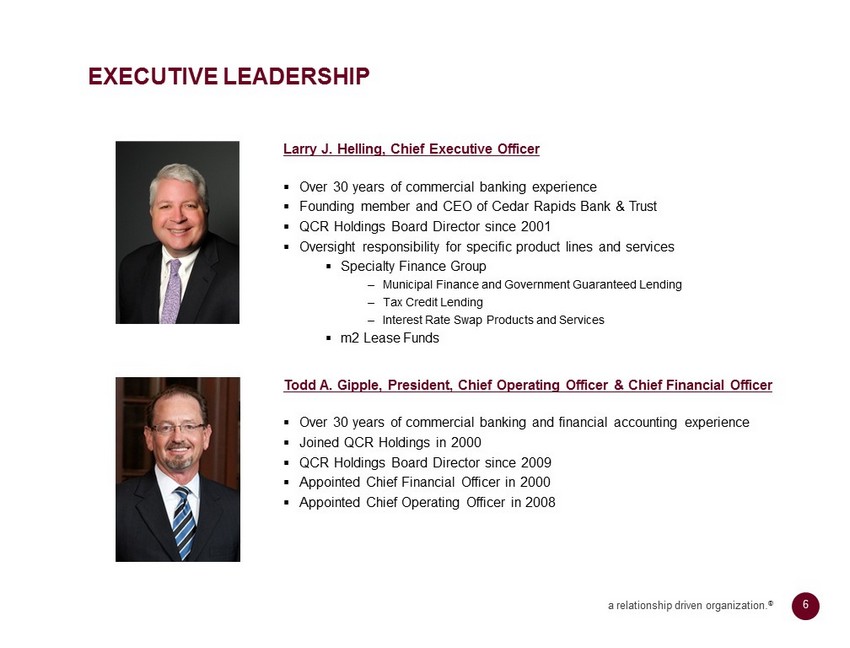
6 a relationship driven organization. ® EXECUTIVE LEADERSHIP Larry J. Helling , Chief Executive Officer ▪ Over 30 years of commercial banking experience ▪ Founding member and CEO of Cedar Rapids Bank & Trust ▪ QCR Holdings Board Director since 2001 ▪ Oversight responsibility for specific product lines and services ▪ Specialty Finance Group ‒ Municipal Finance and Government Guaranteed Lending ‒ Tax Credit Lending ‒ Interest Rate Swap Products and Services ▪ m2 Lease Funds Todd A. Gipple , President, Chief Operating Officer & Chief Financial Officer ▪ Over 30 years of commercial banking and financial accounting experience ▪ Joined QCR Holdings in 2000 ▪ QCR Holdings Board Director since 2009 ▪ Appointed Chief Financial Officer in 2000 ▪ Appointed Chief Operating Officer in 2008

7 a relationship driven organization. ® CORPORATE OVERVIEW Assets: $5.3 Billion Loans: $3.6 Billion Deposits: $3.8 Billion Wealth Management: $4.5 Billion ▪ $1.15 Billion in Trust Accounts ▪ $3.35 Billion in Brokerage Accounts / RIA Shares Outstanding: 15.8 Million Ownership (as of 9/30/19): ▪ Institutional & Mutual Funds 60% ▪ Insiders & Benefit Plans 14% QCR Holdings (NASDAQ: QCRH) – Founded in 1993 Headquartered in Moline, IL and operating five* locally managed and governed charters, supported by a centralized operational team Lines of Business: ▪ Full - service commercial and consumer banking ▪ Correspondent banking ▪ Commercial lease financing ▪ Trust and wealth management services Source: S&P Global Market Intelligence and Company documents. Data as of September 30, 2019 unless otherwise noted. 4 STATES 5 CHARTERS* 25 BRANCHES 735 EMPLOYEES 1 FAMILY * On November 30, 2019, QCRH completed the sale of substantially all of the assets of Rockford Bank & Trust to Illinois Bank & Trust.
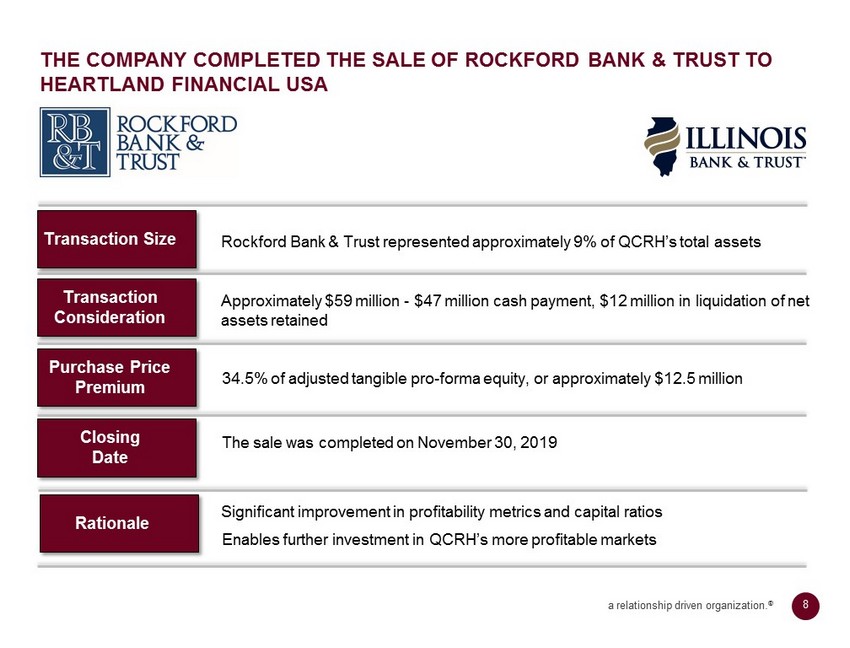
8 a relationship driven organization. ® 34.5% of adjusted tangible pro - forma equity, or approximately $12.5 million THE COMPANY COMPLETED THE SALE OF ROCKFORD BANK & TRUST TO HEARTLAND FINANCIAL USA Transaction Consideration Purchase Price Premium Closing Date Rationale The sale was completed on November 30, 2019 Enables further investment in QCRH’s more profitable markets Approximately $59 million - $47 million cash payment, $12 million in liquidation of net assets retained Transaction Size Rockford Bank & Trust represented approximately 9% of QCRH’s total assets Significant improvement in profitability metrics and capital ratios

9 a relationship driven organization. ® IMPROVED PROFITABILITY METRICS EXPECTED WITH RB&T SALE Approximately 150 basis point improvement in the Efficiency Ratio ROAA Efficiency Ratio Tangible Book Value Capital Ratios Tangible Book Value per share increase by approximately $0.60 Approximately 8 basis point increase in Return on Average Assets Net Interest Margin Approximately 7 to 9 basis point increase in NIM Tangible Common Equity/Tangible Assets ratio increase by approximately 110 basis points
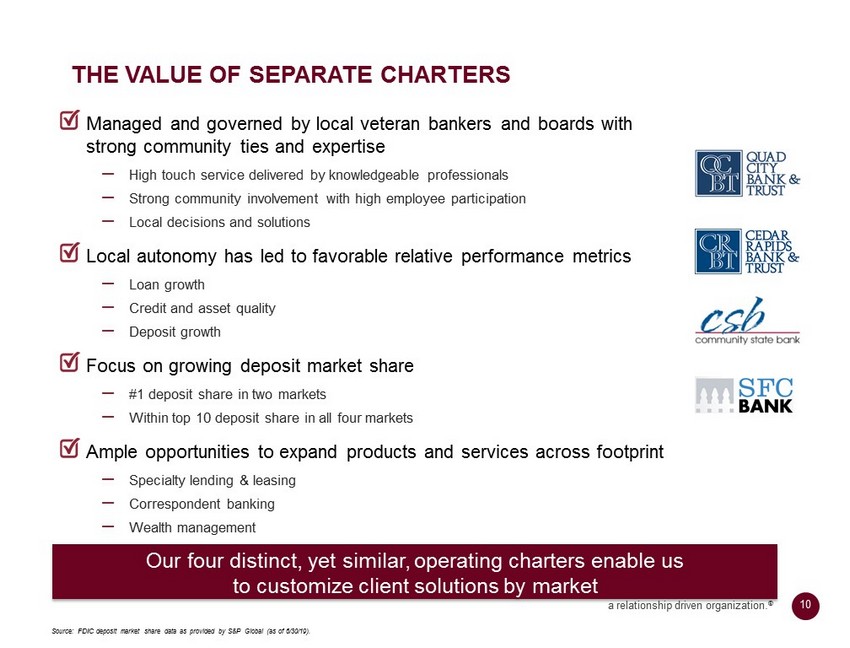
10 a relationship driven organization. ® THE VALUE OF SEPARATE CHARTERS Source: FDIC deposit market share data as provided by S&P Global (as of 6/30/19). Our four distinct, yet similar, operating charters enable us to customize client solutions by market Managed and governed by local veteran bankers and boards with strong community ties and expertise ‒ High touch service delivered by knowledgeable professionals ‒ Strong community involvement with high employee participation ‒ Local decisions and solutions Local autonomy has led to favorable relative performance metrics ‒ Loan growth ‒ Credit and asset quality ‒ Deposit growth Focus on growing deposit market share ‒ #1 deposit share in two markets ‒ Within top 10 deposit share in all four markets Ample opportunities to expand products and services across footprint ‒ Specialty lending & leasing ‒ Correspondent banking ‒ Wealth management

11 a relationship driven organization. ® MISSOURI ILLINOIS IOWA WISCONSIN HISTORY OF EXPANDING INTO ATTRACTIVE MARKETS 1993 QCR Holdings founded by Michael A. Bauer and Douglas M. Hultquist - $14 million IPO 1994 Quad City Bank & Trust (De Novo) 2005 Rockford Bank & Trust (De Novo) Quad City Bank & Trust acquires m2 Lease Funds, LLC 2001 Cedar Rapids Bank & Trust (De Novo) 2013 Community National Bank acquisition 2016 Community State Bank acquisition 2017 Guaranty Bank & Trust acquisition 2018 Springfield Bancshares, Inc. merger 3 Bank Locations $0.1B Deposits #6 Market Share 5 Bank Locations $1.3B Deposits #1 Market Share 5 Bank Locations $1.4B Deposits #1 Market Share 10 Bank Locations $0.7B Deposits #7 Market Share 1 Bank Locations $0.5B Deposits #7 Market Share 1 Locations $0.2B Assets Source: FDIC deposit market share data as provided by S&P Global (as of 6/30/19). 2019 Rockford Bank & Trust sold On November 30, 2019, substantially all of the assets of RB&T were sold to Illinois Bank & Trust.

12 a relationship driven organization. ® STRONG MARKET SHARE IN ATTRACTIVE MSA’S * MSAs include Davenport - Moline - Rock Island, IA - IL, Cedar Rapids, IA, Rockford - IL, Waterloo - Cedar Falls - IA, Des Moines/West Des Moines - IA, and Springfield, MO. All banks reflect Pro Forma Data from acquisitions. ** Pro Forma based on Rockford Bank & Trust disposition. Source: S&P Global Market Intelligence and Company documents. Deposit data as of 6/30/19. Davenport - Moline, IA - IL Cedar Rapids, IA Des Moines - West Des Moines, IA Springfield, MO Waterloo - Cedar Falls, IA ▪ International headquarters for Deere & Company ▪ Ranked 16 th in the nation for high - tech job growth ▪ Top 10 Advanced Manufacturing Community ▪ Top 10 Best Places for Starting a Small Business (2015) ▪ Top 100 Places to Live (Livability 2016) ▪ #15 Most Popular Cities in America to Relocate to (2018) ▪ Ranked #1 Best City for the Middle Class (2016) ▪ 81 insurance companies are headquartered in Des Moines (2017) ▪ Ranked in the Top Ten Places to Live in the U.S. (2017) ▪ Top 5 Best Cities to start a business ▪ Top 20 Magnets for Young Adults ▪ O’Reilly Auto Parts and Bass Pro Shops headquarters ▪ First Gigabit city in Iowa and one of eight in the U.S. ▪ Cost of living is 2.2% below the national average ▪ Waterloo/Cedar Falls in the top 10 job markets in the U.S. ( Zippia 2018) Deposit Market Share in Our Current MSAs* • Ranked 2nd in overall deposit market share in our current MSAs* • 48% of deposits are based in a Top 20 ranked Midwest MSA** Top 20 Banks Total Active Branches 2019 Total Deposits 2019 ($000) Wells Fargo & Co. 40 $5,045,299 QCR Holdings Inc. 26 $4,347,859 U.S. Bancorp 57 $4,166,079 BTC Financial Corp. 22 $3,141,578 Great Southern Bancorp Inc. 20 $1,737,309 West Bancorp 8 $1,659,116 Bank of America Corporation 7 $1,625,640 Commerce Bancshares Inc. 11 $1,206,663 Central Bancompany Inc. 22 $1,163,682 Great Western Bancorp 11 $1,032,222 Midland States Bancorp Inc. 16 $953,937 Blackhawk Bancorp. Inc. 17 $939,090 FSB Financial Services Inc. 8 $805,132 Associated Banc - Corp 6 $742,707 JPMorgan Chase & Co. 6 $718,497 Neighbor Insurance Agency Inc 9 $666,724 Guaranty Federal Bcshs Inc. 10 $657,822 Bank of Montreal 10 $611,272 OakStar Bancshares Inc. 6 $598,978 Heartland Financial USA Inc. 4 $545,322

13 a relationship driven organization. ® UNIQUE AND DIVERSIFIED PRODUCTS AND SERVICES QCR Holdings Business Lines • Trust administration • Brokerage accounts and asset management • Financial planning • 9/30/19 AUM: $4.5B • Competitive deposit products • Bank stock loans • Safekeeping and cash management services • 195 correspondent banking relationships • Commercial & retail banking services • Treasury management & depository products • Small ticket lease financing (m2 Lease Funds) Fee - Based Businesses Commercial Banking Correspondent Banking Wealth Management 3Q19 Net Interest Income: $40 .7 mm 53% of Total Revenue 3Q19 Noninterest Income: $ 19.9 mm 26% of Total Revenue • Commercial loan fixed - floating rate swaps • SBA & USDA secondary market sales • 3Q19 swap & loan sale income: $9.8M Specialty Finance Group Source: Company documents. Data as of or for the third quarter ended 9/30/19.

14 a relationship driven organization. ® Ongoing emphasis on fee income on swaps and gains on sale of USDA and SBA loans as a more significant and consistent component of core revenue STRATEGIES TO CONTINUE TO DRIVE SHAREHOLDER VALUE Loan & Lease Growth Grow Core Deposits Fee Income Grow Wealth Management Manage Noninterest Exp Maintain Asset Quality Be an Acquirer Continue strong organic loan and lease growth to maintain loans and leases to total assets ratio in the range of 73 - 78% Maintain focus on growing core deposits to maintain reliance on wholesale funding at less than 15% of assets Grow wealth management net income by 10% annually Carefully manage noninterest expense growth Maintain asset quality metrics at better than peer levels Participate as an acquirer in the consolidation taking place in our industry to further boost profitability, improve efficiency, and increase EPS Source: Company documents.

Financial Highlights

16 a relationship driven organization. ® $2.4 $2.5 $2.6 $3.3 $4.0 $4.9 $5.3 61.0% 64.6% 69.3% 72.9% 74.4% 75.4% 75.1% 2013 2014 2015 2016 2017 2018 9/30/19 Total Assets Total Loans & Leases/Total Assets A CONSISTENT TRACK RECORD OF ASSET GROWTH Asset growth has been driven by a combination of organic growth and strategic acquisitions Source: S&P Global Market Intelligence and Company documents. Recent Acquisitions (Assets at acquisition date ($ Millions)): 2013: Community National Bancorporation ($288) 2016: Community State Bank ($582) 2017: Guaranty Bankshares , Ltd. ($260) 2018: Springfield Bancshares, Inc. ($576) $1,643.0 32% $1,592.9 31% $801.6 15% $693.9 13% $465.5 9% Quad City Bank and Trust Cedar Rapids Bank and Trust Community State Bank Springfield First Community Bank Rockford Bank and Trust * Asset Distribution by Charter as of 9/30/19 ($MM) Total Consolidated Assets ($B) • Note: Data as of 9/30/19 includes assets of Rockford Bank & Trust, which were classified as assets held for sale at that date . The sale of RB&T was completed on November 30, 2019.
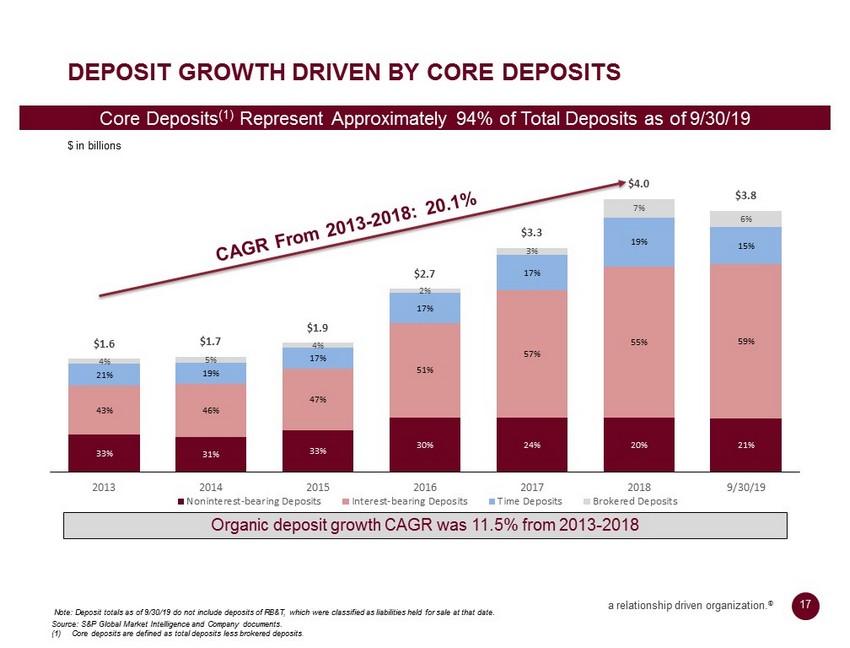
17 a relationship driven organization. ® DEPOSIT GROWTH DRIVEN BY CORE DEPOSITS $ in billions Core Deposits (1) Represent Approximately 94% of Total Deposits as of 9/30/19 Organic deposit growth CAGR was 11.5 % from 2013 - 2018 Source: S&P Global Market Intelligence and Company documents. (1) Core deposits are defined as total deposits less brokered deposits . 33% 31% 33% 30% 24% 20% 21% 43% 46% 47% 51% 57% 55% 59% 21% 19% 17% 17% 17% 19% 15% 4% 5% 4% 2% 3% 7% 6% $1.6 $1.7 $1.9 $2.7 $3.3 $4.0 $3.8 2013 2014 2015 2016 2017 2018 9/30/19 Noninterest-bearing Deposits Interest-bearing Deposits Time Deposits Brokered Deposits Note: Deposit totals as of 9/30/19 do not include deposits of RB&T, which were classified as liabilities held for sale at tha t d ate.
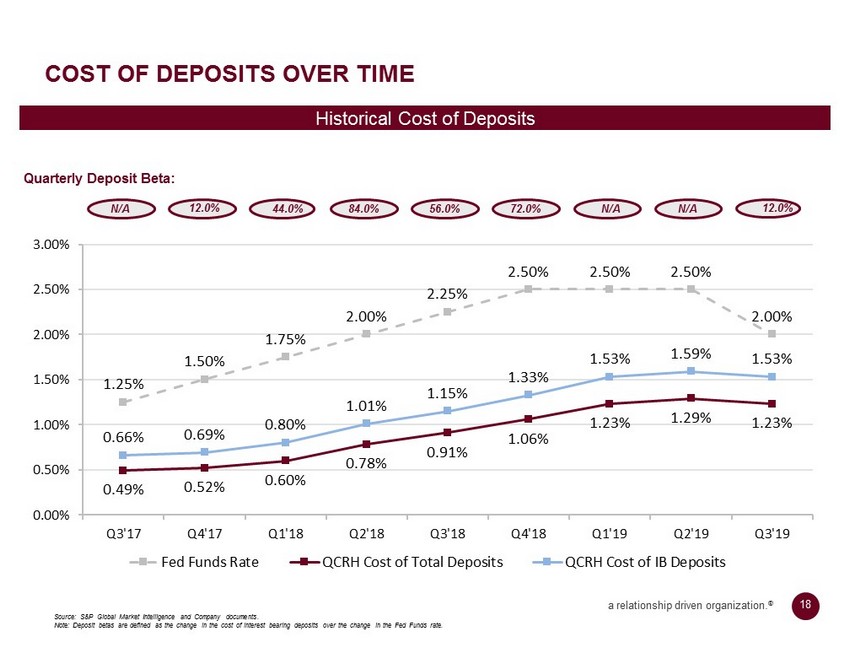
18 a relationship driven organization. ® COST OF DEPOSITS OVER TIME Historical Cost of Deposits Source: S&P Global Market Intelligence and Company documents. Note: Deposit betas are defined as the change in the cost of interest bearing deposits over the change in the Fed Funds rate. 12.0% Quarterly Deposit Beta: N/A 12.0% 44.0 % 84.0 % 56.0 % 72.0 % N/A N/A 1.25% 1.50% 1.75% 2.00% 2.25% 2.50% 2.50% 2.50% 2.00% 0.49% 0.52% 0.60% 0.78% 0.91% 1.06% 1.23% 1.29% 1.23% 0.66% 0.69% 0.80% 1.01% 1.15% 1.33% 1.53% 1.59% 1.53% 0.00% 0.50% 1.00% 1.50% 2.00% 2.50% 3.00% Q3'17 Q4'17 Q1'18 Q2'18 Q3'18 Q4'18 Q1'19 Q2'19 Q3'19 Fed Funds Rate QCRH Cost of Total Deposits QCRH Cost of IB Deposits

19 a relationship driven organization. ® LOAN GROWTH DRIVEN BY COMMERCIAL LENDING $ in billions (2) Organic loan growth CAGR was 12.6 % from 2013 - 2018 Commercial Loans (1) Represent Approximately 91% of the Loan Portfolio as of 9/30/19 Source: S&P Global Market Intelligence and Company documents. (1) Includes Commercial & Industrial, Commercial RE and Direct Financing Leases. (2) Loan composition excludes deferred loan/lease origination costs, net of fees. $0.4 $0.5 $0.6 $0.8 $1.1 $1.4 $1.4 $0.7 $0.7 $0.7 $1.1 $1.3 $1.8 $1.7 $0.1 $0.2 $0.2 $0.2 $0.1 $0.1 $0.1 $0.1 $0.2 $0.2 $0.2 $0.3 $0.3 $0.2 $0.1 $0.1 $0.1 $0.1 $0.1 $0.1 $0.1 $1.5 $1.6 $1.8 $2.4 $3.0 $3.7 $3.6 2013 2014 2015 2016 2017 2018 9/30/19 Commercial & Industrial Commercial RE Direct Fin. Leases Residential RE Consumer & Other * Note: Loan and lease totals as of 9/30/19 do not include amounts from RB&T, which were classified as assets held for sale a t t hat date.
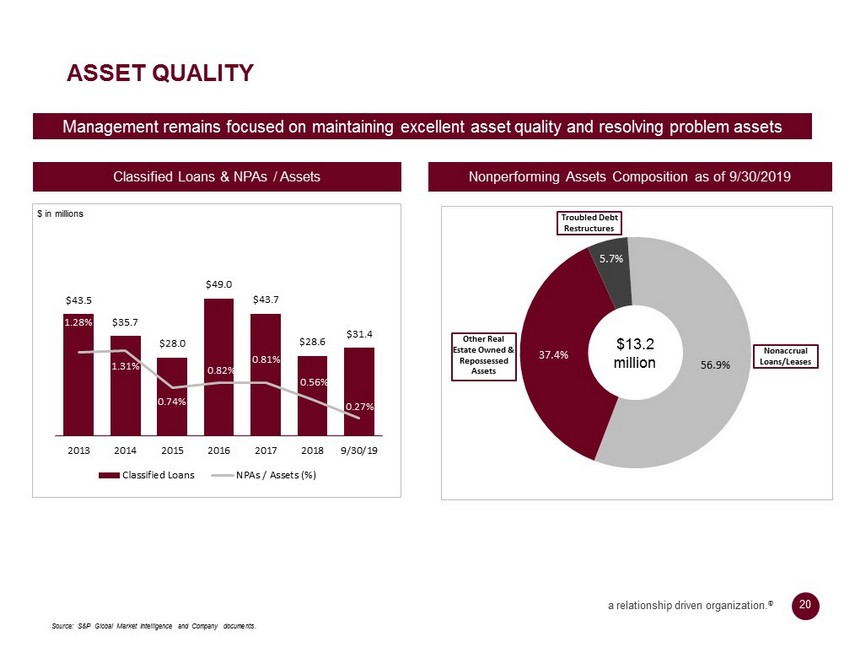
20 a relationship driven organization. ® 56.9% 37.4% 5.7% Nonaccrual Loans/Leases Other Real Estate Owned & Repossessed Assets Troubled Debt Restructures ASSET QUALITY $13.2 million Classified Loans & NPAs / Assets Nonperforming Assets Composition as of 9/30/2019 $43.5 $35.7 $28.0 $49.0 $43.7 $28.6 $31.4 1.28% 1.31% 0.74% 0.82% 0.81% 0.56% 0.27% 2013 2014 2015 2016 2017 2018 9/30/19 Classified Loans NPAs / Assets (%) $ in millions Management remains focused on maintaining excellent asset quality and resolving problem assets Source: S&P Global Market Intelligence and Company documents.

21 a relationship driven organization. ® 223% 145% 184% 215% 402% 169% 139% 143% 137% 147% 0% 50% 100% 150% 200% 250% 300% 350% 400% 2015 2016 2017 2018 9/30/19 QCRH Proxy Peers 1.45% 1.28% 1.16% 1.07% 1.00% 1.14% 1.04% 1.04% 0.99% 0.94% 2015 2016 2017 2018 9/30/19 QCRH Proxy Peers Source: S&P Global Market Intelligence and Company documents. Note: Proxy peer group is identified in the QCRH Proxy Statement, filed on 4/12/19. Peer metrics reflect the median of the pe er group. (1) Proxy peers financial data as of 6/30/19. STRONG CREDIT CULTURE SUPPORTED BY HIGH LEVELS OF RESERVES Reserves / Loans (%) Reserves / NPLs (%) $0.7 $10.1 $8.1 $11.6 Amount of remaining loan discount ($MM): (1) (1) $7.7

22 a relationship driven organization. ® Predictable and diversified fee income streams complement net interest income STRONG REVENUE GROWTH AND ATTRACTIVE MIX $ in millions Key Components of Fee Income: • Wealth Management ( $4.5 billion in assets under administration as of 9/30/19) • Correspondent banking (195 relationships as of 9/30/19 ) • SBA & USDA guaranteed loan sales • Swap fee income Source: S&P Global Market Intelligence and Company documents. (1) TTM (trailing twelve months) represents the twelve months ended 9/30/19. 75% 71% 76% 76% 75% 79% 77% 77% 25% 29% 24% 24% 25% 21% 23% 23% $77 $91 $90 $101 $126 $147 $184 $212 2012 2013 2014 2015 2016 2017 2018 TTM Net Interest Income Noninterest Income

23 $9.9 $13.8 $20.9 $29.4 $36.3 $46.4 $31.9 $43.0 $1.75 $1.72 $1.99 $2.31 $2.66 $3.08 $2.16 $2.70 2013 2014 2015 2016 2017 2018 YTD 9/30/18 YTD 9/30/19 CONSISTENT IMPROVEMENT IN SHAREHOLDER RETURNS Adj. Net Income (1) $ in millions Adj. EPS (2) 34.8% Source: Company documents. (1) Adjusted net income to common shareholders (non - GAAP) – see appendix slide 37 for reconciliation of GAAP net income to adjusted net income. (2) Adjusted earnings per diluted share (non - GAAP) – see appendix slide 37 for reconciliation of GAAP earnings per share to adjusted earnings per share. Y - o - Y Adj. Net Income Growth:

24 a relationship driven organization. ® HISTORICAL PROFITABILITY METRICS Source: S&P Global Market Intelligence and Company documents. (1) Non - GAAP – see appendix slide 37 for reconciliation of GAAP ROAA to adjusted ROAA. (2) Adjusted NIM excludes accretable yield (non - GAAP) – see appendix slide 36 for reconciliation of GAAP NIM to adjusted NIM. (3) Non - GAAP – see appendix slide 36 for reconciliation to the most directly comparable GAAP financial measures. Tax Equivalent Net Interest Margin (%) Efficiency Ratio (%) (3) Adjusted ROAA (%) (1) 0.56% 0.61% 0.82% 1.03% 1.03% 1.06% 1.00% 1.13% 0.00% 0.50% 1.00% 1.50% 2.00% 2013 2014 2015 2016 2017 2018 YTD 9/30 2018 YTD 9/30 2019 2.98% 3.12% 3.36% 3.61% 3.63% 3.48% 3.49% 3.33% 3.03% 3.15% 3.37% 3.75% 3.78% 3.62% 3.59% 3.43% 2013 2014 2015 2016 2017 2018 YTD 9/30 2018 YTD 9/30 2019 Adjusted NIM (TEY) NIM (TEY) 72.0% 72.6% 72.7% 64.9% 66.5% 64.8% 64.1% 66.2% 2013 2014 2015 2016 2017 2018 YTD 9/30 2018 YTD 9/30 2019 (2)

25 a relationship driven organization. ® ▪ Carefully manage noninterest expense growth (year - over - year) ▪ Strong organic loan and lease growth to maintain loans and leases to total assets ratio in the range of 73% - 78% ▪ Focus on growing core deposits to maintain reliance on wholesale funding to less than 15% of assets ▪ Generate gains on the sale of USDA and SBA loans, and fee income on interest rate swaps, as a significant and consistent component of core revenue ($4 - $4.5 million per quarter) ▪ Grow wealth management net income by 10% annually ▪ Maintain asset quality metrics at better than peer levels EXECUTION ON STRATEGIC INITIATIVES Loans / Assets Wholesale Funding Fee Income Streams Grow Wealth Management NPAs / Assets 9/30/2019 ▪ 75.1% at 9/30/19 (1) ▪ 10.6% at 9/30/19 ▪ $21.5 million year - to - date ▪ 10.7% of core revenue ▪ 0.27% at 9/30/19 ▪ Peer average (2) of 0.57% ▪ Annualized net income growth of 14.1% YTD ▪ Added 97 new relationships YTD Manage Noninterest Expense ▪ Up 32% YTD, primarily due to the acquisition of SFC Bank and the Bates Companies ▪ Higher commissions and incentive compensation Source: S&P Global Market Intelligence and Company documents. (1) Total loans and leases at 9/30/19 exclude loans at Rockford Bank & Trust, which were classified as assets held for sale. (2) Proxy peer group is identified in the QCRH Proxy Statement, filed on 4/12/19. Proxy peers financial data as of 6/30/19.
Appendix

27 a relationship driven organization. ® Source: S&P Global Market Intelligence and Company documents. (1) Non - GAAP – see appendix slide 38 for reconciliation of tangible common equity to GAAP stockholders’ equity (2) Non - GAAP – see appendix slide 37 for reconciliation of GAAP ROAA to adjusted ROAA. (3) Ratios for the current quarter are subject to change upon final calculation for regulatory filings due after the date of this pr esentation. * Includes assets held for sale of $465.5 million, loans held for sale of $368.0 million, and deposits held for sale of $451 .5 million ** Excludes Rockford Bank & Trust HISTORICAL FINANCIALS Dollars in Millions (except per share data) Year Ended, 9 Months Ended September 30, 2014 2015 2016 2017 2018 2018 2019 Balance Sheet: Total Assets* $2,525 $2,593 $3,302 $3,983 $4,950 $4,793 $5,292 Total Loans* $1,630 $1,798 $2,405 $2,964 $3,733 $3,653 $3,978 Deposits* $1,680 $1,881 $2,669 $3,267 $3,977 $3,788 $4,254 Tangible Common Equity $139 $221 $264 $316 $378 $368 $426 Tangible Book Value Per Share $17.50 $18.81 $20.11 $22.70 $24.04 $23.46 $27.01 Profitability: Net Income as Reported $15.0 $16.9 $27.7 $35.7 $43.1 $29.8 $41.5 Adjusted ROAA (2) 0.61% 0.82% 1.03% 1.03% 1.06% 1.00% 1.13% Net Interest Margin (TEY) 3.15% 3.37% 3.75% 3.78% 3.62% 3.59% 3.43% Efficiency Ratio 72.55% 72.71% 64.90% 66.48% 64.77% 64.10% 66.18% Asset Quality: NPAs / Total Assets** 1.31% 0.74% 0.82% 0.81% 0.56% 0.87% 0.27% NPAs / Loans + OREO** 2.01% 1.06% 1.12% 1.08% 0.75% 1.13% 0.37% Reserves / Total Loans** 1.42% 1.45% 1.28% 1.16% 1.07% 1.18% 1.00% NCOs / Average Loans** 0.34% 0.22% 0.14% 0.19% 0.21% 0.02% 0.01% Capital Ratios: Tang. Common Equity / Tang. Assets (1) 5.52% 8.55% 8.04% 8.01% 7.78% 7.82% 8.20% Leverage Ratio (3) 7.62% 9.75% 9.10% 8.98% 8.87% 8.87% 9.02% Tier 1 Capital Ratio (3) 9.52% 11.88% 10.46% 10.14% 9.77% 9.83% 9.94% Total Capital Ratio (3) 10.91% 13.11% 11.56% 11.15% 10.69% 10.87% 12.22%

28 QUAD CITY BANK & TRUST John H. Anderson, President & CEO Assets: $1.66 Billion 1 (as of 6/30 /19 ) Population: 382,013 Market Deposits: $8.2 Billion Ranked 1 st with 17.6% market share and over $1.43 billion in deposits in Davenport - Moline - Rock Island MSA Finalist 2013 and 2014 – Quad Cities Best Place to Work Finalist 2015 ABA Volunteer Finalist Award Finalist 2015 Be Healthy QC Award Major Employers Rock Island Arsenal Deere & Company Genesis Health System HNI Corporation / The Hon Company / Allsteel UnityPoint Health - Trinity Tyson Fresh Meats Arconic (formerly Alcoa) Kraft - Heinz 3M Excelon Hy - Vee International Headquarters for Deere & Company The Rock Island Arsenal is the largest government - owned military weapons manufacturing arsenal in the United States Arconic (formerly Alcoa) (Quad Cities) is the world’s premier aerospace supply plant – the hub of Alcoa’s $3B aerospace business. Announced $1B, multi - year contract with Airbus in Nov 2016 Kraft - Heinz constructed $203MM state - of - the - art production facility in northwest Davenport Material Control Systems (MATCON) completed a new $10MM logistics facility and added 150 new jobs Ranked 16th in the nation for high - tech job growth Ranked as a Top 50 Military Friendly Community Top 5 Defense Community Top 10 Advanced Manufacturing Community 1 Includes the assets of m2 Lease Funds, as this entity is wholly - owned and consolidated with the bank. Source: FDIC deposit market share data as provided by S&P Global. Deposit data is as of 6/30/19. Deposit Market Share * Millions of dollars, as of 6/30/19, Davenport - Moline - Rock Island, IA - IL, MSA. Quad Cities Highlights Institution Name Offices in MSA Deposits* Market Share 1. Quad City Bank & Trust 5 1,434.5 17.60% 2. Wells Fargo & Co. (CA) 11 1,174.9 14.41% 3. Blackhawk Bancorp. Inc. (IL) 17 939.1 11.52% 4. U.S. Bancorp (MN) 10 831.6 10.20% 5. Orion Bancorp. Inc. (IL) 8 387.0 4.75% 6. Triumph Bancorp Inc. (TX) 10 381.4 4.68% 7. First Midwest Bancorp Inc. (IL) 4 348.1 4.27% 8. AmBank Holdings Inc. (IA) 8 258.3 3.17% 9. Central Banc Inc. (IL) 3 247.3 3.03% 10. Prophetstown Banking Co. (IL) 1 211.8 2.60%
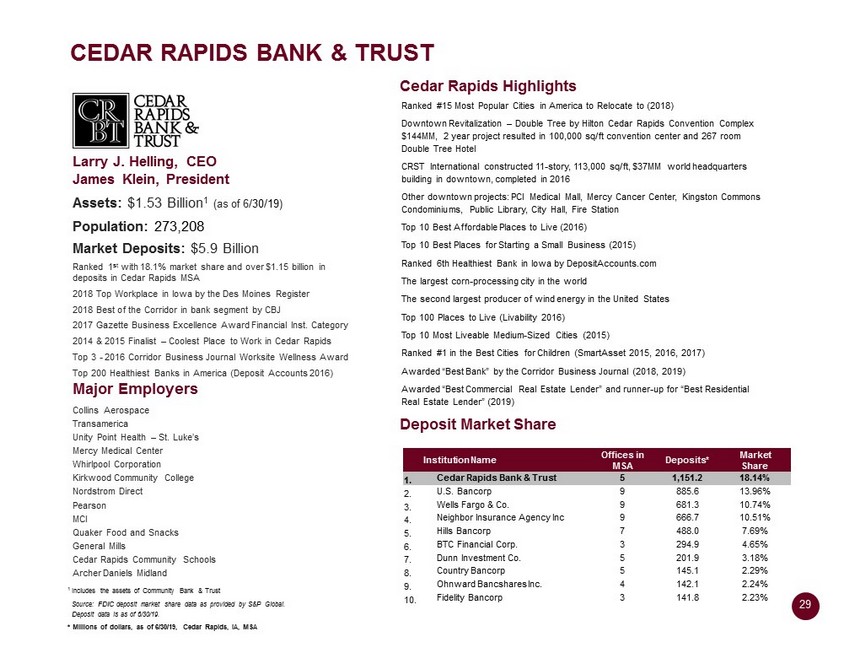
29 CEDAR RAPIDS BANK & TRUST Larry J. Helling, CEO James Klein, President Assets: $1.53 Billion 1 (as of 6 /30/19 ) Population: 273,208 Market Deposits: $5.9 Billion Ranked 1 st with 18.1% market share and over $1.15 billion in deposits in Cedar Rapids MSA 2018 Top Workplace in Iowa by the Des Moines Register 2018 Best of the Corridor in bank segment by CBJ 2017 Gazette Business Excellence Award Financial Inst. Category 2014 & 2015 Finalist – Coolest Place to Work in Cedar Rapids Top 3 - 2016 Corridor Business Journal Worksite Wellness Award Top 200 Healthiest Banks in America (Deposit Accounts 2016) Major Employers Collins Aerospace Transamerica Unity Point Health – St. Luke’s Mercy Medical Center Whirlpool Corporation Kirkwood Community College Nordstrom Direct Pearson MCI Quaker Food and Snacks General Mills Cedar Rapids Community Schools Archer Daniels Midland Ranked #15 Most Popular Cities in America to Relocate to (2018) Downtown Revitalization – Double Tree by Hilton Cedar Rapids Convention Complex $144MM, 2 year project resulted in 100,000 sq /ft convention center and 267 room Double Tree Hotel CRST International constructed 11 - story, 113,000 sq/ft, $37MM world headquarters building in downtown, completed in 2016 Other downtown projects: PCI Medical Mall, Mercy Cancer Center, Kingston Commons Condominiums, Public Library, City Hall, Fire Station Top 10 Best Affordable Places to Live (2016) Top 10 Best Places for Starting a Small Business (2015) Ranked 6th Healthiest Bank in Iowa by DepositAccounts.com The largest corn - processing city in the world The second largest producer of wind energy in the United States Top 100 Places to Live ( Livability 2016) Top 10 Most Liveable Medium - Sized Cities (2015) Ranked #1 in the Best Cities for Children ( SmartAsset 2015, 2016, 2017) Awarded “Best Bank” by the Corridor Business Journal (2018, 2019) Awarded “Best Commercial Real Estate Lender” and runner - up for “Best Residential Real Estate Lender” (2019) Cedar Rapids Highlights Deposit Market Share 1 Includes the assets of Community Bank & Trust Source: FDIC deposit market share data as provided by S&P Global. Deposit data is as of 6/30/19. * Millions of dollars, as of 6/30/19, Cedar Rapids, IA, MSA Institution Name Offices in MSA Deposits* Market Share 1. Cedar Rapids Bank & Trust 5 1,151.2 18.14% 2. U.S. Bancorp 9 885.6 13.96% 3. Wells Fargo & Co. 9 681.3 10.74% 4. Neighbor Insurance Agency Inc 9 666.7 10.51% 5. Hills Bancorp 7 488.0 7.69% 6. BTC Financial Corp. 3 294.9 4.65% 7. Dunn Investment Co. 5 201.9 3.18% 8. Country Bancorp 5 145.1 2.29% 9. Ohnward Bancshares Inc. 4 142.1 2.24% 10. Fidelity Bancorp 3 141.8 2.23%
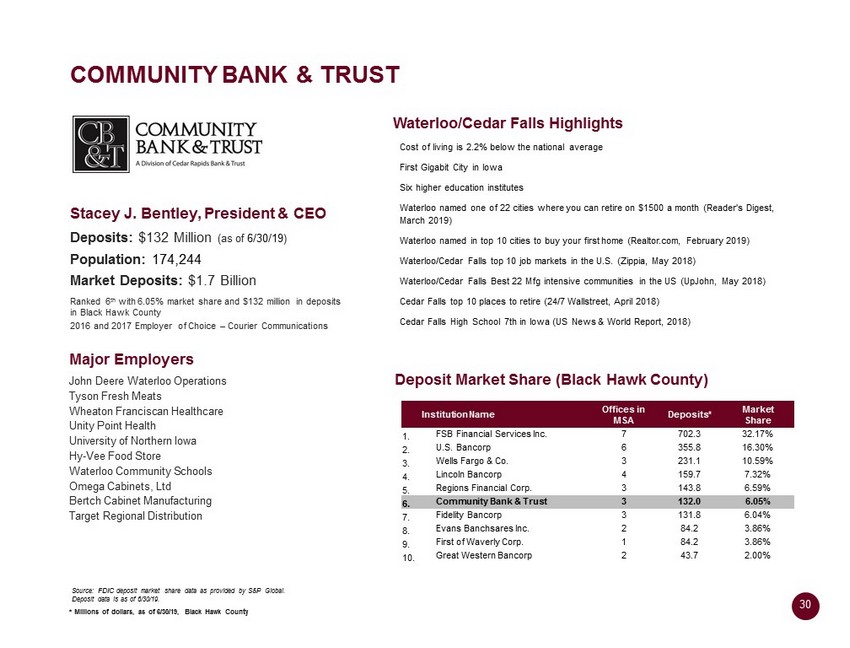
30 COMMUNITY BANK & TRUST Stacey J. Bentley, President & CEO Deposits: $132 Million (as of 6/30/19 ) Population: 174,244 Market Deposits: $1.7 Billion Ranked 6 th with 6.05% market share and $132 million in deposits in Black Hawk County 2016 and 2017 Employer of Choice – Courier Communications Major Employers John Deere Waterloo Operations Tyson Fresh Meats Wheaton Franciscan Healthcare Unity Point Health University of Northern Iowa Hy - Vee Food Store Waterloo Community Schools Omega Cabinets, Ltd Bertch Cabinet Manufacturing Target Regional Distribution Waterloo/Cedar Falls Highlights Cost of living is 2.2% below the national average First Gigabit City in Iowa Six higher education institutes Waterloo named one of 22 cities where you can retire on $1500 a month (Reader's Digest, March 2019) Waterloo named in top 10 cities to buy your first home (Realtor.com, February 2019) Waterloo/Cedar Falls top 10 job markets in the U.S. ( Zippia , May 2018) Waterloo/Cedar Falls Best 22 Mfg intensive communities in the US ( UpJohn , May 2018) Cedar Falls top 10 places to retire (24/7 Wallstreet, April 2018) Cedar Falls High School 7th in Iowa (US News & World Report, 2018) Deposit Market Share (Black Hawk County) Source: FDIC deposit market share data as provided by S&P Global. Deposit data is as of 6/30/19. * Millions of dollars, as of 6/30/19, Black Hawk County Institution Name Offices in MSA Deposits* Market Share 1. FSB Financial Services Inc. 7 702.3 32.17% 2. U.S. Bancorp 6 355.8 16.30% 3. Wells Fargo & Co. 3 231.1 10.59% 4. Lincoln Bancorp 4 159.7 7.32% 5. Regions Financial Corp. 3 143.8 6.59% 6. Community Bank & Trust 3 132.0 6.05% 7. Fidelity Bancorp 3 131.8 6.04% 8. Evans Banchsares Inc. 2 84.2 3.86% 9. First of Waverly Corp. 1 84.2 3.86% 10. Great Western Bancorp 2 43.7 2.00%

31 COMMUNITY STATE BANK Kurt A. Gibson, President & CEO Assets: $808 Million (as of 6/30 /19 ) Population: 682,877 Des Moines/West Des Moines MSA Market Deposits: $18.7 Billion Ranked 7th with 4.02% market share and $706 Million in deposits in Des Moines – West Des Moines MSA 2018 Voted Best Bank in Ankeny (Des Moines Register) Major Employers ( Des Moines & Ankeny) UnityPoint Health Principal Financial Group Hy - Vee, Inc. Mercy Medical Center Nationwide Corteva Agriscience , Agriculture Division of DowDuPont Kum & Go Wellmark Blue Cross and Blue Shield John Deere Des Moines Works Bridgestone Americas Tire Operations Casey’s General Stores Inc. Tones Spices/Division of AH Food Co., Inc. On average, seven people move to Ankeny each day (2018) (City of Ankeny) More people are moving to Ankeny than any other community in Iowa (2018) (City of Ankeny) Ankeny’s population has more than doubled in 16 years (U.S. Census Bureau) 4th out of the 15 fastest - growing cities with population of 50,000+ in the United States (2018) (U.S. Census Bureau) Top 10% of Best Small Cities to Live in America (2018) (WalletHub) #1 Most Popular City for Millennial Homebuyers (2018) (Lending Tree) #2 City to Work in Tech (2018) ( SmartAsset ) #4 Best Place to Live (2018) (U.S. News & World Report) #4 Top City with a Low Cost of Living and High Quality of Life (2018) (BadCredit.org) #7 Best Place for Business and Careers (2018) (Forbes) #8 Best City to Find Small Business Jobs (2018) (ZipRecruiter) #8 Best Job Market for 2018 (2018) (ZipRecruiter) One of “5 Up - and - Coming Tech Hotspots” (2018) (Livability) One of “12 Surprisingly Great Places to Retire in the Midwest” (2018) (Kiplinger) Average annual population growth rate of 2% (similar to Nashville, Portland and Denver) Cost of doing business is 17% lower than the national average (Moody’s Analytics) 81 insurance companies headquartered in Des Moines Recent Projects in Greater Des Moines: Apple (Data Center) - $1.4B, Facebook (Data Center) - $3B, Microsoft (Data Center) - $3.5B, DuPont Pioneer (Biosciences) - $500M, Principal (Financial Services) - $400M Source: FDIC deposit market share data as provided by S&P Global. Deposit data is as of 6/30/19. Des Moines (Metro) Highlights Ankeny Highlights Deposit Market Share * Millions of dollars, as of 6/30/19, Des Moines/West Des Moines - IA, MSA Institution Name Offices in MSA Deposits* Market Share 1. Wells Fargo & Co. 17 2,958.0 16.84% 2. BTC Financial Corp. 19 2,846.6 16.21% 3. West Bancorp 8 1,659.1 9.45% 4. U.S. Bancorp 13 1,478.8 8.42% 5. Bank of America Corporation 3 1,056.2 6.01% 6. Great Western Bancorp 11 1,032.2 5.88% 7. Community State Bank 10 705.8 4.02% 8. BNP Paribas 12 474.8 2.70% 9. Stark Bank Group Ltd. 5 378.3 2.15% 10. Albrecht Financial Svcs Inc. 7 303.2 1.73%
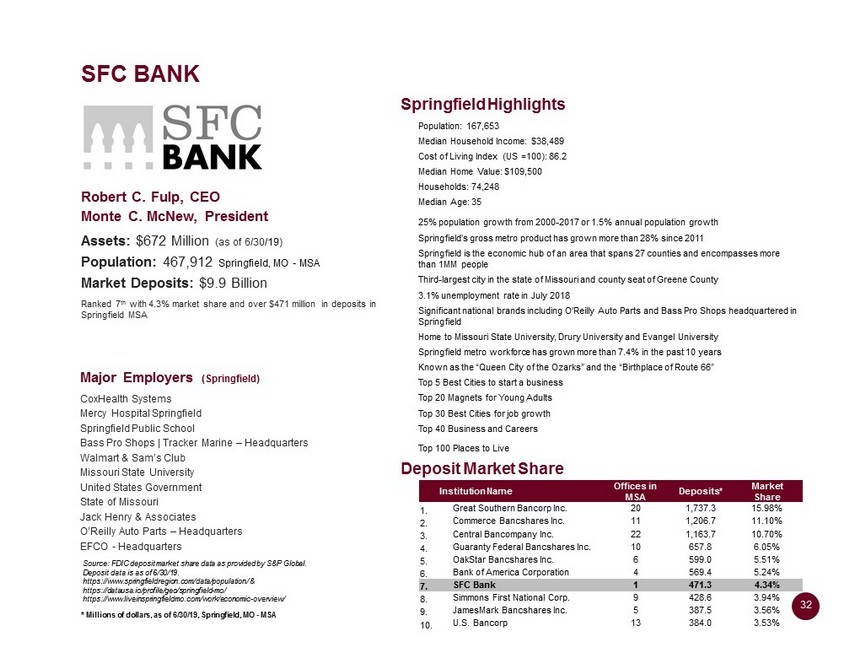
32 SFC BANK Robert C. Fulp, CEO Monte C. McNew , President Assets: $672 Million (as of 6/30 /19 ) Population: 467,912 Springfield, MO - MSA Market Deposits: $9.9 Billion Ranked 7 th with 4.3% market share and over $471 million in deposits in Springfield MSA Major Employers ( Springfield) CoxHealth Systems Mercy Hospital Springfield Springfield Public School Bass Pro Shops | Tracker Marine – Headquarters Walmart & Sam’s Club Missouri State University United States Government State of Missouri Jack Henry & Associates O’Reilly Auto Parts – Headquarters EFCO - Headquarters Population: 167,653 Median Household Income: $38,489 Cost of Living Index (US =100): 86.2 Median Home Value: $109,500 Households: 74,248 Median Age: 35 25% population growth from 2000 - 2017 or 1.5% annual population growth Springfield’s gross metro product has grown more than 28% since 2011 Springfield is the economic hub of an area that spans 27 counties and encompasses more than 1MM people Third - largest city in the state of Missouri and county seat of Greene County 3.1% unemployment rate in July 2018 Significant national brands including O’Reilly Auto Parts and Bass Pro Shops headquartered in Springfield Home to Missouri State University, Drury University and Evangel University Springfield metro workforce has grown more than 7.4% in the past 10 years Known as the “Queen City of the Ozarks” and the “Birthplace of Route 66” Top 5 Best Cities to start a business Top 20 Magnets for Young Adults Top 30 Best Cities for job growth Top 40 Business and Careers Top 100 Places to Live Source: FDIC deposit market share data as provided by S&P Global. Deposit data is as of 6/30/19. https://www.springfieldregion.com/data/population/ & https://datausa.io/profile/geo/springfield - mo/ https://www.liveinspringfieldmo.com/work/economic - overview/ Springfield Highlights Deposit Market Share * Millions of dollars, as of 6/30/19, Springfield, MO - MSA Institution Name Offices in MSA Deposits* Market Share 1. Great Southern Bancorp Inc. 20 1,737.3 15.98% 2. Commerce Bancshares Inc. 11 1,206.7 11.10% 3. Central Bancompany Inc. 22 1,163.7 10.70% 4. Guaranty Federal Bancshares Inc. 10 657.8 6.05% 5. OakStar Bancshares Inc. 6 599.0 5.51% 6. Bank of America Corporation 4 569.4 5.24% 7. SFC Bank 1 471.3 4.34% 8. Simmons First National Corp. 9 428.6 3.94% 9. JamesMark Bancshares Inc. 5 387.5 3.56% 10. U.S. Bancorp 13 384.0 3.53%

33 ROCKFORD BANK & TRUST – SALE COMPLETE Thomas D. Budd, President & CEO Assets: $523 Million (as of 6/30 /19 ) Population: 336,116 Market Deposits: $6.2 Billion Ranked 7 th with 7.1% market share and $453 million in deposits in Rockford MSA Major Employers Fiat Chrysler Automobiles Mercyhealth Rockford Public Schools SwedishAmerican Health System OSF Healthcare UPS Collins Aerospace Woodward PCI – Packaging Coordinators Inc. Wal - Mart Stores Top 15 “Best Places to Move to in the U.S. (Before They Get Too Crowded)” Mercyhealth opened the Javon Bea Hospital and Physician Clinic, a $505 million state - of - the - art regional health care facility AAR’s (a global aftermarket solutions company with 6,000+ employees in 20+ countries) announces new partnership with Rock Valley College to enhance aviation maintenance instruction and students’ career prospects Rockford Airport beats 2017 records with nearly a 22 percent increase through the first 10 months of 2018 Amazon expands Amazon Air operation at the Rockford airport Fiat Chrysler Belvidere plant to invest $350MM to retool for Jeep Cherokee production generating new jobs for 300 people Logistical Operations Hub – Current home to large - scale UPS and Con - way Freight, recent ground breaking for FedEx facility generating 150 new jobs Downtown revitalization – 160 room, $87.5MM hotel and convention center developed by Gorman & Co. set to open in 2020 Riverfront sports complex, $25MM, 115,000 sq /ft one of the largest in the Midwest; opened 2016 Fourth largest city in Illinois conveniently located a short 60 - minute drive to Chicago’s O’Hare International Airport, and only 90 minutes from downtown Chicago, Milwaukee and Madison Selected #4 of The 10 Best Locations to Work in Manufacturing by Industry Week Rockford Highlights Deposit Market Share Source: FDIC deposit market share data as provided by S&P Global. Deposit data is as of 6/30/19. *Millions of dollars, as of 6/30/19, Rockford - IL, MSA ** Formerly known as Alpine Bank & Trust. Midland States Bancorp acquired Alpine effective 2/28/18 Institution Name Offices in MSA Deposits* Market Share 1. Midland States Bancorp Inc. 16 953.9 14.98% 2. Associated Banc - Corp 6 742.7 11.66% 3. JPMorgan Chase & Co. 6 718.5 11.28% 4. Bank of Montreal 10 611.3 9.60% 5. Heartland Financial USA Inc. 4 545.3 8.56% 6. Blackhawk Bancorp Inc. 5 463.4 7.28% 7. Rockford Bank & Trust 2 453.1 7.12% 8. Foresight Fnl Group Inc. 8 394.3 6.19% 9. PNC Financial Services Group 6 334.7 5.26% 10. U.S. Bancorp 6 230.3 3.62% On November 30, 2019, QCRH completed the sale of substantially all of the assets of Rockford Bank & Trust to Illinois Bank & Trust.
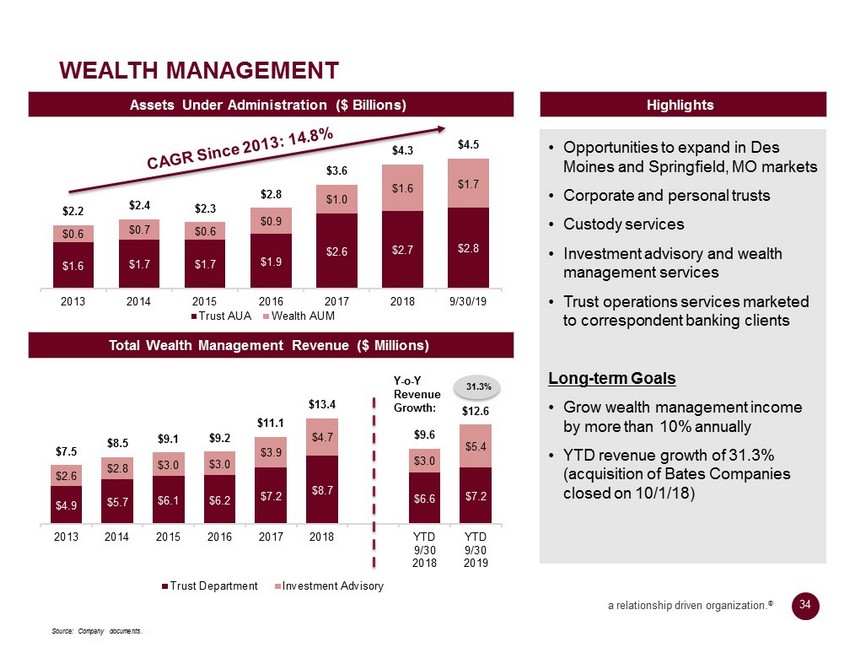
34 a relationship driven organization. ® $4.9 $5.7 $6.1 $6.2 $7.2 $8.7 $6.6 $7.2 $2.6 $2.8 $3.0 $3.0 $3.9 $4.7 $3.0 $5.4 $7.5 $8.5 $9.1 $9.2 $11.1 $13.4 $9.6 $12.6 2013 2014 2015 2016 2017 2018 YTD 9/30 2018 YTD 9/30 2019 Trust Department Investment Advisory $1.6 $1.7 $1.7 $1.9 $2.6 $2.7 $2.8 $0.6 $0.7 $0.6 $0.9 $1.0 $1.6 $1.7 $2.2 $2.4 $2.3 $2.8 $3.6 $4.3 $4.5 2013 2014 2015 2016 2017 2018 9/30/19 Trust AUA Wealth AUM • Opportunities to expand in Des Moines and Springfield, MO markets • Corporate and personal trusts • Custody services • Investment advisory and wealth management services • Trust operations services marketed to correspondent banking clients Long - term Goals • Grow wealth management income by more than 10% annually • YTD revenue growth of 31.3 % (acquisition of Bates Companies closed on 10/1/18) WEALTH MANAGEMENT Highlights Assets Under Administration ($ Billions) Source: Company documents. Total Wealth Management Revenue ($ Millions) 31.3% Y - o - Y Revenue Growth:

35 a relationship driven organization. ® CORRESPONDENT BANKING AND SPECIALTY FINANCE GROUP Source: Company documents. Loan Sale Income Swaps Correspondent Banking ▪ Competitively positioned with experienced staff, software systems and processes ▪ 195 relationships in IL, IA and WI with significant opportunities in MO. ▪ Average deposits exceed $ 500 M ▪ Bank stock loans ▪ Dedicated and experienced servicing and portfolio management staff with expertise in government guaranteed loans (SBA and USDA programs) ▪ Limited reliance on residential mortgage sales to drive fee income ▪ Provide interest rate swaps on select commercial loans ▪ Customer receives fixed rate loan while generating floating rate exposure plus expanding fee income stream ▪ Strong growth due to interest rate environment Swap Fee + Loan Sale Income $ millions 172 181 187 190 $ millions Relationships Specialty Finance Group $1.7 $1.7 $3.1 $10.8 $3.7 $20.9 $1.3 $3.2 $1.2 $0.4 $0.4 $0.6 $3.0 $4.9 $4.3 $11.2 $4.1 $21.5 2015 2016 2017 2018 YTD 9/30 2018 YTD 9/30 2019 Swap Fees GOS - Govt. Guaranteed $343 $347 $412 $417 $501 $68 $68 $73 $82 $108 2015 2016 2017 2018 YTD 9/30 2019 Average Deposits Loans 195

36 a relationship driven organization. ® GAAP TO NON - GAAP RECONCILIATIONS (1) Net interest margin (TEY) is a non - GAAP financial measure. The Company's management utilizes this measurement to take into account the tax benefit associated with certain loans and securities. It is also standard industry practice to measure net interest margin using tax - equivalent measures. In compliance with applicable rules of the SEC, this non - GAAP measure is reconcil ed to net interest income, which is the most directly comparable GAAP financial measure. In addition, the Company calculates net interest margin without the impact of acquisition accounting net accretion as this can fluctuate and it's diff icu lt to provide a more realistic run - rate for future periods. (2) Interest earned and yields on nontaxable securities and loans are determined on a tax equivalent basis using a 21% tax rate. (3) Efficiency ratio is a non - GAAP measure. The Company's management utilizes this ratio to compare to industry peers. The rat io is used to calculate overhead as a percentage of revenue. In compliance with the applicable rules of the SEC, this non - GAAP measure is reconciled to noninterest expense, net interest income and noninterest income, which are the most directly co mpa rable GAAP financial measures. For the Quarter Ended For the Nine Months Ended (dollars in thousands) September 30, June 30, March 31, December 31, September 30, September 30, September 30, NET INTEREST MARGIN (TEY) (1) 2019 2019 2019 2018 2018 2019 2018 Net interest income (GAAP) $ 40,719 $ 38,013 $ 36,908 $ 39,593 $ 38,314 $ 115,640 $ 102,801 Plus: Tax equivalent adjustment (2) 1,763 1,808 1,794 1,751 1,548 4,944 4,329 Net interest income - tax equivalent (Non - GAAP) $ 42,482 $ 39,821 $ 38,702 $ 41,344 $ 39,862 $ 120,584 $ 107,130 Less: Acquisition accounting net accretion 1,268 1,076 1,069 2,609 1,677 3,413 2,921 Adjusted net interest income $ 41,214 $ 38,745 $ 37,633 $ 38,735 $ 38,185 $ 117,171 $ 104,209 Average earning assets $ 4,791,274 $ 4,698,021 $ 4,612,553 $ 4,513,277 $ 4,387,487 $ 4,700,617 $ 3,989,099 Net interest margin (GAAP) 3.37% 3.25% 3.25% 3.48% 3.46% 3.29% 3.45% Net interest margin (TEY) (Non - GAAP) 3.52% 3.40% 3.40% 3.63% 3.60% 3.43% 3.59% Adjusted net interest margin (TEY) (Non - GAAP) 3.41% 3.31% 3.31% 3.40% 3.45% 3.33% 3.49% EFFICIENCY RATIO (3) Noninterest expense (GAAP) $ 39,945 $ 36,560 $ 32,435 $ 36,410 $ 30,500 $ 108,941 $ 82,733 Net interest income (GAAP) $ 40,719 $ 38,013 $ 36,908 $ 39,593 $ 38,314 $ 115,640 $ 102,801 Noninterest income (GAAP) 19,906 17,065 11,993 15,279 8,809 48,964 26,262 Total income $ 60,625 $ 55,078 $ 48,901 $ 54,872 $ 47,123 $ 164,604 $ 129,063 Efficiency ratio (noninterest expense/total income) (Non - GAAP) 65.89% 66.38% 66.33% 66.35% 64.72% 66.18% 64.10%

37 a relationship driven organization. ® GAAP TO NON - GAAP RECONCILIATIONS (CONT.) (1) This ratio is a non - GAAP financial measure. The Company's management believes that this measurement is important to many in vestors in the marketplace who are interested in changes period - to - period in common equity. In compliance with applicable rules of the SEC, this non - GAAP measure is reconciled to stockholders' equity and total assets, which are the most directly comparable GAAP financial measures. (2) Nonrecurring items (post - tax) are calculated using an estimated effective tax rate of 21%. (3) Acquisition costs were analyzed individually for deductibility. Presented amounts are tax - effected accordingly. For the Quarter Ended For the Nine Months Ended (dollars in thousands, except per share data) September 30, June 30, March 31 December 31, September 30, September 30, September 30, ADJUSTED NET INCOME (1) 2019 2019 2019 2018 2018 2019 2018 Net income (GAAP) $ 15,095 $ 13,504 $ 12,918 $ 13,316 $ 8,809 $ 41,517 $ 29,804 Less nonrecurring items (post - tax) (2): Income: Securities gains, net (2) $ (41) $ - $ - $ - $ (43) $ - Total nonrecurring income (non - GAAP) $ (2) $ (41) $ - $ - $ - $ (43) $ - Expense: Losses on debt extinguishment, net $ 117 $ - $ - $ - $ - $ 117 $ - Acquisition costs (3) - - - 29 1,216 - 1,616 Post - acquisition compensation, transition and integration costs 698 559 106 1,127 390 1,363 520 Total nonrecurring expense (non - GAAP) $ 815 $ 559 $ 106 $ 1,156 $ 1,606 $ 1,480 $ 2,136 Adjusted net income (non - GAAP) (1) $ 15,912 $ 14,104 $ 13,024 $ 14,472 $ 10,415 $ 43,040 $ 31,940 ADJUSTED EARNINGS PER COMMON SHARE (1) Adjusted net income (non - GAAP) (from above) $ 15,912 $ 14,104 $ 13,024 $ 14,472 $ 10,415 $ 43,040 $ 31,940 Weighted average common shares outstanding 15,739,430 15,714,588 15,693,345 15,641,401 15,625,123 15,715,788 14,477,783 Weighted average common and common equivalent shares outstanding 15,976,742 15,938,377 15,922,940 15,898,591 15,922,324 15,946,020 14,786,777 Adjusted earnings per common share (non - GAAP): Basic $ 1.01 $ 0.90 $ 0.83 $ 0.93 $ 0.67 $ 2.74 $ 2.21 Diluted $ 1.00 $ 0.88 $ 0.82 $ 0.91 $ 0.65 $ 2.70 $ 2.16 ADJUSTED RETURN ON AVERAGE ASSETS (1) Adjusted net income (non - GAAP) (from above) $ 15,912 $ 14,104 $ 13,024 $ 14,472 $ 10,415 $ 43,040 $ 31,940 Average Assets $ 5,217,763 $ 5,077,900 $ 4,968,502 $ 4,842,232 $ 4,677,875 $ 5,088,055 $ 4,242,083 Adjusted return on average assets (annualized) (non - GAAP) 1.22% 1.11% 1.05% 1.20% 0.89% 1.13% 1.00%

38 a relationship driven organization. ® GAAP TO NON - GAAP RECONCILIATIONS (CONT.) As of (dollars in thousands, except per share data) September 30, June 30 March 31 December 31, September 30, GAAP TO NON - GAAP RECONCILIATIONS 2019 2019 2019 2018 2018 TANGIBLE COMMON EQUITY TO TANGIBLE ASSETS RATIO Stockholders' equity (GAAP) $ 519,743 $ 504,300 $ 488,407 $ 473,138 $ 457,387 Less: Intangible assets 93,277 93,837 94,790 95,282 89,755 Tangible common equity (non - GAAP) $ 426,466 $ 410,463 $ 393,617 $ 377,856 $ 367,632 Total assets (GAAP) $ 5,292,382 $ 5,194,852 $ 5,066,662 $ 4,949,710 $ 4,792,732 Less: Intangible assets 93,277 93,837 94,790 95,282 89,755 Tangible assets (non - GAAP) $ 5,199,105 $ 5,101,015 $ 4,971,872 $ 4,854,428 $ 4,702,977 Tangible common equity to tangible assets ratio (non - GAAP) 8.20% 8.05% 7.92% 7.78% 7.82%

39 a relationship driven organization. ® This page intentionally blank
3551 Seventh Street Moline, IL 61265 www.qcrh.com © Copyright 2019 QCR Holdings, Inc. All Rights Reserved