Attached files
| file | filename |
|---|---|
| 8-K - 8-K - WABASH NATIONAL Corp | a8-k1x30x19.htm |

WABASH NATIONAL CORPORATION 2018 Q4 Earnings Release

SAFE HARBOR STATEMENT AND NON -GAAP F INANCIAL MEASURES This presentation contains certain forward-looking statements as defined by the Private Securities Litigation Reform Act of 1995. Forward-looking statements convey the Company’s current expectations or forecasts of future events. All statements contained in this presentation other than statements of historical fact are forward-looking statements. These forward-looking statements include, among other things, all statements regarding the Company’s outlook for trailer and truck body shipments, backlog, expectations regarding demand levels for trailers, truck bodies, non-trailer equipment and our other diversified product offerings, pricing, profitability and earnings, cash flow and liquidity, opportunity to capture higher margin sales, new product innovations, our growth and diversification strategies, our expectations for improved financial performance during the course of the year and our expectations with regards to capital allocation. These and the Company’s other forward-looking statements are subject to certain risks and uncertainties that could cause actual results to differ materially from those implied by the forward- looking statements. Without limitation, these risks and uncertainties include the continued integration of Supreme into the Company’s business, adverse reactions to the transaction by customers, suppliers or strategic partners, uncertain economic conditions including the possibility that customer demand may not meet our expectations, increased competition, reliance on certain customers and corporate partnerships, risks of customer pick-up delays, shortages and costs of raw materials including the impact of tariffs or other international trade developments, risks in implementing and sustaining improvements in the Company’s manufacturing operations and cost containment, dependence on industry trends and timing, supplier constraints, labor costs and availability, customer acceptance of and reactions to pricing changes and costs of indebtedness. Readers should review and consider the various disclosures made by the Company in this presentation and in the Company’s reports to its stockholders and periodic reports on Forms 10-K and 10-Q. We cannot give assurance that the expectations reflected in our forward-looking statements will prove to be correct. Our actual results could differ materially from those anticipated in these forward-looking statements. All written and oral forward-looking statements attributable to us are expressly qualified in their entirety by the factors we disclose that could cause our actual results to differ materially from our expectations. In addition to disclosing financial results calculated in accordance with United States generally accepted accounting principles (GAAP), the financial information included in this presentation contains non-GAAP financial measures, including free cash flow, operating EBITDA, operating EBITDA margin, adjusted operating income, adjusted net income and adjusted earnings per diluted share. These non-GAAP measures should not be considered a substitute for, or superior to, financial measures and results calculated in accordance with GAAP, including net income, and reconciliations to GAAP financial statements should be carefully evaluated. Operating EBITDA is defined as earnings before interest, taxes, depreciation, amortization, stock-based compensation, acquisition expenses, impairments, and other non-operating income and expense. Management believes providing operating EBITDA is useful for investors to understand the Company’s performance and results of operations period to period with the exclusion of the items identified above. Management believes the presentation of operating EBITDA, when combined with the GAAP presentations of operating income and net income, is beneficial to an investor’s understanding of the Company’s operating performance. A reconciliation of operating EBITDA to net income is included in the appendix to this presentation. Free cash flow is defined as net cash provided by operating activities minus capital expenditures. Management believes providing free cash flow is useful for investors to understand the Company’s performance and results of cash generation period to period with the exclusion of the items identified above. Management believes the presentation of free cash flow, when combined with the GAAP presentations of cash provided by operating activities, is beneficial to an investor’s understanding of the Company’s operating performance. A reconciliation of free cash flow and net income conversion to free cash is included in the appendix to this presentation. Adjusted operating income, a non-GAAP financial measure, excludes certain costs, expenses, other charges, gains or income that are included in the determination of operating income under U.S. GAAP, but that management would not consider important in evaluating the quality of the Company’s operating results as they are not indicative of the Company’s core operating results or may obscure trends useful in evaluating the Company’s continuing activities. Accordingly, the Company presents adjusted operating income excluding these special items to help investors evaluate our operating performance and trends in our business consistent with how management evaluates such performance and trends. Further, the Company presents adjusted operating income to provide investors with a better understanding of the Company’s view of our results as compared to prior periods. A reconciliation of adjusted operating income to operating income, the most comparable GAAP financial measure, is included in the tables following this presentation. Adjusted net income and adjusted earnings per diluted share, each reflect adjustments for acquisition expenses, the losses attributable to the Company’s extinguishment of debt, impairment charges, executive severance costs, income or losses recognized on the sale and/or closure of former Company locations, adjustments related to the Company’s deferred tax assets as a result of IRS guidance on application of the Tax Cuts and Jobs Act of 2017, and reversal of reserves for uncertain tax positions. Management believes providing adjusted measures and excluding certain items facilitates comparisons to the Company’s prior year periods and, when combined with the GAAP presentation of net income and diluted net income per share, is beneficial to an investor’s understanding of the Company’s performance. A reconciliation of each of adjusted net income and adjusted earnings per diluted share to net income and net income per diluted share is included in the tables following this presentation. 2

HIGHLIGHTS OF QUARTER AND FULL YEAR RESULTS Important Year . Leadership transition & key roles filled in WNC’s . Excellent progress on Supreme integration progression . Further portfolio upgrades . Revenue grew 28% to record of $2.3B Key 2018 . Backlog to $1.8B Financial Results . Margins declined on supply issues, labor and materials costs . Operating EBITDA of $187M Balanced . Free Cash Flow of $78M, 113% FCF conversion over Net Income Capital . $34M of CapEx Allocation . $18M in Dividends . $53M in Share Repurchases . Expecting another strong year for revenue: $2.25B - $2.35B Going Forward . Focused on clearing the way for improved margin performance . EPS outlook at $1.50 - $1.70 3
OPERATIONAL FOCUS ITEMS . Increasing communication with chassis suppliers . Expanding relationships with stable suppliers . Materials hedged more closely to quoted prices . 2019 pricing increased to offset material cost inflation . Prepared to push through any further market/tariff cost pressure . Labor efficiency and production system initiatives launched to reduce manufacturing costs 4

Q4 2018 C ONSOLIDATED FINANCIAL PERFORMANCE Actual Robust Customer Demand +12% YoY Sales Growth Operating Result Lower than Expected $0.38 Adjusted EPS* 4Q17 Results Margins Pressured by Operating Environment 11.3% 13.4% Gross Margin Operating EBITDA $48M $51M Operating EBITDA Operating EBITDA Margin 7.8% 9.4% Operating EBITDA Margin *Q4 2018 EPS adjusted for gain on sale of facility, loss on debt extinguishment, asset impairment and executive severance expense 5
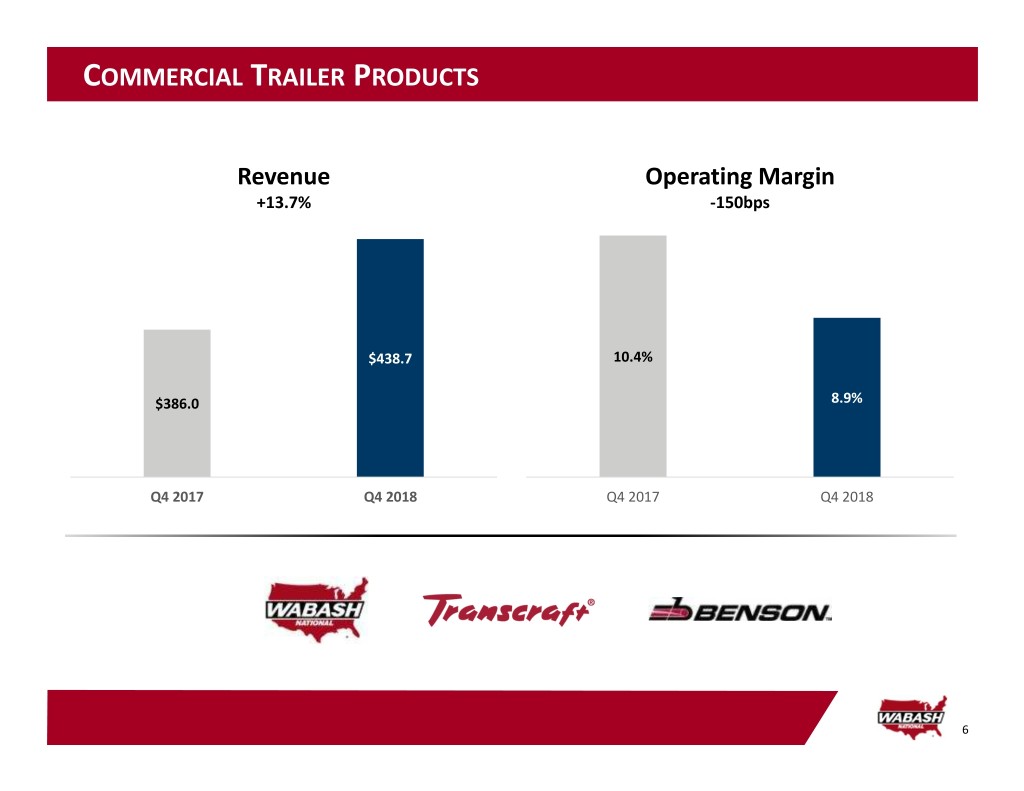
COMMERCIAL TRAILER PRODUCTS Revenue Operating Margin +13.7% -150bps $438.7 10.4% $386.0 8.9% Q4 2017 Q4 2018 Q4 2017 Q4 2018 6
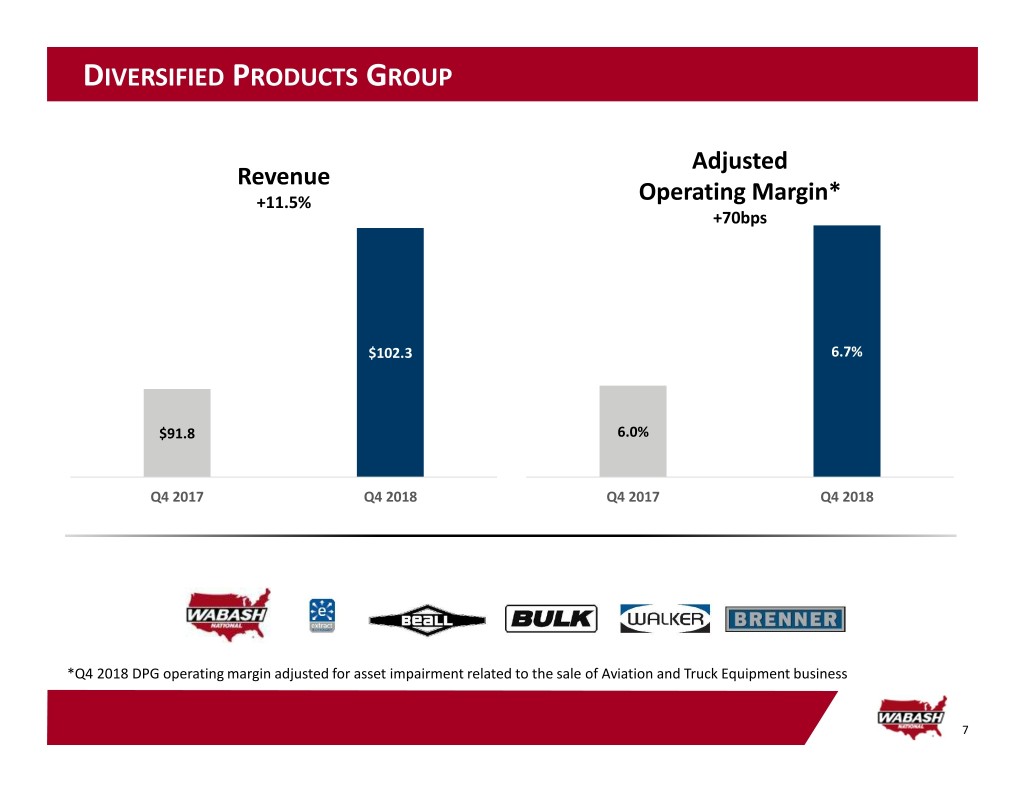
DIVERSIFIED PRODUCTS GROUP Adjusted Revenue +11.5% Operating Margin* +70bps $102.3 6.7% $91.8 6.0% Q4 2017 Q4 2018 Q4 2017 Q4 2018 *Q4 2018 DPG operating margin adjusted for asset impairment related to the sale of Aviation and Truck Equipment business 7

FINAL MILE PRODUCTS Adjusted Revenue +5.8% Operating Margin* -670bps 4.7% $74.5 -2.0% $70.5 Q4 2017 Q4 2018 Q4 2017 Q4 2018 *Q4 2017 operating margin adjusted for acquisition expenses and related charges 8

CASH GENERATION Q4 2018 YTD Q4 2017 YTD Net Income $69.4M $111.4M Operating Cash Flow $112.5M $144.4M Capital Expenditure $34.0M $26.1M Free Cash Flow¹ $78.5M $118.3M Free Cash Flow Conversion² 113% 106% ¹Q4 2017 operating margin adjusted for acquisition expenses and related charges ²Free cash flow conversion defined as free cash flow divided by net income 9

2018 C APITAL ALLOCATION RESULTS 13%+ Cash + Available Maintain Ample Liquidity and Borrowings % of Revenue Healthy Balance Sheet 9% 2.0x Working Capital % Net Debt/EBITDA of Revenue $34M Invest for Growth 2018 Capital Expenditures $18M 2018 Dividends Paid Return Capital to Shareholders $53M 2018 Share Repurchases 10

2019 GUIDANCE Expected Trends Key Metrics . CTP demand levels to remain historically strong in 2019 Sales Gross Margin 50 to 150 bps of . Tank Trailer market to remain similar to 2018 $2.25B-$2.35B Improvement vs 2018 . Truck Body market to continue secular growth trends Other . Operational improvement expected to generate stronger New Trailer Shipments: 58k-62k gross margins in 2H 2019 EPS SG&A % Sales: ~6% $1.50-1.70 Intangibles Amort: ~$21M Interest Expense: $28-29M CapEx: $35-45M Tax Rate: 26-27% 11

KEY MESSAGES . Important Steps Made in Positioning Wabash for the Future . Solid Cash Generation and Balanced Capital Allocation . Continued Strength in Market Conditions . Focused on Navigating Short-Term Operational Headwinds . Excited for a Strong 2019 for Wabash National 12

WABASH NATIONAL CORPORATION Appendix

CONSOLIDATED INCOME STATEMENT ($ in thousands, except per share amounts) 14
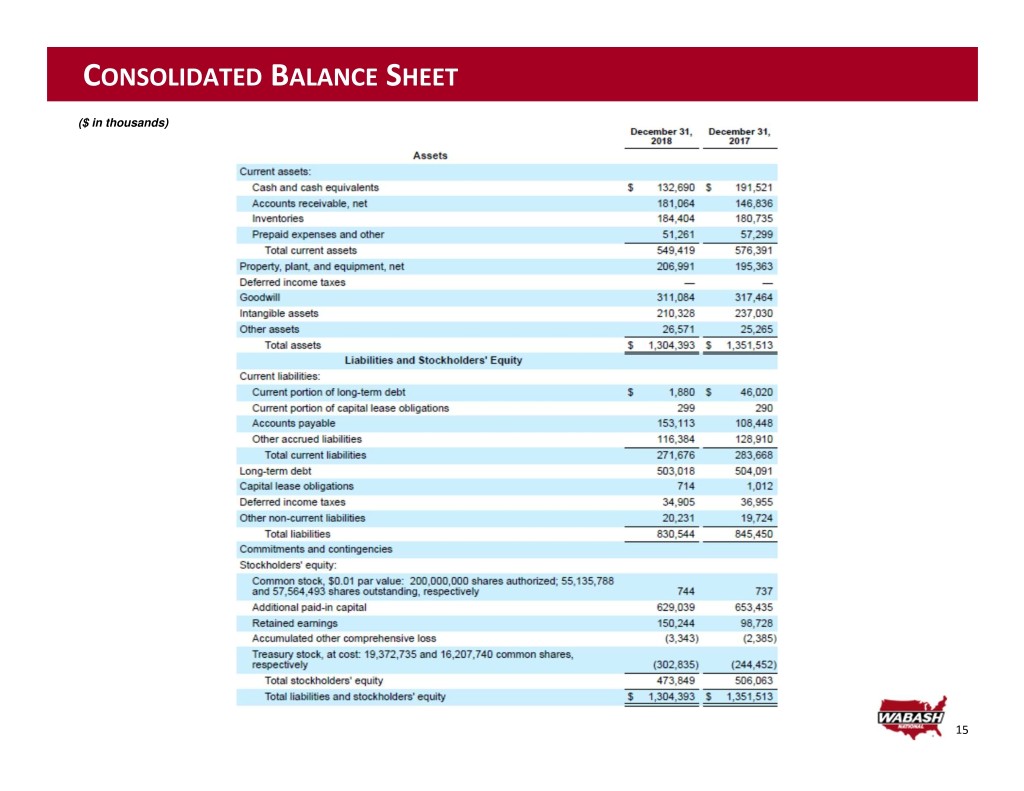
CONSOLIDATED BALANCE SHEET ($ in thousands) 15
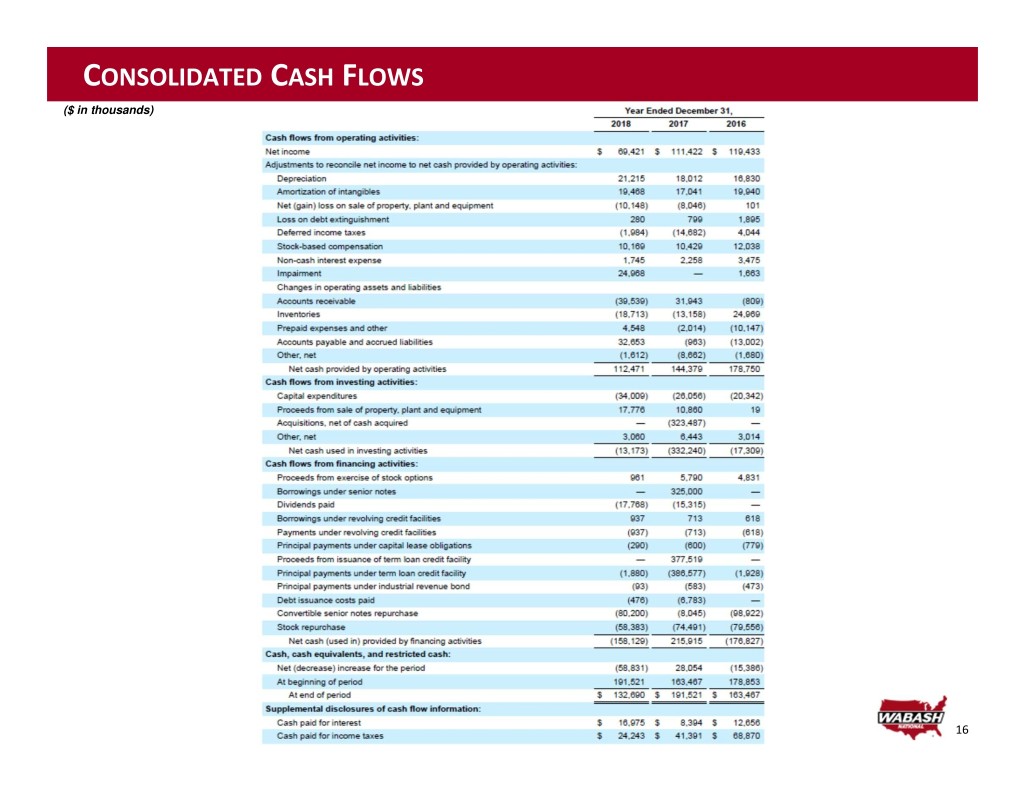
CONSOLIDATED CASH FLOWS ($ in thousands) 16

SEGMENTS AND RELATED INFORMATION ($ in thousands) 17

RECONCILIATION OF ADJUSTED SEGMENT AND OPERATING INCOME ($ in thousands) 18
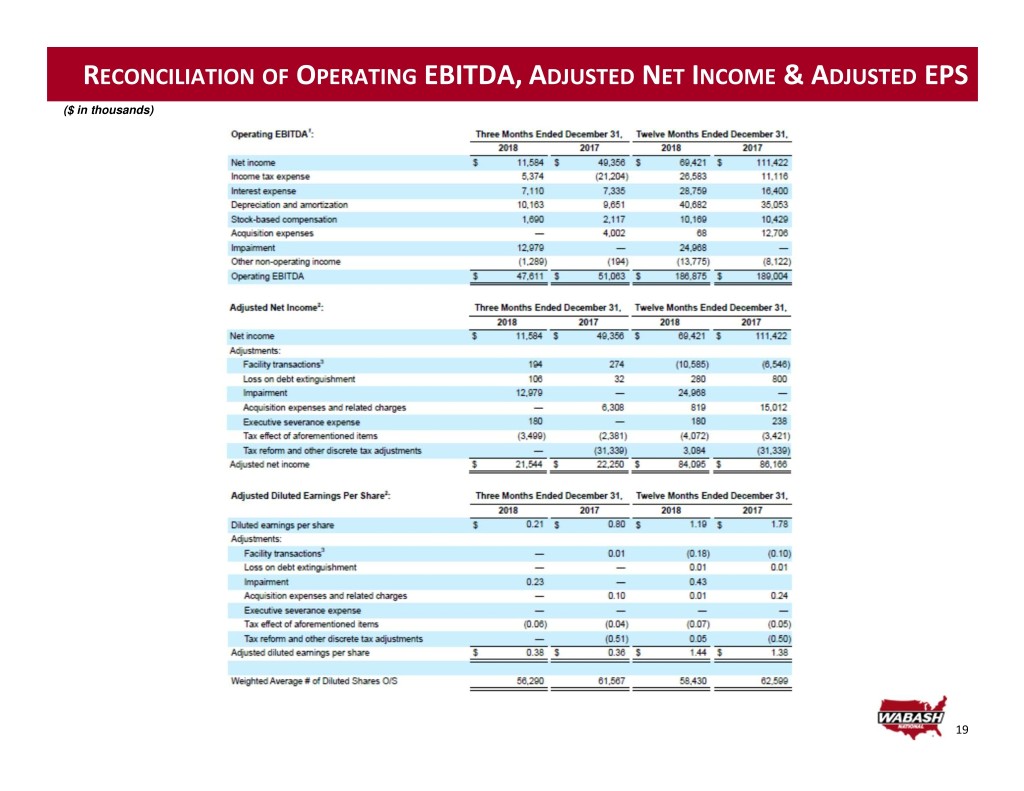
RECONCILIATION OF OPERATING EBITDA, A DJUSTED NET INCOME & A DJUSTED EPS ($ in thousands) 19

RECONCILIATION OF FREE CASH FLOW AND FREE CASH FLOW CONVERSION ($ in thousands) Twelve Months Ended December 31, 2018 2017 Net cash provided by operating activities$ 112,471 $ 144,379 Capital expenditures 34,009 26,056 Free cash flow$ 78,462 $ 118,323 Free cash flow$ 78,462 $ 118,323 Net income 69,421 111,422 Free cash flow conversion 113% 106% 20
