Attached files
| file | filename |
|---|---|
| 8-K - HOWARD BANCORP, INC. 8-K - Howard Bancorp Inc | a51932589.htm |

2018 Fourth QuarterEarnings Presentation January 2019

This presentation contains estimates, predictions, opinions, projections and other "forward-looking
statements" as that phrase is defined in the Private Securities Litigation Reform Act of 1995. Such statements include, without limitation, references to Howard Bancorp’s predictions or expectations of future business or financial performance
as well as its goals and objectives for future operations, financial and business trends, business prospects, and management’s outlook or expectations for earnings, revenues, expenses, capital levels, liquidity levels, asset quality or other
future financial or business performance, strategies or expectations. Such forward-looking statements are based on various assumptions (some of which may be beyond Howard Bancorp’s control) and are subject to risks and uncertainties (which
change over time) and other factors which could cause actual results to differ materially from those currently anticipated. Such risks and uncertainties include, but are not limited to, those related to difficult market conditions and
unfavorable economic trends in the United States generally, and particularly in the markets in which Howard Bancorp operates and in which its loans are concentrated, including the effects of declines in housing markets, an increase in
unemployment levels and slowdowns in economic growth; Howard Bancorp’s level of nonperforming assets and the costs associated with resolving problem loans including litigation and other costs; changes in market interest rates which may increase
funding costs and reduce earning asset yields and thus reduce margin; the impact of changes in interest rates and the credit quality and strength of underlying collateral; the credit risk associated with the substantial amount of commercial
real estate, construction and land development, and commercial and industrial loans in our loan portfolio; the extensive federal and state regulation, supervision and examination governing almost every aspect of Howard Bancorp’s operations
including the Dodd-Frank Wall Street Reform and Consumer Protection Act and the rules and regulations issued in accordance with this statute and potential expenses associated with complying with such regulations; possible additional loan losses
and impairment of the collectability of loans; Howard Bancorp’s ability to comply with applicable capital and liquidity requirements (including the finalized Basel III capital standards), including our ability to generate liquidity internally
or raise capital on favorable terms; any impairment of Howard Bancorp's goodwill or other intangible assets; system failure or cybersecurity breaches of the Company's network security; the Company's ability to recruit and retain key employees;
the effects of weather and natural disasters such as floods, droughts, wind, tornadoes and hurricanes as well as effects from geopolitical instability and man-made disasters including terrorist attacks; the effects of any reputation, credit,
interest rate, market, operational, legal, liquidity, regulatory and compliance risk resulting from developments related to any of the risks discussed above; and the costs associated with resolving any problem loans, litigation and other risks
and uncertainties, including those discussed in the Howard Bancorp’s Form 10-K for the year ended December 31, 2017 and other documents filed by Howard Bancorp with the Securities and Exchange Commission from time to time. Forward-looking
statements are as of the date they are made, and Howard Bancorp does not undertake to update any forward-looking statement, whether written or oral, that may be made from time to time by or on behalf of Howard Bancorp. 2 Forward Looking
Statements

3 Non-GAAP Information This presentation contains financial information determined by methods other
than in accordance with accounting principles generally accepted in the United States (“GAAP”). Howard’s management uses non-GAAP financial measures, management believes that non-GAAP financial measures provide additional useful information
that allows readers to evaluate the ongoing performance of Howard and provide meaningful comparison to its peers. Non-GAAP financial measures should not be considered as an alternative to any measure of performance or financial condition as
promulgated under GAAP, and investors should consider Howard's performance and financial condition as reported under GAAP and all other relevant information when assessing the performance or financial condition of Howard. This non-GAAP data
should be considered in addition to results prepared in accordance with GAAP, and is not a substitute for, or superior to, GAAP results. For a reconciliation of these non-GAAP measures to their comparable GAAP measures, see the final pages of
this presentation. The following are the non-GAAP measures used in this presentation:Core earnings per share (“EPS”) is a non-GAAP measure that excludes the impact of extraordinary costsCore net interest margin (“NIM”) is a non-GAAP measure
that excludes the impact of purchase accounting adjustment toward net interest income Core interest income is a non-GAAP measure that excludes the impact of purchase accounting adjustment toward net interest income

Fourth Quarter Highlights Earnings per share (“EPS”) for the 4th quarter was $0.01, down from $0.21 in
the 3rd quarter of 2018 The decrease was caused by a significant number of one-time expenses that are the beginning of our redesigned infrastructure platform. Excluding extraordinary items, the fourth quarter of 2018 core EPS(1) was $0.21.
Additional cost saves related to our infrastructure redesign were previously identified in 3rd quarter comments and executed on during the fourth quarter. Those expense reductions should create approximately $1.6 million in additional pre-tax
earnings going forward and are in line with our primary focus on sustainable EPS growth. Our total noninterest expenses of $18.4 million included $88 thousand of merger related expenses, $2.5 million in lease termination expenses and $352
thousand in OREO valuation costs. Excluding these three items recorded in Q4, our recurring operating expenses of $15.5 million were down from the $16.4 million in non-interest expenses in the third quarterNet interest margin (“NIM”) for the
4th quarter was 3.74%, excluding fair market value adjustments, it remained stable with prior periods and was 3.64%.Fourth quarter sequential loan growth equaled 1% and transaction deposits grew by 5.3%. Loan originations in the quarter were
$94 million. Our loan to deposit ratio stood at 97.9% at the end of the year.Closed on a $25 million subordinated debt issuance at 6.00% to create an even stronger capital base and position us even better to take advantage of our unique
position in an attractive market.Increased the securities portfolio by $99.5 million in the 4th quarter to help offset the cost of the subordinated debt and make it non-dilutive to EPS. Liquidity ratio increased to 10.8%. 4 (1) The core EPS
excludes the impact of extraordinary costs and is a non-GAAP financial measure. For a reconciliation of this non-GAAP financial measure to its comparable GAAP measure, see the final pages of this presentation.
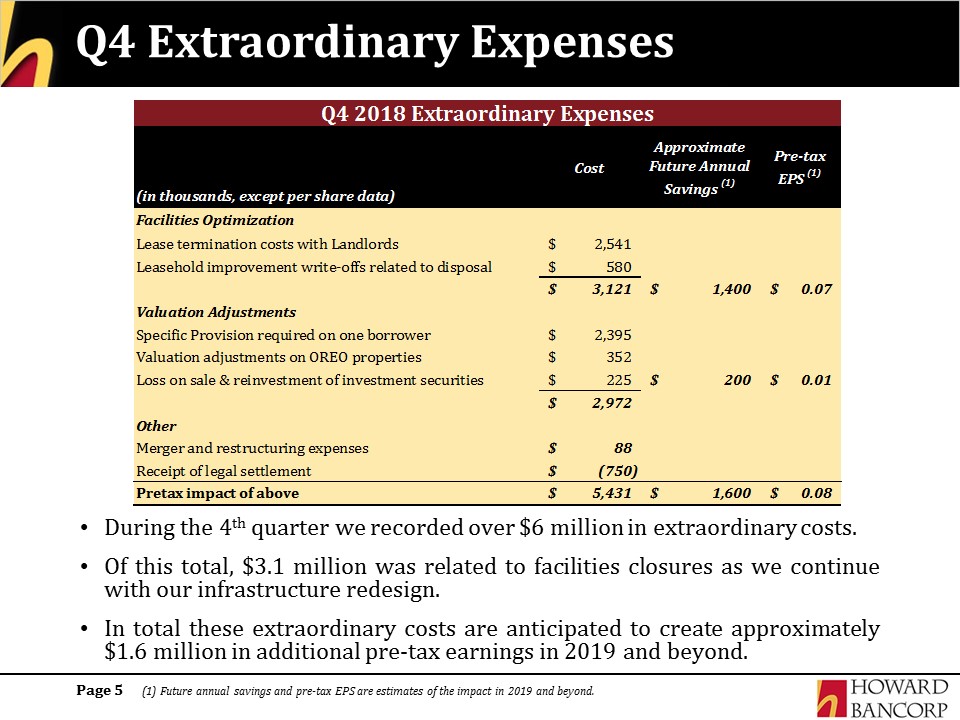
Q4 Extraordinary Expenses During the 4th quarter we recorded over $6 million in extraordinary costs.Of
this total, $3.1 million was related to facilities closures as we continue with our infrastructure redesign.In total these extraordinary costs are anticipated to create approximately $1.6 million in additional pre-tax earnings in 2019 and
beyond. 5 (1) Future annual savings and pre-tax EPS are estimates of the impact in 2019 and beyond.
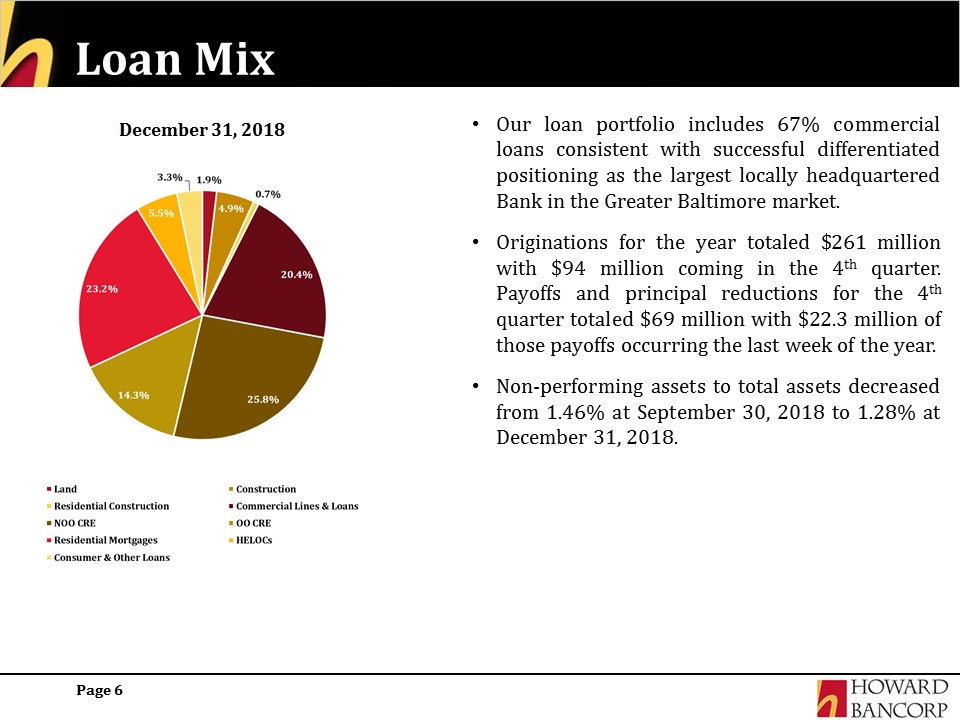
Loan Mix 6 December 31, 2018 Our loan portfolio includes 67% commercial loans consistent with
successful differentiated positioning as the largest locally headquartered Bank in the Greater Baltimore market.Originations for the year totaled $261 million with $94 million coming in the 4th quarter. Payoffs and principal reductions for the
4th quarter totaled $69 million with $22.3 million of those payoffs occurring the last week of the year.Non-performing assets to total assets decreased from 1.46% at September 30, 2018 to 1.28% at December 31, 2018.
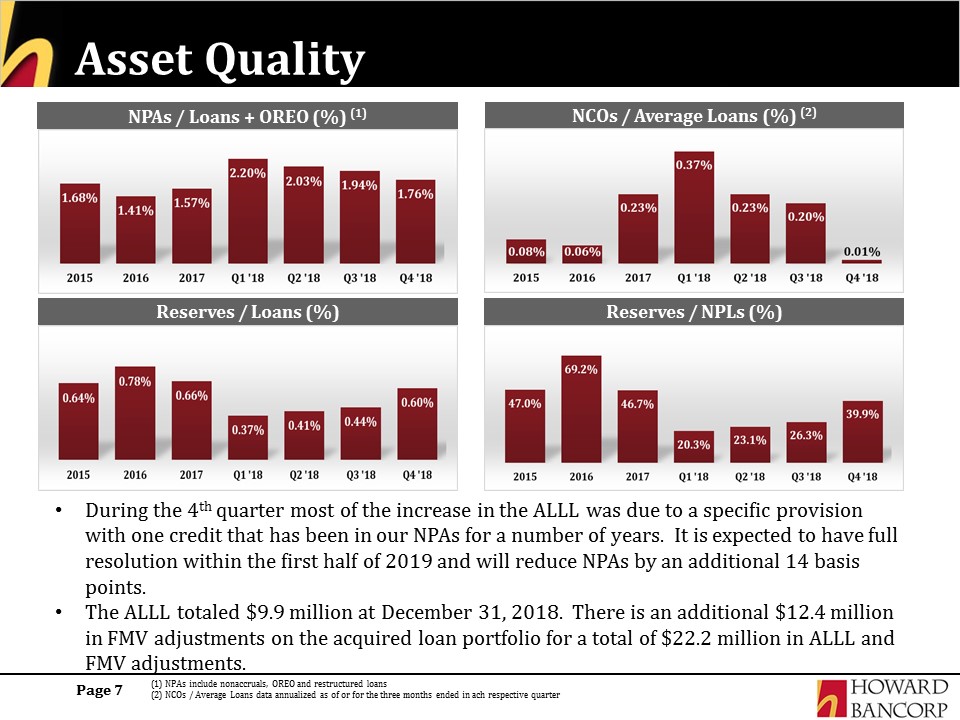
Asset Quality 7 (1) NPAs include nonaccruals, OREO and restructured loans(2) NCOs / Average Loans
data annualized as of or for the three months ended in ach respective quarter NPAs / Loans + OREO (%) (1) NCOs / Average Loans (%) (2) Reserves / NPLs (%) Reserves / Loans (%) During the 4th quarter most of the increase in the ALLL was due
to a specific provision with one credit that has been in our NPAs for a number of years. It is expected to have full resolution within the first half of 2019 and will reduce NPAs by an additional 14 basis points.The ALLL totaled $9.9 million at
December 31, 2018. There is an additional $12.4 million in FMV adjustments on the acquired loan portfolio for a total of $22.2 million in ALLL and FMV adjustments.

Continually Improving Funding Mix 8 Deposits increased by $61 million, or 4%, to $1.686 billion in 4th
quarter 2018.Focused funding on local customers versus FHLB advances.Cost of interest bearing deposits was 1.02% for Q4.Overall cost of deposits was 0.76% for Q4.Fourth quarter shows the continuation of a strong transactional deposit base and
ability to maintain clients in the highest quality accounts.Deposit beta of 24%.Transaction accounts represent 38.9% of total deposits. Historical Deposit Composition (in millions) Attractive Funding Mix

Capital Ratios 9 Last Six Quarter Capital Ratios The Total Risk Based Capital Ratio increased to 12.3%
in the 4th quarter from 11.0% in the 3rd quarter.

Net Interest Margin Net Interest Margin (“NIM”) remained stable for the fiscal year 2018 countering the
mid-Atlantic trend.Accretion of FMV has remained a small portion of the overall interest income since 2015.The gap between reported NIM and core NIM(1), excluding FMV accretion has remained relatively stable over the past few years.Interest
income for the 4th quarter was $22.3 million.Core interest income(1) grew by 3.3% from the 3rd quarter 2018. 10 NIM Trends Accretion Level of Interest Income (in thousands) (1) The core NIM and interest income excludes the impact of
purchase accounting adjustment toward net interest income and is a non-GAAP financial measure. For a reconciliation of this non-GAAP financial measure to its comparable GAAP measure, see the final pages of this presentation.
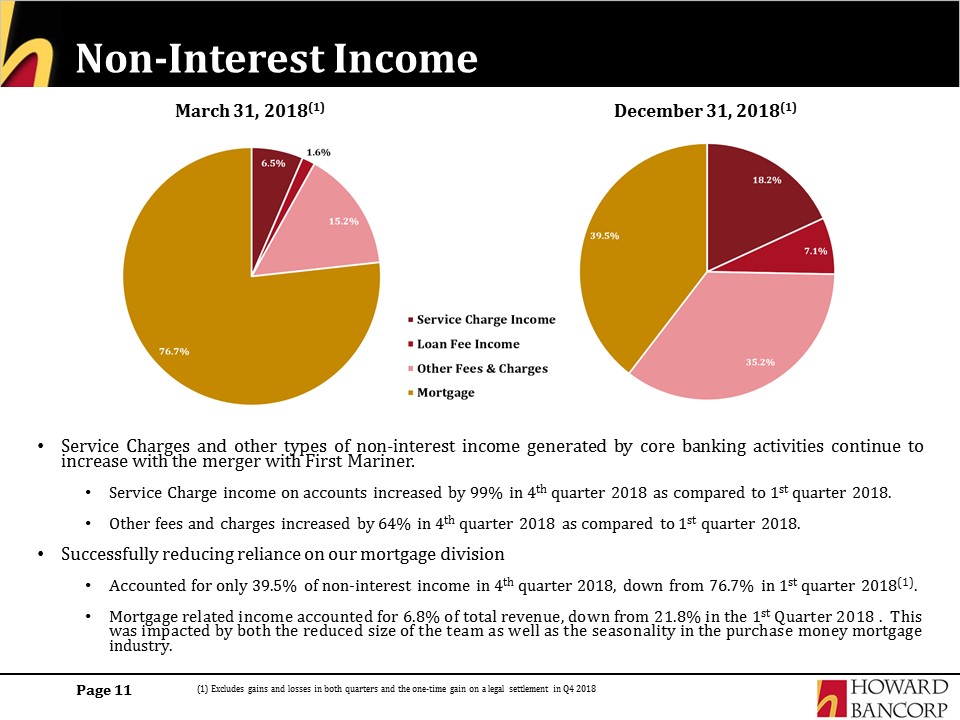
Non-Interest Income Service Charges and other types of non-interest income generated by core banking
activities continue to increase with the merger with First Mariner.Service Charge income on accounts increased by 99% in 4th quarter 2018 as compared to 1st quarter 2018.Other fees and charges increased by 64% in 4th quarter 2018 as compared to
1st quarter 2018.Successfully reducing reliance on our mortgage division Accounted for only 39.5% of non-interest income in 4th quarter 2018, down from 76.7% in 1st quarter 2018(1).Mortgage related income accounted for 6.8% of total revenue,
down from 21.8% in the 1st Quarter 2018 . This was impacted by both the reduced size of the team as well as the seasonality in the purchase money mortgage industry. 11 March 31, 2018(1) December 31, 2018(1) (1) Excludes gains and losses in
both quarters and the one-time gain on a legal settlement in Q4 2018

Non-Interest Expense 12 Our total noninterest expenses of $18.4 million included $88 thousand of merger
related expenses, $2.5 million in lease termination expenses and $352 thousand in OREO valuation costs. Excluding these three items recorded in Q4, our operating expenses of $15.5 million were down from the $16.4 million in non-interest
expenses in the third quarterThe branch network analysis is still underway to improve efficiency and optimize footprint over the next few years Non-Interest Expense (in millions) $16.4 $15.5

Summary Remarks Commercial loan growth funded by transaction deposits in an attractive marketStronger
originations activity towards the end of the year with a trajectory toward high single digit loan growthIncreasing reliance on core deposits (39% transaction deposits)Higher value added deposit mix (1.02% cost of deposits)Unique positioning as
largest locally headquartered bank in the attractive consolidating Greater Baltimore marketMaintaining stable core NIM Sustainably leveraging the scale acquired in acquisitions by improving efficiency$1.6 million in annual pre-tax benefits in
future years due to investment in infrastructure efficiencyReduced reliance on volatile and marginally profitable mortgage banking income Higher quality non interest income mix with increasing share coming from core banking businessWe have
achieved over 56% of non-interest expense savings in 2018 from the First Mariner mergerEnsuring strong capital base for future growth$25 million subordinated debt issuance that is non-dilutive to EPSImproved on balance sheet liquidity 13

APPENDIX 14
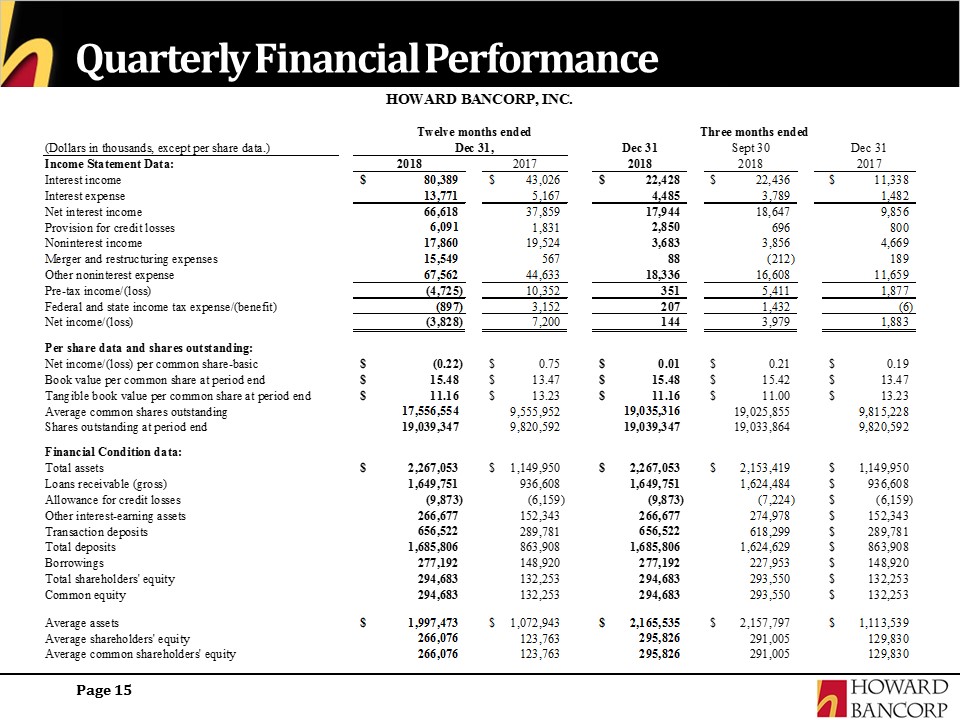
Quarterly Financial Performance 15

Quarterly Financial Performance 16

Reconciliation of Non-GAAP measures 17
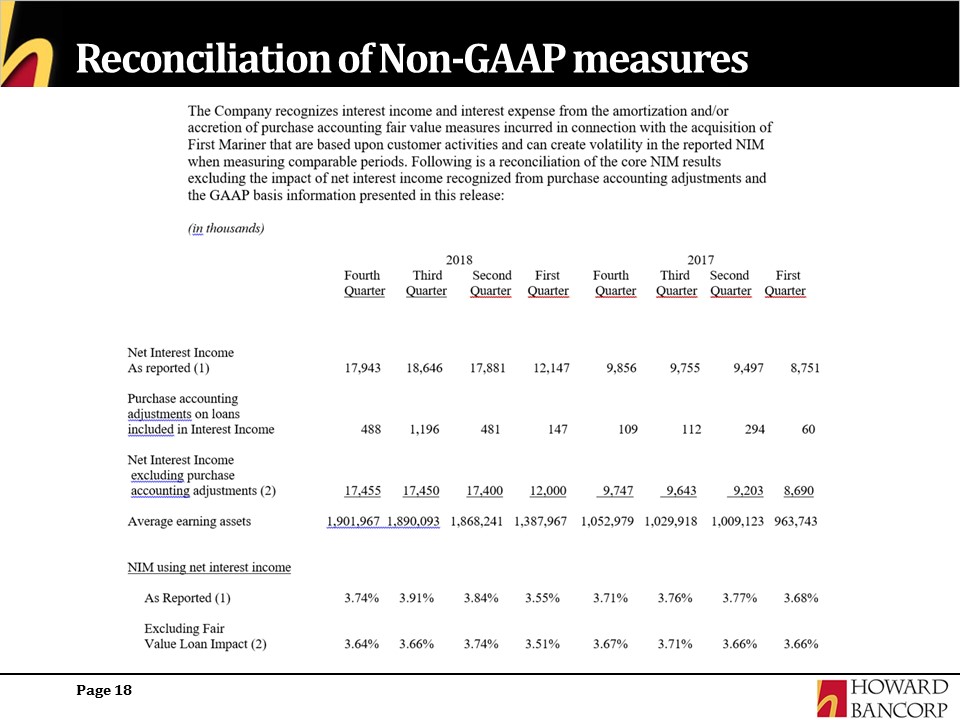
Reconciliation of Non-GAAP measures 18