Attached files
| file | filename |
|---|---|
| EX-99.1 - EXHIBIT 99.1 - PRESS RELEASE - Bankwell Financial Group, Inc. | ex99-1.htm |
| 8-K - BANKWELL FINANCIAL GROUP 8-K 1 30 19 - Bankwell Financial Group, Inc. | bwfg8k-013019.htm |
Bankwell Financial Group4Q’18 Investor Presentation

Safe Harbor This presentation may contain certain forward-looking statements about the Company.
Forward-looking statements include statements regarding anticipated future events and can be identified by the fact that they do not relate strictly to historical or current facts. They often include words such as “believe,” “expect,”
“would,” “should,” “could,” or “may.” Forward-looking statements, by their nature, are subject to risks and uncertainties. Certain factors that could cause actual results to differ materially from expected results include increased
competitive pressures, changes in the interest rate environment, general economic conditions or conditions within the securities markets, and legislative and regulatory changes that could adversely affect the business in which the Company and
its subsidiaries are engaged.

4Q’18 and 2018 Performance
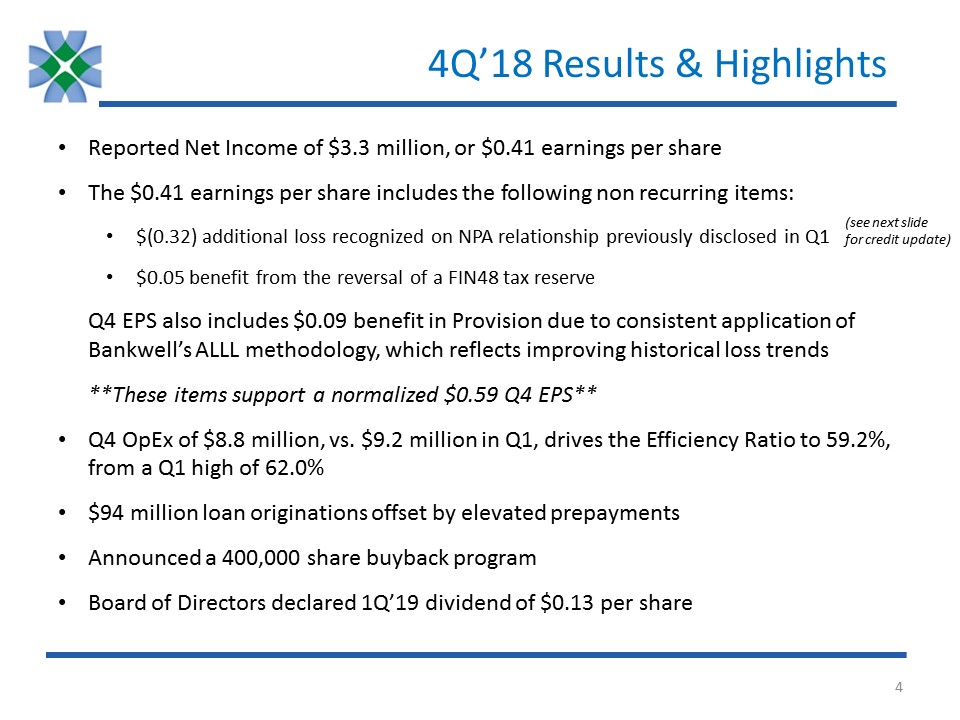
4Q’18 Results & Highlights Reported Net Income of $3.3 million, or $0.41 earnings per share The
$0.41 earnings per share includes the following non recurring items:$(0.32) additional loss recognized on NPA relationship previously disclosed in Q1$0.05 benefit from the reversal of a FIN48 tax reserveQ4 EPS also includes $0.09 benefit in
Provision due to consistent application of Bankwell’s ALLL methodology, which reflects improving historical loss trends**These items support a normalized $0.59 Q4 EPS**Q4 OpEx of $8.8 million, vs. $9.2 million in Q1, drives the Efficiency
Ratio to 59.2%, from a Q1 high of 62.0% $94 million loan originations offset by elevated prepaymentsAnnounced a 400,000 share buyback programBoard of Directors declared 1Q’19 dividend of $0.13 per share (see next slide for credit update)
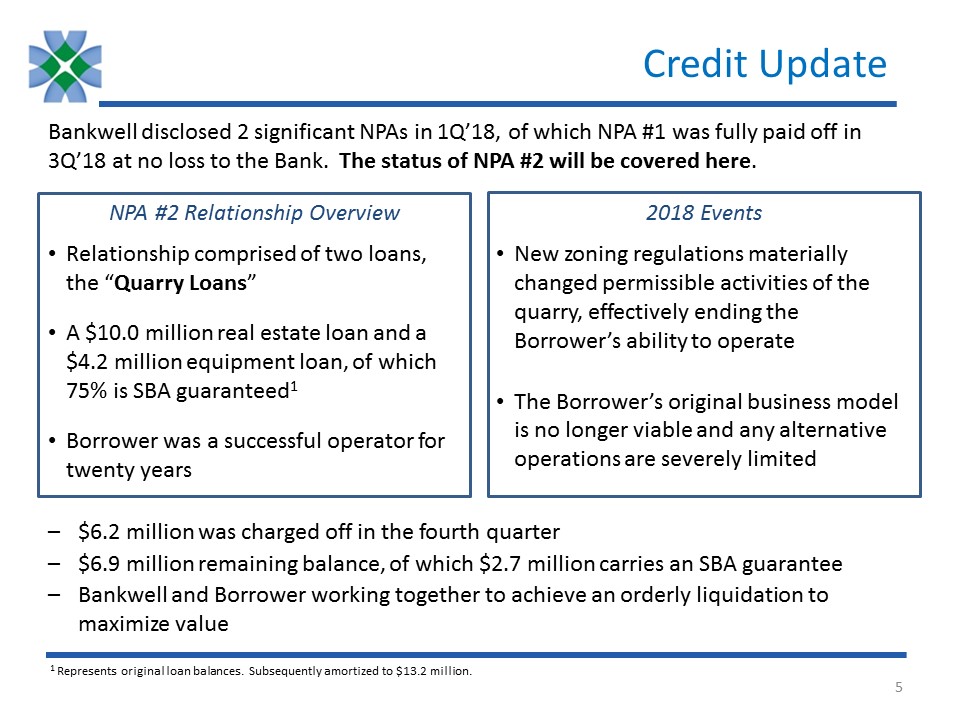
Credit Update Bankwell disclosed 2 significant NPAs in 1Q’18, of which NPA #1 was fully paid off in
3Q’18 at no loss to the Bank. The status of NPA #2 will be covered here. NPA #2 Relationship Overview 2018 Events Relationship comprised of two loans, the “Quarry Loans”A $10.0 million real estate loan and a $4.2 million equipment loan, of
which 75% is SBA guaranteed1Borrower was a successful operator for twenty years New zoning regulations materially changed permissible activities of the quarry, effectively ending the Borrower’s ability to operate The Borrower’s original
business model is no longer viable and any alternative operations are severely limited $6.2 million was charged off in the fourth quarter$6.9 million remaining balance, of which $2.7 million carries an SBA guaranteeBankwell and Borrower
working together to achieve an orderly liquidation to maximize value 1 Represents original loan balances. Subsequently amortized to $13.2 million.
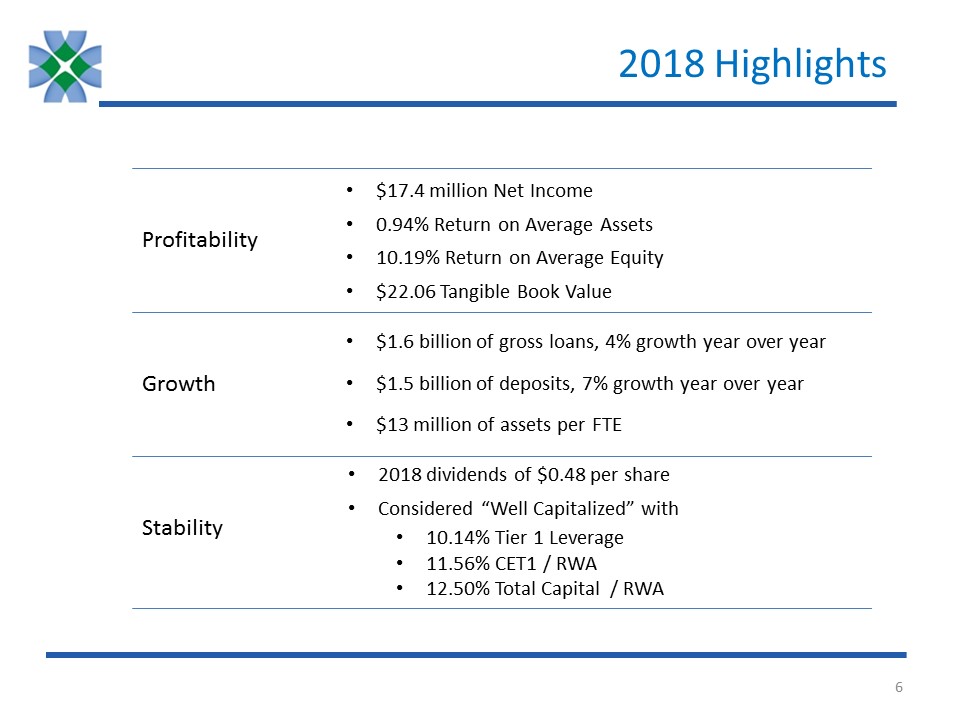
2018 Highlights Profitability Growth Stability $17.4 million Net Income0.94% Return on Average
Assets 10.19% Return on Average Equity$22.06 Tangible Book Value $1.6 billion of gross loans, 4% growth year over year$1.5 billion of deposits, 7% growth year over year$13 million of assets per FTE 2018 dividends of $0.48 per
shareConsidered “Well Capitalized” with 10.14% Tier 1 Leverage11.56% CET1 / RWA12.50% Total Capital / RWA
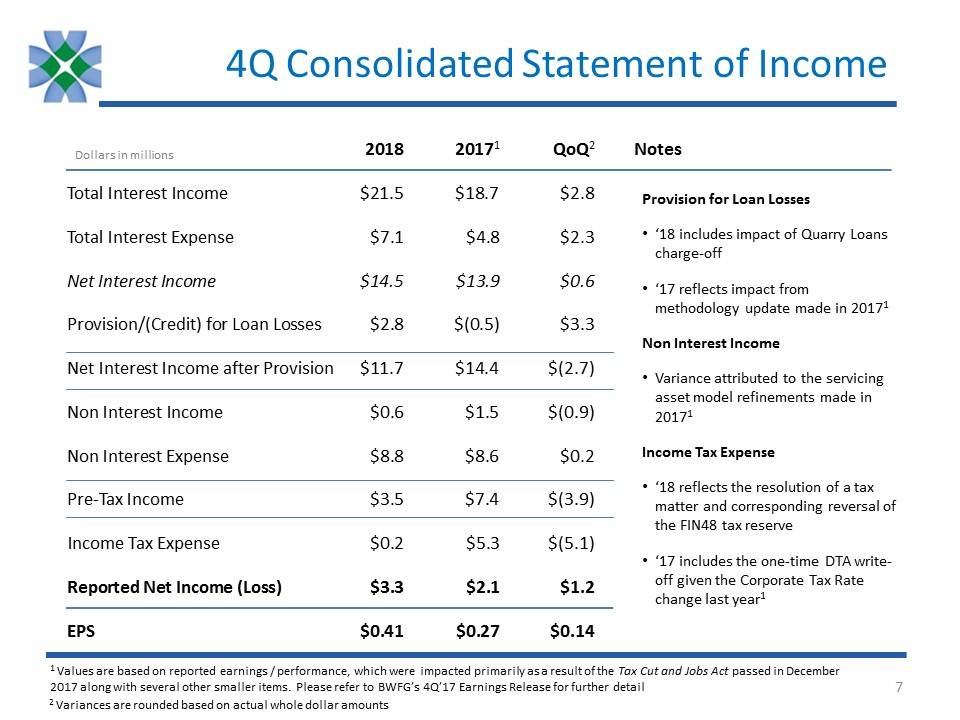
4Q Consolidated Statement of Income 2018 20171 QoQ2Total Interest Income $21.5 $18.7 $2.8Total
Interest Expense $7.1 $4.8 $2.3Net Interest Income $14.5 $13.9 $0.6Provision/(Credit) for Loan Losses $2.8 $(0.5) $3.3Net Interest Income after Provision $11.7 $14.4 $(2.7)Non Interest Income $0.6 $1.5 $(0.9)Non Interest Expense $8.8 $8.6
$0.2Pre-Tax Income $3.5 $7.4 $(3.9)Income Tax Expense $0.2 $5.3 $(5.1)Reported Net Income (Loss) $3.3 $2.1 $1.2EPS $0.41 $0.27 $0.14 Dollars in millions 2 Variances are rounded based on actual whole dollar amounts 1 Values are based on
reported earnings / performance, which were impacted primarily as a result of the Tax Cut and Jobs Act passed in December 2017 along with several other smaller items. Please refer to BWFG’s 4Q’17 Earnings Release for further
detail Notes Provision for Loan Losses‘18 includes impact of Quarry Loans charge-off ‘17 reflects impact from methodology update made in 20171Non Interest IncomeVariance attributed to the servicing asset model refinements made in
20171Income Tax Expense‘18 reflects the resolution of a tax matter and corresponding reversal of the FIN48 tax reserve ‘17 includes the one-time DTA write-off given the Corporate Tax Rate change last year1

2018 Consolidated Statement of Income 2018 20171 YoY2Total Interest Income $80.1 $71.2 $8.9Total
Interest Expense $23.7 $16.8 $6.9Net Interest Income $56.3 $54.4 $2.0Provision for Loan Losses $3.4 $1.3 $2.1Net Interest Income after Provision $52.9 $53.0 $(0.1)Non Interest Income $3.9 $4.6 $(0.7)Non Interest Expense $35.6 $32.5
$3.1Pre-Tax Income $21.2 $25.1 $(4.0)Income Tax Expense $3.7 $11.3 $(7.6)Reported Net Income (Loss) $17.4 $13.8 $3.6EPS $2.21 $1.78 $0.43 Dollars in millions Notes 2 Variances are rounded based on actual whole dollar amounts 1 Values are
based on reported earnings / performance, which were impacted primarily as a result of the Tax Cut and Jobs Act passed in December 2017 along with several other smaller items. Please refer to BWFG’s 4Q’17 Earnings Release for further
detail Provision for Loan Losses‘18 includes impact of Quarry Loans charge-off ‘17 reflects impact from methodology update made in 20171Non Interest IncomeVariance attributed to the servicing asset model refinements made in 20171Income Tax
Expense‘18 reflects the resolution of a tax matter and corresponding reversal of the FIN48 tax reserve ‘17 includes the one-time DTA write-off given the Corporate Tax Rate change last year1

2018 Consolidated Balance Sheet 2018 2017 YoY1Cash & Cash Equivalents $78 $71 $7AFS & HTM
Securities $117 $114 $3Loans Receivable, net $1,587 $1,521 $66All Other Assets $92 $91 $1Total Assets $1,874 $1,797 $77Total Deposits $1,502 $1,398 $104FHLB Advances & Other Borrowings $185 $224 $(39)Other Liabilities $12 $13 $(1)Total
Liabilities $1,699 $1,636 $64Equity $174 $161 $13Total Liabilities & Equity $1,874 $1,797 $77 Dollars in millions 1 Variances are rounded based on actual whole dollar amounts

Bankwell Overview

Bankwell MILESTONESAssets Bankwell’s Story Bankwell is one of the fastest growing and most profitable
community banks in Connecticut. Bankwell was named one of the “Top 100 Best Performing Community Banks of 2016” between $1 billion and $10 billion in assets nationwide based on certain metrics for the year ended December 31, 2016 by S&P
Global Market IntelligenceBankwell was named one of 29 banks nationwide to make the Sandler O’Neill + Partners list of “Sm-All Stars”, and the only CT bank to make the
list 2002 2007 2008 2010 2013 2014 2017 2016 2018 $0 $190,906 $247,041 $395,708 $779,618 $1,099,531 $1,628,919 $1,796,607 $1,873,665 Dollars in thousands Founded The Bank of New
Canaan Holding Company formed (BNC Financial Group) Founded second bank, The Bank of Fairfield Founded third bank, Stamford First Bank, a division of The Bank of New Canaan The banks merge into “Bankwell”; Bankwell acquires The Wilton
Bank Bankwell acquires Quinnipiac Bank & Trust Company Named one of the “Top 100 Best Performing Community Banks of 2016”1 Named to Sandler O’Neill “Sm-All Stars Class of 2017”2 Opened 3 new branches in Fairfield County

Bankwell Profile $1.87B asset Connecticut-based bank with focus on CRE and C&I lending12 existing
branches in Fairfield & New Haven Counties Company Overview NASDAQ: BWFG $162MM deposits per branch, excluding the 3 new branches opened in 2Q; highest in Fairfield & New Haven Counties1Attractive core market of Fairfield County /
Bridgeport-Stamford-Norwalk MSAMost affluent MSA in the Nation in per capita personal income (PCPI)2 1 Source: S&P Global Market Intelligence’s Branch Competitors & Pricing Report as of 6/30/18, excluding global money center banks
(tickers BAC, WFC, JPM, TD & C)2 Source: Bureau of Economic Analysis’ Metropolitan Area Table, contained within the Local Area Personal Income, 2017 news release on 11/15/18 Existing branches (12) Fairfield County
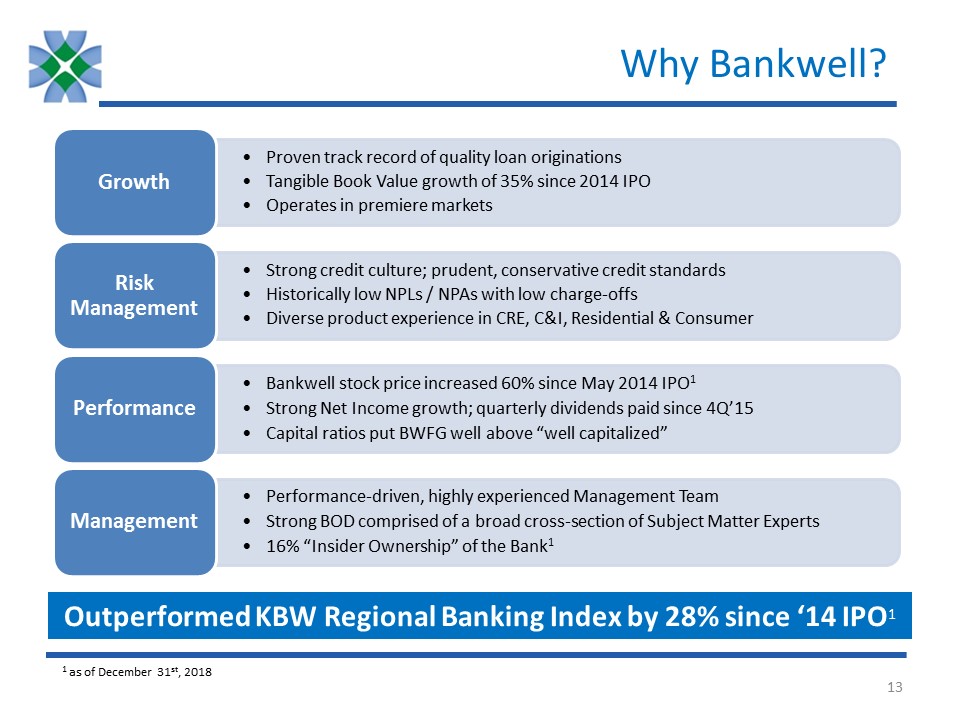
Why Bankwell? Outperformed KBW Regional Banking Index by 28% since ‘14 IPO1 1 as of December 31st,
2018
Financial Trends and Portfolio Metrics
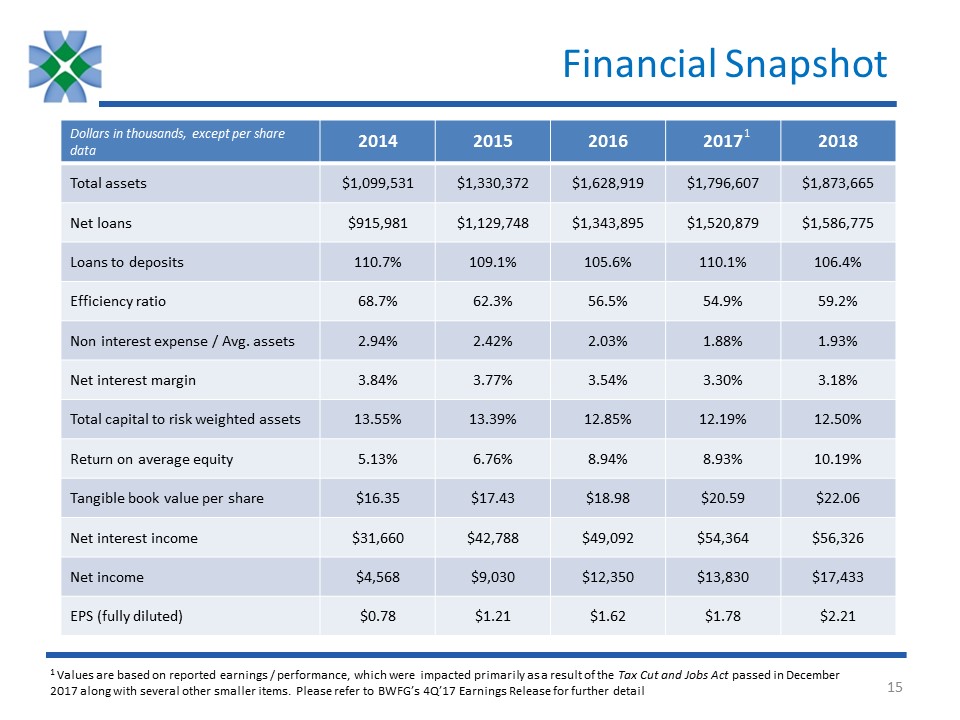
Financial Snapshot Dollars in thousands, except per share data 2014 2015 2016 2017 2018 Total
assets $1,099,531 $1,330,372 $1,628,919 $1,796,607 $1,873,665 Net loans $915,981 $1,129,748 $1,343,895 $1,520,879 $1,586,775 Loans to deposits 110.7% 109.1% 105.6% 110.1% 106.4% Efficiency
ratio 68.7% 62.3% 56.5% 54.9% 59.2% Non interest expense / Avg. assets 2.94% 2.42% 2.03% 1.88% 1.93% Net interest margin 3.84% 3.77% 3.54% 3.30% 3.18% Total capital to risk weighted
assets 13.55% 13.39% 12.85% 12.19% 12.50% Return on average equity 5.13% 6.76% 8.94% 8.93% 10.19% Tangible book value per share $16.35 $17.43 $18.98 $20.59 $22.06 Net interest
income $31,660 $42,788 $49,092 $54,364 $56,326 Net income $4,568 $9,030 $12,350 $13,830 $17,433 EPS (fully diluted) $0.78 $1.21 $1.62 $1.78 $2.21 1 1 Values are based on reported earnings / performance, which were impacted
primarily as a result of the Tax Cut and Jobs Act passed in December 2017 along with several other smaller items. Please refer to BWFG’s 4Q’17 Earnings Release for further detail

Financial Performance Trends CAGR 40% 1 4Q’17 EPS reduced by $0.26 due to the impact of the Tax Cut
and Jobs Act passed in December 2017 along with several other smaller items; on a “core” basis, 2017 EPS is $2.03, please refer to BWFG’s 4Q’17 Earnings Release for further detail NIM relatively stable through 2018; rising pressure on
deposit costs partially mitigated by prepay fees and default interest collectedThe fourth quarter efficiency ratio was 58.2%, bringing the year to date ratio down to 59.2%Post-IPO, Non-Interest Expense as a % of Average Assets has decreased
101 bps, to 1.93% Dollars in millions EPS $0.78 $1.21 $1.62 $1.78 $2.21Efficiency Ratio 68.7% 62.3% 56.5% 54.9% 59.2%NIM 3.84% 3.77% 3.54% 3.30% 3.18%Non InterestExp / Assets 2.94% 2.42% 2.03% 1.88% 1.93% CAGR 15% 1

Loan Pricing Trends Total Loan Portfolio 1 Weighted average yield based on active loans as of
12-31-16, 12-31-17 & 12-31-18, respectively Dollars in millions Rates on 2018 originations helped drive total portfolio yield up Current market rates imply further portfolio yield increases for 2019 1
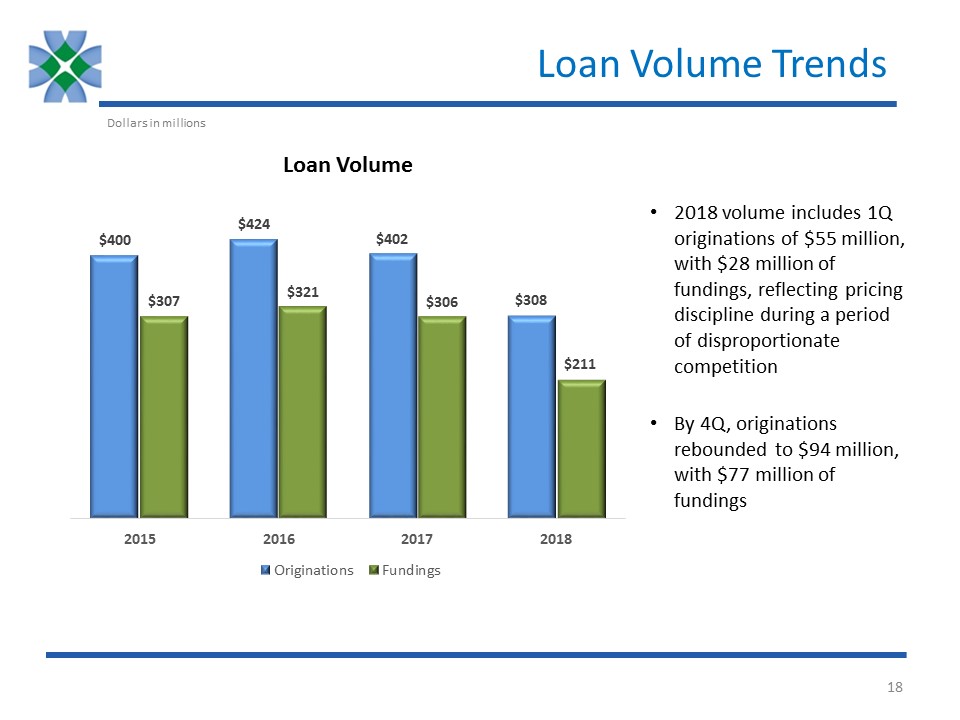
Loan Volume Trends Dollars in millions Loan Volume 2018 volume includes 1Q originations of $55
million, with $28 million of fundings, reflecting pricing discipline during a period of disproportionate competitionBy 4Q, originations rebounded to $94 million, with $77 million of fundings
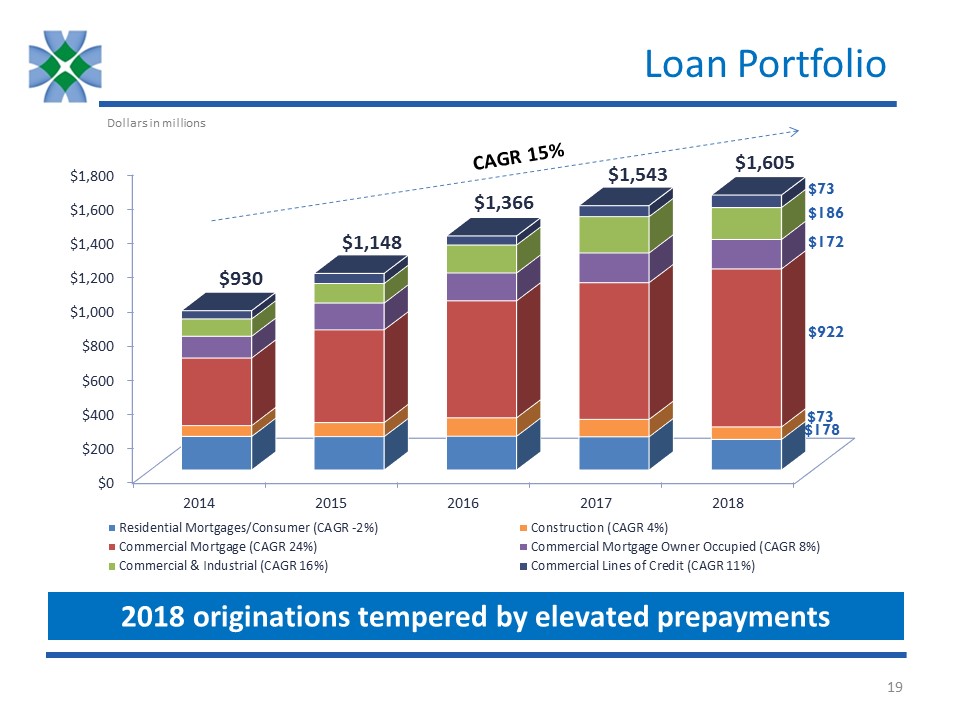
Loan Portfolio CAGR 15% $1,543 $1,366 $1,148 $930 Dollars in millions $1,605 2018 originations
tempered by elevated prepayments

Loan Portfolio Portfolio oversight provided by team of 15 skilled credit analysts and portfolio
managers, most with > 20 years’ experienceConcentration actively managed, with no single relationship representing more than 5.3% of total loan volume at year-end 2018

CRE Loan Portfolio Retail Composition $ % Retail2 $176 56.21% Grocery $80
25.58% Pharmacy $27 8.72% Gas / Auto Services $16 4.96% Restaurant $14 4.54% Total Retail $313 100.00% Average deal size is $2.2MM Office Composition $ % Office (primarily suburban) $216 70.05% Medical $91
29.43% Condo $2 0.52% Total Office $308 100.00% Average deal size is $2.1MM 1 Includes Owner Occupied CRE2 Comprised primarily of neighborhood and convenience centers, typically characterized by: size up to 125,000 sq. ft.;
convenience and service oriented 1 Dollars in millions At year-end 2017, Retail and Office concentrations were 27.21% and 27.90%, respectivelyProperty Type mix has diversified over 2018 while overall portfolio has grown

Geography Distribution Continued focus in home base state but maintaining diversification by following
strongest customers to growth markets CRE to Risk Based Capital Ratio Proven track record as CRE Lender with strong risk management practices in placeCRE Retail loans have an average LTV of 57% and an average DSCR of 1.7xNo significant
exposure to any one retailer and no exposure to bankrupt retailers 1 1 Includes Owner Occupied CRE CRE Loan Portfolio

Credit Update Bankwell disclosed 2 significant NPAs in 1Q’18, of which NPA #1 was fully paid off in
3Q’18 at no loss to the Bank. The status of NPA #2 will be covered here. NPA #2 Relationship Overview 2018 Events Relationship comprised of two loans, the “Quarry Loans”A $10.0 million real estate loan and a $4.2 million equipment loan, of
which 75% is SBA guaranteed1Borrower was a successful operator for twenty years New zoning regulations materially changed permissible activities of the quarry, effectively ending the Borrower’s ability to operate The Borrower’s original
business model is no longer viable and any alternative operations are severely limited $6.2 million was charged off in the fourth quarter$6.9 million remaining balance, of which $2.7 million carries an SBA guaranteeBankwell and Borrower
working together to achieve an orderly liquidation to maximize value 1 Represents original loan balances. Subsequently amortized to $13.2 million.
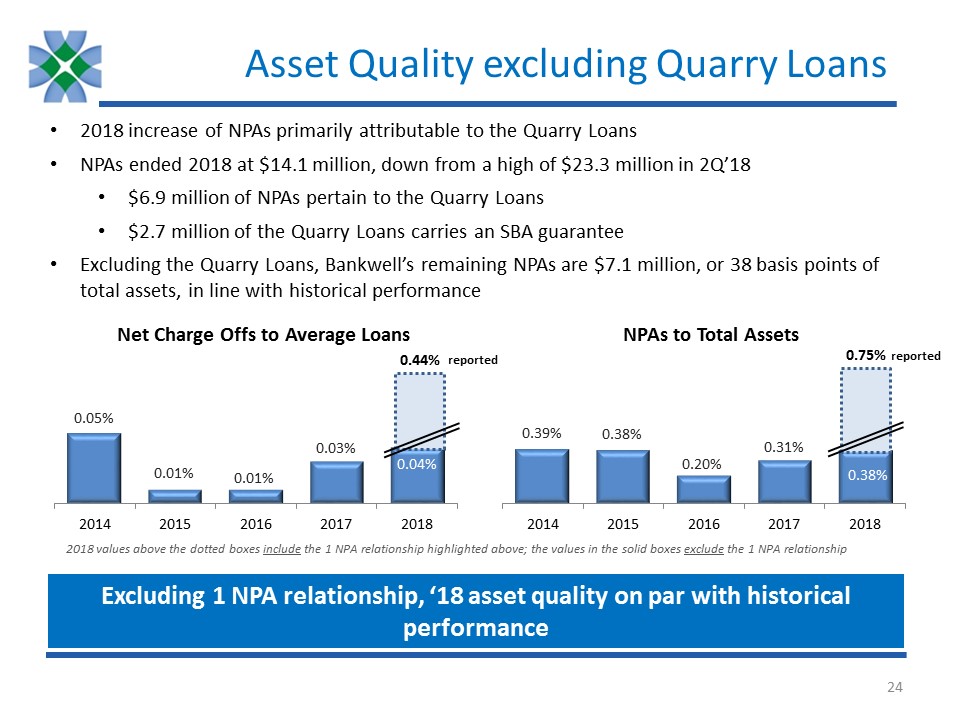
Asset Quality excluding Quarry Loans NPAs to Total Assets 2018 increase of NPAs primarily
attributable to the Quarry LoansNPAs ended 2018 at $14.1 million, down from a high of $23.3 million in 2Q’18$6.9 million of NPAs pertain to the Quarry Loans$2.7 million of the Quarry Loans carries an SBA guaranteeExcluding the Quarry Loans,
Bankwell’s remaining NPAs are $7.1 million, or 38 basis points of total assets, in line with historical performance Net Charge Offs to Average Loans 0.44% 0.75% 2018 values above the dotted boxes include the 1 NPA relationship
highlighted above; the values in the solid boxes exclude the 1 NPA relationship Excluding 1 NPA relationship, ‘18 asset quality on par with historical performance reported reported
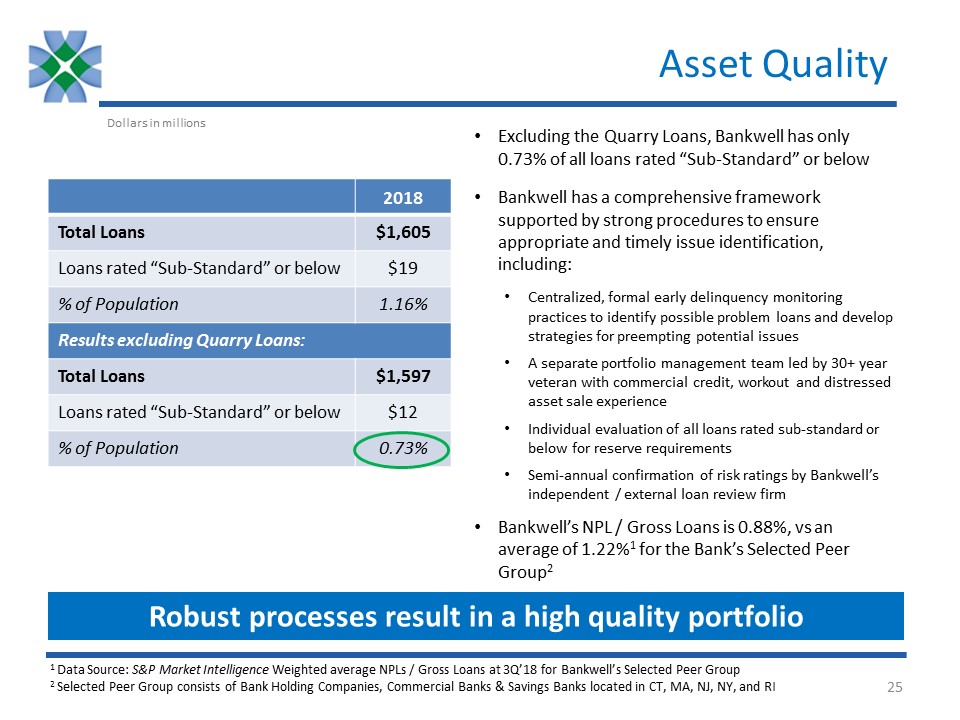
Asset Quality Excluding the Quarry Loans, Bankwell has only 0.73% of all loans rated “Sub-Standard” or
belowBankwell has a comprehensive framework supported by strong procedures to ensure appropriate and timely issue identification, including:Centralized, formal early delinquency monitoring practices to identify possible problem loans and
develop strategies for preempting potential issues A separate portfolio management team led by 30+ year veteran with commercial credit, workout and distressed asset sale experienceIndividual evaluation of all loans rated sub-standard or below
for reserve requirementsSemi-annual confirmation of risk ratings by Bankwell’s independent / external loan review firm Bankwell’s NPL / Gross Loans is 0.88%, vs an average of 1.22%1 for the Bank’s Selected Peer Group2 Robust processes result
in a high quality portfolio Dollars in millions 2018 Total Loans $1,605 Loans rated “Sub-Standard” or below $19 % of Population 1.16% Results excluding Quarry Loans: Total Loans $1,597 Loans rated “Sub-Standard” or
below $12 % of Population 0.73% 1 Data Source: S&P Market Intelligence Weighted average NPLs / Gross Loans at 3Q’18 for Bankwell’s Selected Peer Group 2 Selected Peer Group consists of Bank Holding Companies, Commercial Banks &
Savings Banks located in CT, MA, NJ, NY, and RI
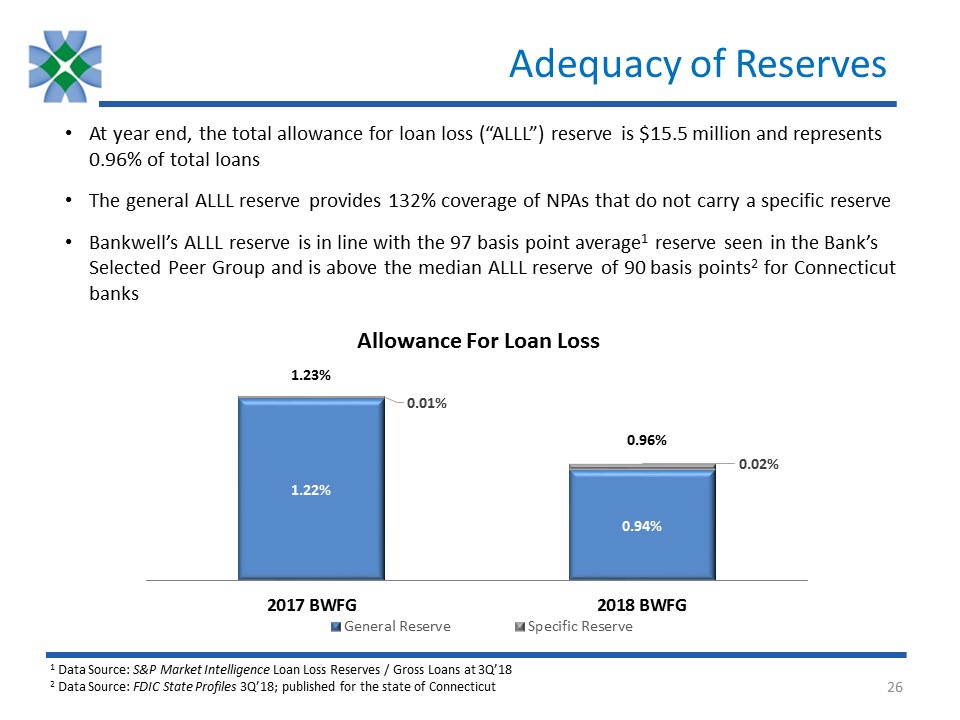
Adequacy of Reserves At year end, the total allowance for loan loss (“ALLL”) reserve is $15.5 million
and represents 0.96% of total loansThe general ALLL reserve provides 132% coverage of NPAs that do not carry a specific reserveBankwell’s ALLL reserve is in line with the 97 basis point average1 reserve seen in the Bank’s Selected Peer Group
and is above the median ALLL reserve of 90 basis points2 for Connecticut banks 1.23% 0.96% 1 Data Source: S&P Market Intelligence Loan Loss Reserves / Gross Loans at 3Q’18 2 Data Source: FDIC State Profiles 3Q’18; published for the
state of Connecticut
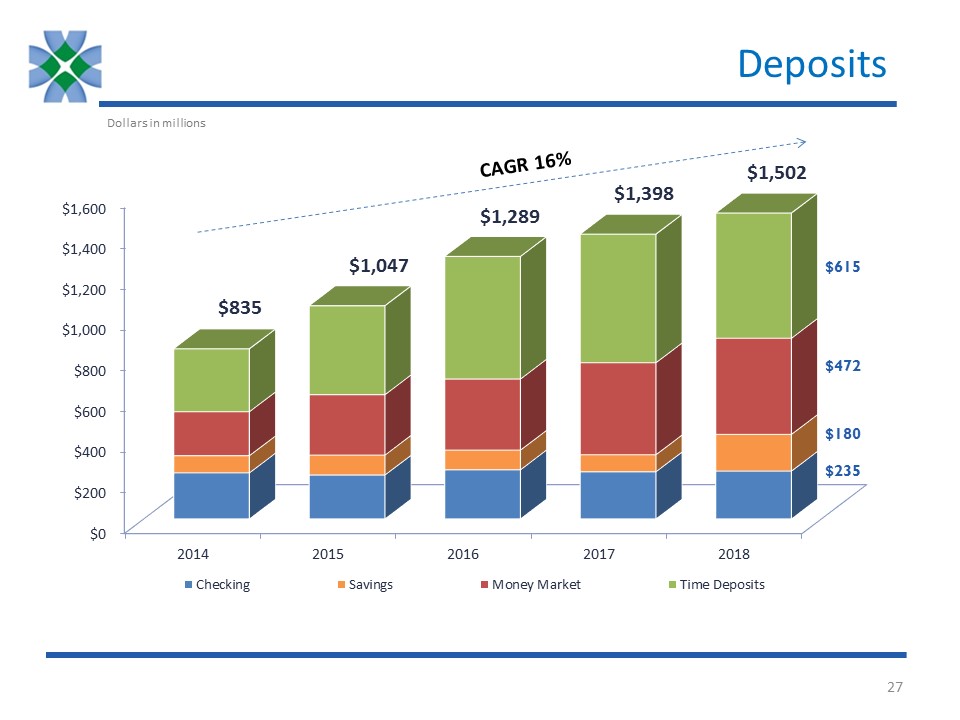
Deposits CAGR 16% $835 $1,047 $1,289 $1,398 Dollars in millions $1,502
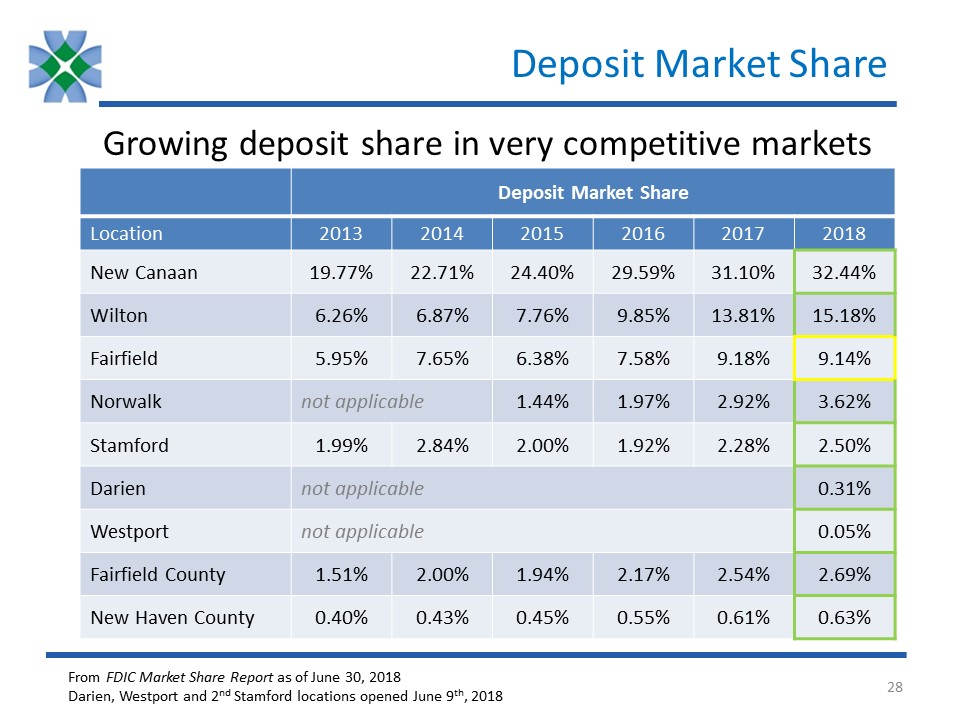
Deposit Market Share Deposit Market
Share Location 2013 2014 2015 2016 2017 2018 New Canaan 19.77% 22.71% 24.40% 29.59% 31.10% 32.44% Wilton 6.26% 6.87% 7.76% 9.85% 13.81% 15.18% Fairfield 5.95% 7.65% 6.38% 7.58% 9.18% 9.14% Norwalk not
applicable 1.44% 1.97% 2.92% 3.62% Stamford 1.99% 2.84% 2.00% 1.92% 2.28% 2.50% Darien not applicable 0.31% Westport not applicable 0.05% Fairfield County 1.51% 2.00% 1.94% 2.17% 2.54% 2.69% New
Haven County 0.40% 0.43% 0.45% 0.55% 0.61% 0.63% From FDIC Market Share Report as of June 30, 2018Darien, Westport and 2nd Stamford locations opened June 9th, 2018 Growing deposit share in very competitive markets

Management Team Name Years Experience Selected Professional Biography Christopher GrusekePresident
& CEO(since 2015) 25+ Founding investor of Bankwell’s precursor, Bank of New Canaan, member of BoD and ALCO Committee 2009 to 201220 year Investment Banking career focused on financial institutions, securitizations and interest rate
risk managementManagement positions include Chief Operating Officer of Greenwich Capital Markets Penko IvanovEVP & CFO(since 2016) 25+ CFO for Darien Rowayton Bank & Doral Bank’s US OperationsProven track record in building,
improving and overseeing all areas of Finance, including Controllership, SOX, Treasury, FP&A, as well as internal and external reporting functionsPrior experience includes 8 years with GE Capital in various finance roles Heidi S.
DeWyngaertEVP & Chief Lending Officer(since 2004) 30+ Previously at Webster Bank, managing the Fairfield County Commercial Real Estate group10 years as Vice President for CRE at First Union National Bank David P. DineenEVP & Head
of Community Banking(since 2016) 30+ Previously at Capital One Commercial Bank as the National Market Manager for Treasury Management and Deposit Services Managed Retail Branch networks and Treasury Management sales teams at NorthFork Bank
and Commerce Bank Christine A. ChivilyEVP & Chief Risk & Credit Officer (since 2013) 30+ Previously a Risk Manager for CRE and C&I at Peoples United BankSVP/Senior Credit Officer at RBS Greenwich Capital Markets (11 years);
Director - Northeast Region, Multifamily at Freddie Mac (5 years); Manager, Loan Servicing - Distressed Assets at M&T Bank Laura J. WaitzEVP & Chief of Staff(since 2017) 30+ Previously Senior Managing Director, Global Head of Human
Resources at The Blackstone Group (9 years)Also at Citi Alternative Investments as MD & Global Head of Compensation & at Deutsche Bank as Head of Compensation (Americas) & as Global Compensation Mgr. for Private Equity &
Investment Bank Experienced management team with a diverse, non-community banking background
