Attached files
| file | filename |
|---|---|
| EX-99.1 - EXHIBIT 99.1 - Bank7 Corp. | ex99_1.htm |
| 8-K - 8-K - Bank7 Corp. | form8k.htm |
Exhibit 99.2


Legal Information and Disclaimer This presentation and oral statements made regarding the subject of
this presentation contain forward-looking statements. These forward-looking statements are subject to significant uncertainties because they are based upon: the amount and timing of future changes in interest rates, market behavior, and other
economic conditions; future laws, regulations, and accounting principles; changes in regulatory standards and examination policies, and a variety of other matters. These other matters include, among other things, the direct and indirect effect
of economic conditions on interest rates, credit quality, loan demand, liquidity, and monetary and supervisory policies of banking regulators. These forward-looking statements reflect Bank7 Corp.’s current views with respect to, among other
things, future events and Bank7 Corp.’s financial performance. Any statements about Bank7 Corp.’s expectations, beliefs, plans, predictions, forecasts, objectives, assumptions or future events or performance are not historical facts and may be
forward-looking. These statements are often, but not always, made through the use of words or phrases such as “anticipate,” “believes,” “can,” “could,” “may,” “predicts,” “potential,” “should,” “will,” “estimate,” “plans,” “projects,”
“continuing,” “ongoing,” “expects,” “intends” and similar words or phrases. Any or all of the forward-looking statements in (or conveyed orally regarding) this presentation may turn out to be inaccurate. The inclusion of or reference to
forward-looking information in this presentation should not be regarded as a representation by Bank7 Corp. or any other person that the future plans, estimates or expectations contemplated by Bank7 Corp. will be achieved. Bank7 Corp. has based
these forward-looking statements largely on its current expectations and projections about future events and financial trends that Bank7 Corp. believes may affect its financial condition, results of operations, business strategy and financial
needs. Bank7 Corp.’s actual results could differ materially from those anticipated in such forward-looking statements as a result of risks, uncertainties and assumptions that are difficult to predict. If one or more events related to these or
other risks or uncertainties materialize, or if Bank7 Corp.’s underlying assumptions prove to be incorrect, actual results may differ materially from what Bank7 Corp. anticipates. You are cautioned not to place undue reliance on forward-looking
statements. Further, any forward-looking statement speaks only as of the date on which it is made and Bank7 Corp. undertakes no obligation to update or revise any forwardlooking statement to reflect events or circumstances after the date on
which the statement is made or to reflect the occurrence of unanticipated events, except as may be required by law. All forward-looking statements herein are qualified by these cautionary statements. Within this presentation, we reference
certain market, industry and demographic data, forecasts and other statistical information. We have obtained this data, forecasts and information from various independent, third party industry sources and publications. Nothing in the data,
forecasts or information used or derived from third party sources should be construed as advice. Some data and other information are also based on our good faith estimates, which are derived from our review of industry publications and surveys
and independent sources. We believe that these sources and estimates are reliable, but have not independently verified them. Statements as to our market position are based on market data currently available to us. Although we are not aware of
any misstatements regarding the economic, employment, industry and other market data presented herein, these estimates involve inherent risks and uncertainties and are based on assumptions that are subject to change. This presentation includes
certain non-GAAP financial measures, including adjusted net income, adjusted earnings per share, adjusted return on average assets and adjusted return on average shareholders’ equity. These non-GAAP financial measures and any other non-GAAP
financial measures that we discuss in this presentation should not be considered in isolation, and should be considered as additions to, and not substitutes for or superior to, measures of financial performance prepared in accordance with GAAP.
There are a number of limitations related to the use of these non-GAAP financial measures versus their nearest GAAP equivalents. For example, other companies may calculate non-GAAP financial measures differently or may use other measures to
evaluate their performance, all of which could reduce the usefulness of Bank7 Corp.’s non-GAAP financial measures as tools for comparison. See the table on Slide 15 of this presentation for a reconciliation of the non-GAAP financial measures
used in (or conveyed orally during) this presentation to their most directly comparable GAAP financial measures. 1

Corporate Overview NASDAQ: BSVN December 31, 2018 Assets $771 million Loans $600
million Deposits $676 million One of the Top Performing Community Banks in the United States(1)Track Record of Industry Leading Profitability and Expense ControlIntense Focus on Underwriting Process and Asset QualityScalable and Consistently
Growing Platform (1) Best-performing community banks of 2017 under $1B in assets, S&P Global Market Intelligence - https://platform.mi.spglobal.com/web/client?auth=inherit#news/article?id=43935321&cdid=A-43935321-11062 2
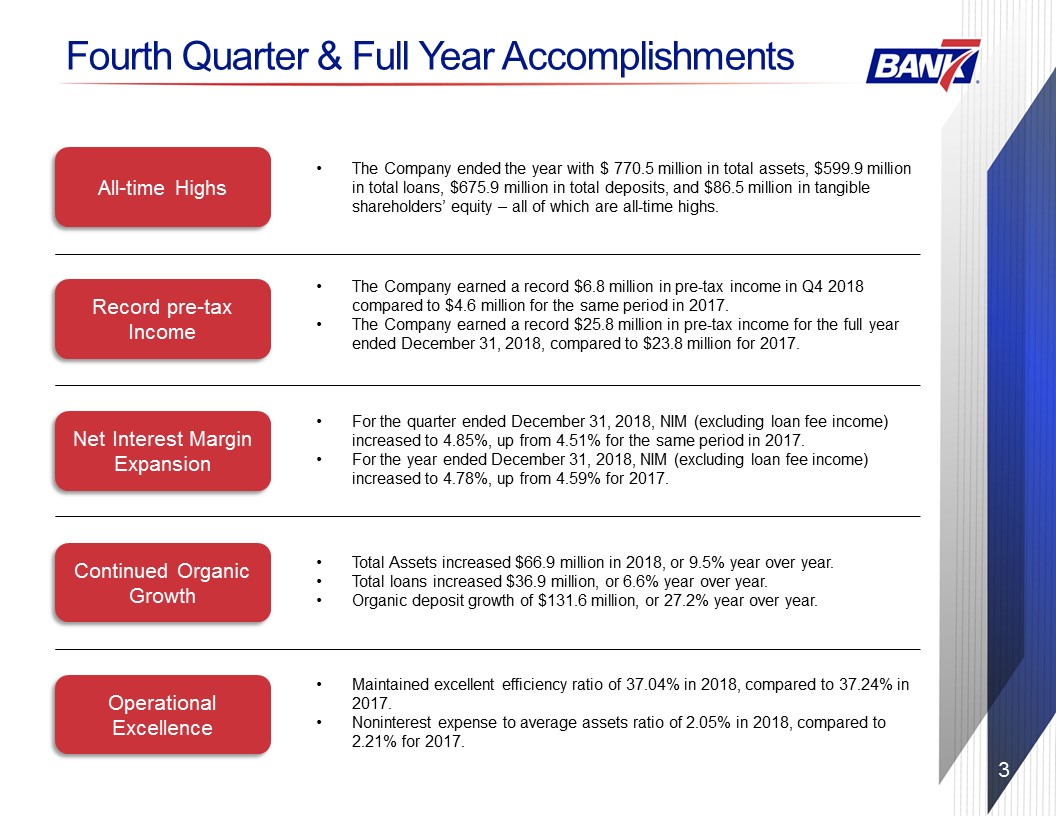
Fourth Quarter & Full Year Accomplishments Record pre-tax Income Net Interest Margin
Expansion Continued Organic Growth Operational Excellence For the quarter ended December 31, 2018, NIM (excluding loan fee income) increased to 4.85%, up from 4.51% for the same period in 2017.For the year ended December 31, 2018, NIM
(excluding loan fee income) increased to 4.78%, up from 4.59% for 2017. Total Assets increased $66.9 million in 2018, or 9.5% year over year. Total loans increased $36.9 million, or 6.6% year over year. Organic deposit growth of $131.6
million, or 27.2% year over year. Maintained excellent efficiency ratio of 37.04% in 2018, compared to 37.24% in 2017.Noninterest expense to average assets ratio of 2.05% in 2018, compared to 2.21% for 2017. The Company earned a record $6.8
million in pre-tax income in Q4 2018 compared to $4.6 million for the same period in 2017.The Company earned a record $25.8 million in pre-tax income for the full year ended December 31, 2018, compared to $23.8 million for 2017. All-time
Highs The Company ended the year with $ 770.5 million in total assets, $599.9 million in total loans, $675.9 million in total deposits, and $86.5 million in tangible shareholders’ equity – all of which are all-time highs. 3
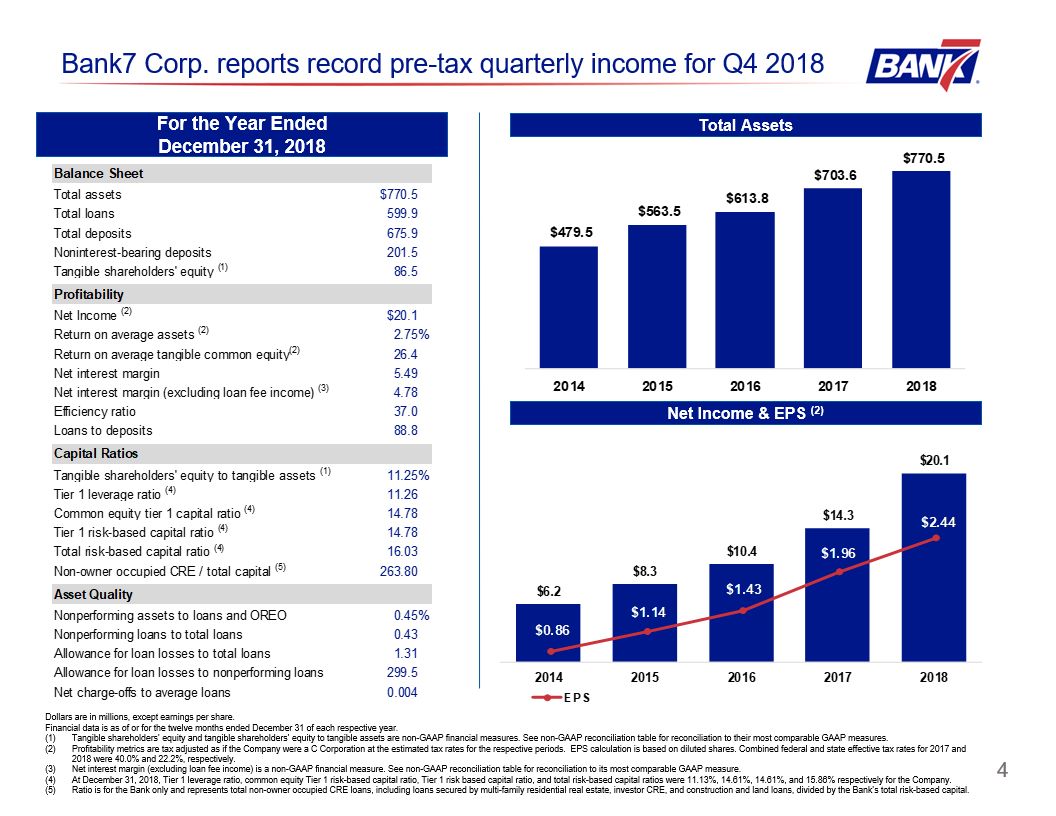
Bank7 Corp. reports record pre-tax quarterly income for Q4 2018 For the Year EndedDecember
31, 2018 Net Income & EPS (2) Dollars are in millions, except earnings per share. Financial data is as of or for the twelve months ended December 31 of each respective year.Tangible shareholders’ equity and tangible shareholders’ equity
to tangible assets are non-GAAP financial measures. See non-GAAP reconciliation table for reconciliation to their most comparable GAAP measures.Profitability metrics are tax adjusted as if the Company were a C Corporation at the estimated tax
rates for the respective periods. EPS calculation is based on diluted shares. Combined federal and state effective tax rates for 2017 and 2018 were 40.0% and 22.2%, respectively.Net interest margin (excluding loan fee income) is a non-GAAP
financial measure. See non-GAAP reconciliation table for reconciliation to its most comparable GAAP measure.At December 31, 2018, Tier 1 leverage ratio, common equity Tier 1 risk-based capital ratio, Tier 1 risk based capital ratio, and total
risk-based capital ratios were 11.13%, 14.61%, 14.61%, and 15.86% respectively for the Company.Ratio is for the Bank only and represents total non-owner occupied CRE loans, including loans secured by multi-family residential real estate,
investor CRE, and construction and land loans, divided by the Bank’s total risk-based capital. Total Assets 4
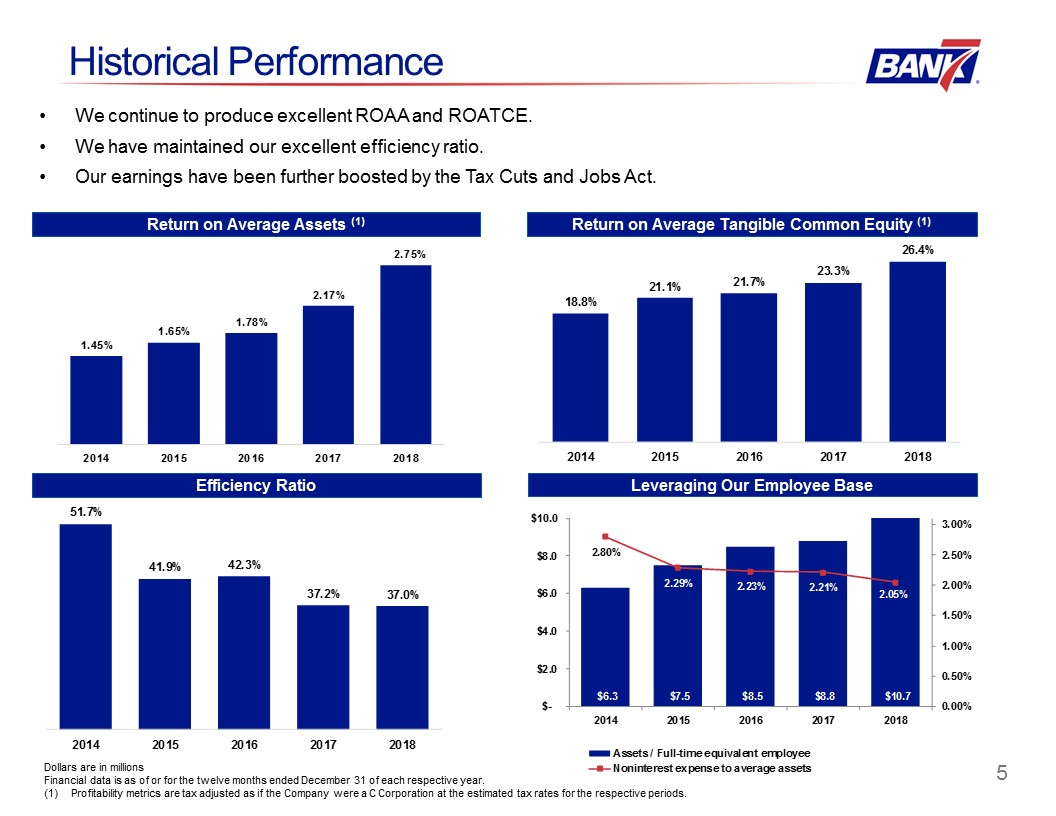
Historical Performance Return on Average Assets (1) Return on Average Tangible Common Equity
(1) Dollars are in millionsFinancial data is as of or for the twelve months ended December 31 of each respective year.Profitability metrics are tax adjusted as if the Company were a C Corporation at the estimated tax rates for the respective
periods. Leveraging Our Employee Base Efficiency Ratio We continue to produce excellent ROAA and ROATCE.We have maintained our excellent efficiency ratio.Our earnings have been further boosted by the Tax Cuts and Jobs Act. 5

December 31, 2017 December 31, 2018 Annual growth Balance Sheet and Earnings Growth Dollars
are in millions, except earnings per share.Financial data is as of or for the twelve months ended December 31 of each respective year.Net income is tax adjusted as if the Company were a C Corporation at the estimated tax rates for the
respective periods.Tangible book value per share is a non-GAAP financial measure. See Appendix for reconciliation to its most comparable GAAP measure. Balance Sheet and Earnings Growth 9.5% 6.6% 8.0% 27.9% 40.6% Tangible Book Value Per
Share (2) (1) In our first quarter as a public company, tangible book value per share grew by $0.57, or 7.2%.YOY organic balance sheet growth remains strong.Net income YOY outpaced balance sheet growth. 6
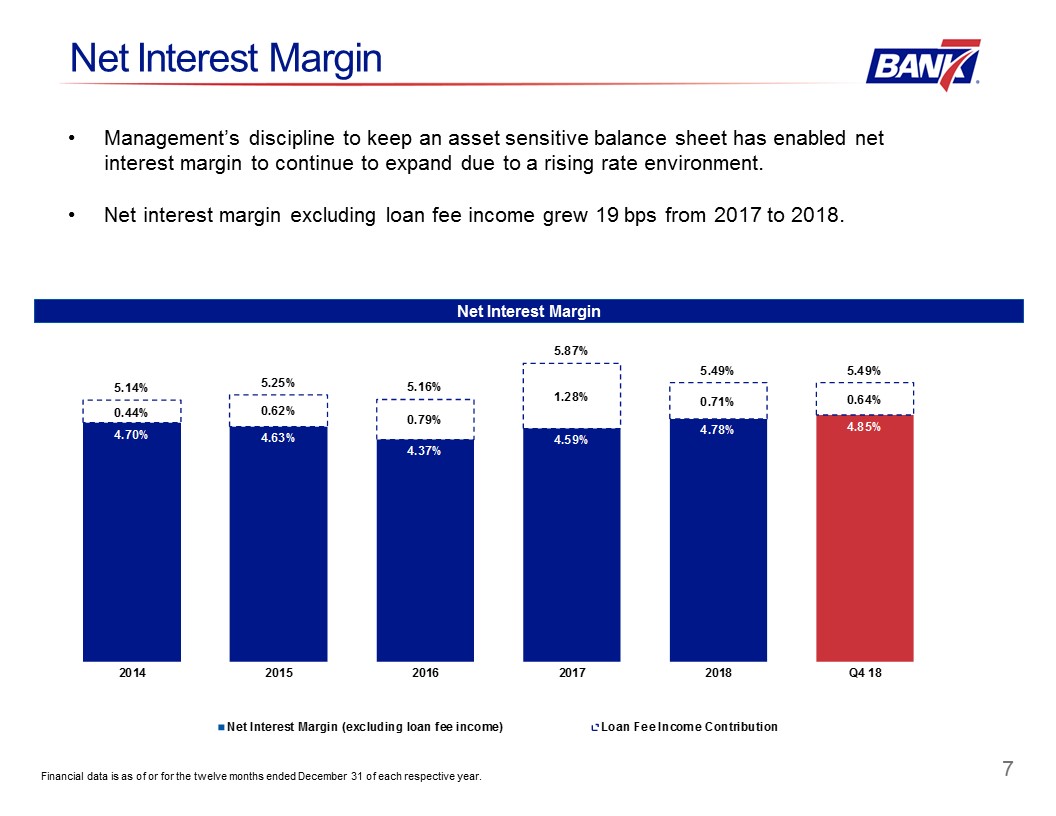
Net Interest Margin Financial data is as of or for the twelve months ended December 31 of each
respective year. Net Interest Margin Management’s discipline to keep an asset sensitive balance sheet has enabled net interest margin to continue to expand due to a rising rate environment.Net interest margin excluding loan fee income grew 19
bps from 2017 to 2018. 7
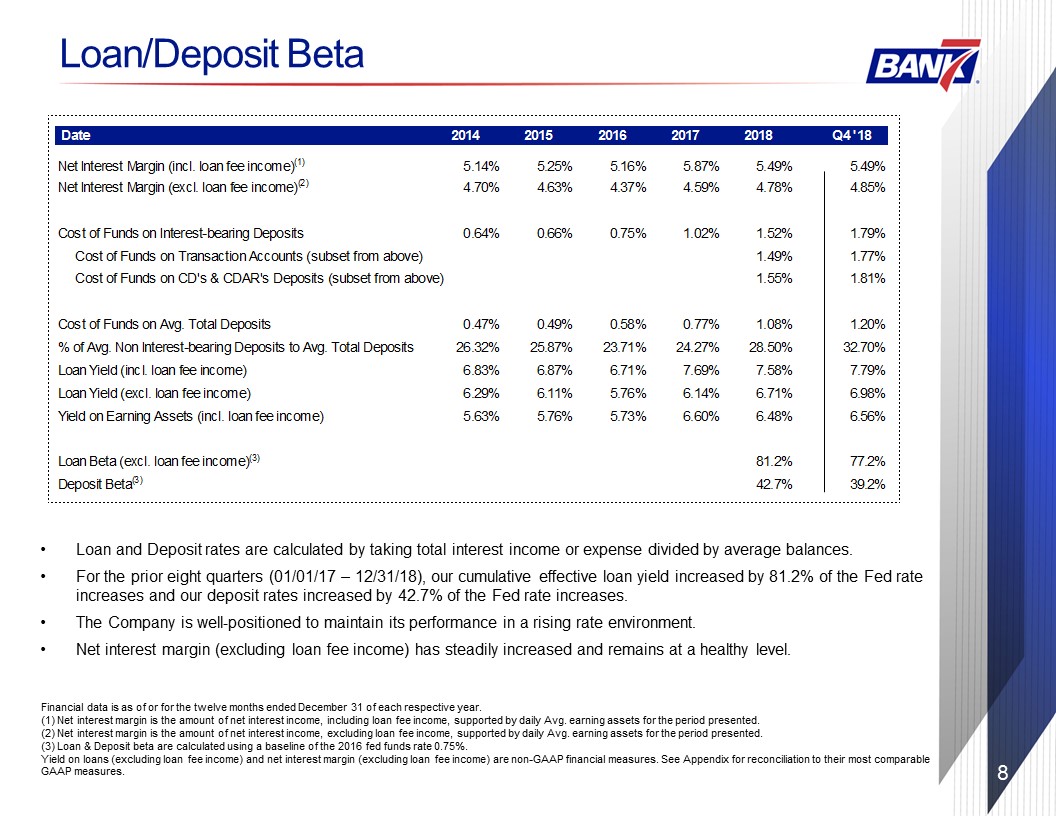
Loan/Deposit Beta Financial data is as of or for the twelve months ended December 31 of each respective
year.(1) Net interest margin is the amount of net interest income, including loan fee income, supported by daily Avg. earning assets for the period presented.(2) Net interest margin is the amount of net interest income, excluding loan fee
income, supported by daily Avg. earning assets for the period presented.(3) Loan & Deposit beta are calculated using a baseline of the 2016 fed funds rate 0.75%. Yield on loans (excluding loan fee income) and net interest margin (excluding
loan fee income) are non-GAAP financial measures. See Appendix for reconciliation to their most comparable GAAP measures. Loan and Deposit rates are calculated by taking total interest income or expense divided by average balances.For the
prior eight quarters (01/01/17 – 12/31/18), our cumulative effective loan yield increased by 81.2% of the Fed rate increases and our deposit rates increased by 42.7% of the Fed rate increases.The Company is well-positioned to maintain its
performance in a rising rate environment.Net interest margin (excluding loan fee income) has steadily increased and remains at a healthy level. 8
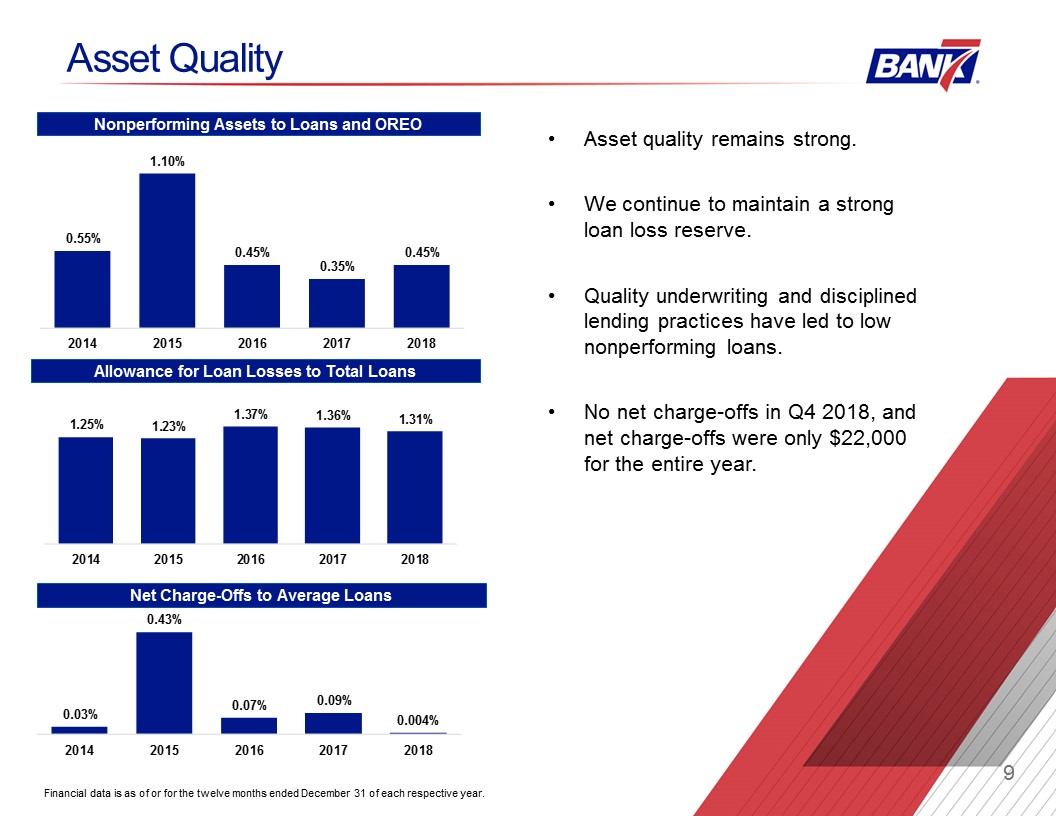
Allowance for Loan Losses to Total Loans Nonperforming Assets to Loans and OREO Asset Quality Net
Charge-Offs to Average Loans Financial data is as of or for the twelve months ended December 31 of each respective year. Asset quality remains strong.We continue to maintain a strong loan loss reserve.Quality underwriting and disciplined
lending practices have led to low nonperforming loans.No net charge-offs in Q4 2018, and net charge-offs were only $22,000 for the entire year. 9

Diversified Loan Portfolio Dollars are in millions. Data as of December 31, 2018. Gross Loan Portfolio
Composition by Purpose Type 10
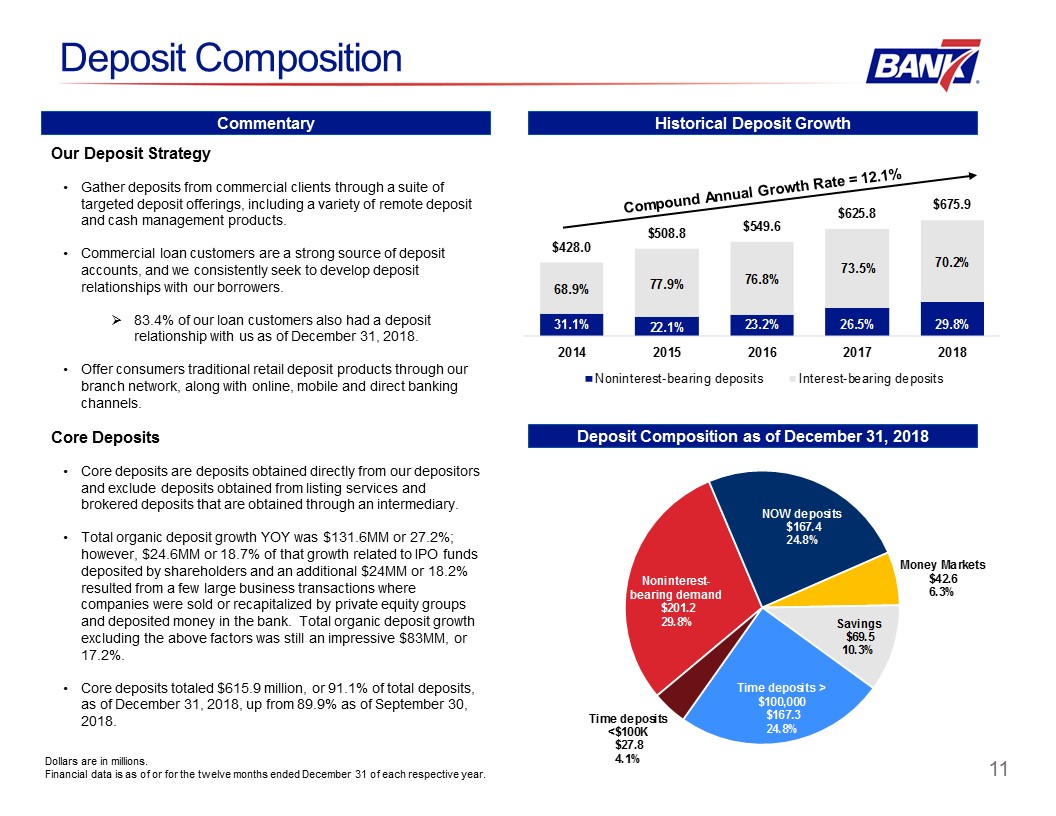
Deposit Composition Historical Deposit Growth Compound Annual Growth Rate = 12.1% Deposit Composition
as of December 31, 2018 Our Deposit StrategyGather deposits from commercial clients through a suite of targeted deposit offerings, including a variety of remote deposit and cash management products.Commercial loan customers are a strong source
of deposit accounts, and we consistently seek to develop deposit relationships with our borrowers.83.4% of our loan customers also had a deposit relationship with us as of December 31, 2018.Offer consumers traditional retail deposit products
through our branch network, along with online, mobile and direct banking channels.Core DepositsCore deposits are deposits obtained directly from our depositors and exclude deposits obtained from listing services and brokered deposits that are
obtained through an intermediary.Total organic deposit growth YOY was $131.6MM or 27.2%; however, $24.6MM or 18.7% of that growth related to IPO funds deposited by shareholders and an additional $24MM or 18.2% resulted from a few large business
transactions where companies were sold or recapitalized by private equity groups and deposited money in the bank. Total organic deposit growth excluding the above factors was still an impressive $83MM, or 17.2%. Core deposits totaled $615.9
million, or 91.1% of total deposits, as of December 31, 2018, up from 89.9% as of September 30, 2018. Dollars are in millions.Financial data is as of or for the twelve months ended December 31 of each respective
year. 28.4% 31.1% 22.1% 23.2% 26.5% 26.3% Commentary 11

Appendix 12

Bank7 Corp. Financials Net income and earnings per share are tax adjusted as if the Company
were a C Corporation at the estimated tax rates for the respective periods. EPS calculation is based on diluted shares. Combined federal and state effective tax rates for 2017 and 2018 were 40.0% and 22.2%, respectively. Represents a non-GAAP
financial measure. See non-GAAP reconciliations table for reconciliation to its more comparable GAAP measure. 13
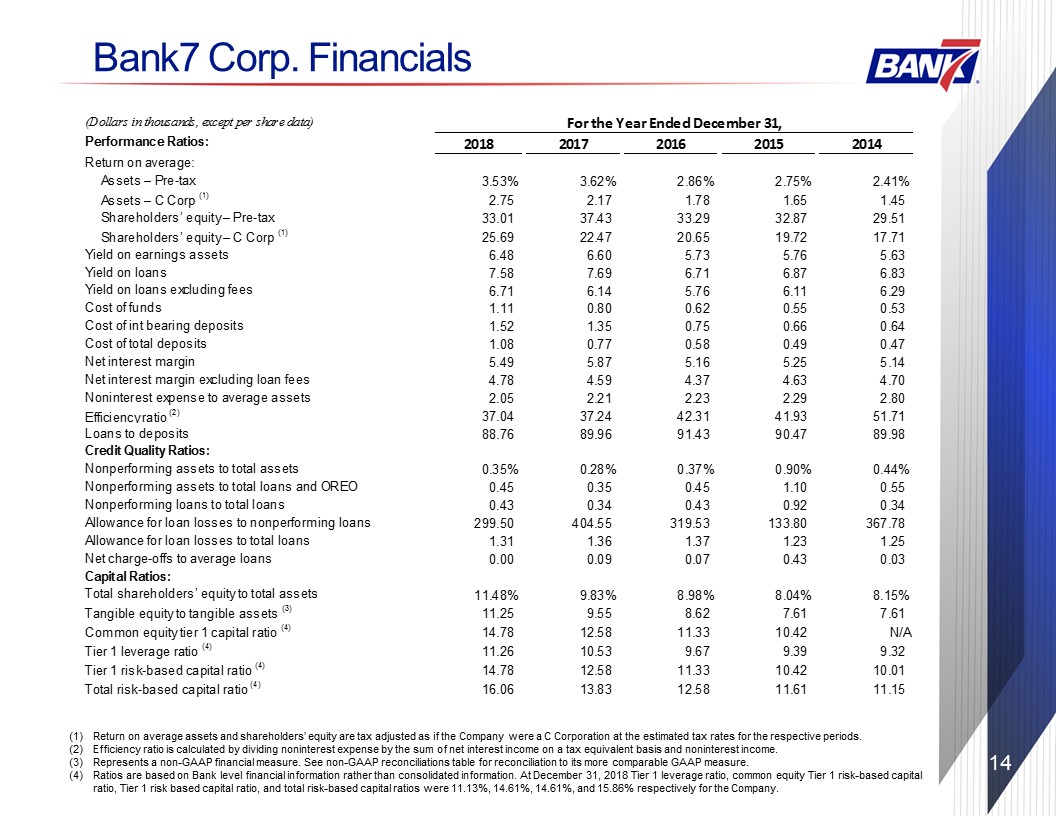
Bank7 Corp. Financials Return on average assets and shareholders’ equity are tax adjusted as if the
Company were a C Corporation at the estimated tax rates for the respective periods.Efficiency ratio is calculated by dividing noninterest expense by the sum of net interest income on a tax equivalent basis and noninterest income. Represents a
non-GAAP financial measure. See non-GAAP reconciliations table for reconciliation to its more comparable GAAP measure. Ratios are based on Bank level financial information rather than consolidated information. At December 31, 2018 Tier 1
leverage ratio, common equity Tier 1 risk-based capital ratio, Tier 1 risk based capital ratio, and total risk-based capital ratios were 11.13%, 14.61%, 14.61%, and 15.86% respectively for the Company. 14
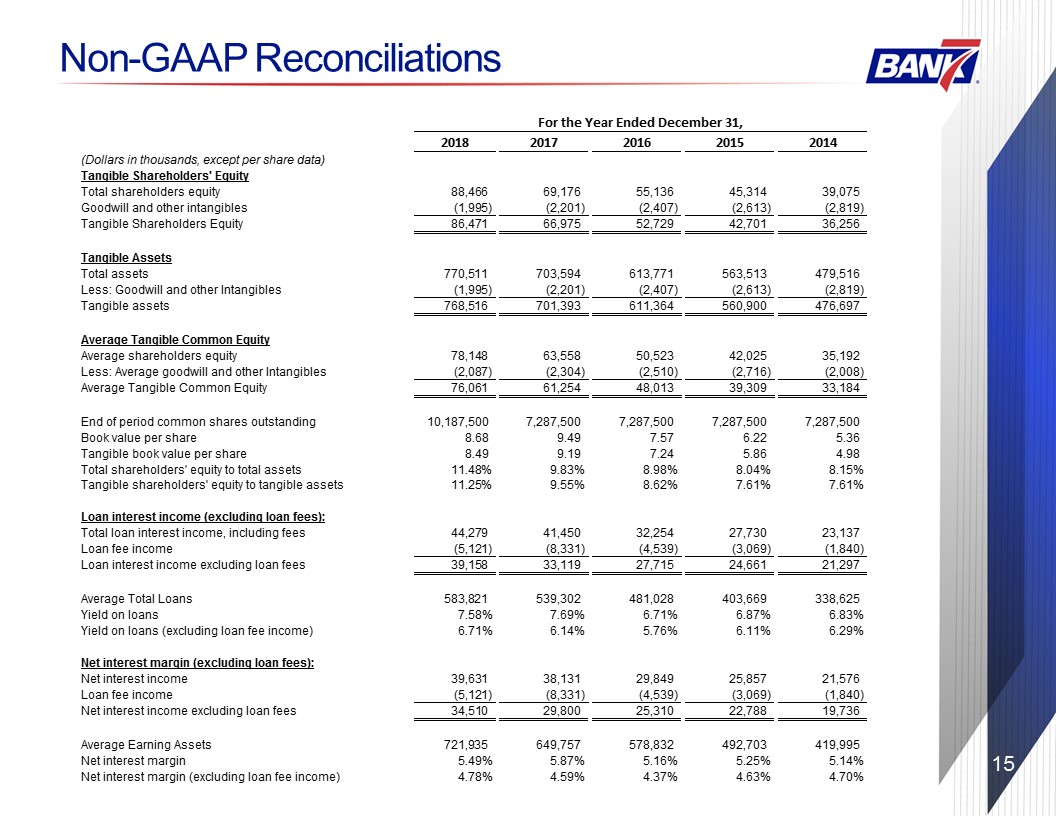
Non-GAAP Reconciliations 15