Attached files
| file | filename |
|---|---|
| EX-99.2 - EXHIBIT 99.2 - SYNOVUS FINANCIAL CORP | a12312018-8kexhibit992prta.htm |
| EX-99.1 - EXHIBIT 99.1 - SYNOVUS FINANCIAL CORP | a12312018-8kexhibit991news.htm |
| 8-K - 8-K - SYNOVUS FINANCIAL CORP | a12312018-8kcoverpage.htm |
Exhibit 99.3 Fourth Quarter 2018 Results January 15, 2018

Forward Looking Statements This slide presentation and certain of our other filings with the Securities and Exchange Commission contain statements that constitute “forward-looking statements” within the meaning of, and subject to the protections of, Section 27A of the Securities Act of 1933, as amended, and Section 21E of the Securities Exchange Act of 1934, as amended. All statements other than statements of historical fact are forward- looking statements. You can identify these forward-looking statements through Synovus’ use of words such as “believes,” “anticipates,” “expects,” “may,” “will,” “assumes,” “predicts,” “could,” “should,” “would,” “intends,” “targets,” “estimates,” “projects,” “plans,” “potential” and other similar words and expressions of the future or otherwise regarding the outlook for Synovus’ future business and financial performance and/or the performance of the banking industry and economy in general. These forward-looking statements include, among others, statements on (1) future loan and deposit growth; (2) future revenue growth and net interest margin; (3) future non-interest expense levels and operating leverage; (4) future credit trends and key metrics; (5) future effective tax rates; (6) the FCB integration; (7) future capital return to common shareholders; (8) our strategy and initiatives for future growth, capital management, and strategic transactions, including the FCB transaction; (9) future long-term financial targets; and (10) our assumptions underlying these expectations. Prospective investors are cautioned that any such forward-looking statements are not guarantees of future performance and involve known and unknown risks and uncertainties which may cause the actual results, performance or achievements of Synovus to be materially different from the future results, performance or achievements expressed or implied by such forward-looking statements. Forward-looking statements are based on the information known to, and current beliefs and expectations of, Synovus’ management and are subject to significant risks and uncertainties. Actual results may differ materially from those contemplated by such forward-looking statements. A number of factors could cause actual results to differ materially from those contemplated by the forward-looking statements in this presentation. Many of these factors are beyond Synovus’ ability to control or predict. These forward-looking statements are based upon information presently known to Synovus’ management and are inherently subjective, uncertain and subject to change due to any number of risks and uncertainties, including, without limitation, the risks and other factors set forth in Synovus’ filings with the Securities and Exchange Commission, including its Annual Report on Form 10-K for the year ended December 31, 2017 under the captions “Cautionary Notice Regarding Forward-Looking Statements” and “Risk Factors” and in Synovus’ quarterly reports on Form 10-Q and current reports on Form 8-K. We believe these forward-looking statements are reasonable; however, undue reliance should not be placed on any forward-looking statements, which are based on current expectations and speak only as of the date that they are made. We do not assume any obligation to update any forward-looking statements as a result of new information, future developments or otherwise, except as otherwise may be required by law. Use of Non-GAAP Financial Measures This slide presentation contains certain non-GAAP financial measures determined by methods other than in accordance with generally accepted accounting principles. Such non-GAAP financial measures include the following: adjusted diluted earnings per share; adjusted return on average assets; adjusted return on average common equity; adjusted return on average tangible common equity; cost of interest bearing core deposits; adjusted non-interest income; adjusted non-interest expense; adjusted total revenues; adjusted efficiency ratio; tangible common equity to tangible assets ratio; and common equity Tier 1 (CET1) ratio (fully phased-in). The most comparable GAAP measures to these measures are diluted earnings per share; return on average assets; return on average common equity; cost of funds rate; total non-interest income; total non-interest expense; total revenues; efficiency ratio; total shareholders’ equity to total assets ratio; and CET1 ratio, respectively. Management uses these non-GAAP financial measures to assess the performance of Synovus’ business and the strength of its capital position. Management believes that these non-GAAP financial measures provide meaningful additional information about Synovus to assist management, investors, and bank regulators in evaluating Synovus’ operating results, financial strength, the performance of its business and the strength of its capital position. However, these non-GAAP financial measures have inherent limitations as analytical tools and should not be considered in isolation or as a substitute for analyses of operating results or capital position as reported under GAAP. The non-GAAP financial measures should be considered as additional views of the way our financial measures are affected by significant items and other factors, and since they are not required to be uniformly applied, they may not be comparable to other similarly titled measures at other companies. Adjusted diluted earnings per share, adjusted return on average assets, and adjusted return on average common equity are measures used by management to evaluate operating results exclusive of items that are not indicative of ongoing operations and impact period-to-period comparisons. Adjusted return on average tangible common equity is a measure used by management to compare Synovus’ performance with other financial institutions because it calculates the return available to common shareholders without the impact of intangible assets and their related amortization, thereby allowing management to evaluate the performance of the business consistently. The cost of interest bearing core deposits is a measure used to evaluate the cost of deposits as a funding source exclusive of brokered deposits and deposits. Adjusted non-interest income and adjusted total revenues are measures used by management to evaluate total revenues and non-interest income exclusive of net investment securities gains (losses), net changes in the fair value of private equity investments, and the Cabela’s transaction fee. Adjusted non-interest expense and the adjusted efficiency ratio are measures utilized by management to measure the success of expense management initiatives focused on reducing recurring controllable operating costs. The tangible common equity to tangible assets ratio and CET1 ratio (fully phased-in) are used by management and bank regulators to assess the strength of our capital position. The computations of the non-GAAP financial measures used in this slide presentation are set forth in the Appendix to this slide presentation. 2

4Q18 Highlights Profitability . Diluted EPS of $0.87, vs. $0.84 in 3Q18 and $0.23 in Return on Average Assets 4Q17 Diluted EPS (1) . Adjusted diluted EPS of $0.92, down 3.1% vs. $0.95 $0.87 $0.92 3Q18 and up 28.1% vs. 4Q17 $0.84 $0.72 1.36% 1.47% 1.36% (1) 1.29% (1) . ROA of 1.29%, vs. 1.36% in 3Q18 and 0.37% in 4Q17 28.1% 1.12% 24 b.p.s YoY YoY . Adjusted ROA(1) of 1.36%, down 11 b.p.s vs. 3Q18 and up 24 b.p.s vs. 4Q17 $0.23 0.37% . Total revenues of $365.9 million, up $26.9 million or 7.9% vs. 4Q17 4Q17 3Q18 4Q18 4Q17 3Q18 4Q18 (1) (1) Adjusted total revenues(1) of $368.2 million, up Reported Adjusted Reported Adjusted $29.0 million or 8.5% vs. 4Q17 Balance Sheet Growth Total Average Loans Total Average Deposits (in billions) (in billions) $26.92 . (2) $25.63 $26.29 $26.39 Total average loans grew $303.7 million or 4.8% vs. $25.32 3Q18 and grew $1.01 billion or 4.1% vs. 4Q17 $24.61 . Total average deposits increased $532.8 million or 4.1% 2.4% YoY 8.0%(2) vs. 3Q18 and increased $634.1 million or 2.4% YoY vs. 4Q17 4Q17 3Q18 4Q18 4Q17 3Q18 4Q18 Credit Quality and Capital Management NPA Ratio Return on Average Common Equity 15.69% 14.99% . NPA ratio of 0.44% improved 9 b.p.s from 4Q17 13.95% 14.25% 11.96% . Return on average common equity of 14.25% compared 0.53% 0.46% 9 b.p.s (1) to 3.76% in 4Q17 which included a 640 b.p.s. decline from 0.44% 303 b.p.s YoY Tax Reform effects 3.76% YoY . Adjusted ROE(1) of 14.99% increased 303 b.p.s vs. 4Q17 . Adjusted ROATCE(1) of 15.36% increased 310 b.p.s vs. 4Q17 3Q18 4Q18 4Q17 4Q17 3Q18 4Q18 (1) (1) Non-GAAP financial measure; see appendix for applicable reconciliation Reported Adjusted (2) Annualized 3

Loans Period-end Loan Balances (in billions) Sequential quarter period-end growth of (2) (2) (1) $24.79(2) $25.58 $25.95 $369.5 million or 5.7% vs. 3Q18 12.50 12.78 12.02 C&I up $277.9 million or 8.8%(1) Consumer up $239.8 million or 14.9%(1) 49.2% (1) 48.5% 48.9% CRE down $147.9 million or 8.7% Year-over-year period-end growth of $1.16 billion or 4.7% 5.85 6.39 6.63 C&I up $757.6 million or 6.3% 23.6% 24.9% 25.5% Consumer up $771.2 million or 13.2% CRE down $370.8 million or 5.3% 6.94 6.71 6.56 Total average loan growth of $303.7 million or 27.9% 26.2% 25.3% 4.8%(1) vs. 3Q18 and $1.01 billion or 4.1% vs. 4Q17 (in millions) 4Q17 3Q18 4Q18 Sequential quarter loan growth: $300.1 $443.1 $369.5 CRE Consumer C&I (1) Annualized (2) Total loans are net of deferred fees and costs 4

Deposits Total Average Deposits 4Q18 total average deposits of $26.92 billion (in billions) increased $532.8 million or 8.0%(1) vs. 3Q18 $26.29 $26.39 $26.92 Excluding average brokered deposits, 2.20 1.77 1.63 2.32 4Q18 average deposits increased $681.0 2.01 2.21 million or 11.0%(1) vs. 3Q18 3.08 3.39 3.60 State and county municipal (SCM) deposits increased $312.7 million or 61.8% vs. 3Q18 4Q18 total average deposits increased $634.1 million or 2.4% vs. 4Q17 4Q18 average brokered deposits represent 19.37 18.80 19.21 6.0% of total deposits compared to 6.7% in 3Q18 and 8.4% in 4Q17 4Q17 3Q18 4Q18 (2) Core transaction deposits Time SCM Brokered (1) Annualized (2) Core transaction deposits consist of non-interest bearing, NOW/savings, and money market deposits excluding state and county municipal (SCM) deposits 5
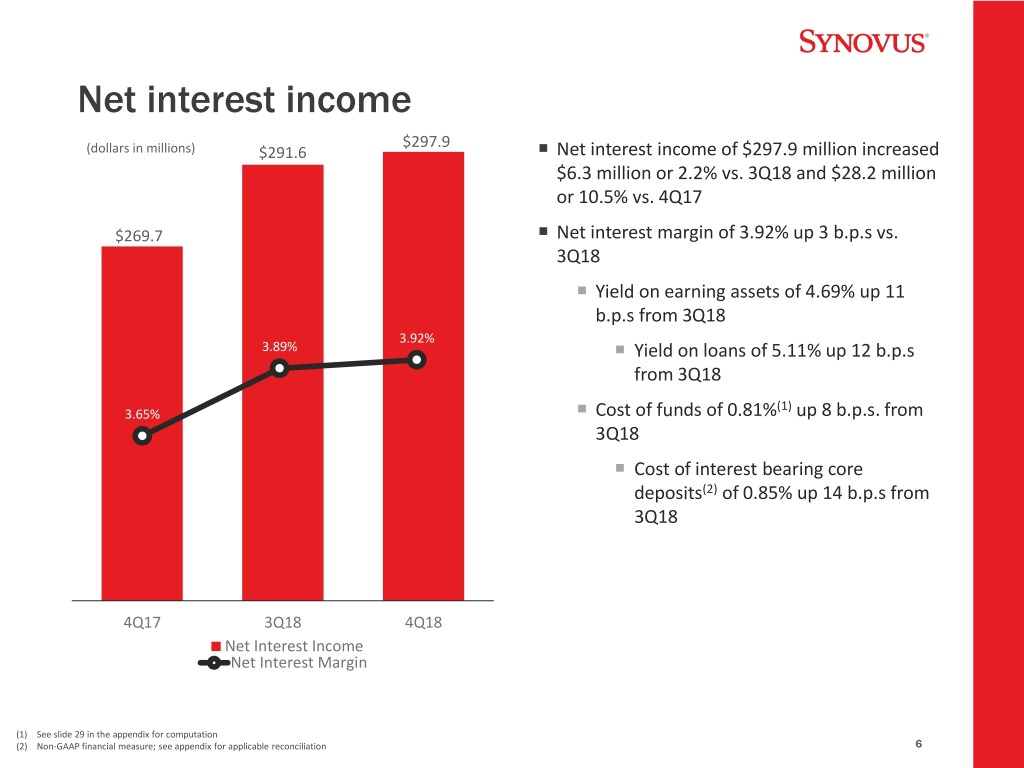
Net interest income $297.9 (dollars in millions) $291.6 Net interest income of $297.9 million increased $6.3 million or 2.2% vs. 3Q18 and $28.2 million or 10.5% vs. 4Q17 $269.7 Net interest margin of 3.92% up 3 b.p.s vs. 3Q18 Yield on earning assets of 4.69% up 11 b.p.s from 3Q18 3.92% 3.89% Yield on loans of 5.11% up 12 b.p.s from 3Q18 (1) 3.65% Cost of funds of 0.81% up 8 b.p.s. from 3Q18 Cost of interest bearing core deposits(2) of 0.85% up 14 b.p.s from 3Q18 4Q17 3Q18 4Q18 Net Interest Income Net Interest Margin (1) See slide 29 in the appendix for computation (2) Non-GAAP financial measure; see appendix for applicable reconciliation 6
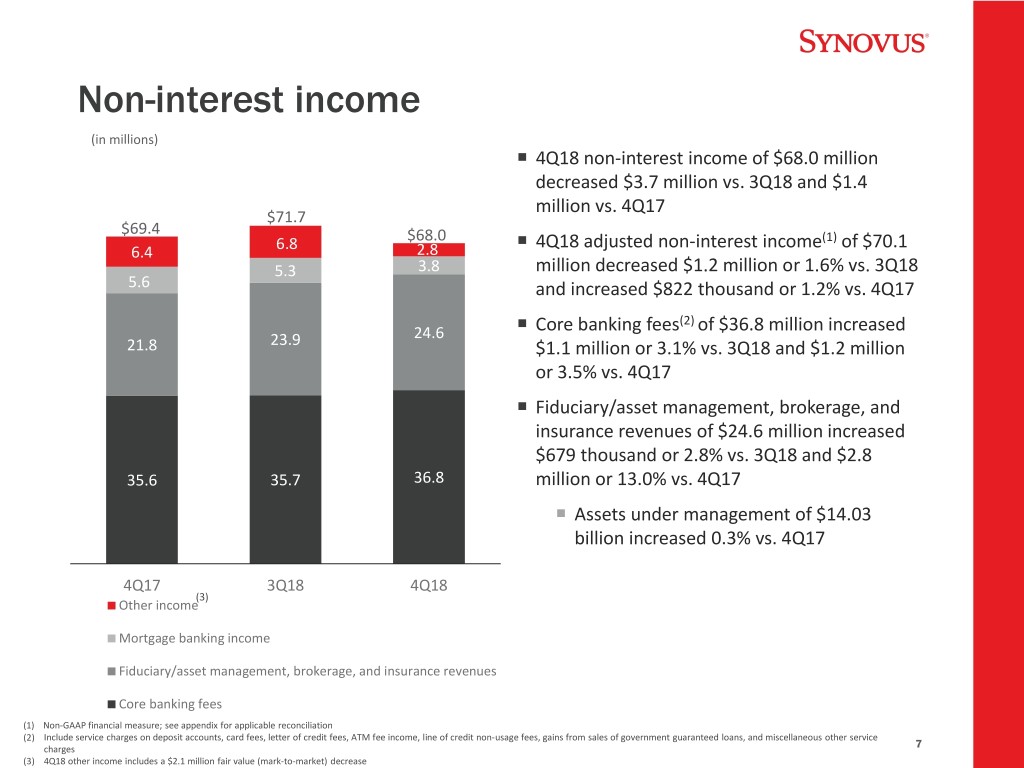
Non-interest income (in millions) 4Q18 non-interest income of $68.0 million decreased $3.7 million vs. 3Q18 and $1.4 million vs. 4Q17 $71.7 $69.4 $68.0 4Q18 adjusted non-interest income(1) of $70.1 6.4 6.8 2.8 5.3 3.8 million decreased $1.2 million or 1.6% vs. 3Q18 5.6 and increased $822 thousand or 1.2% vs. 4Q17 (2) 24.6 Core banking fees of $36.8 million increased 21.8 23.9 $1.1 million or 3.1% vs. 3Q18 and $1.2 million or 3.5% vs. 4Q17 Fiduciary/asset management, brokerage, and insurance revenues of $24.6 million increased $679 thousand or 2.8% vs. 3Q18 and $2.8 35.6 35.7 36.8 million or 13.0% vs. 4Q17 Assets under management of $14.03 billion increased 0.3% vs. 4Q17 4Q17 3Q18 4Q18 (3) Other income Mortgage banking income Fiduciary/asset management, brokerage, and insurance revenues Core banking fees (1) Non-GAAP financial measure; see appendix for applicable reconciliation (2) Include service charges on deposit accounts, card fees, letter of credit fees, ATM fee income, line of credit non-usage fees, gains from sales of government guaranteed loans, and miscellaneous other service charges 7 (3) 4Q18 other income includes a $2.1 million fair value (mark-to-market) decrease
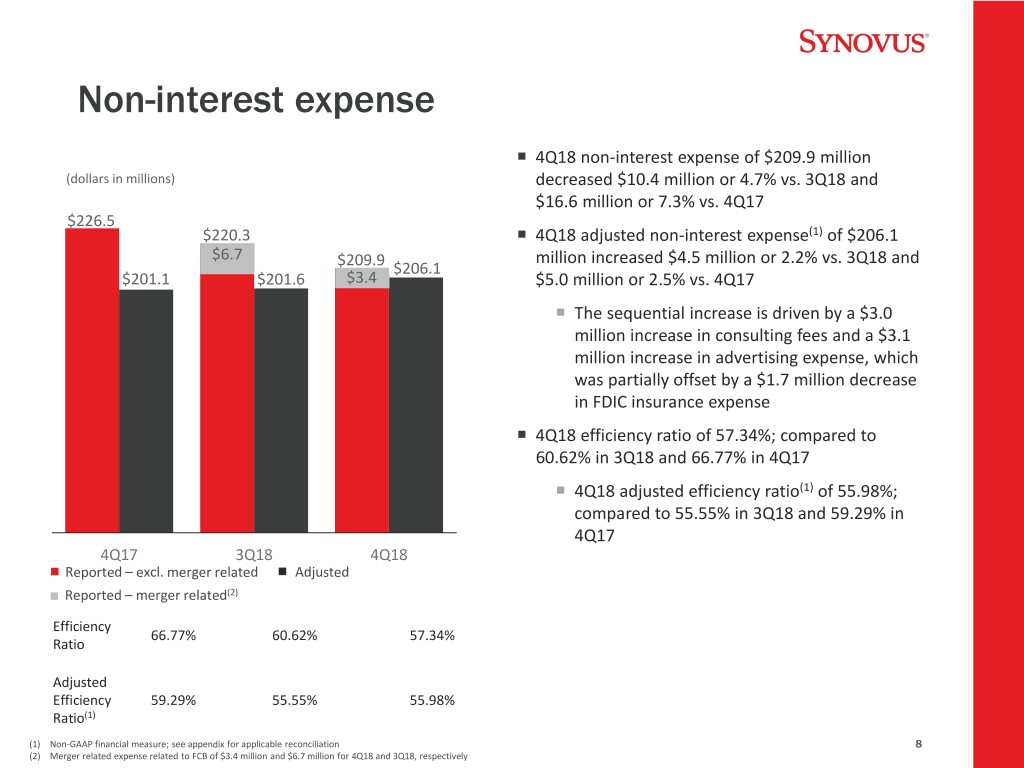
Non-interest expense 4Q18 non-interest expense of $209.9 million (dollars in millions) decreased $10.4 million or 4.7% vs. 3Q18 and $16.6 million or 7.3% vs. 4Q17 $226.5 $220.3 4Q18 adjusted non-interest expense(1) of $206.1 $6.7 million increased $4.5 million or 2.2% vs. 3Q18 and $209.9 $206.1 $201.1 $201.6 $3.4 $5.0 million or 2.5% vs. 4Q17 The sequential increase is driven by a $3.0 million increase in consulting fees and a $3.1 million increase in advertising expense, which was partially offset by a $1.7 million decrease in FDIC insurance expense 4Q18 efficiency ratio of 57.34%; compared to 60.62% in 3Q18 and 66.77% in 4Q17 4Q18 adjusted efficiency ratio(1) of 55.98%; compared to 55.55% in 3Q18 and 59.29% in 4Q17 4Q17 3Q18 4Q18 Reported – excl. merger related Adjusted Reported – merger related(2) Efficiency 66.77% 60.62% 57.34% Ratio Adjusted Efficiency 59.29% 55.55% 55.98% Ratio(1) (1) Non-GAAP financial measure; see appendix for applicable reconciliation 8 (2) Merger related expense related to FCB of $3.4 million and $6.7 million for 4Q18 and 3Q18, respectively
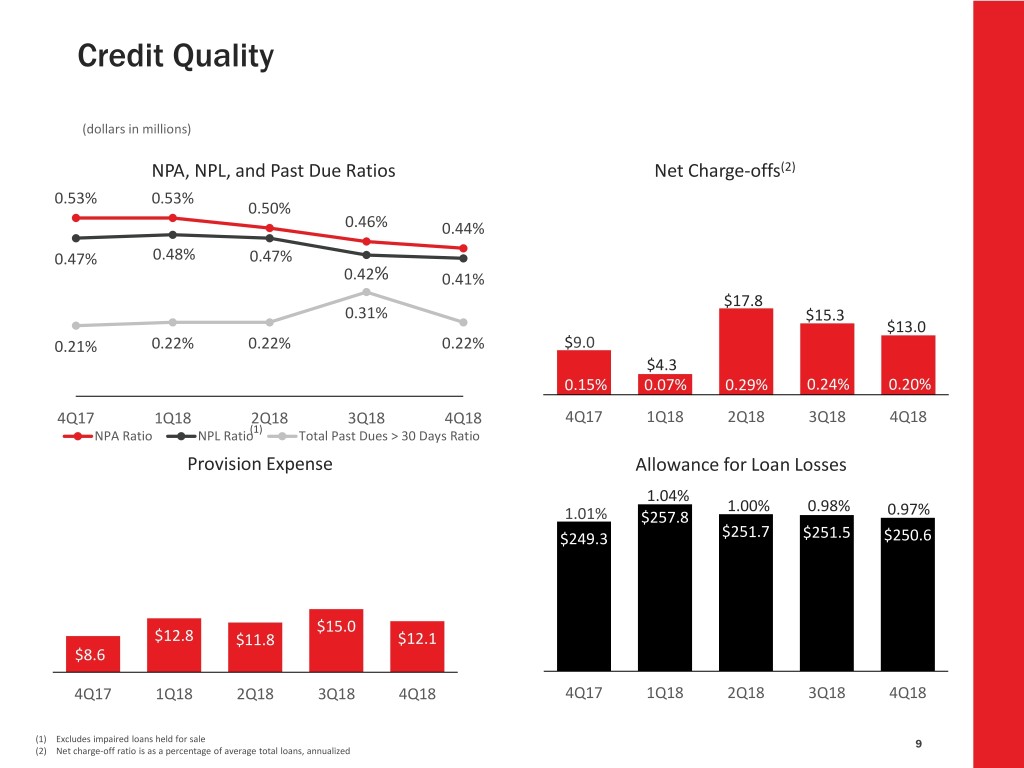
Credit Quality (dollars in millions) NPA, NPL, and Past Due Ratios Net Charge-offs(2) 0.53% 0.53% 0.50% 0.46% (2)0.44% 0.47% 0.48% 0.47% 0.42% 0.41% $17.8 0.31% $15.30.29% $13.0 0.21% 0.22% 0.22% 0.22% $9.0 $4.3 0.15% 0.07% 0.29% 0.24% 0.20% % 4Q17 1Q18 2Q18 3Q18 4Q18 4Q17 1Q18 2Q18 3Q18 4Q18 (1) NPA Ratio NPL Ratio Total Past Dues > 30 Days Ratio Provision Expense Allowance for Loan Losses 1.04% 1.00% 0.98% 0.97% $27.7 1.01% $257.8 $249.3 $251.7 $251.5 $250.6 $15.0 $12.8 $11.8 $12.1 $8.6 4Q17 1Q18 2Q18 3Q18 4Q18 4Q17 1Q18 2Q18 3Q18 4Q18 (1) Excludes impaired loans held for sale 9 (2) Net charge-off ratio is as a percentage of average total loans, annualized
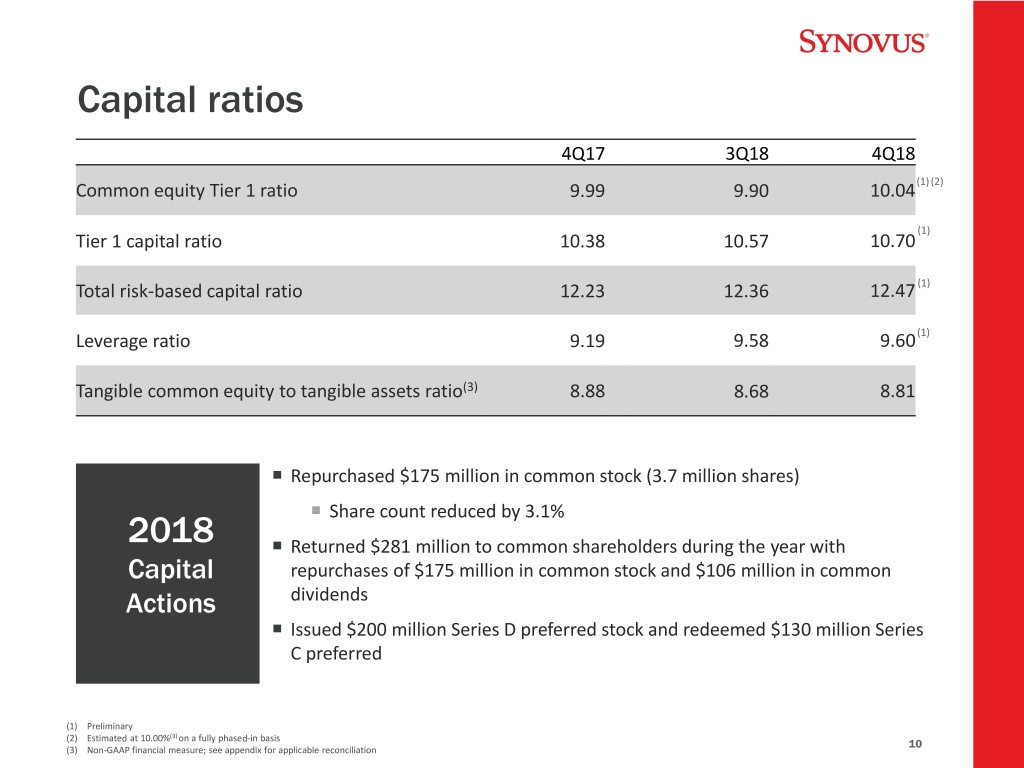
Capital ratios 4Q17 3Q18 4Q18 (1) (2) Common equity Tier 1 ratio 9.99 9.90 10.04 (1) Tier 1 capital ratio 10.38 10.57 10.70 Total risk-based capital ratio 12.23 12.36 12.47 (1) Leverage ratio 9.19 9.58 9.60 (1) Tangible common equity to tangible assets ratio(3) 8.88 8.68 8.81 Repurchased $175 million in common stock (3.7 million shares) Share count reduced by 3.1% 2018 Returned $281 million to common shareholders during the year with Capital repurchases of $175 million in common stock and $106 million in common Actions dividends Issued $200 million Series D preferred stock and redeemed $130 million Series C preferred (1) Preliminary (2) Estimated at 10.00%(3) on a fully phased-in basis 10 (3) Non-GAAP financial measure; see appendix for applicable reconciliation
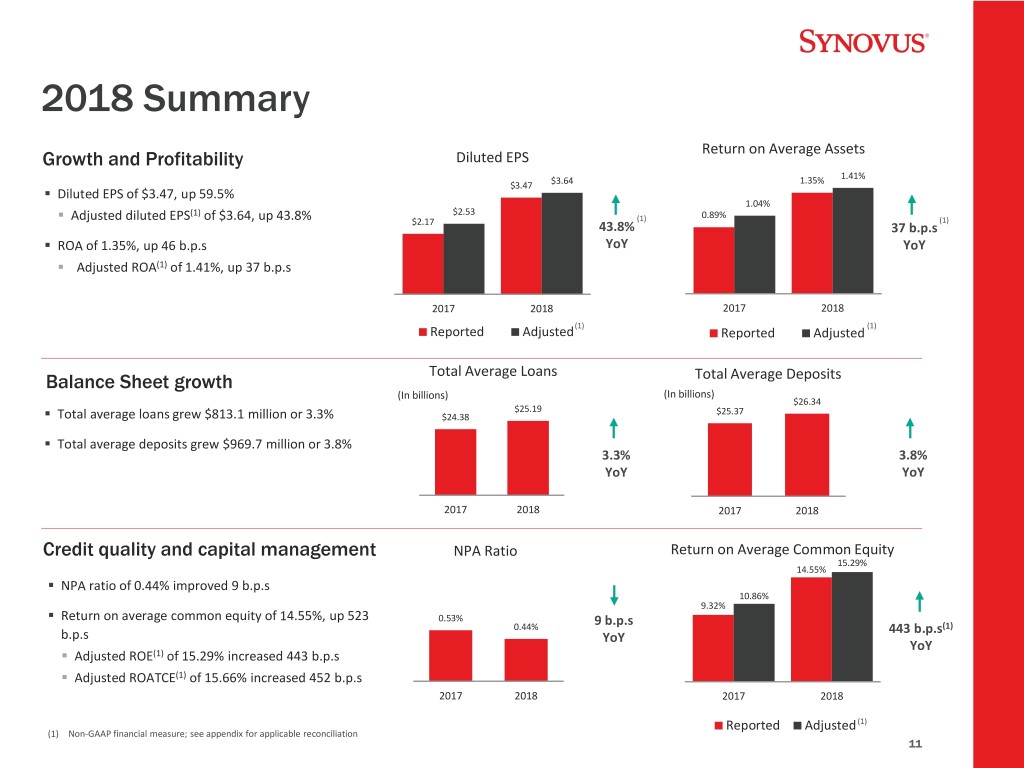
2018 Summary Return on Average Assets Growth and Profitability Diluted EPS 1.35% 1.41% $3.47 $3.64 . Diluted EPS of $3.47, up 59.5% 1.04% (1) $2.53 0.89% . Adjusted diluted EPS of $3.64, up 43.8% (1) (1) $2.17 43.8% 37 b.p.s . ROA of 1.35%, up 46 b.p.s YoY YoY . Adjusted ROA(1) of 1.41%, up 37 b.p.s 2017 2018 2017 2018 (1) (1) Reported Adjusted Reported Adjusted Total Average Loans Balance Sheet growth Total Average Deposits (In billions) (In billions) $26.34 $25.19 $25.37 . Total average loans grew $813.1 million or 3.3% $24.38 . Total average deposits grew $969.7 million or 3.8% 3.3% 3.8% YoY YoY 2017 2018 2017 2018 Credit quality and capital management NPA Ratio Return on Average Common Equity 15.29% 14.55% . NPA ratio of 0.44% improved 9 b.p.s 10.86% 9.32% . Return on average common equity of 14.55%, up 523 0.53% 9 b.p.s 0.44% 443 b.p.s(1) b.p.s YoY YoY . Adjusted ROE(1) of 15.29% increased 443 b.p.s . Adjusted ROATCE(1) of 15.66% increased 452 b.p.s 2017 2018 2017 2018 Reported Adjusted (1) (1) Non-GAAP financial measure; see appendix for applicable reconciliation 11
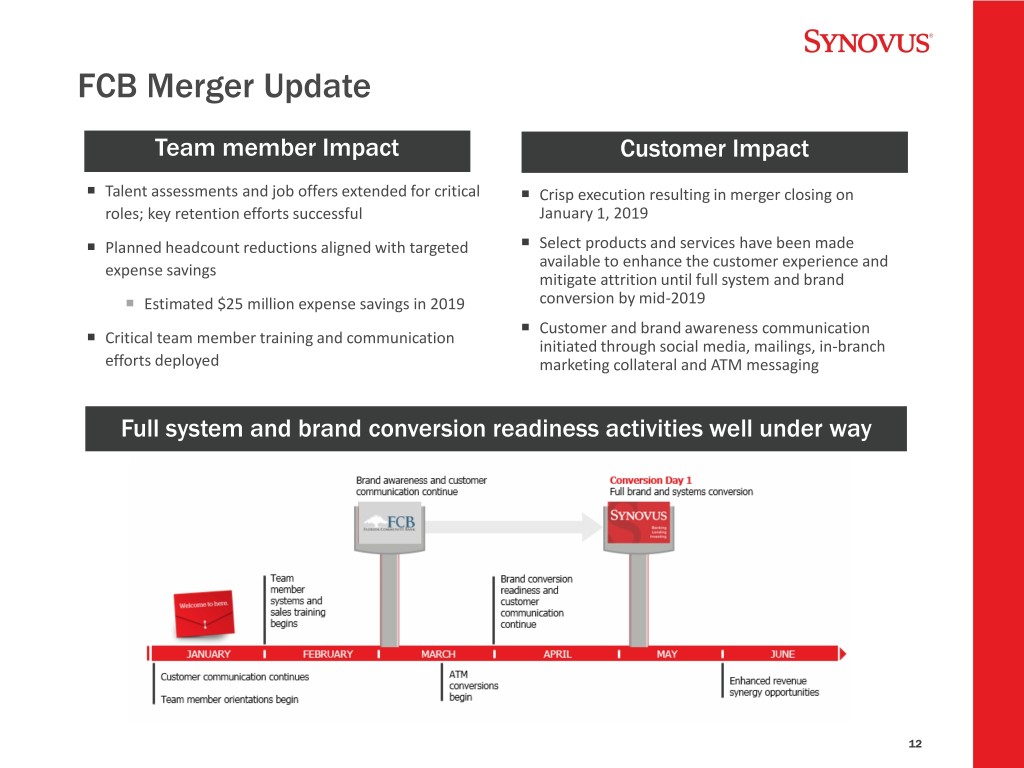
FCB Merger Update Team member Impact Customer Impact Talent assessments and job offers extended for critical Crisp execution resulting in merger closing on roles; key retention efforts successful January 1, 2019 Planned headcount reductions aligned with targeted Select products and services have been made available to enhance the customer experience and expense savings mitigate attrition until full system and brand Estimated $25 million expense savings in 2019 conversion by mid-2019 Customer and brand awareness communication Critical team member training and communication initiated through social media, mailings, in-branch efforts deployed marketing collateral and ATM messaging Full system and brand conversion readiness activities well under way 12
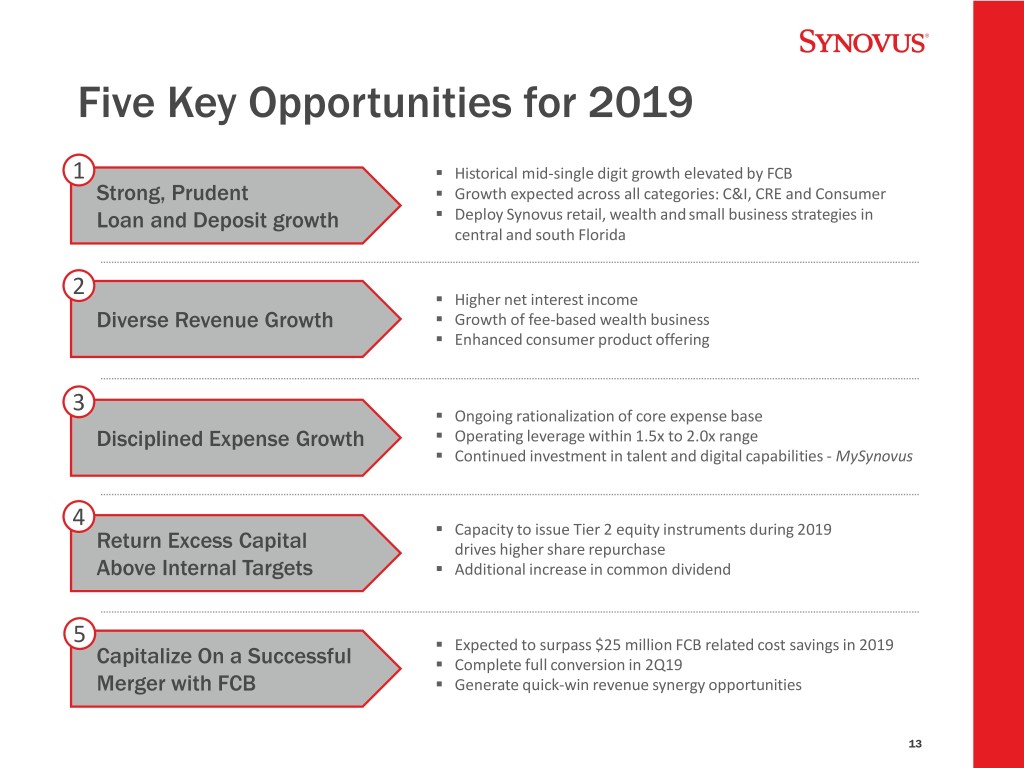
Five Key Opportunities for 2019 1 . Historical mid-single digit growth elevated by FCB Strong, Prudent . Growth expected across all categories: C&I, CRE and Consumer Loan and Deposit growth . Deploy Synovus retail, wealth and small business strategies in central and south Florida 2 . Higher net interest income Diverse Revenue Growth . Growth of fee-based wealth business . Enhanced consumer product offering 3 . Ongoing rationalization of core expense base Disciplined Expense Growth . Operating leverage within 1.5x to 2.0x range . Continued investment in talent and digital capabilities - MySynovus 4 . Capacity to issue Tier 2 equity instruments during 2019 Return Excess Capital drives higher share repurchase Above Internal Targets . Additional increase in common dividend 5 . Expected to surpass $25 million FCB related cost savings in 2019 Capitalize On a Successful . Complete full conversion in 2Q19 Merger with FCB . Generate quick-win revenue synergy opportunities 13

2019 Outlook Combined Baseline Metrics Effective 1/1/2019(1) 2019 Outlook Loan growth(2) $35.37 billion Balance 5.5% to 7.5% Sheet Deposit growth(2) $37.61 billion Revenue Revenue growth(3) $1.83 billion 5.5% to 7.5% Non- Adjusted non-interest expense growth(4) $956.9 million 2% to 4%(5) interest Expense and Taxes Effective tax rate 21.94% 23-24% Net charge-off ratio 19 b.p.s 15 to 20 b.p.s. Credit and Share repurchases $175 million $300 to $350 million Capital Common dividend per share (year) $1.00 Up 20% to $1.20 (1) Pro forma analysis based on 2018 results (2) Loan and deposit growth based on 12/31/2018 period end balance (3) No 2019 rate increases modeled; using the forward curve as of 12/31/2018 (4) Non-GAAP financial measure; see appendix for applicable reconciliation (5) Growth excludes preliminary quarterly amortization of intangibles of $5-6 million in 2019 14
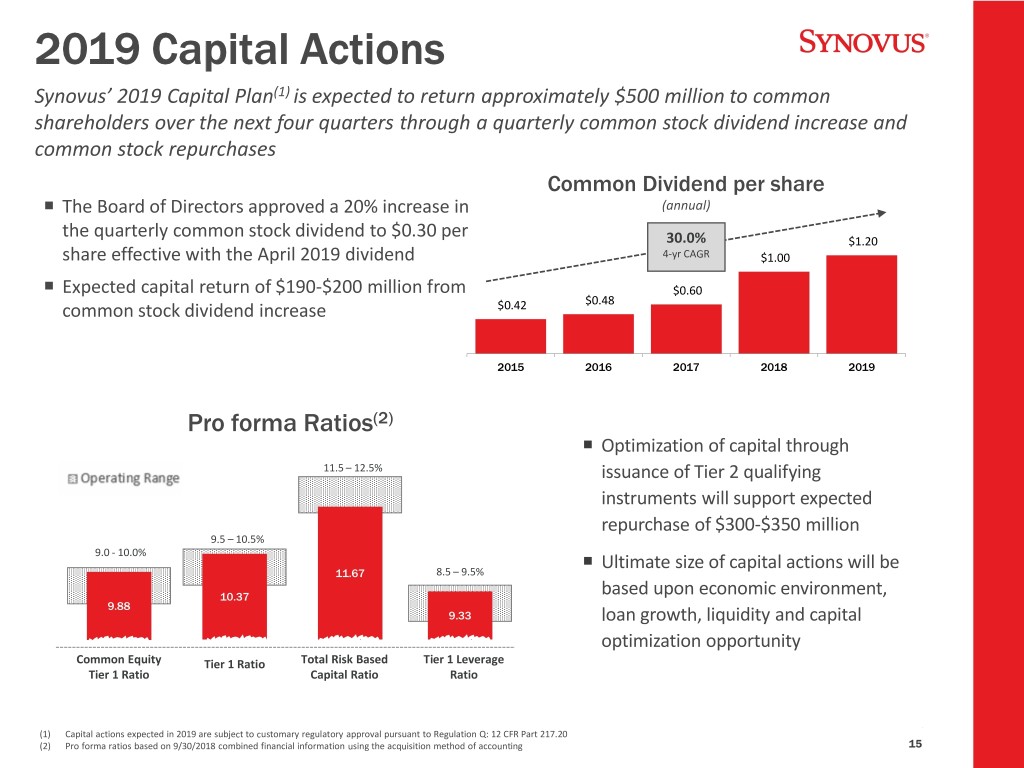
2019 Capital Actions Synovus’ 2019 Capital Plan(1) is expected to return approximately $500 million to common shareholders over the next four quarters through a quarterly common stock dividend increase and common stock repurchases Common Dividend per share The Board of Directors approved a 20% increase in (annual) the quarterly common stock dividend to $0.30 per 30.0% $1.20 share effective with the April 2019 dividend 4-yr CAGR $1.00 Expected capital return of $190-$200 million from $0.60 $0.48 common stock dividend increase $0.42 2015 2016 2017 2018 2019 Pro forma Ratios(2) Optimization of capital through 11.5 – 12.5% issuance of Tier 2 qualifying instruments will support expected repurchase of $300-$350 million 9.5 – 10.5% 9.0 - 10.0% Ultimate size of capital actions will be 11.67 8.5 – 9.5% 10.37 based upon economic environment, 9.88 9.33 loan growth, liquidity and capital optimization opportunity Common Equity Tier 1 Ratio Total Risk Based Tier 1 Leverage Tier 1 Ratio Capital Ratio Ratio (1) Capital actions expected in 2019 are subject to customary regulatory approval pursuant to Regulation Q: 12 CFR Part 217.20 (2) Pro forma ratios based on 9/30/2018 combined financial information using the acquisition method of accounting 15

Strategic areas of focus will drive sustained 10+% CAGR EPS growth and enhanced long-term targets Expanding Sources of Growth ROA ~ 1.45% Building High Performing Teams Differentiating Customer Experience ROTCE Transforming Digital ~ 17.0% Efficiency, Scale, and Modernization Tangible Leveraging Data as an Asset Efficiency Ratio ~ 50% 16
Appendix
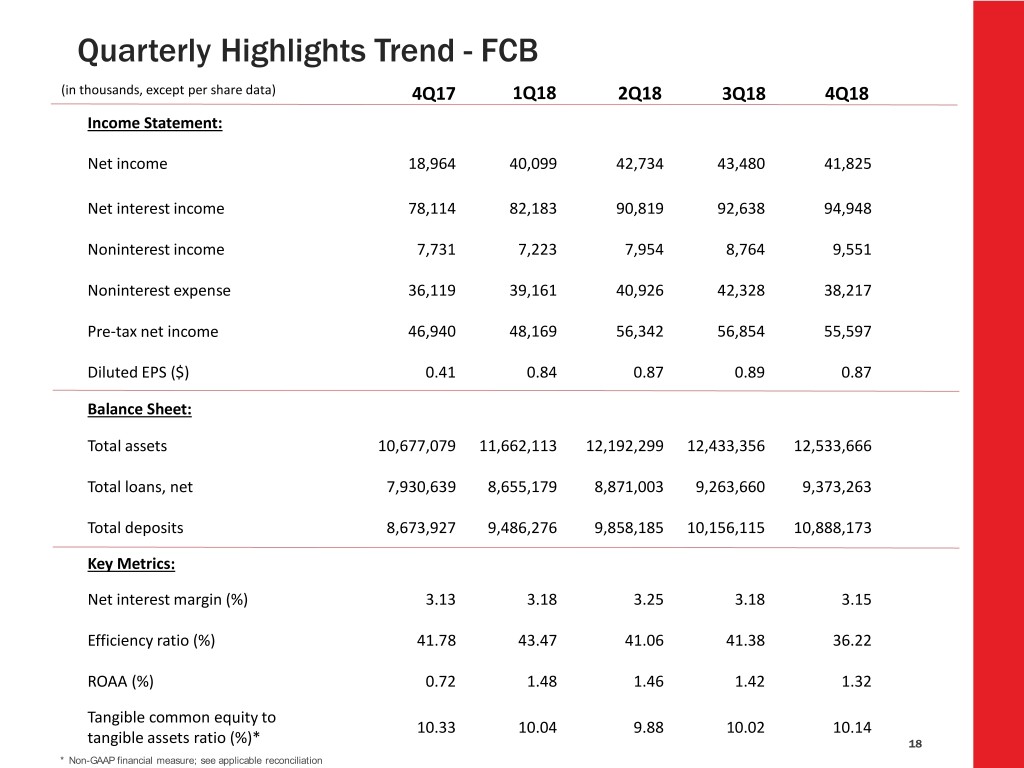
Quarterly Highlights Trend - FCB (in thousands, except per share data) 4Q17 1Q18 2Q18 3Q18 4Q18 Income Statement: Net income 18,964 40,099 42,734 43,480 41,825 Net interest income 78,114 82,183 90,819 92,638 94,948 Noninterest income 7,731 7,223 7,954 8,764 9,551 Noninterest expense 36,119 39,161 40,926 42,328 38,217 Pre-tax net income 46,940 48,169 56,342 56,854 55,597 Diluted EPS ($) 0.41 0.84 0.87 0.89 0.87 Balance Sheet: Total assets 10,677,079 11,662,113 12,192,299 12,433,356 12,533,666 Total loans, net 7,930,639 8,655,179 8,871,003 9,263,660 9,373,263 Total deposits 8,673,927 9,486,276 9,858,185 10,156,115 10,888,173 Key Metrics: Net interest margin (%) 3.13 3.18 3.25 3.18 3.15 Efficiency ratio (%) 41.78 43.47 41.06 41.38 36.22 ROAA (%) 0.72 1.48 1.46 1.42 1.32 Tangible common equity to 10.33 10.04 9.88 10.02 10.14 tangible assets ratio (%)* 18 * Non-GAAP financial measure; see applicable reconciliation
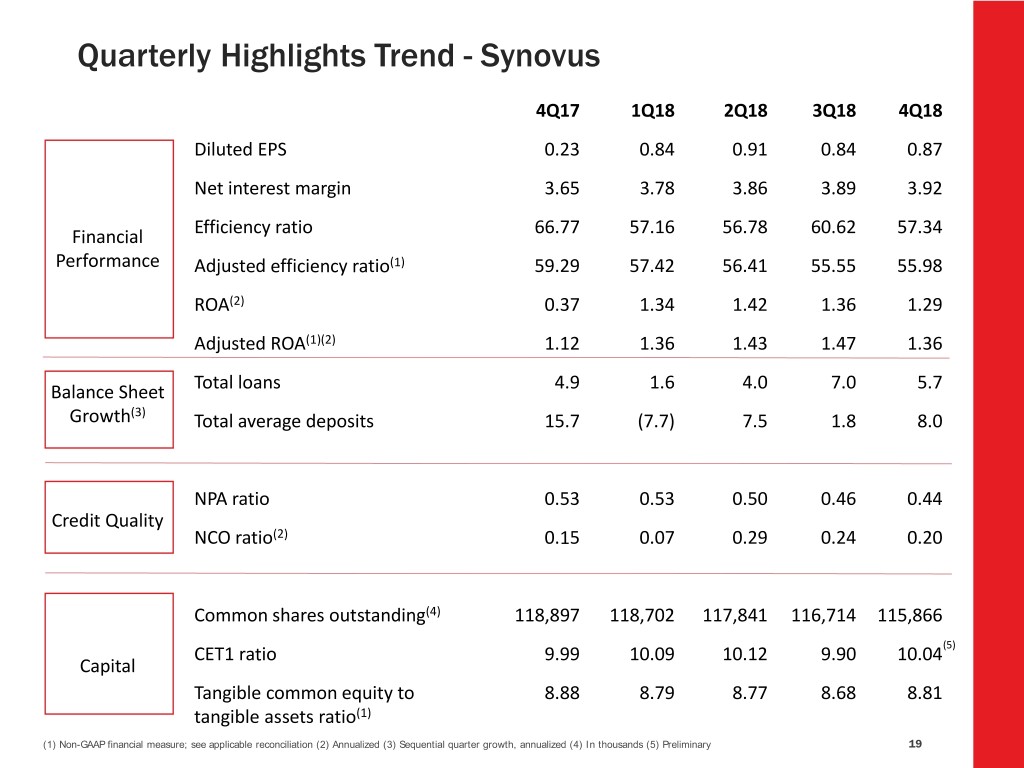
Quarterly Highlights Trend - Synovus 4Q17 1Q18 2Q18 3Q18 4Q18 Diluted EPS 0.23 0.84 0.91 0.84 0.87 Net interest margin 3.65 3.78 3.86 3.89 3.92 Financial Efficiency ratio 66.77 57.16 56.78 60.62 57.34 Performance Adjusted efficiency ratio(1) 59.29 57.42 56.41 55.55 55.98 ROA(2) 0.37 1.34 1.42 1.36 1.29 Adjusted ROA(1)(2) 1.12 1.36 1.43 1.47 1.36 Balance Sheet Total loans 4.9 1.6 4.0 7.0 5.7 Growth(3) Total average deposits 15.7 (7.7) 7.5 1.8 8.0 NPA ratio 0.53 0.53 0.50 0.46 0.44 Credit Quality NCO ratio(2) 0.15 0.07 0.29 0.24 0.20 Common shares outstanding(4) 118,897 118,702 117,841 116,714 115,866 (5) CET1 ratio 9.99 10.09 10.12 9.90 10.04 Capital Tangible common equity to 8.88 8.79 8.77 8.68 8.81 tangible assets ratio(1) (1) Non-GAAP financial measure; see applicable reconciliation (2) Annualized (3) Sequential quarter growth, annualized (4) In thousands (5) Preliminary 19

Condensed Income Statement (in thousands, except per share data) 4Q18 3Q18 4Q17 Net interest income $297,933 $291,619 $269,712 Non-interest income 67,991 71,668 69,353 Non-interest expense (209,922) (220,297) (226,533) Provision expense (12,148) (14,982) (8,565) Income before taxes 143,854 128,008 103,967 Income tax expense 38,784 18,949 74,361 Preferred stock dividends and redemption charge 3,151 9,729 2,560 Net income available to common shareholders $101,919 $99,330 $27,046 Weighted average common shares outstanding, diluted 116,986 118,095 120,182 Net income per diluted common share $0.87 $0.84 $0.23 20
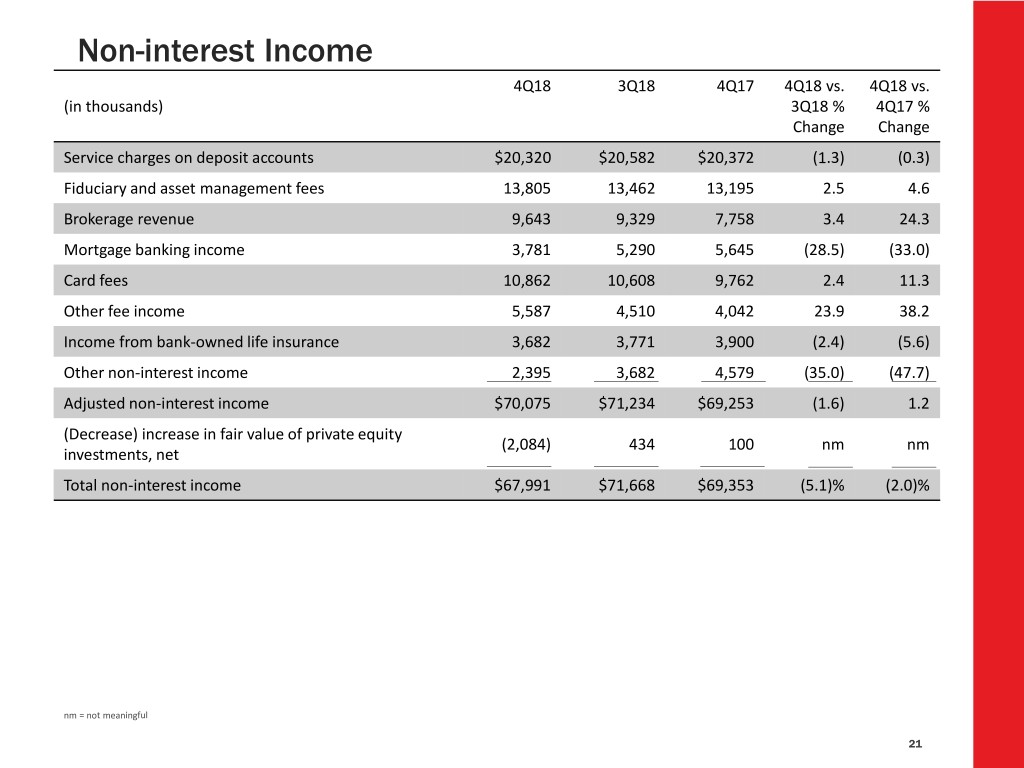
Non-interest Income 4Q18 3Q18 4Q17 4Q18 vs. 4Q18 vs. (in thousands) 3Q18 % 4Q17 % Change Change Service charges on deposit accounts $20,320 $20,582 $20,372 (1.3) (0.3) Fiduciary and asset management fees 13,805 13,462 13,195 2.5 4.6 Brokerage revenue 9,643 9,329 7,758 3.4 24.3 Mortgage banking income 3,781 5,290 5,645 (28.5) (33.0) Card fees 10,862 10,608 9,762 2.4 11.3 Other fee income 5,587 4,510 4,042 23.9 38.2 Income from bank-owned life insurance 3,682 3,771 3,900 (2.4) (5.6) Other non-interest income 2,395 3,682 4,579 (35.0) (47.7) Adjusted non-interest income $70,075 $71,234 $69,253 (1.6) 1.2 (Decrease) increase in fair value of private equity (2,084) 434 100 nm nm investments, net Total non-interest income $67,991 $71,668 $69,353 (5.1)% (2.0)% nm = not meaningful 21
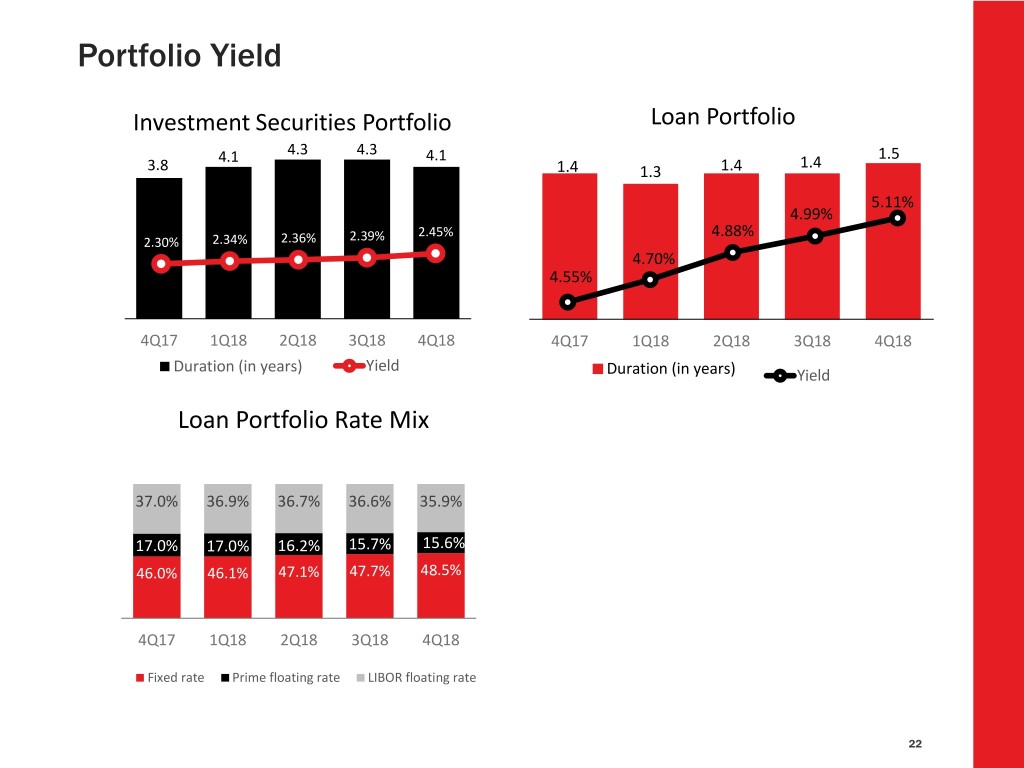
Portfolio Yield Investment Securities Portfolio Loan Portfolio 4.3 4.3 1.5 4.1 4.1 1.4 3.8 1.4 1.3 1.4 5.11% 4.99% 2.45%(2) 4.88% 2.30% 2.34% 2.36% 2.39% 4.70% 4.55% 4Q17 1Q18 2Q18 3Q18 4Q18 4Q17 1Q18 2Q18 3Q18 4Q18 Duration (in years) Yield Duration (in years) Yield Loan Portfolio Rate Mix 37.0% 36.9% 36.7% 36.6% 35.9% 17.0% 17.0% 16.2% 15.7% 15.6% 46.0% 46.1% 47.1% 47.7% 48.5% 4Q17 1Q18 2Q18 3Q18 4Q18 Fixed rate Prime floating rate LIBOR floating rate 22
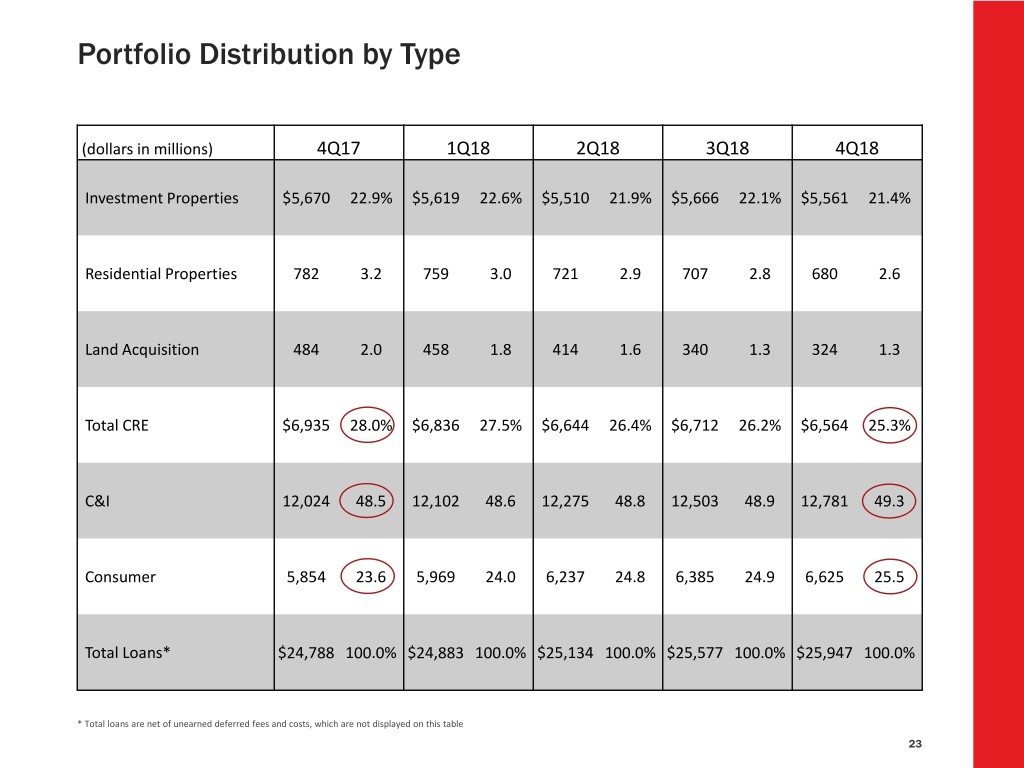
Portfolio Distribution by Type (dollars in millions) 4Q17 1Q18 2Q18 3Q18 4Q18 Investment Properties $5,670 22.9% $5,619 22.6% $5,510 21.9% $5,666 22.1% $5,561 21.4% Residential Properties 782 3.2 759 3.0 721 2.9 707 2.8 680 2.6 Land Acquisition 484 2.0 458 1.8 414 1.6 340 1.3 324 1.3 Total CRE $6,935 28.0% $6,836 27.5% $6,644 26.4% $6,712 26.2% $6,564 25.3% C&I 12,024 48.5 12,102 48.6 12,275 48.8 12,503 48.9 12,781 49.3 Consumer 5,854 23.6 5,969 24.0 6,237 24.8 6,385 24.9 6,625 25.5 Total Loans* $24,788 100.0% $24,883 100.0% $25,134 100.0% $25,577 100.0% $25,947 100.0% * Total loans are net of unearned deferred fees and costs, which are not displayed on this table 23
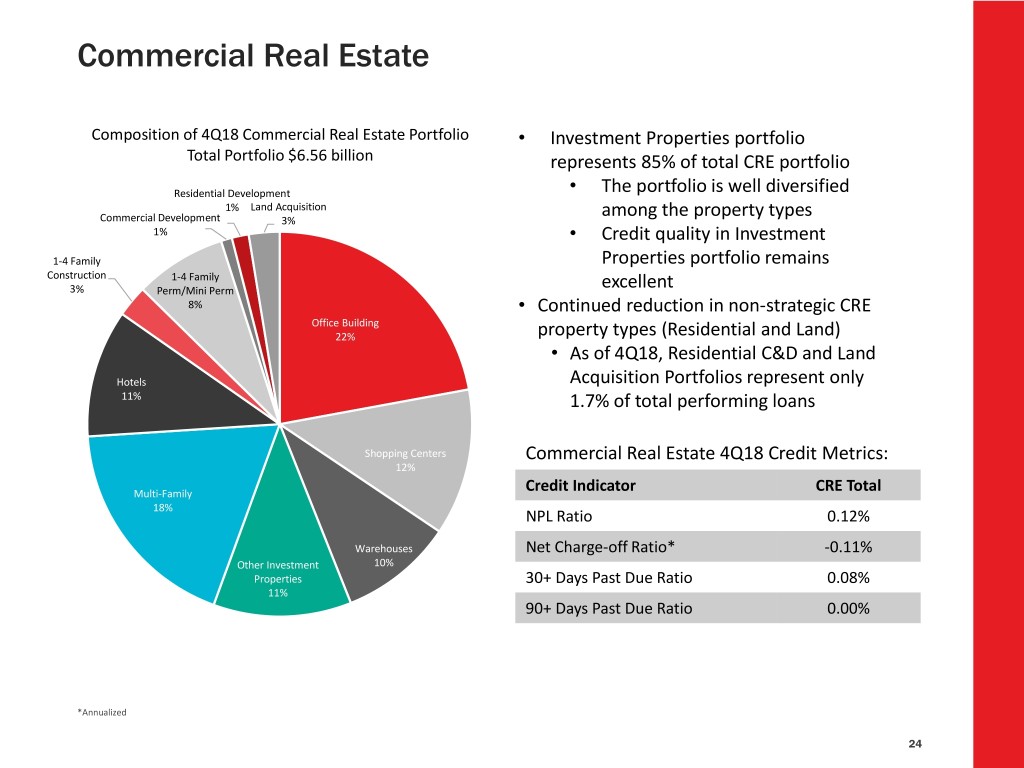
Commercial Real Estate Composition of 4Q18 Commercial Real Estate Portfolio • Investment Properties portfolio Total Portfolio $6.56 billion represents 85% of total CRE portfolio Residential Development • The portfolio is well diversified 1% Land Acquisition among the property types Commercial Development 3% 1% • Credit quality in Investment 1-4 Family Properties portfolio remains Construction 1-4 Family 3% Perm/Mini Perm excellent 8% • Continued reduction in non-strategic CRE Office Building 22% property types (Residential and Land) • As of 4Q18, Residential C&D and Land Hotels Acquisition Portfolios represent only 11% 1.7% of total performing loans Shopping Centers Commercial Real Estate 4Q18 Credit Metrics: 12% Multi-Family Credit Indicator CRE Total 18% NPL Ratio 0.12% Warehouses Net Charge-off Ratio* -0.11% Other Investment 10% Properties 30+ Days Past Due Ratio 0.08% 11% 90+ Days Past Due Ratio 0.00% *Annualized 24
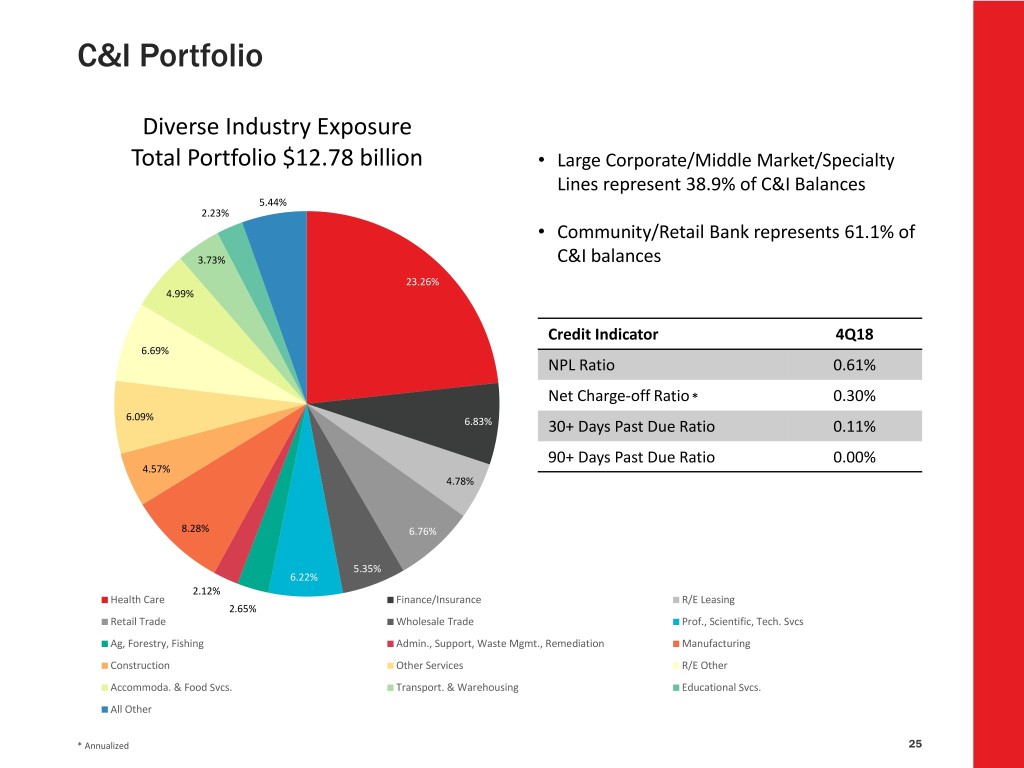
C&I Portfolio Diverse Industry Exposure Total Portfolio $12.78 billion • Large Corporate/Middle Market/Specialty Lines represent 38.9% of C&I Balances 5.44% 2.23% • Community/Retail Bank represents 61.1% of 3.73% C&I balances 23.26% 4.99% Credit Indicator 4Q18 6.69% NPL Ratio 0.61% Net Charge-off Ratio * 0.30% 6.09% 6.83% 30+ Days Past Due Ratio 0.11% 90+ Days Past Due Ratio 0.00% 4.57% 4.78% 8.28% 6.76% 5.35% 6.22% 2.12% Health Care Finance/Insurance R/E Leasing 2.65% Retail Trade Wholesale Trade Prof., Scientific, Tech. Svcs Ag, Forestry, Fishing Admin., Support, Waste Mgmt., Remediation Manufacturing Construction Other Services R/E Other Accommoda. & Food Svcs. Transport. & Warehousing Educational Svcs. All Other * Annualized 25
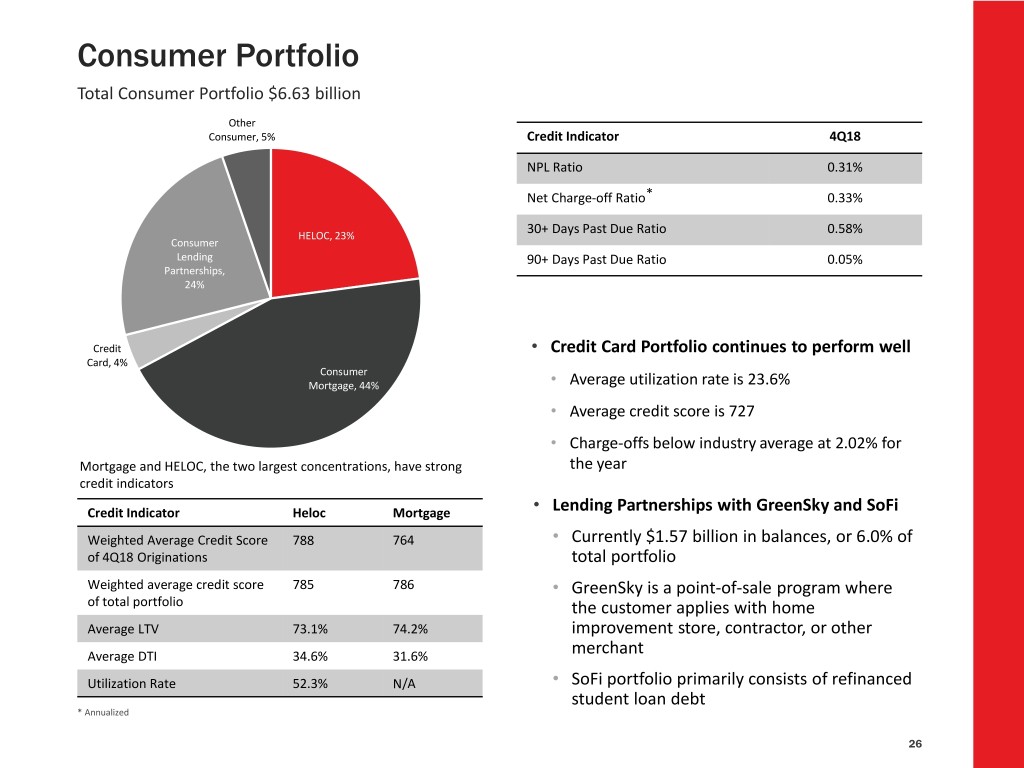
Consumer Portfolio Total Consumer Portfolio $6.63 billion Other Consumer, 5% Credit Indicator 4Q18 NPL Ratio 0.31% Net Charge-off Ratio* 0.33% HELOC, 23% 30+ Days Past Due Ratio 0.58% Consumer Lending 90+ Days Past Due Ratio 0.05% Partnerships, 24% Credit • Credit Card Portfolio continues to perform well Card, 4% Consumer Mortgage, 44% • Average utilization rate is 23.6% • Average credit score is 727 • Charge-offs below industry average at 2.02% for Mortgage and HELOC, the two largest concentrations, have strong the year credit indicators Credit Indicator Heloc Mortgage • Lending Partnerships with GreenSky and SoFi Weighted Average Credit Score 788 764 • Currently $1.57 billion in balances, or 6.0% of of 4Q18 Originations total portfolio Weighted average credit score 785 786 • GreenSky is a point-of-sale program where of total portfolio the customer applies with home Average LTV 73.1% 74.2% improvement store, contractor, or other Average DTI 34.6% 31.6% merchant Utilization Rate 52.3% N/A • SoFi portfolio primarily consists of refinanced student loan debt * Annualized 26
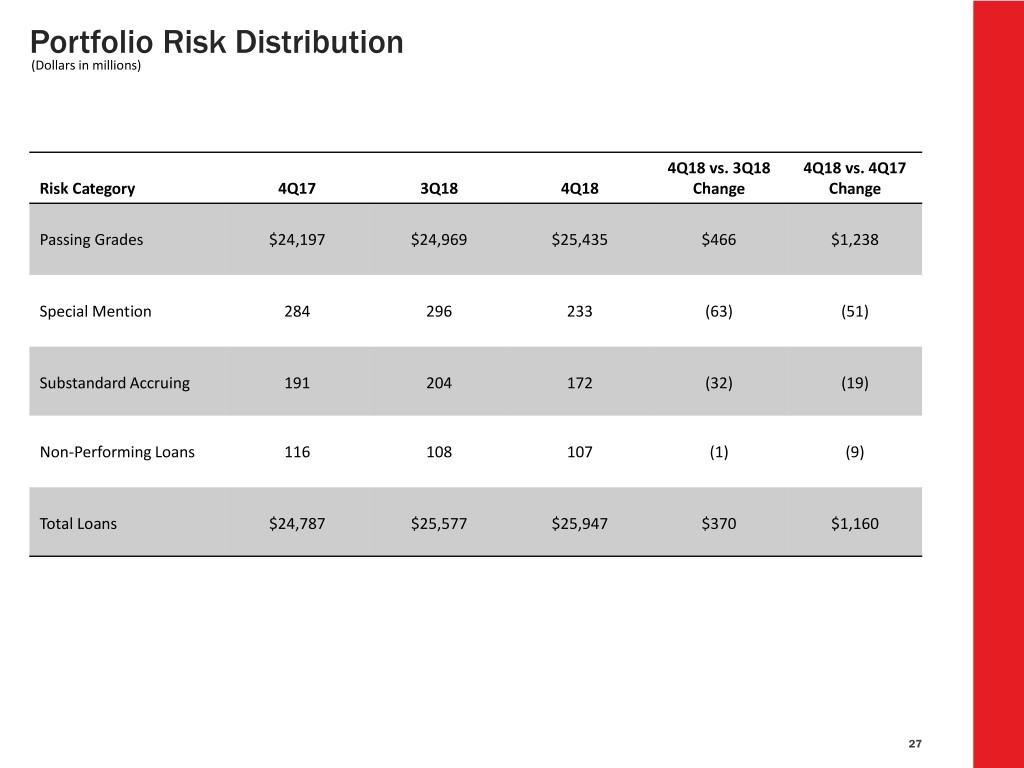
Portfolio Risk Distribution (Dollars in millions) 4Q18 vs. 3Q18 4Q18 vs. 4Q17 Risk Category 4Q17 3Q18 4Q18 Change Change Passing Grades $24,197 $24,969 $25,435 $466 $1,238 Special Mention 284 296 233 (63) (51) Substandard Accruing 191 204 172 (32) (19) Non-Performing Loans 116 108 107 (1) (9) Total Loans $24,787 $25,577 $25,947 $370 $1,160 27
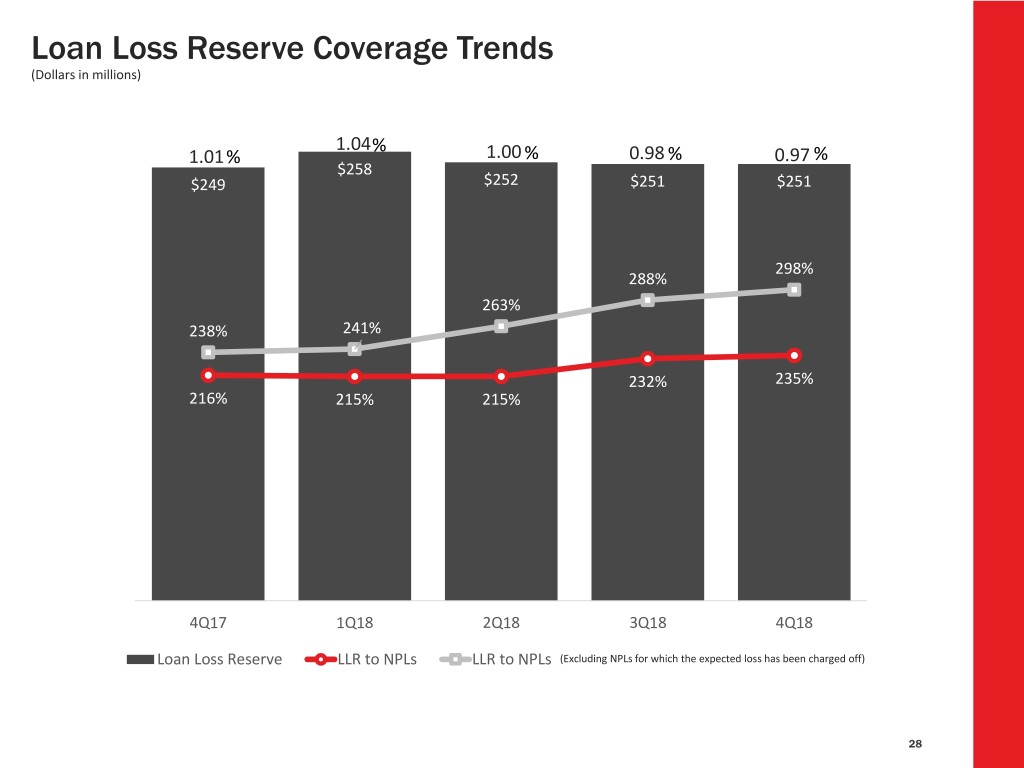
Loan Loss Reserve Coverage Trends (Dollars in millions) 1.04% 1.01% 1.00 % 0.98 % 0.97 % $258 $249 $252 $251 $251 298% 288% 263% 238% 241% 232% 235% 216% 215% 215% 4Q17 1Q18 2Q18 3Q18 4Q18 Loan Loss Reserve LLR to NPLs LLR to NPLs (Excluding NPLs for which the expected loss has been charged off) 28
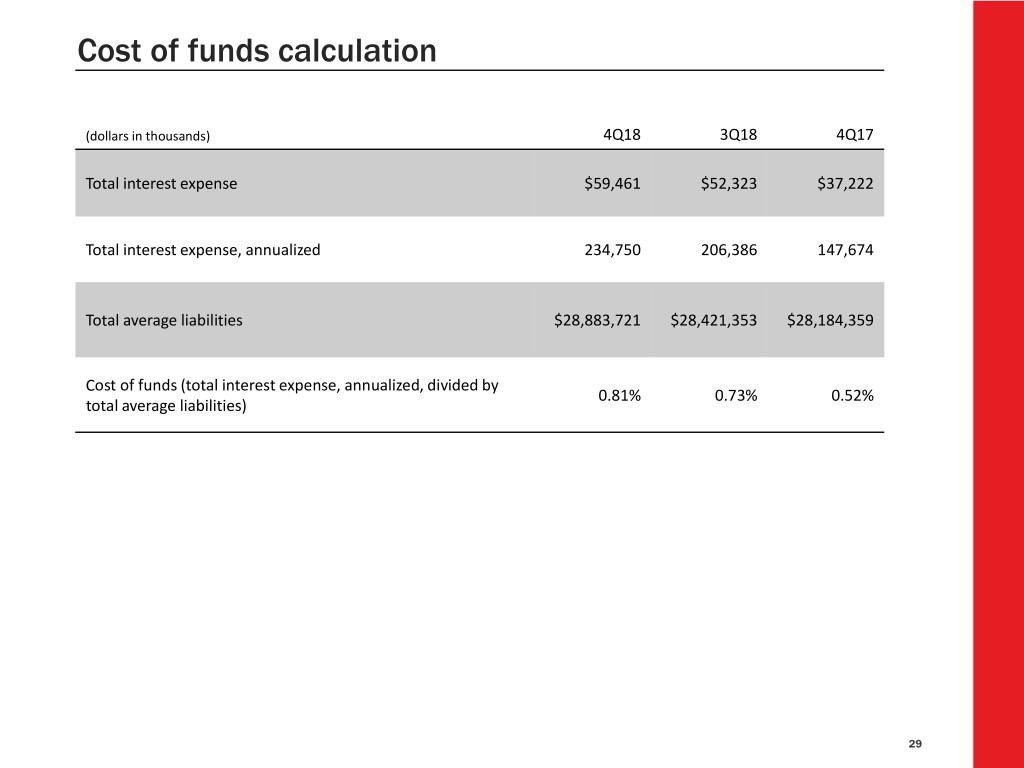
Cost of funds calculation (dollars in thousands) 4Q18 3Q18 4Q17 Total interest expense $59,461 $52,323 $37,222 Total interest expense, annualized 234,750 206,386 147,674 Total average liabilities $28,883,721 $28,421,353 $28,184,359 Cost of funds (total interest expense, annualized, divided by 0.81% 0.73% 0.52% total average liabilities) 29
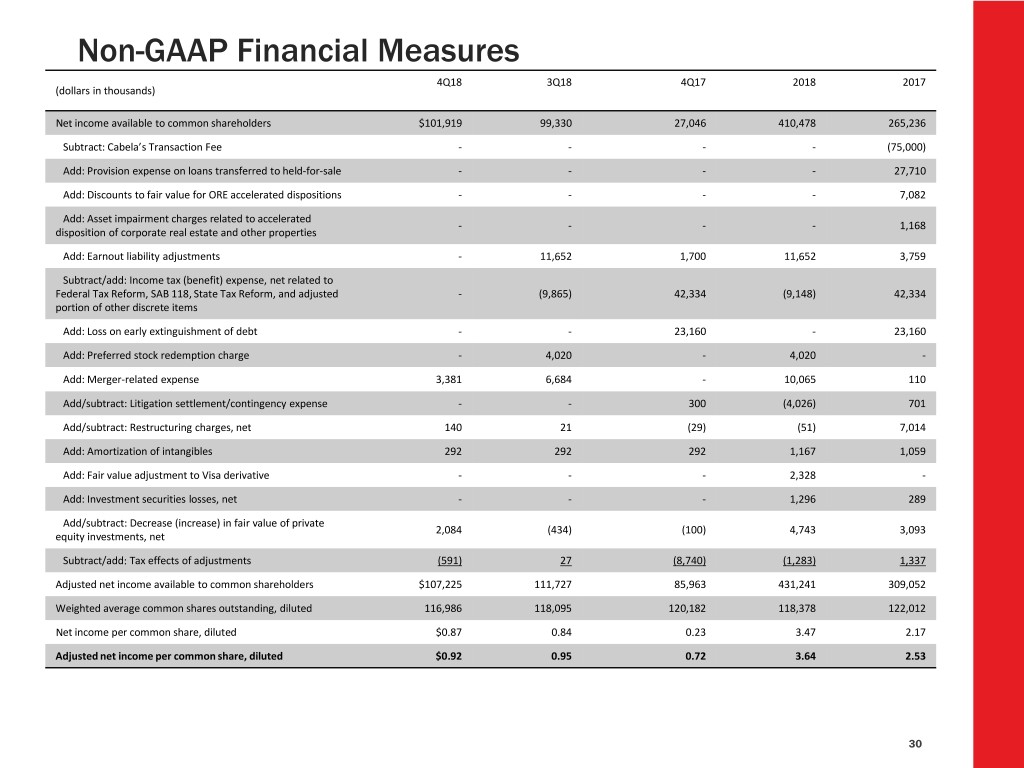
Non-GAAP Financial Measures 4Q18 3Q18 4Q17 2018 2017 (dollars in thousands) Net income available to common shareholders $101,919 99,330 27,046 410,478 265,236 Subtract: Cabela’s Transaction Fee - - - - (75,000) Add: Provision expense on loans transferred to held-for-sale - - - - 27,710 Add: Discounts to fair value for ORE accelerated dispositions - - - - 7,082 Add: Asset impairment charges related to accelerated - - - - 1,168 disposition of corporate real estate and other properties Add: Earnout liability adjustments - 11,652 1,700 11,652 3,759 Subtract/add: Income tax (benefit) expense, net related to Federal Tax Reform, SAB 118, State Tax Reform, and adjusted - (9,865) 42,334 (9,148) 42,334 portion of other discrete items Add: Loss on early extinguishment of debt - - 23,160 - 23,160 Add: Preferred stock redemption charge - 4,020 - 4,020 - Add: Merger-related expense 3,381 6,684 - 10,065 110 Add/subtract: Litigation settlement/contingency expense - - 300 (4,026) 701 Add/subtract: Restructuring charges, net 140 21 (29) (51) 7,014 Add: Amortization of intangibles 292 292 292 1,167 1,059 Add: Fair value adjustment to Visa derivative - - - 2,328 - Add: Investment securities losses, net - - - 1,296 289 Add/subtract: Decrease (increase) in fair value of private 2,084 (434) (100) 4,743 3,093 equity investments, net Subtract/add: Tax effects of adjustments (591) 27 (8,740) (1,283) 1,337 Adjusted net income available to common shareholders $107,225 111,727 85,963 431,241 309,052 Weighted average common shares outstanding, diluted 116,986 118,095 120,182 118,378 122,012 Net income per common share, diluted $0.87 0.84 0.23 3.47 2.17 Adjusted net income per common share, diluted $0.92 0.95 0.72 3.64 2.53 30
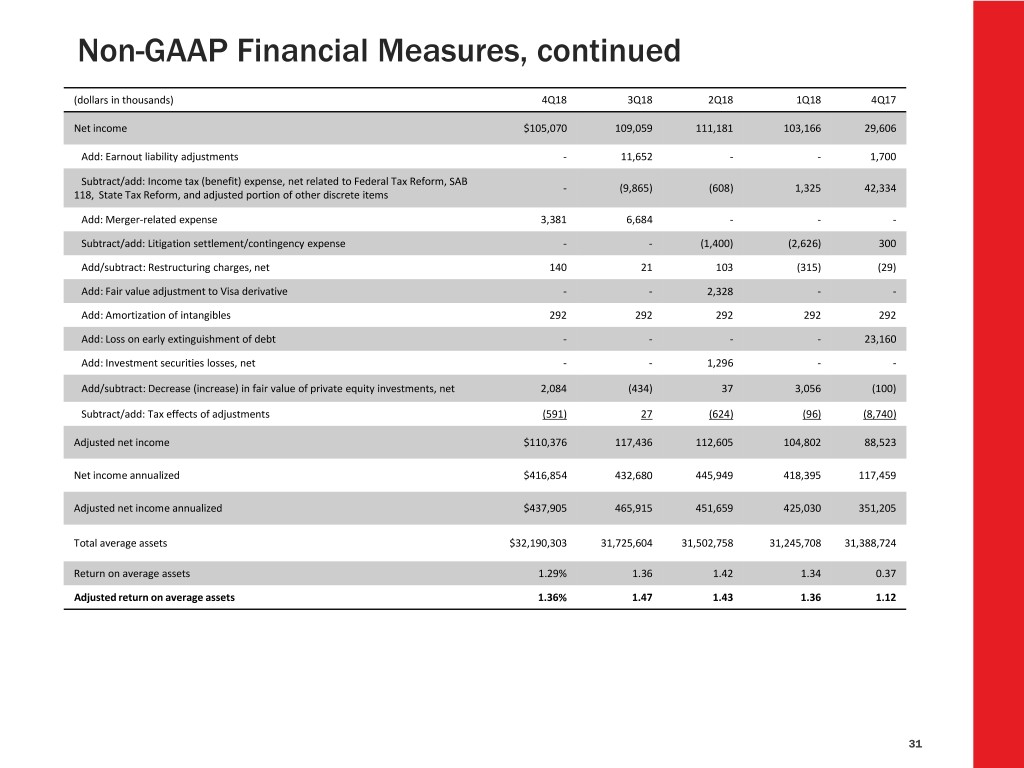
Non-GAAP Financial Measures, continued (dollars in thousands) 4Q18 3Q18 2Q18 1Q18 4Q17 Net income $105,070 109,059 111,181 103,166 29,606 Add: Earnout liability adjustments - 11,652 - - 1,700 Subtract/add: Income tax (benefit) expense, net related to Federal Tax Reform, SAB - (9,865) (608) 1,325 42,334 118, State Tax Reform, and adjusted portion of other discrete items Add: Merger-related expense 3,381 6,684 - - - Subtract/add: Litigation settlement/contingency expense - - (1,400) (2,626) 300 Add/subtract: Restructuring charges, net 140 21 103 (315) (29) Add: Fair value adjustment to Visa derivative - - 2,328 - - Add: Amortization of intangibles 292 292 292 292 292 Add: Loss on early extinguishment of debt - - - - 23,160 Add: Investment securities losses, net - - 1,296 - - Add/subtract: Decrease (increase) in fair value of private equity investments, net 2,084 (434) 37 3,056 (100) Subtract/add: Tax effects of adjustments (591) 27 (624) (96) (8,740) Adjusted net income $110,376 117,436 112,605 104,802 88,523 Net income annualized $416,854 432,680 445,949 418,395 117,459 Adjusted net income annualized $437,905 465,915 451,659 425,030 351,205 Total average assets $32,190,303 31,725,604 31,502,758 31,245,708 31,388,724 Return on average assets 1.29% 1.36 1.42 1.34 0.37 Adjusted return on average assets 1.36% 1.47 1.43 1.36 1.12 31

Non-GAAP Financial Measures, continued (dollars in thousands) 2018 2017 Net income 428,476 275,474 Subtract: Cabela’s Transaction Fee - (75,000) Add: Provision expense on loans transferred to held-for-sale - 27,710 Add: Discounts to fair value for ORE accelerated dispositions - 7,082 Add: Asset impairment charges related to accelerated dispositions of corporate real estate and other properties - 1,168 Add: Earnout liability adjustments 11,652 3,759 Subtract/add: Income tax (benefit) expense, net related to Federal Tax Reform, SAB 118, State Tax Reform, and (9,148) 42,334 adjusted portion of other discrete items Add: Merger-related expense 10,065 110 Subtract/add: Litigation settlement/contingency expense (4,026) 701 Subtract/add: Restructuring charges, net (51) 7,014 Add: Fair value adjustment to Visa derivative 2,328 - Add: Amortization of intangibles 1,167 1,059 Add: Loss on early extinguishment of debt - 23,160 Add: Investment securities losses, net 1,296 289 Add: Decrease in fair value of private equity investments, net 4,743 3,093 Subtract/add: Tax effects of adjustments (1,283) 1,337 Adjusted net income $445,219 319,290 Total average assets $31,668,847 30,787,288 Return on average assets 1.35% 0.89 Adjusted return on average assets 1.41 1.04 32

Non-GAAP Financial Measures, continued (dollars in thousands) 4Q18 3Q18 4Q17 2018 2017 Net income available to common shareholders $101,919 99,330 27,046 410,478 265,236 Subtract: Cabela’s Transaction Fee - - - - (75,000) Add: Provision expense on loans transferred to held-for-sale - - - - 27,710 Add: Discounts to fair value for ORE accelerated dispositions - - - - 7,082 Add: Asset impairment charges related to accelerated dispositions of corporate real estate - - - - 1,168 and other properties Add: Earnout liability adjustments - 11,652 1,700 11,652 3,759 Subtract/add: Income tax (benefit) expense, net related to Federal Tax Reform, SAB 118, - (9,865) 42,334 (9,148) 42,334 State Tax Reform, and adjusted portion of other discrete items Add: Merger-related expense 3,381 6,684 - 10,065 110 Add/subtract: Litigation settlement/contingency expense - - 300 (4,026) 701 Add: Preferred stock redemption charge - 4,020 - 4,020 - Add/subtract: Restructuring charges, net 140 21 (29) (51) 7,014 Add: Fair value adjustment to Visa derivative - - - 2,328 - Add: Amortization of intangibles 292 292 292 1,167 1,059 Add: Loss on early extinguishment of debt - - 23,160 - 23,160 Add: Investment securities losses, net - - - 1,296 289 Add/subtract: Decrease (increase) in fair value of private equity investments 2,084 (434) (100) 4,743 3,093 Subtract/add: Tax effects of adjustments (591) 27 (8,740) (1,283) 1,337 Adjusted net income available to common shareholders $107,225 111,727 85,963 431,241 309,052 Net income available to common shareholders annualized 404,353 394,081 107,302 - - Adjusted net income available to common shareholders annualized 425,404 443,265 341,049 - - Total average shareholders’ equity less preferred stock $2,837,740 2,824,707 2,851,523 2,821,311 2,844,570 Subtract: Goodwill (57,315) (57,315) (57,315) (57,315) (57,779) Subtract: Other intangible assets, net (9,972) (10,265) (11,353) (10,424) (12,030) Total average tangible shareholders’ equity less preferred stock $2,770,453 2,757,127 2,782,855 2,753,572 2,774,761 Return on average common equity 14.25% 13.95 3.76 14.55 9.32 Adjusted return on average common equity 14.99% 15.69 11.96 15.29 10.86 Adjusted return on average tangible common equity 15.36% 16.08 12.26 15.66 11.14 33
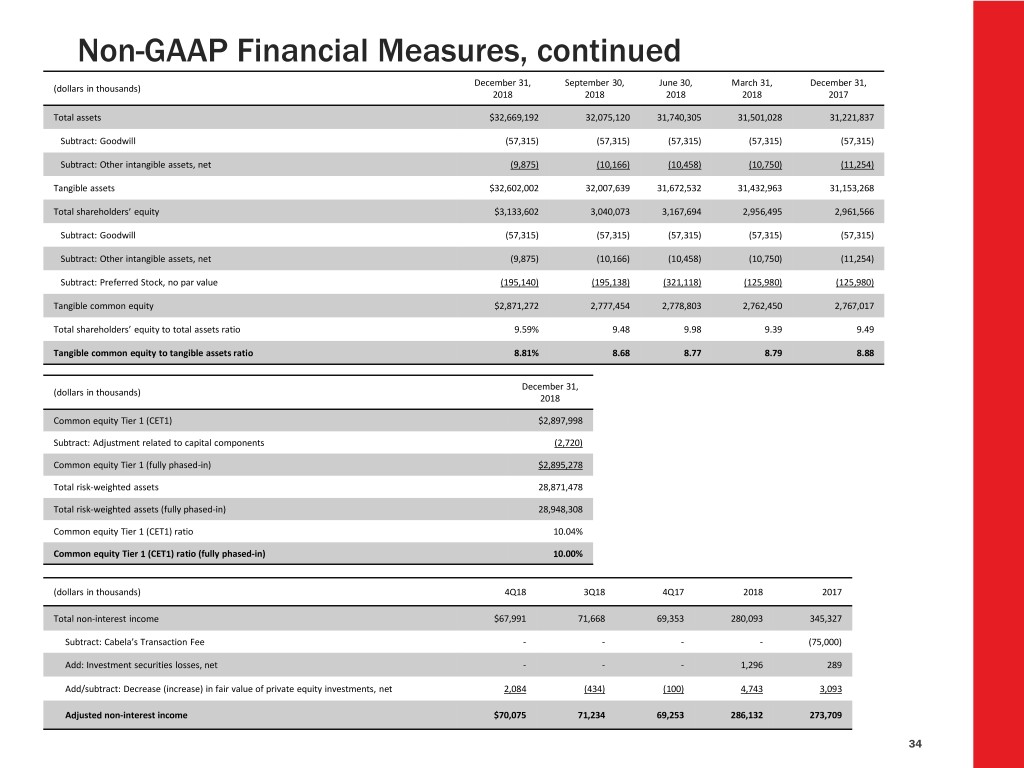
Non-GAAP Financial Measures, continued December 31, September 30, June 30, March 31, December 31, (dollars in thousands) 2018 2018 2018 2018 2017 Total assets $32,669,192 32,075,120 31,740,305 31,501,028 31,221,837 Subtract: Goodwill (57,315) (57,315) (57,315) (57,315) (57,315) Subtract: Other intangible assets, net (9,875) (10,166) (10,458) (10,750) (11,254) Tangible assets $32,602,002 32,007,639 31,672,532 31,432,963 31,153,268 Total shareholders’ equity $3,133,602 3,040,073 3,167,694 2,956,495 2,961,566 Subtract: Goodwill (57,315) (57,315) (57,315) (57,315) (57,315) Subtract: Other intangible assets, net (9,875) (10,166) (10,458) (10,750) (11,254) Subtract: Preferred Stock, no par value (195,140) (195,138) (321,118) (125,980) (125,980) Tangible common equity $2,871,272 2,777,454 2,778,803 2,762,450 2,767,017 Total shareholders’ equity to total assets ratio 9.59% 9.48 9.98 9.39 9.49 Tangible common equity to tangible assets ratio 8.81% 8.68 8.77 8.79 8.88 December 31, (dollars in thousands) 2018 Common equity Tier 1 (CET1) $2,897,998 Subtract: Adjustment related to capital components (2,720) Common equity Tier 1 (fully phased-in) $2,895,278 Total risk-weighted assets 28,871,478 Total risk-weighted assets (fully phased-in) 28,948,308 Common equity Tier 1 (CET1) ratio 10.04% Common equity Tier 1 (CET1) ratio (fully phased-in) 10.00% (dollars in thousands) 4Q18 3Q18 4Q17 2018 2017 Total non-interest income $67,991 71,668 69,353 280,093 345,327 Subtract: Cabela’s Transaction Fee - - - - (75,000) Add: Investment securities losses, net - - - 1,296 289 Add/subtract: Decrease (increase) in fair value of private equity investments, net 2,084 (434) (100) 4,743 3,093 Adjusted non-interest income $70,075 71,234 69,253 286,132 273,709 34
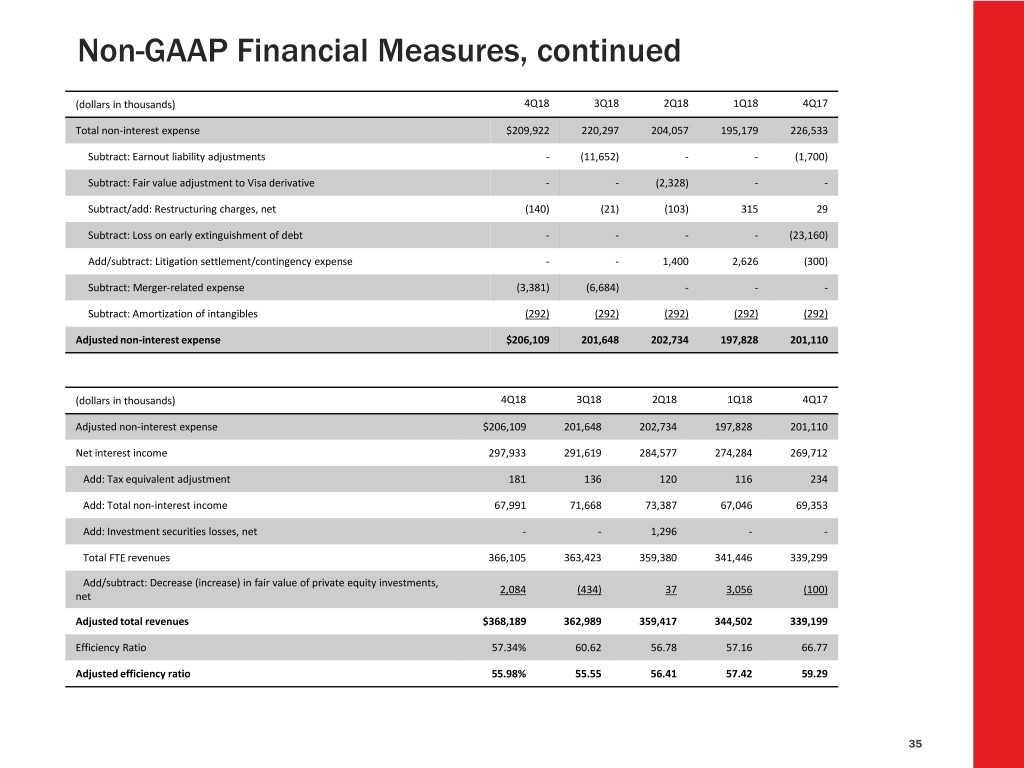
Non-GAAP Financial Measures, continued (dollars in thousands) 4Q18 3Q18 2Q18 1Q18 4Q17 Total non-interest expense $209,922 220,297 204,057 195,179 226,533 Subtract: Earnout liability adjustments - (11,652) - - (1,700) Subtract: Fair value adjustment to Visa derivative - - (2,328) - - Subtract/add: Restructuring charges, net (140) (21) (103) 315 29 Subtract: Loss on early extinguishment of debt - - - - (23,160) Add/subtract: Litigation settlement/contingency expense - - 1,400 2,626 (300) Subtract: Merger-related expense (3,381) (6,684) - - - Subtract: Amortization of intangibles (292) (292) (292) (292) (292) Adjusted non-interest expense $206,109 201,648 202,734 197,828 201,110 (dollars in thousands) 4Q18 3Q18 2Q18 1Q18 4Q17 Adjusted non-interest expense $206,109 201,648 202,734 197,828 201,110 Net interest income 297,933 291,619 284,577 274,284 269,712 Add: Tax equivalent adjustment 181 136 120 116 234 Add: Total non-interest income 67,991 71,668 73,387 67,046 69,353 Add: Investment securities losses, net - - 1,296 - - Total FTE revenues 366,105 363,423 359,380 341,446 339,299 Add/subtract: Decrease (increase) in fair value of private equity investments, 2,084 (434) 37 3,056 (100) net Adjusted total revenues $368,189 362,989 359,417 344,502 339,199 Efficiency Ratio 57.34% 60.62 56.78 57.16 66.77 Adjusted efficiency ratio 55.98% 55.55 56.41 57.42 59.29 35
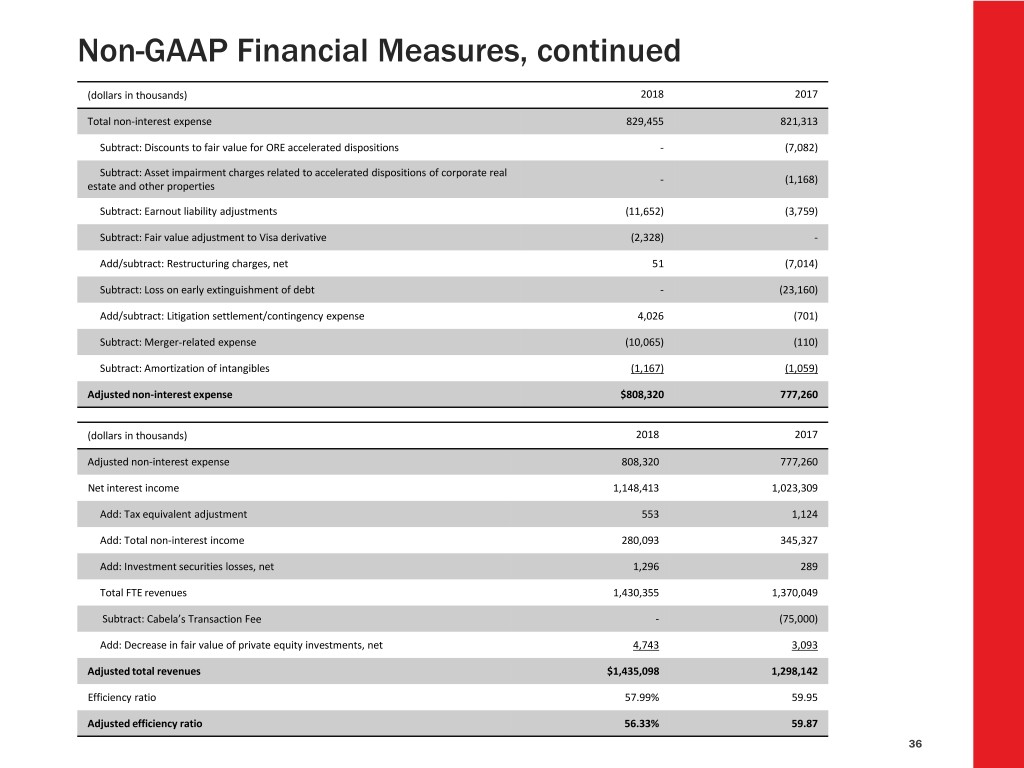
Non-GAAP Financial Measures, continued (dollars in thousands) 2018 2017 Total non-interest expense 829,455 821,313 Subtract: Discounts to fair value for ORE accelerated dispositions - (7,082) Subtract: Asset impairment charges related to accelerated dispositions of corporate real - (1,168) estate and other properties Subtract: Earnout liability adjustments (11,652) (3,759) Subtract: Fair value adjustment to Visa derivative (2,328) - Add/subtract: Restructuring charges, net 51 (7,014) Subtract: Loss on early extinguishment of debt - (23,160) Add/subtract: Litigation settlement/contingency expense 4,026 (701) Subtract: Merger-related expense (10,065) (110) Subtract: Amortization of intangibles (1,167) (1,059) Adjusted non-interest expense $808,320 777,260 (dollars in thousands) 2018 2017 Adjusted non-interest expense 808,320 777,260 Net interest income 1,148,413 1,023,309 Add: Tax equivalent adjustment 553 1,124 Add: Total non-interest income 280,093 345,327 Add: Investment securities losses, net 1,296 289 Total FTE revenues 1,430,355 1,370,049 Subtract: Cabela’s Transaction Fee - (75,000) Add: Decrease in fair value of private equity investments, net 4,743 3,093 Adjusted total revenues $1,435,098 1,298,142 Efficiency ratio 57.99% 59.95 Adjusted efficiency ratio 56.33% 59.87 36
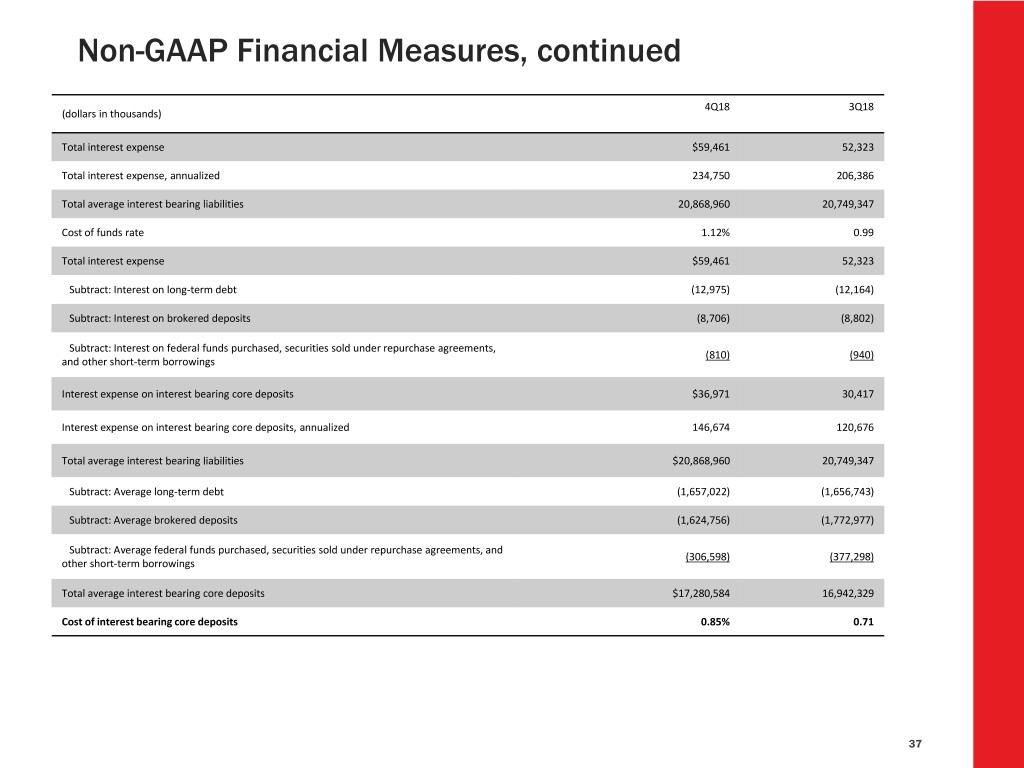
Non-GAAP Financial Measures, continued 4Q18 3Q18 (dollars in thousands) Total interest expense $59,461 52,323 Total interest expense, annualized 234,750 206,386 Total average interest bearing liabilities 20,868,960 20,749,347 Cost of funds rate 1.12% 0.99 Total interest expense $59,461 52,323 Subtract: Interest on long-term debt (12,975) (12,164) Subtract: Interest on brokered deposits (8,706) (8,802) Subtract: Interest on federal funds purchased, securities sold under repurchase agreements, (810) (940) and other short-term borrowings Interest expense on interest bearing core deposits $36,971 30,417 Interest expense on interest bearing core deposits, annualized 146,674 120,676 Total average interest bearing liabilities $20,868,960 20,749,347 Subtract: Average long-term debt (1,657,022) (1,656,743) Subtract: Average brokered deposits (1,624,756) (1,772,977) Subtract: Average federal funds purchased, securities sold under repurchase agreements, and (306,598) (377,298) other short-term borrowings Total average interest bearing core deposits $17,280,584 16,942,329 Cost of interest bearing core deposits 0.85% 0.71 37
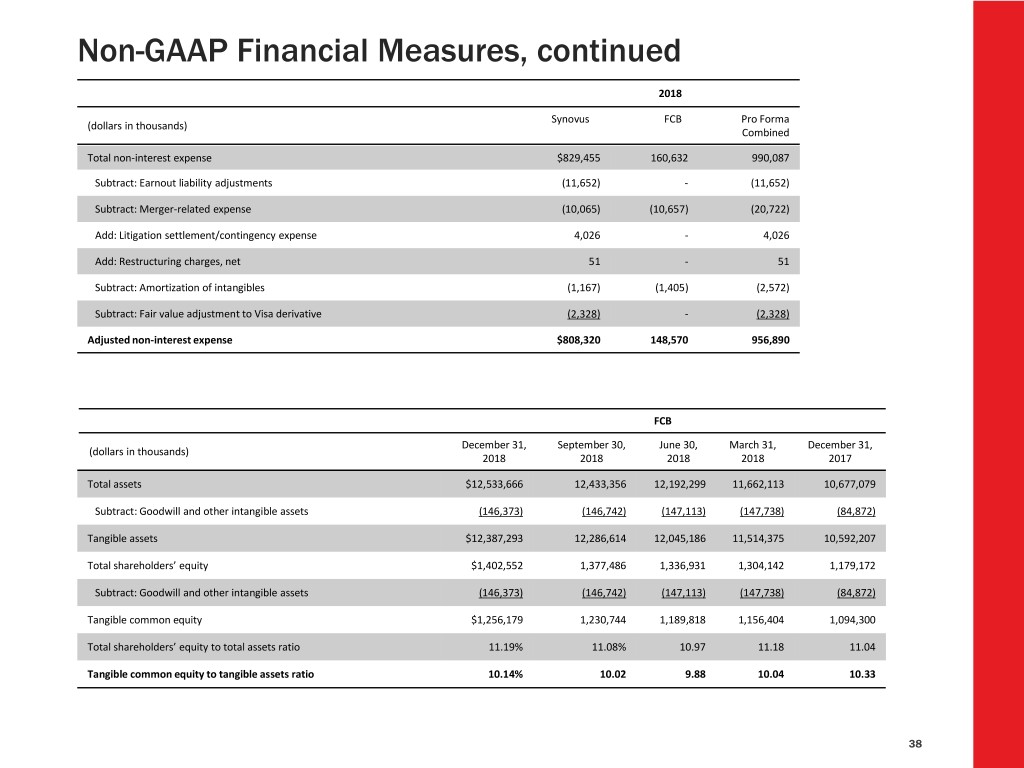
Non-GAAP Financial Measures, continued 2018 2018 Synovus FCB Pro Forma (dollars in thousands) Combined Total non-interest expense $829,455 160,632 990,087 Subtract: Earnout liability adjustments (11,652) - (11,652) Subtract: Merger-related expense (10,065) (10,657) (20,722) Add: Litigation settlement/contingency expense 4,026 - 4,026 Add: Restructuring charges, net 51 - 51 Subtract: Amortization of intangibles (1,167) (1,405) (2,572) Subtract: Fair value adjustment to Visa derivative (2,328) - (2,328) Adjusted non-interest expense $808,320 148,570 956,890 FCB December 31, September 30, June 30, March 31, December 31, (dollars in thousands) 2018 2018 2018 2018 2017 Total assets $12,533,666 12,433,356 12,192,299 11,662,113 10,677,079 Subtract: Goodwill and other intangible assets (146,373) (146,742) (147,113) (147,738) (84,872) Tangible assets $12,387,293 12,286,614 12,045,186 11,514,375 10,592,207 Total shareholders’ equity $1,402,552 1,377,486 1,336,931 1,304,142 1,179,172 Subtract: Goodwill and other intangible assets (146,373) (146,742) (147,113) (147,738) (84,872) Tangible common equity $1,256,179 1,230,744 1,189,818 1,156,404 1,094,300 Total shareholders’ equity to total assets ratio 11.19% 11.08% 10.97 11.18 11.04 Tangible common equity to tangible assets ratio 10.14% 10.02 9.88 10.04 10.33 38
