Attached files
| file | filename |
|---|---|
| 8-K - 8-K - BED BATH & BEYOND INC | form8-k1919q3fy18.htm |
| EX-99.1 - EXHIBIT 99.1 - BED BATH & BEYOND INC | exhibit991-pressreleaseq32.htm |

Exhibit 99.2 Fiscal 2018 Third Quarter Earnings Call January 9, 2019
Forward-Looking Statements This presentation may contain forward-looking statements. Many of these forward-looking statements can be identified by use of words such as may, will, expect, anticipate, approximate, estimate, assume, continue, model, project, plan, goal, and similar words and phrases. The Company’s actual results and future financial condition may differ materially from those expressed in any such forward-looking statements as a result of many factors. Such factors include, without limitation: general economic conditions including the housing market, a challenging overall macroeconomic environment and related changes in the retailing environment; consumer preferences, spending habits and adoption of new technologies; demographics and other macroeconomic factors that may impact the level of spending for the types of merchandise sold by the Company; civil disturbances and terrorist acts; unusual weather patterns and natural disasters; competition from existing and potential competitors across all channels; pricing pressures; liquidity; the ability to achieve anticipated cost savings, and to not exceed anticipated costs, associated with organizational changes and investments; the ability to attract and retain qualified employees in all areas of the organization; the cost of labor, merchandise and other costs and expenses; potential supply chain disruption due to trade restrictions, political instability, labor disturbances, product recalls, financial or operational instability of suppliers or carriers, and other items; the ability to find suitable locations at acceptable occupancy costs and other terms to support the Company’s plans for new stores; the ability to establish and profitably maintain the appropriate mix of digital and physical presence in the markets it serves; the ability to assess and implement technologies in support of the Company’s development of its omnichannel capabilities; uncertainty in financial markets; volatility in the price of the Company’s common stock and its effect, and the effect of other factors, on the Company’s capital allocation strategy; the impact of goodwill and intangible asset impairments; disruptions to the Company’s information technology systems including but not limited to security breaches of systems protecting consumer and employee information or other types of cybercrimes or cybersecurity attacks; reputational risk arising from challenges to the Company’s or a third party product or service supplier’s compliance with various laws, regulations or standards, including those related to labor, health, safety, privacy or the environment; reputational risk arising from third-party merchandise or service vendor performance in direct home delivery or assembly of product for customers; changes to statutory, regulatory and legal requirements, including without limitation proposed changes affecting international trade; changes to, or new, tax laws or interpretation of existing tax laws; new, or developments in existing, litigation, claims or assessments; changes to, or new, accounting standards; foreign currency exchange rate fluctuations; and the integration of acquired businesses. The Company does not undertake any obligation to update its forward-looking statements. 2
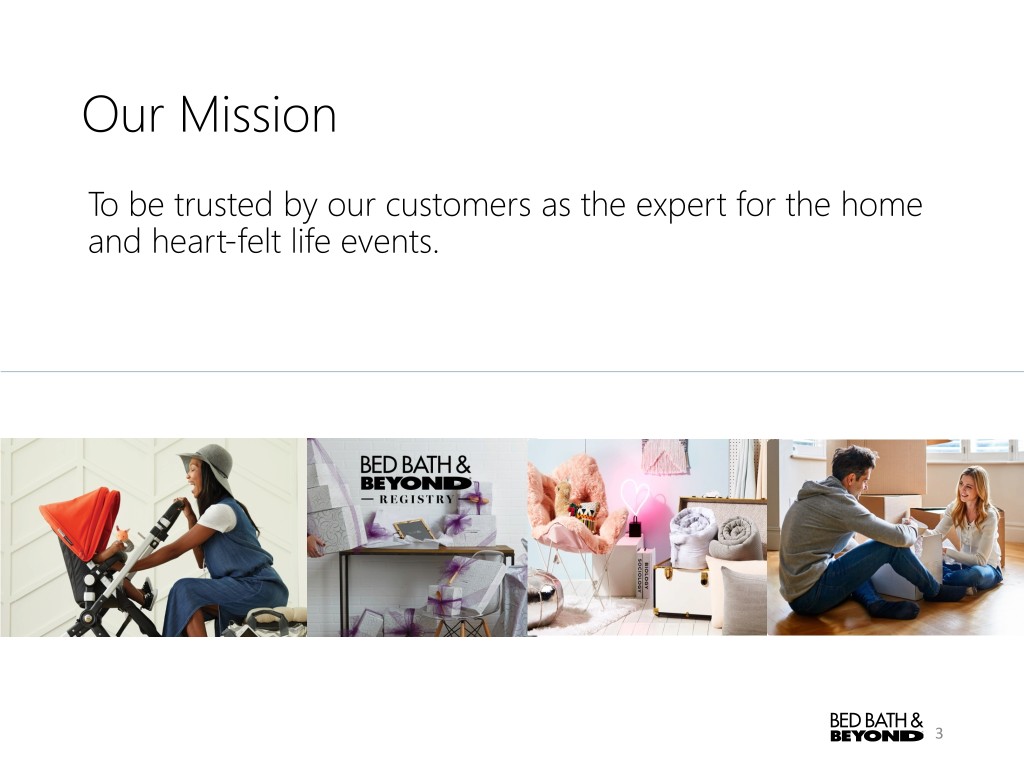
Our Mission To be trusted by our customers as the expert for the home and heart-felt life events. 3
Q3 2018 Summary • Net sales increase of approximately 2.6%, primarily due to calendar shift of post-Thanksgiving week into the third quarter and out of the fourth quarter, partially offset by actions during the quarter in support of a stronger bias towards driving profitability improvement • Comp sales decline of approximately 1.8%, including strong sales growth from customer-facing digital channels • Net earnings per diluted share of $0.18, in-line with model • Reduced retail inventories by approximately 6%, through ongoing inventory optimization strategies • Cash and investments balance of approximately $1.0 billion at December 1, 2018, nearly double the prior year period • Board of Directors declares quarterly dividend of $.16/share, payable on April 16, 2019 to shareholders of record at the close of business on March 15, 2019 4
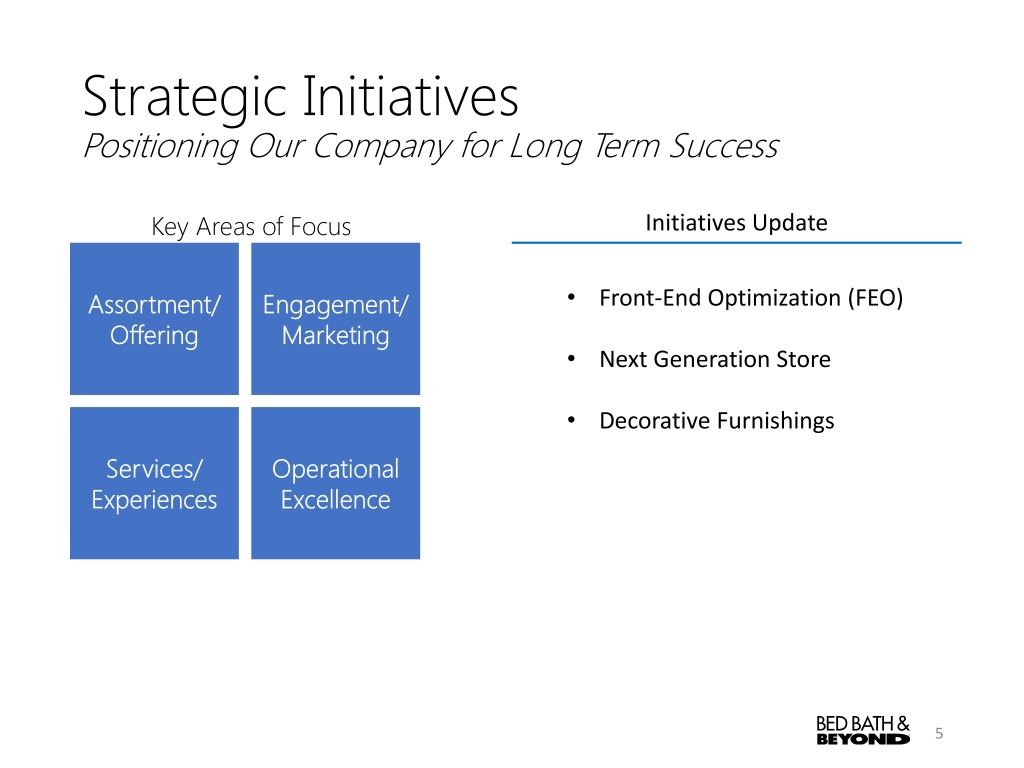
Strategic Initiatives Positioning Our Company for Long Term Success Key Areas of Focus Initiatives Update Assortment/ Engagement/ • Front-End Optimization (FEO) Offering Marketing • Next Generation Store • Decorative Furnishings Services/ Operational Experiences Excellence 5
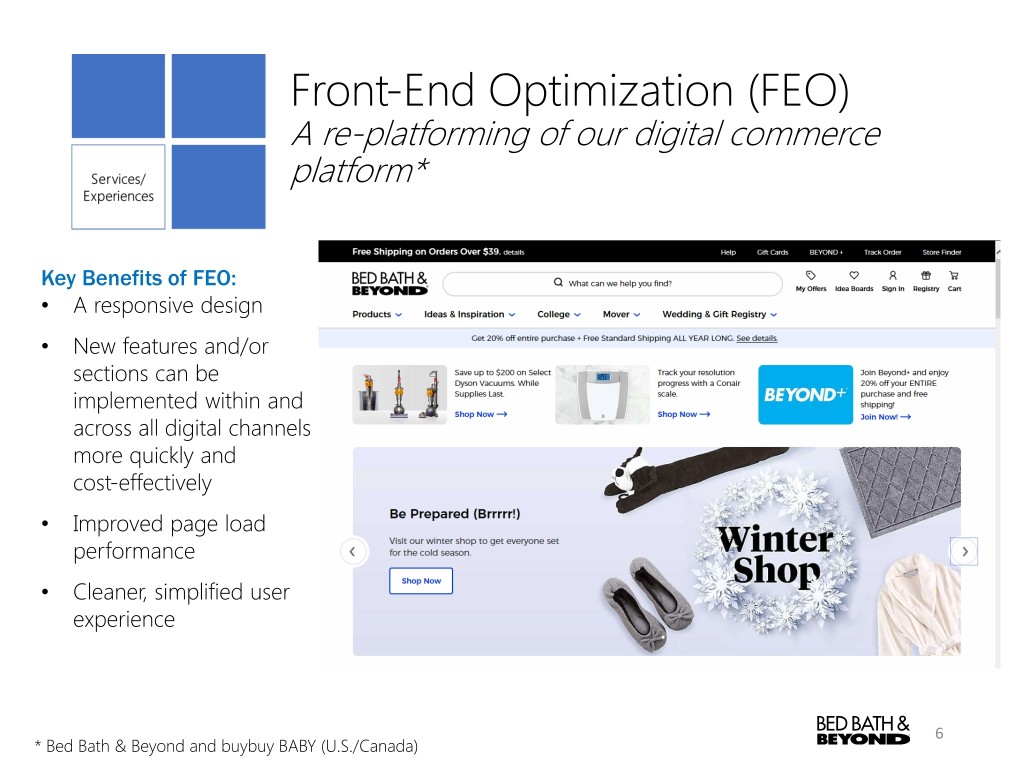
Front-End Optimization (FEO) A re-platforming of our digital commerce platform* Key Benefits of FEO: • A responsive design • New features and/or sections can be implemented within and across all digital channels more quickly and cost-effectively • Improved page load performance • Cleaner, simplified user experience 6 * Bed Bath & Beyond and buybuy BABY (U.S./Canada)
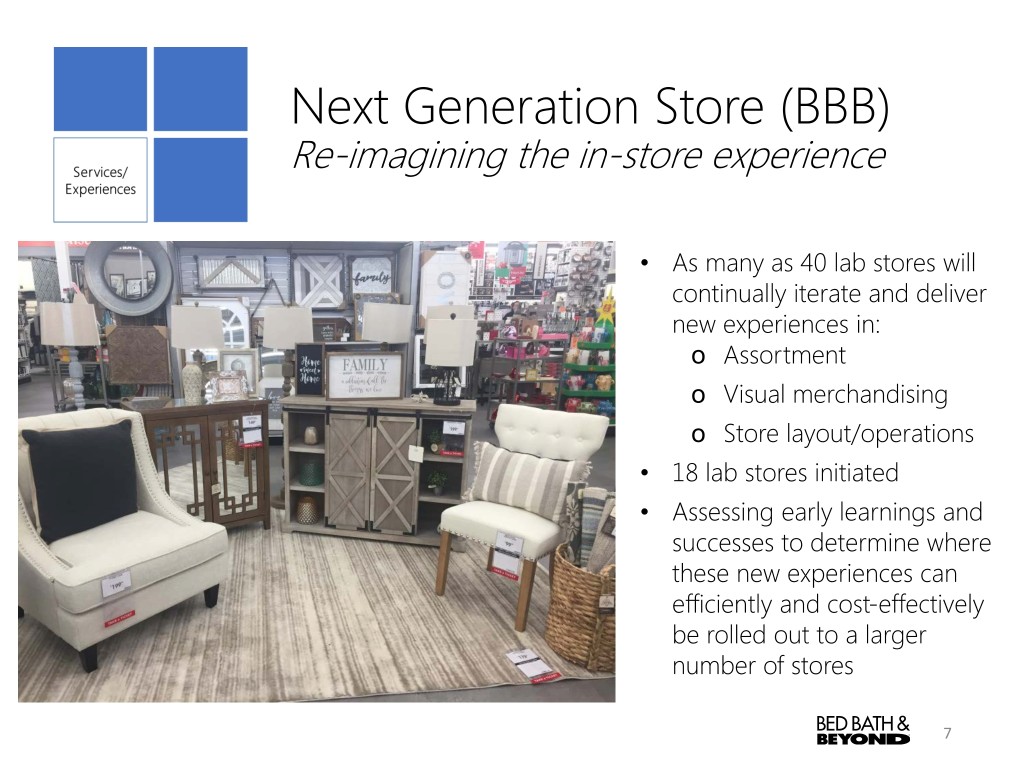
Next Generation Store (BBB) Re-imagining the in-store experience • As many as 40 lab stores will continually iterate and deliver new experiences in: o Assortment o Visual merchandising o Store layout/operations • 18 lab stores initiated • Assessing early learnings and successes to determine where these new experiences can efficiently and cost-effectively be rolled out to a larger number of stores 7

Accelerate Growth of Decorative Furnishings The Trusted Expert for Whole Home Decorating • Decorative Furnishings are being expressed in >70 BBB stores (furniture vignettes), with plans to expand to ~150 stores in 2019 • Bee & Willow Home Collection, the first of 6 in-house brands to be introduced in 2019 and 2020, includes furniture, lighting, rugs, wall décor, seasonal accessories, and more 2019 Brand Launch 8
Our Transformation Beyond 2019 • Our intent is to continue to put resources behind deepening our identity as a data-driven, analytics, and technology company • We will better represent whole home and heart-felt life events, and better inspire our customers through a more robust decorative furnishings offering and more proprietary and meaningfully differentiated product • We will further integrate our life stage businesses • We will evolve our stores so that they have cleaner sight lines, less clutter, are better cross merchandised; and our associates will be better enabled to support our customers' shopping needs • We will continue to enhance our digital experience • We will better engage with our customers through both more relatable national branding, and a greater emphasis on marketing personalization • Overall, we expect to operate fewer stores, while continuing to drive profitable digital growth, all supported by an efficient corporate structure 9
Q3 2018 Financials 10
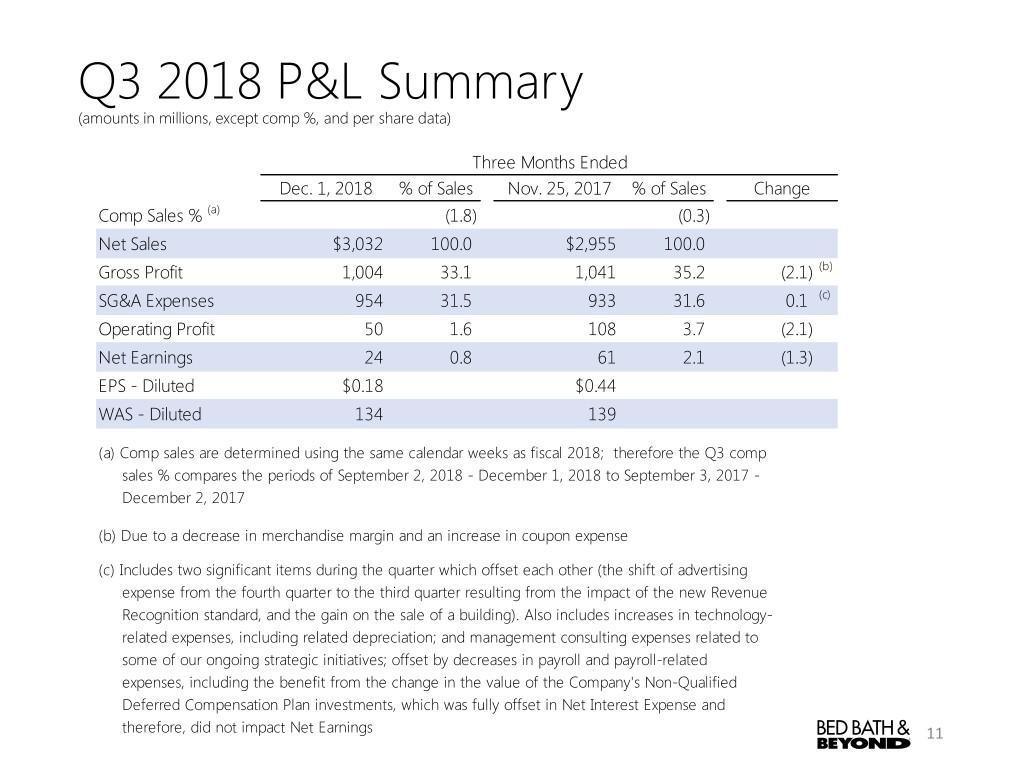
Q3 2018 P&L Summary (amounts in millions, except comp %, and per share data) Three Months Ended Dec. 1, 2018 % of Sales Nov. 25, 2017 % of Sales Change Comp Sales % (a) (1.8) (0.3) Net Sales $3,032 100.0 $2,955 100.0 Gross Profit 1,004 33.1 1,041 35.2 (2.1) (b) SG&A Expenses 954 31.5 933 31.6 0.1 (c) Operating Profit 50 1.6 108 3.7 (2.1) Net Earnings 24 0.8 61 2.1 (1.3) EPS - Diluted $0.18 $0.44 WAS - Diluted 134 139 (a) Comp sales are determined using the same calendar weeks as fiscal 2018; therefore the Q3 comp sales % compares the periods of September 2, 2018 - December 1, 2018 to September 3, 2017 - December 2, 2017 (b) Due to a decrease in merchandise margin and an increase in coupon expense (c) Includes two significant items during the quarter which offset each other (the shift of advertising expense from the fourth quarter to the third quarter resulting from the impact of the new Revenue Recognition standard, and the gain on the sale of a building). Also includes increases in technology- related expenses, including related depreciation; and management consulting expenses related to some of our ongoing strategic initiatives; offset by decreases in payroll and payroll-related expenses, including the benefit from the change in the value of the Company's Non-Qualified Deferred Compensation Plan investments, which was fully offset in Net Interest Expense and therefore, did not impact Net Earnings 11
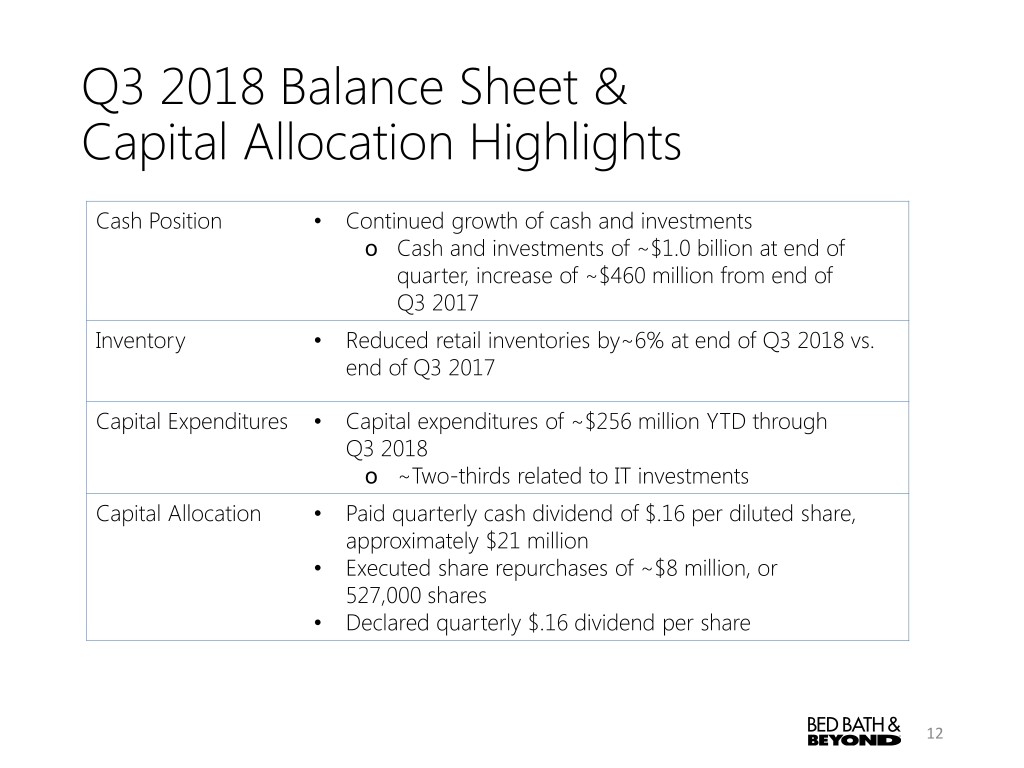
Q3 2018 Balance Sheet & Capital Allocation Highlights Cash Position • Continued growth of cash and investments o Cash and investments of ~$1.0 billion at end of quarter, increase of ~$460 million from end of Q3 2017 Inventory • Reduced retail inventories by~6% at end of Q3 2018 vs. end of Q3 2017 Capital Expenditures • Capital expenditures of ~$256 million YTD through Q3 2018 o ~Two-thirds related to IT investments Capital Allocation • Paid quarterly cash dividend of $.16 per diluted share, approximately $21 million • Executed share repurchases of ~$8 million, or 527,000 shares • Declared quarterly $.16 dividend per share 12
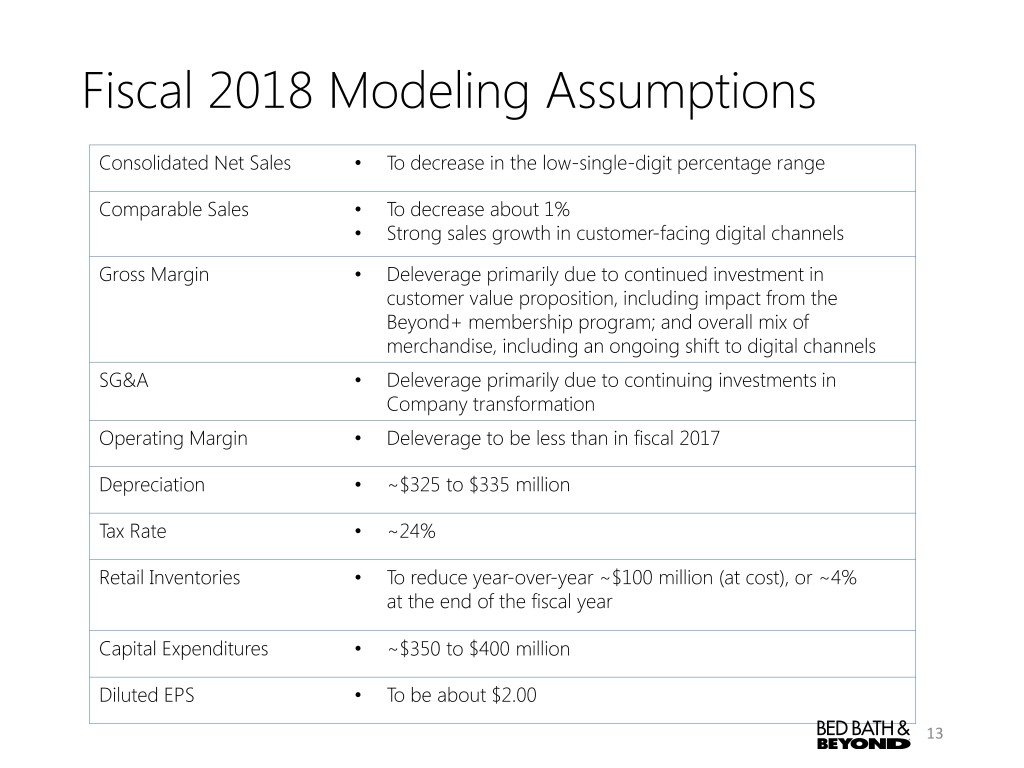
Fiscal 2018 Modeling Assumptions Consolidated Net Sales • To decrease in the low-single-digit percentage range Comparable Sales • To decrease about 1% • Strong sales growth in customer-facing digital channels Gross Margin • Deleverage primarily due to continued investment in customer value proposition, including impact from the Beyond+ membership program; and overall mix of merchandise, including an ongoing shift to digital channels SG&A • Deleverage primarily due to continuing investments in Company transformation Operating Margin • Deleverage to be less than in fiscal 2017 Depreciation • ~$325 to $335 million Tax Rate • ~24% Retail Inventories • To reduce year-over-year ~$100 million (at cost), or ~4% at the end of the fiscal year Capital Expenditures • ~$350 to $400 million Diluted EPS • To be about $2.00 13
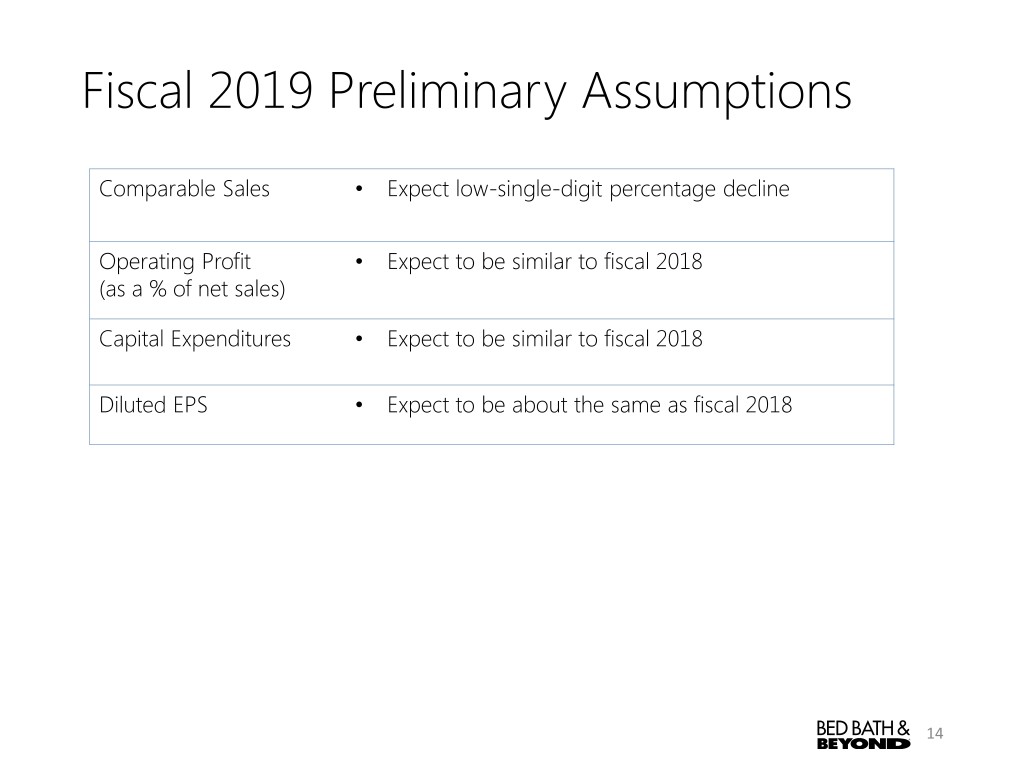
Fiscal 2019 Preliminary Assumptions Comparable Sales • Expect low-single-digit percentage decline Operating Profit • Expect to be similar to fiscal 2018 (as a % of net sales) Capital Expenditures • Expect to be similar to fiscal 2018 Diluted EPS • Expect to be about the same as fiscal 2018 14
