Attached files
| file | filename |
|---|---|
| EX-99.1 - EX-99.1 ASSET EXCHANGE PRESS RELEASE - CrossAmerica Partners LP | capl-ex991_241.htm |
| EX-2.1 - EX-2.1 ASSET EXCHANGE AGREEMENT - CrossAmerica Partners LP | capl-ex21_6.htm |
| 8-K - 8-K ASSET EXCHANGE AGREEMENT - CrossAmerica Partners LP | capl-8k_20181217.htm |
Strategic Update December 2018 Exhibit 99.2
Forward Looking Statement Statements contained in this presentation that state the Partnership’s or management’s expectations or predictions of the future are forward-looking statements. The words “believe,” “expect,” “should,” “intends,” “estimates,” “target” and other similar expressions identify forward-looking statements. It is important to note that actual results could differ materially from those projected in such forward-looking statements. For more information concerning factors that could cause actual results to differ from those expressed or forecasted, see CrossAmerica’s annual reports on Form 10-K, quarterly reports on Form 10-Q and other reports filed with the Securities and Exchange Commission and available on the Partnership’s website at www.crossamericapartners.com. If any of these factors materialize, or if our underlying assumptions prove to be incorrect, actual results may vary significantly from what we projected. Any forward-looking statement you see or hear during this presentation reflects our current views as of the date of this presentation with respect to future events. We assume no obligation to publicly update or revise these forward-looking statements for any reason, whether as a result of new information, future events, or otherwise.
CrossAmerica Asset Exchange with Circle K
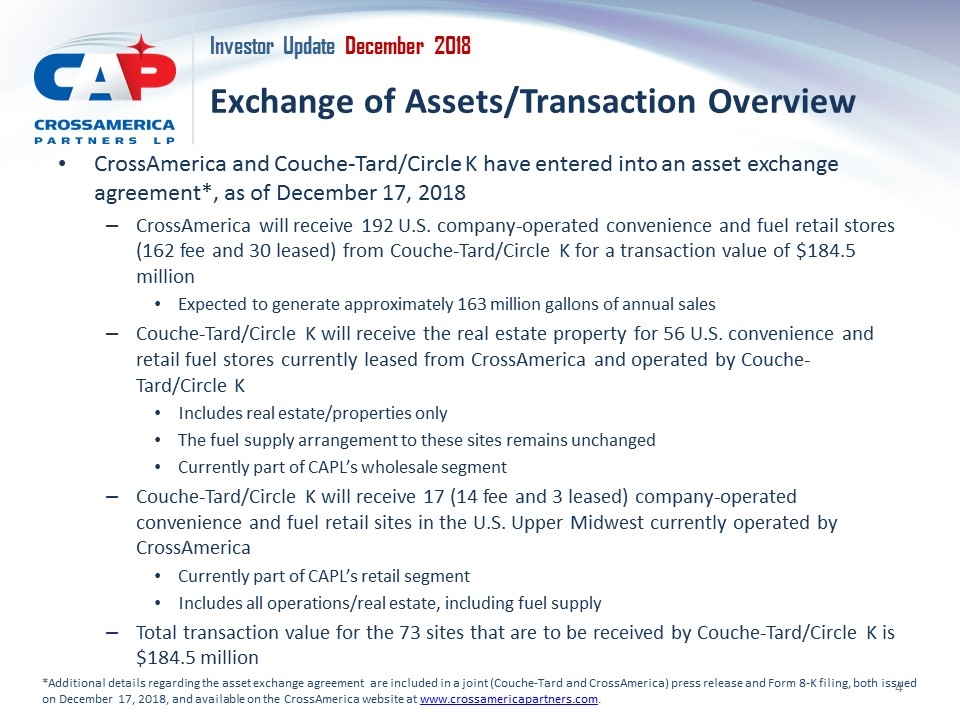
Exchange of Assets/Transaction Overview *Additional details regarding the asset exchange agreement are included in a joint (Couche-Tard and CrossAmerica) press release and Form 8-K filing, both issued on December 17, 2018, and available on the CrossAmerica website at www.crossamericapartners.com. CrossAmerica and Couche-Tard/Circle K have entered into an asset exchange agreement*, as of December 17, 2018 CrossAmerica will receive 192 U.S. company-operated convenience and fuel retail stores (162 fee and 30 leased) from Couche-Tard/Circle K for a transaction value of $184.5 million Expected to generate approximately 163 million gallons of annual sales Couche-Tard/Circle K will receive the real estate property for 56 U.S. convenience and retail fuel stores currently leased from CrossAmerica and operated by Couche-Tard/Circle K Includes real estate/properties only The fuel supply arrangement to these sites remains unchanged Currently part of CAPL’s wholesale segment Couche-Tard/Circle K will receive 17 (14 fee and 3 leased) company-operated convenience and fuel retail sites in the U.S. Upper Midwest currently operated by CrossAmerica Currently part of CAPL’s retail segment Includes all operations/real estate, including fuel supply Total transaction value for the 73 sites that are to be received by Couche-Tard/Circle K is $184.5 million
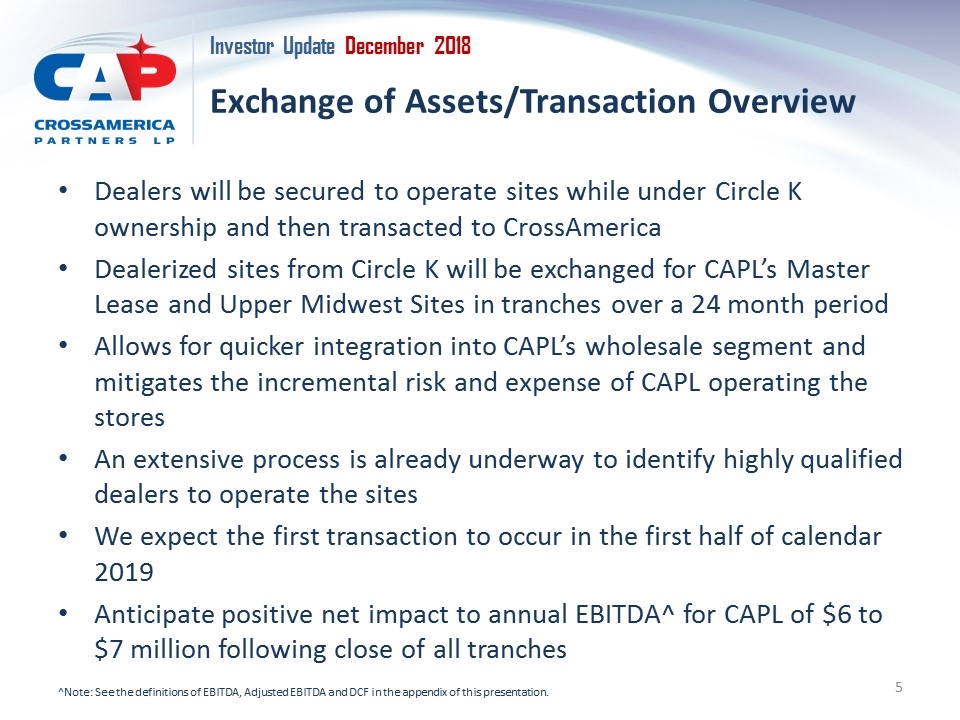
Exchange of Assets/Transaction Overview Dealers will be secured to operate sites while under Circle K ownership and then transacted to CrossAmerica Dealerized sites from Circle K will be exchanged for CAPL’s Master Lease and Upper Midwest Sites in tranches over a 24 month period Allows for quicker integration into CAPL’s wholesale segment and mitigates the incremental risk and expense of CAPL operating the stores An extensive process is already underway to identify highly qualified dealers to operate the sites We expect the first transaction to occur in the first half of calendar 2019 Anticipate positive net impact to annual EBITDA^ for CAPL of $6 to $7 million following close of all tranches ^Note: See the definitions of EBITDA, Adjusted EBITDA and DCF in the appendix of this presentation.
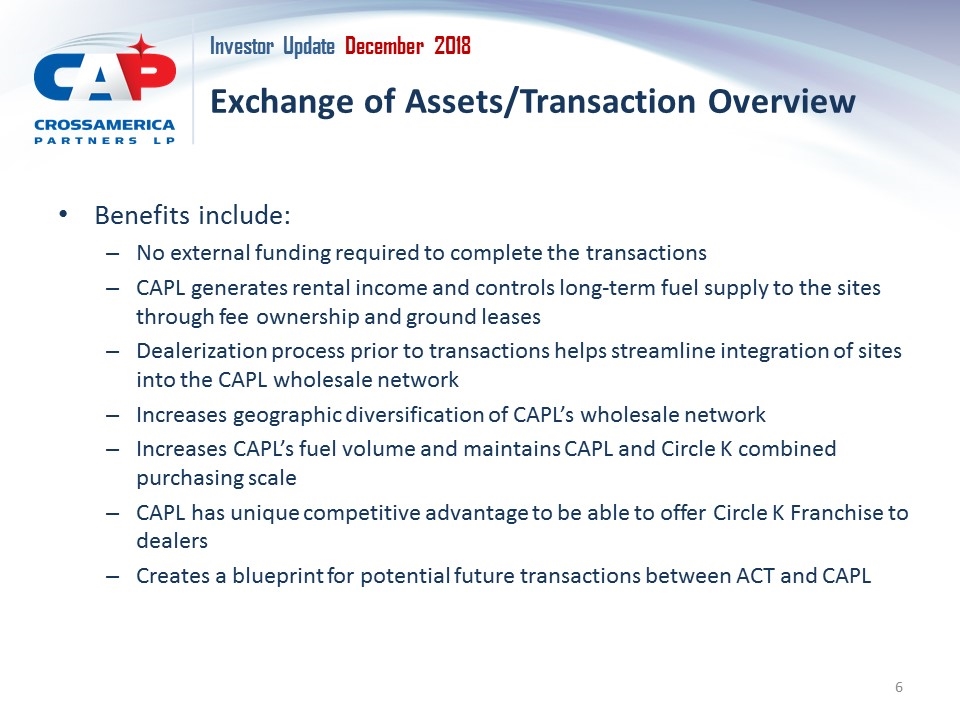
Exchange of Assets/Transaction Overview Benefits include: No external funding required to complete the transactions CAPL generates rental income and controls long-term fuel supply to the sites through fee ownership and ground leases Dealerization process prior to transactions helps streamline integration of sites into the CAPL wholesale network Increases geographic diversification of CAPL’s wholesale network Increases CAPL’s fuel volume and maintains CAPL and Circle K combined purchasing scale CAPL has unique competitive advantage to be able to offer Circle K Franchise to dealers Creates a blueprint for potential future transactions between ACT and CAPL
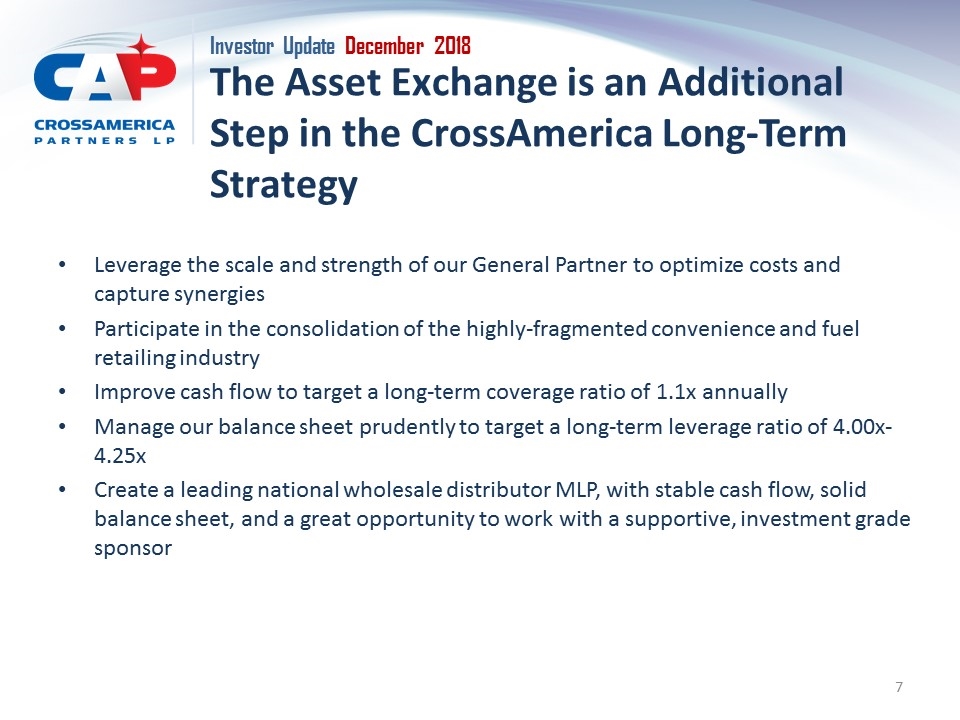
The Asset Exchange is an Additional Step in the CrossAmerica Long-Term Strategy Leverage the scale and strength of our General Partner to optimize costs and capture synergies Participate in the consolidation of the highly-fragmented convenience and fuel retailing industry Improve cash flow to target a long-term coverage ratio of 1.1x annually Manage our balance sheet prudently to target a long-term leverage ratio of 4.00x-4.25x Create a leading national wholesale distributor MLP, with stable cash flow, solid balance sheet, and a great opportunity to work with a supportive, investment grade sponsor
Appendix December 2018
Non-GAAP Financial Measures Non-GAAP Financial Measures We use non-GAAP financial measures EBITDA, Adjusted EBITDA, Distributable Cash Flow and Distribution Coverage Ratio. EBITDA represents net income available to us before deducting interest expense, income taxes and depreciation, amortization and accretion expense. Adjusted EBITDA represents EBITDA as further adjusted to exclude equity funded expenses related to incentive compensation and the Amended Omnibus Agreement, gains or losses on dispositions and lease terminations, certain acquisition related costs, such as legal and other professional fees and severance expenses associated with recently acquired companies, and certain other non-cash items arising from purchase accounting. Distributable Cash Flow represents Adjusted EBITDA less cash interest expense, sustaining capital expenditures and current income tax expense. Distribution Coverage Ratio is computed by dividing Distributable Cash Flow by the weighted average diluted common units and then dividing that result by the distributions paid per limited partner unit. EBITDA, Adjusted EBITDA, Distributable Cash Flow and Distribution Coverage Ratio are used as supplemental financial measures by management and by external users of our financial statements, such as investors and lenders. EBITDA and Adjusted EBITDA are used to assess our financial performance without regard to financing methods, capital structure or income taxes and the ability to incur and service debt and to fund capital expenditures. In addition, Adjusted EBITDA is used to assess our operating performance of our business on a consistent basis by excluding the impact of items which do not result directly from the wholesale distribution of motor fuel, the leasing of real property, or the day to day operations of our retail site activities. EBITDA, Adjusted EBITDA, Distributable Cash Flow and Distribution Coverage Ratio are also used to assess our ability to generate cash sufficient to make distributions to our unit-holders. We believe the presentation of EBITDA, Adjusted EBITDA, Distributable Cash Flow and Distribution Coverage Ratio provides useful information to investors in assessing our financial condition and results of operations. EBITDA, Adjusted EBITDA, Distributable Cash Flow and Distribution Coverage Ratio should not be considered alternatives to net income or any other measure of financial performance or liquidity presented in accordance with U.S. GAAP. EBITDA, Adjusted EBITDA, Distributable Cash Flow and Distribution Coverage Ratio have important limitations as analytical tools because they exclude some but not all items that affect net income. Additionally, because EBITDA, Adjusted EBITDA, Distributable Cash Flow and Distribution Coverage Ratio may be defined differently by other companies in our industry, our definitions may not be comparable to similarly titled measures of other companies, thereby diminishing their utility.
