Attached files
| file | filename |
|---|---|
| 8-K - 8-K INVESTOR CALL - Equitable Holdings, Inc. | eqh-8k_20181217.htm |
Investor Update Call December 17, 2018
This presentation contains forward-looking statements within the meaning of the Private Securities Litigation Reform Act of 1995. Words such as “expects,” “believes,” “anticipates,” “intends,” “seeks,” “aims,” “plans,” “assumes,” “estimates,” “projects,” “should,” “would,” “could,” “may,” “will,” “shall” or variations of such words are generally part of forward-looking statements. Forward-looking statements are made based on management’s current expectations and beliefs concerning future developments and their potential effects upon AXA Equitable Holdings, Inc. (“Holdings”) and its consolidated subsidiaries. “We,” “us” and “our” refer to Holdings and its consolidated subsidiaries, unless the context refers only to Holdings as a corporate entity. There can be no assurance that future developments affecting Holdings will be those anticipated by management. Forward-looking statements include, without limitation, all matters that are not historical facts. These forward-looking statements are not a guarantee of future performance and involve risks and uncertainties, and there are certain important factors that could cause actual results to differ, possibly materially, from expectations or estimates reflected in such forward-looking statements, including, among others: (i) conditions in the financial markets and economy, including equity market declines and volatility, interest rate fluctuations, impacts on our goodwill and changes in liquidity and access to and cost of capital; (ii) operational factors, including reliance on the payment of dividends to Holdings by its subsidiaries, indebtedness, elements of our business strategy not being effective in accomplishing our objectives, protection of confidential customer information or proprietary business information, information systems failing or being compromised and strong industry competition; (iii) credit, counterparties and investments, including counterparty default on derivative contracts, failure of financial institutions, defaults, errors or omissions by third parties and affiliates and gross unrealized losses on fixed maturity and equity securities; (iv) our reinsurance and hedging programs; (v) our products, structure and product distribution, including variable annuity guaranteed benefits features within certain of our products, complex regulation and administration of our products, variations in statutory capital requirements, financial strength and claims-paying ratings and key product distribution relationships; (vi) estimates, assumptions and valuations, including risk management policies and procedures, potential inadequacy of reserves, actual mortality, longevity and morbidity experience differing from pricing expectations or reserves, amortization of deferred acquisition costs and financial models; (vii) our Investment Management and Research segment, including fluctuations in assets under management, the industry-wide shift from actively-managed investment services to passive services and potential termination of investment advisory agreements; (viii) legal and regulatory risks, including federal and state legislation affecting financial institutions, insurance regulation and tax reform; (ix) risks related to our controlling stockholder, including conflicts of interest, waiver of corporate opportunities and costs associated with separation and rebranding; and (x) risks related to our common stock and offerings, including obligations related to being a public company, remediation of our material weaknesses and potential stock price declines due to future sales of shares by existing stockholders. Forward-looking statements should be read in conjunction with the other cautionary statements, risks, uncertainties and other factors identified in Holdings’ Form S-4 Registration Statement filed on December 6, 2018 with the U.S. Securities and Exchange Commission, including in the section entitled “Risk Factors.” Further, any forward-looking statement speaks only as of the date on which it is made, and we undertake no obligation to update or revise any forward-looking statement to reflect events or circumstances after the date on which the statement is made or to reflect the occurrence of unanticipated events, except as otherwise may be required by law. This presentation and certain of the remarks made orally contain non-GAAP financial measures. Non-GAAP financial measures include Non-GAAP Operating Earnings, Pro Forma Non-GAAP Operating ROE and Non-GAAP Operating ROC by Segment. Information regarding these and other non-GAAP financial measures, including reconciliations to the most directly comparable GAAP financial measures, is provided in our quarterly earnings press releases and in our quarterly financial supplements, which are available on our Investor Relations website at ir.axaequitableholdings.com. Note Regarding Forward-Looking and Non-GAAP Financial Measures | Investor Update Call
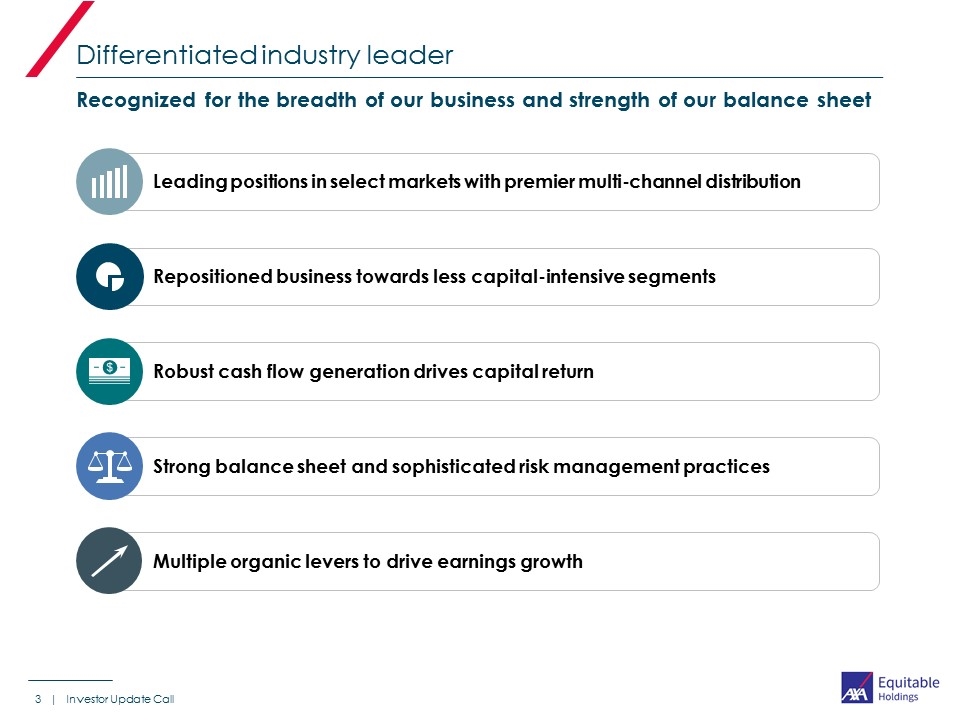
Differentiated industry leader | Investor Update Call Recognized for the breadth of our business and strength of our balance sheet Leading positions in select markets with premier multi-channel distribution Repositioned business towards less capital-intensive segments Robust cash flow generation drives capital return Strong balance sheet and sophisticated risk management practices Multiple organic levers to drive earnings growth
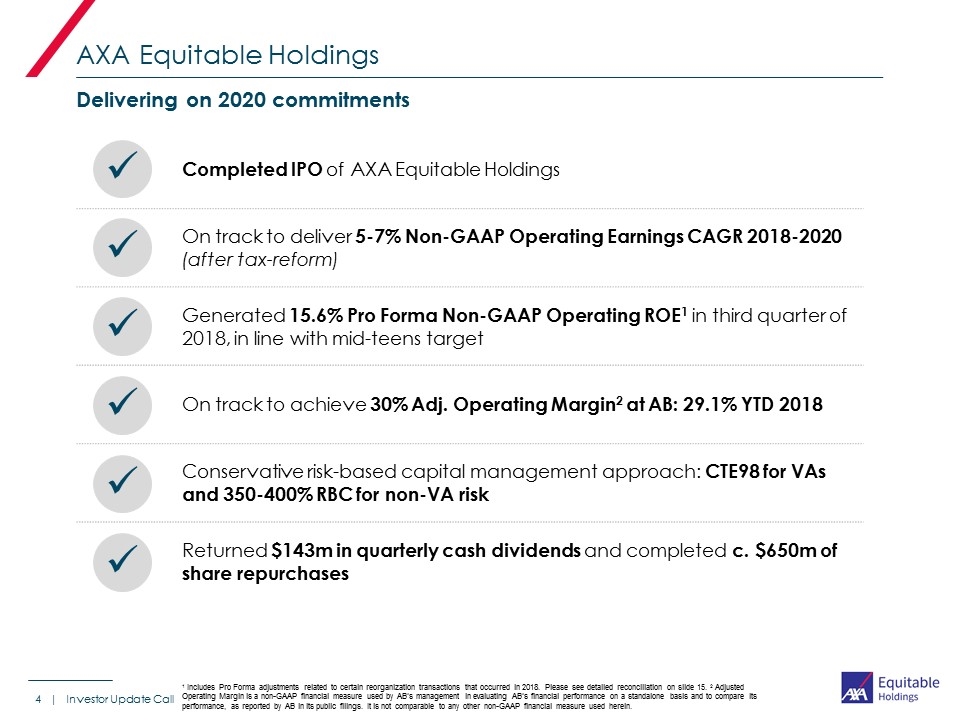
ü AXA Equitable Holdings | Investor Update Call Delivering on 2020 commitments ü ü ü ü ü Completed IPO of AXA Equitable Holdings On track to deliver 5-7% Non-GAAP Operating Earnings CAGR 2018-2020 (after tax-reform) Generated 15.6% Pro Forma Non-GAAP Operating ROE1 in third quarter of 2018, in line with mid-teens target On track to achieve 30% Adj. Operating Margin2 at AB: 29.1% YTD 2018 Conservative risk-based capital management approach: CTE98 for VAs and 350-400% RBC for non-VA risk Returned $143m in quarterly cash dividends and completed c. $650m of share repurchases 1 Includes Pro Forma adjustments related to certain reorganization transactions that occurred in 2018. Please see detailed reconciliation on slide 15. 2 Adjusted Operating Margin is a non-GAAP financial measure used by AB’s management in evaluating AB’s financial performance on a standalone basis and to compare its performance, as reported by AB in its public filings. It is not comparable to any other non-GAAP financial measure used herein.
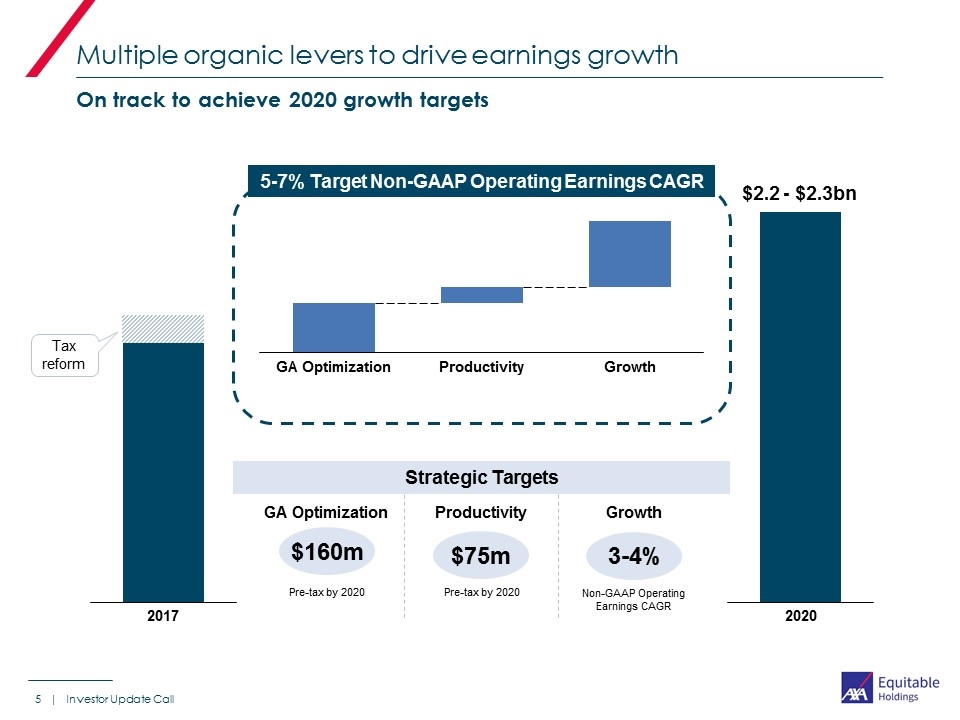
On track to achieve 2020 growth targets Multiple organic levers to drive earnings growth | Investor Update Call 5-7% Target Non-GAAP Operating Earnings CAGR Tax reform $160m $75m 3-4% Pre-tax by 2020 Pre-tax by 2020 Non-GAAP Operating Earnings CAGR Strategic Targets Productivity Growth $2.2 - $2.3bn
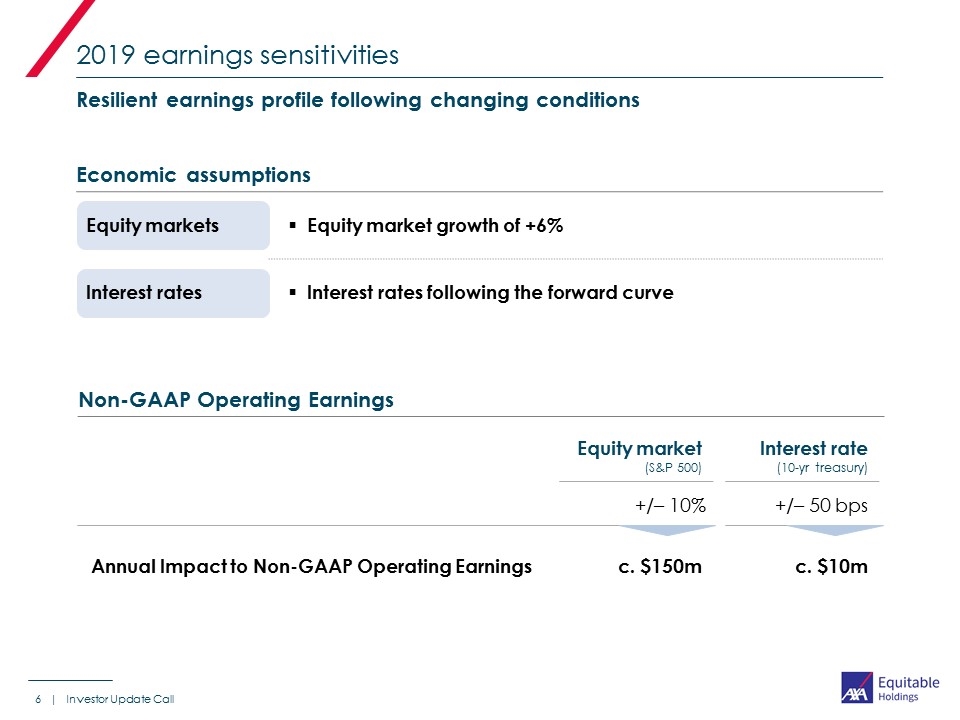
2019 earnings sensitivities | Investor Update Call Interest rate (10-yr treasury) Equity market (S&P 500) +/– 50 bps +/– 10% Annual Impact to Non-GAAP Operating Earnings c. $150m c. $10m Non-GAAP Operating Earnings Resilient earnings profile following changing conditions Economic assumptions Equity markets Equity market growth of +6% Interest rates Interest rates following the forward curve
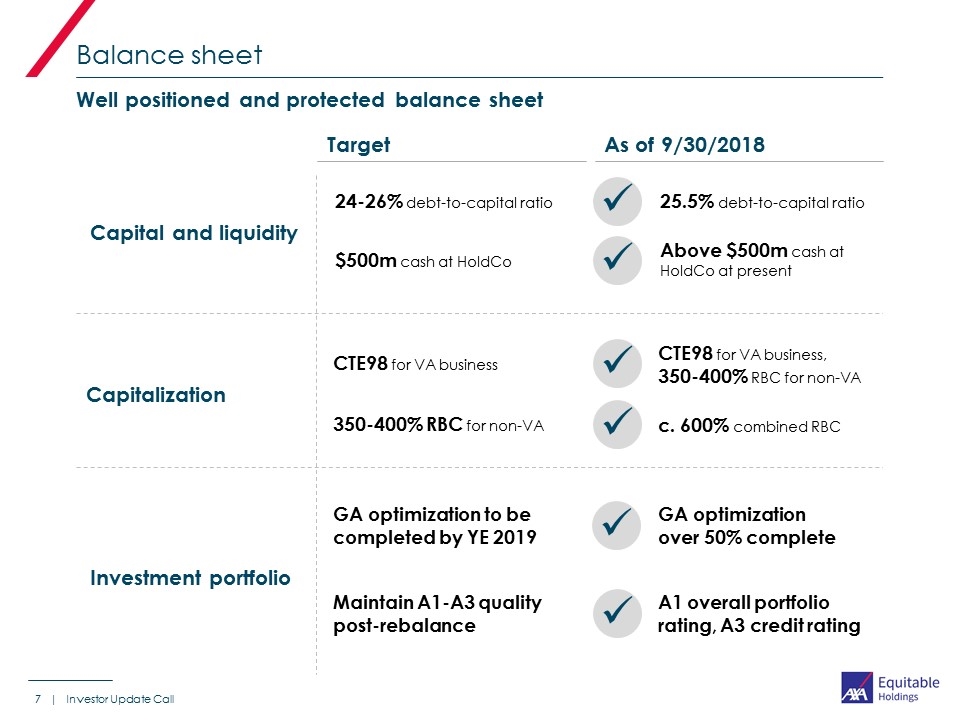
Balance sheet | Investor Update Call Capital and liquidity ü ü Capitalization ü ü Investment portfolio ü Above $500m cash at HoldCo at present 25.5% debt-to-capital ratio c. 600% combined RBC CTE98 for VA business, 350-400% RBC for non-VA As of 9/30/2018 A1 overall portfolio rating, A3 credit rating ü GA optimization over 50% complete Well positioned and protected balance sheet $500m cash at HoldCo 24-26% debt-to-capital ratio 350-400% RBC for non-VA CTE98 for VA business Maintain A1-A3 quality post-rebalance Target GA optimization to be completed by YE 2019
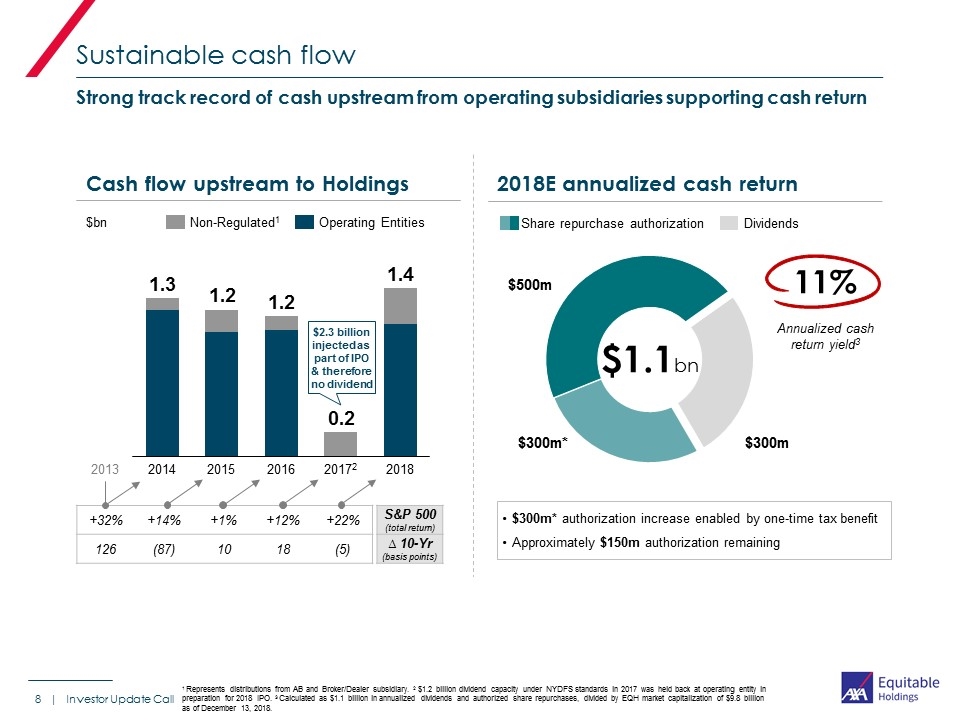
Sustainable cash flow | Investor Update Call Cash flow upstream to Holdings 1.3 2 0.2 1.2 1.2 1.4 1 $bn 1 Represents distributions from AB and Broker/Dealer subsidiary. 2 $1.2 billion dividend capacity under NYDFS standards in 2017 was held back at operating entity in preparation for 2018 IPO. 3 Calculated as $1.1 billion in annualized dividends and authorized share repurchases, divided by EQH market capitalization of $9.8 billion as of December 13, 2018. 2018E annualized cash return $1.1bn 11% Annualized cash return yield3 +32% +14% +1% +12% +22% 126 (87) 10 18 (5) S&P 500 (total return) ∆ 10-Yr (basis points) 2013 Strong track record of cash upstream from operating subsidiaries supporting cash return $300m* authorization increase enabled by one-time tax benefit Approximately $150m authorization remaining $500m $300m* Share repurchase authorization Dividends $300m $2.3 billion injected as part of IPO & therefore no dividend
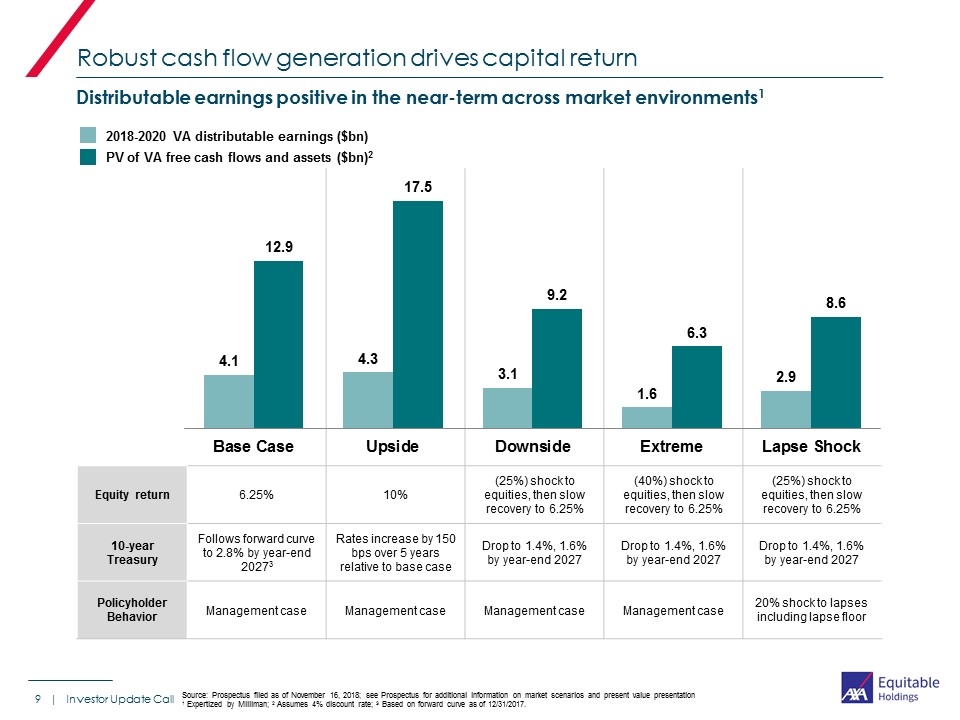
| Distributable earnings positive in the near-term across market environments1 2018-2020 VA distributable earnings ($bn) PV of VA free cash flows and assets ($bn)2 Equity return 6.25% 10% (25%) shock to equities, then slow recovery to 6.25% (40%) shock to equities, then slow recovery to 6.25% (25%) shock to equities, then slow recovery to 6.25% 10-year Treasury Follows forward curve to 2.8% by year-end 20273 Rates increase by 150 bps over 5 years relative to base case Drop to 1.4%, 1.6% by year-end 2027 Drop to 1.4%, 1.6% by year-end 2027 Drop to 1.4%, 1.6% by year-end 2027 Policyholder Behavior Management case Management case Management case Management case 20% shock to lapses including lapse floor Source: Prospectus filed as of November 16, 2018; see Prospectus for additional information on market scenarios and present value presentation 1 Expertized by Milliman; 2 Assumes 4% discount rate; 3 Based on forward curve as of 12/31/2017. Robust cash flow generation drives capital return Investor Update Call
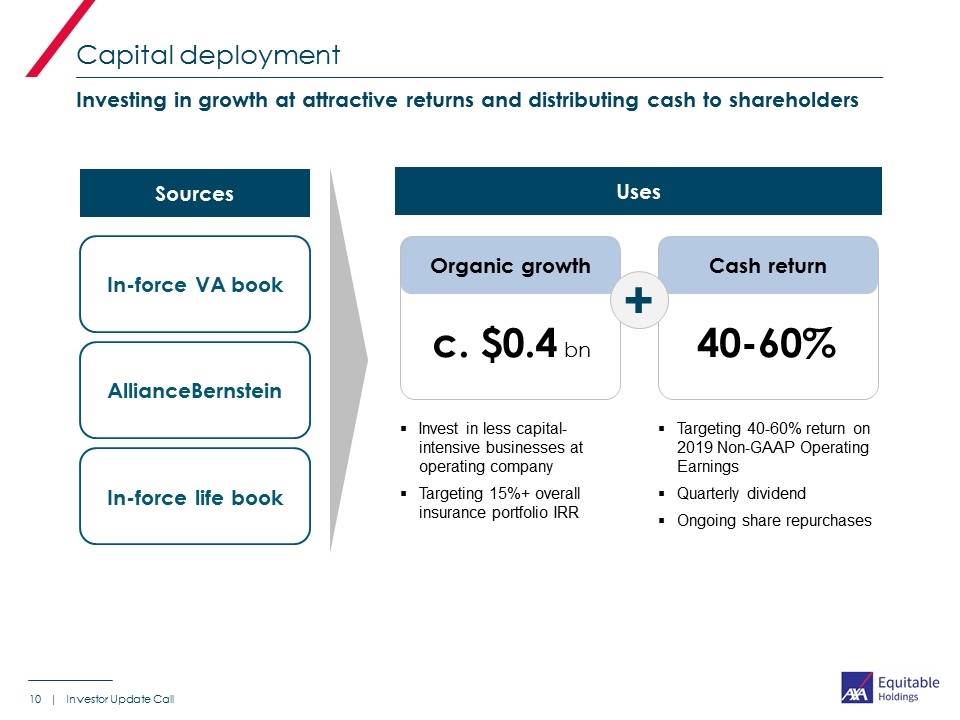
Capital deployment | Investor Update Call Cash return Organic growth Invest in less capital-intensive businesses at operating company Targeting 15%+ overall insurance portfolio IRR Targeting 40-60% return on 2019 Non-GAAP Operating Earnings Quarterly dividend Ongoing share repurchases + c. $0.4 bn 40-60% Investing in growth at attractive returns and distributing cash to shareholders Sources In-force VA book AllianceBernstein In-force life book Uses
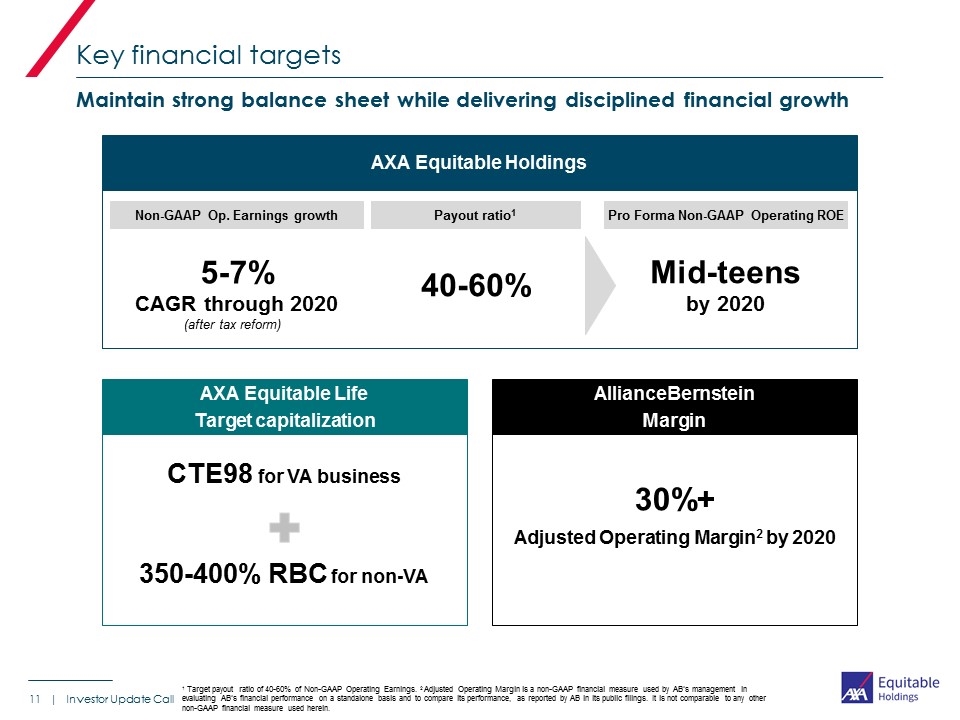
Key financial targets | Investor Update Call Maintain strong balance sheet while delivering disciplined financial growth AXA Equitable Holdings AXA Equitable Life Target capitalization AllianceBernstein Margin 350-400% RBC for non-VA 30%+ Adjusted Operating Margin2 by 2020 CTE98 for VA business 5-7% CAGR through 2020 Non-GAAP Op. Earnings growth Mid-teens by 2020 Pro Forma Non-GAAP Operating ROE 40-60% Payout ratio1 (after tax reform) 1 Target payout ratio of 40-60% of Non-GAAP Operating Earnings. 2 Adjusted Operating Margin is a non-GAAP financial measure used by AB’s management in evaluating AB’s financial performance on a standalone basis and to compare its performance, as reported by AB in its public filings. It is not comparable to any other non-GAAP financial measure used herein.
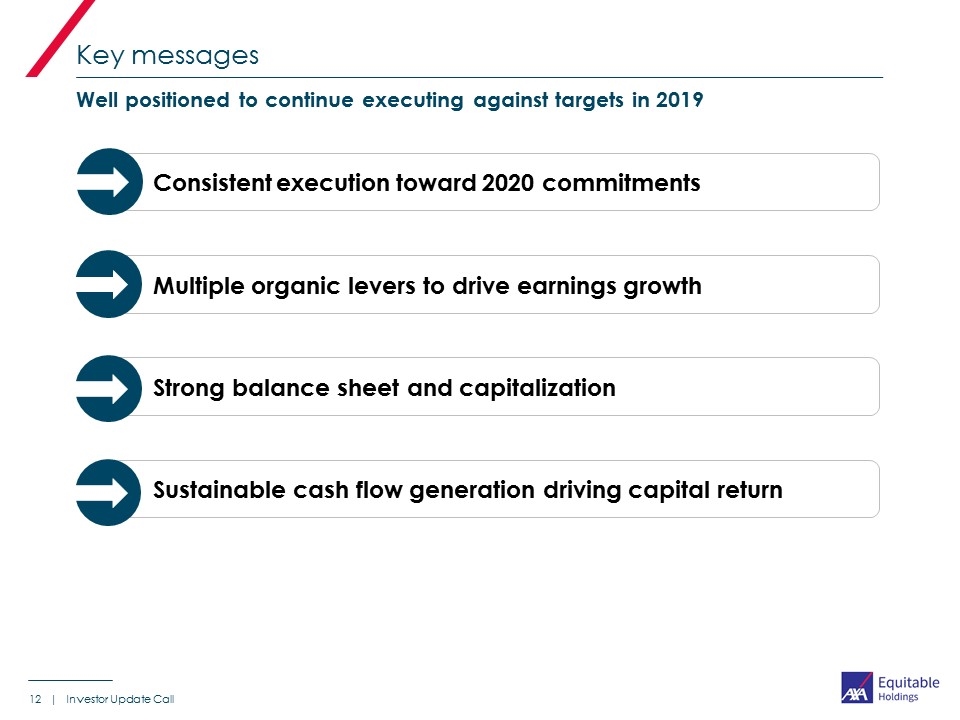
Key messages | Investor Update Call Multiple organic levers to drive earnings growth Sustainable cash flow generation driving capital return Strong balance sheet and capitalization Consistent execution toward 2020 commitments Well positioned to continue executing against targets in 2019
Investor Update Call Appendix December 17, 2018
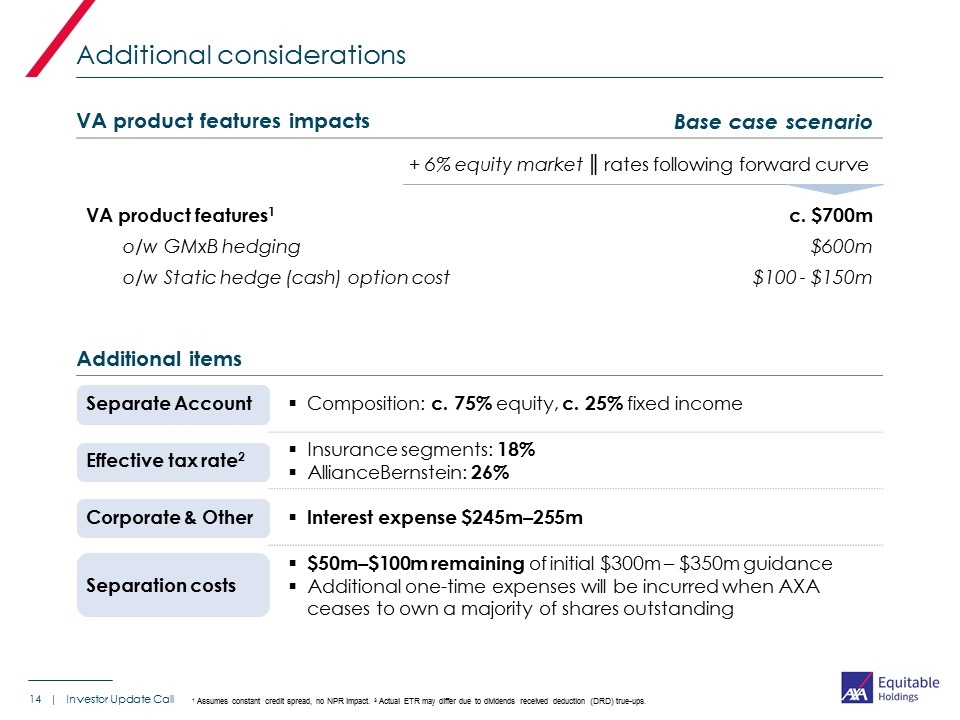
Additional considerations | Investor Update Call Additional items Separate Account Composition: c. 75% equity, c. 25% fixed income Effective tax rate2 Insurance segments: 18% AllianceBernstein: 26% Corporate & Other Interest expense $245m–255m Separation costs $50m–$100m remaining of initial $300m – $350m guidance Additional one-time expenses will be incurred when AXA ceases to own a majority of shares outstanding VA product features impacts Base case scenario + 6% equity market ║ rates following forward curve VA product features1 c. $700m o/w GMxB hedging o/w Static hedge (cash) option cost $600m $100 - $150m 1 Assumes constant credit spread, no NPR impact. 3 Actual ETR may differ due to dividends received deduction (DRD) true-ups.
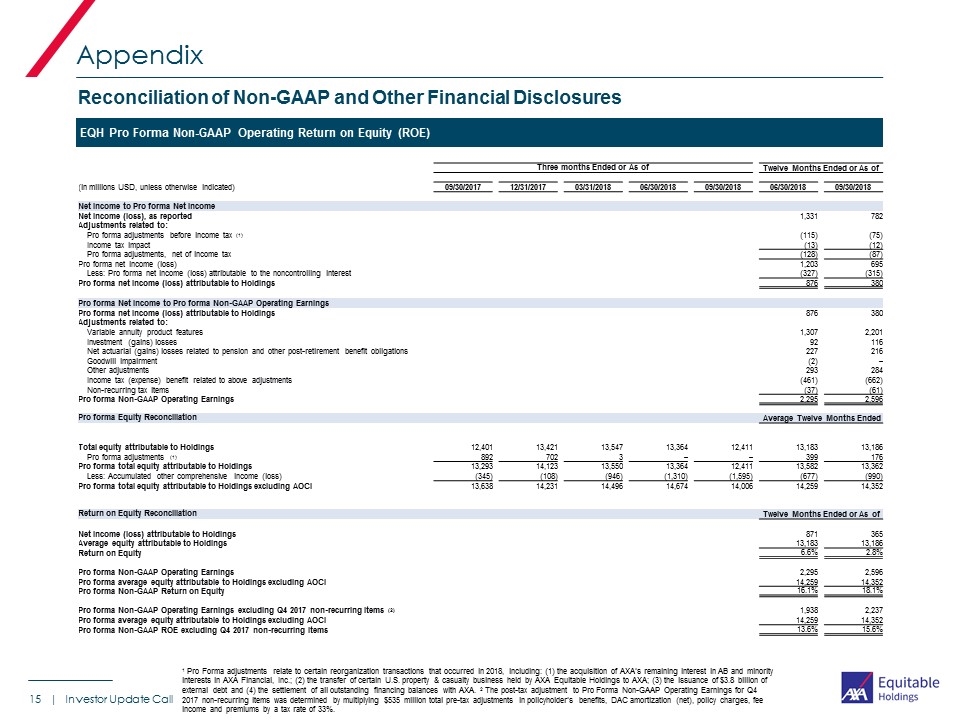
Investor Update Call | Appendix EQH Pro Forma Non-GAAP Operating Return on Equity (ROE) Reconciliation of Non-GAAP and Other Financial Disclosures 1 Pro Forma adjustments relate to certain reorganization transactions that occurred in 2018, including: (1) the acquisition of AXA’s remaining interest in AB and minority interests in AXA Financial, Inc.; (2) the transfer of certain U.S. property & casualty business held by AXA Equitable Holdings to AXA; (3) the issuance of $3.8 billion of external debt and (4) the settlement of all outstanding financing balances with AXA. 2 The post-tax adjustment to Pro Forma Non-GAAP Operating Earnings for Q4 2017 non-recurring items was determined by multiplying $535 million total pre-tax adjustments in policyholder’s benefits, DAC amortization (net), policy charges, fee income and premiums by a tax rate of 33%. Three months Ended or As of Twelve Months Ended or As of (in millions USD, unless otherwise indicated) 09/30/2017 12/31/2017 03/31/2018 06/30/2018 09/30/2018 06/30/2018 09/30/2018 Net Income to Pro forma Net Income Net income (loss), as reported 1,331 782 Adjustments related to: Pro forma adjustments before income tax (1) (115) (75) Income tax impact (13) (12) Pro forma adjustments, net of income tax (128) (87) Pro forma net income (loss) 1,203 695 Less: Pro forma net income (loss) attributable to the noncontrolling interest (327) (315) Pro forma net income (loss) attributable to Holdings 876 380 Pro forma Net Income to Pro forma Non-GAAP Operating Earnings Pro forma net income (loss) attributable to Holdings 876 380 Adjustments related to: Variable annuity product features 1,307 2,201 Investment (gains) losses 92 116 Net actuarial (gains) losses related to pension and other post-retirement benefit obligations 227 216 Goodwill impairment (2) – Other adjustments 293 284 Income tax (expense) benefit related to above adjustments (461) (662) Non-recurring tax items (37) (61) Pro forma Non-GAAP Operating Earnings 2,295 2,596 Pro forma Equity Reconciliation Average Twelve Months Ended Total equity attributable to Holdings 12,401 13,421 13,547 13,364 12,411 13,183 13,186 Pro forma adjustments (1) 892 702 3 – – 399 176 Pro forma total equity attributable to Holdings 13,293 14,123 13,550 13,364 12,411 13,582 13,362 Less: Accumulated other comprehensive income (loss) (345) (108) (946) (1,310) (1,595) (677) (990) Pro forma total equity attributable to Holdings excluding AOCI 13,638 14,231 14,496 14,674 14,006 14,259 14,352 Return on Equity Reconciliation Twelve Months Ended or As of Net income (loss) attributable to Holdings 871 365 Average equity attributable to Holdings 13,183 13,186 Return on Equity 6.6% 2.8% Pro forma Non-GAAP Operating Earnings 2,295 2,596 Pro forma average equity attributable to Holdings excluding AOCI 14,259 14,352 Pro forma Non-GAAP Return on Equity 16.1% 18.1% Pro forma Non-GAAP Operating Earnings excluding Q4 2017 non-recurring items (2) 1,938 2,237 Pro forma average equity attributable to Holdings excluding AOCI 14,259 14,352 Pro forma Non-GAAP ROE excluding Q4 2017 non-recurring items 13.6% 15.6%
