Attached files
| file | filename |
|---|---|
| 8-K - 8-K - Delek Logistics Partners, LP | dkl-8kxinvestorpresentatio.htm |
EX 99.1 Investor Presentation Delek Logistics December 2018
Disclaimers Forward Looking Statements: These slides and any accompanying oral and written presentations contain forward-looking statements by Delek Logistics Partners, LP (defined as “we”, “our”, “DKL” or “Delek Logistics”) that are based upon our current expectations and involve a number of risks and uncertainties. Statements concerning current estimates, expectations and projections about our future results, performance, prospects and opportunities and other statements, concerns, or matters that are not historical facts are "forward-looking statements," as that term is defined under United States securities laws. Investors are cautioned that the following important factors, among others, may affect these forward-looking statements: our substantial dependence on Delek US Holdings, Inc. (“Delek US” or “DK”) (NYSE: DK) or its assignees and their respective ability to pay us under our commercial agreements; the age and condition of our assets and operating hazards and other risks incidental to transporting, storing and gathering crude oil, and intermediate and refined products including, without limitation, costs, penalties, regulatory or legal actions and other effects related to releases, spills and tank failures; the timing and extent of changes in commodity prices and demand for refined products; the suspension, reduction or termination of Delek US's or its assignees' or any third-party's obligations under our commercial agreements; the results of our investments in joint ventures; the ability to secure commercial agreements with Delek US or third parties upon expiration of existing agreements; an inability of Delek US to grow as expected and realize the synergies and the other expected benefits of its merger with Alon USA Energy, Inc. (“Alon USA”) and Alon USA Partners, LP; as it relates to our potential future growth opportunities, including dropdowns, and other potential benefits, the ability to successfully integrate the businesses of Delek US and Alon USA; our ability to make third party acquisitions and successfully integrate acquired businesses; the ability to close the pipeline joint venture; adverse changes in laws including with respect to tax and regulatory matters; and other factors discussed in our filings with the United States Securities and Exchange Commission. Forward looking statements include, but are not limited to, statements regarding: distributions per LP unit growth; growth, financial strength, refining capacity, flexibility, strategic positioning and crude access of our sponsor; growth of Permian Basin production, production economics and efficiencies, takeaway capacities, access thereto by our sponsor and our ability to benefit therefrom; growth, dropdowns and organic projects including the amount and value thereof, EBITDA therefrom and our ability to successfully complete such transactions; contractual arrangements with our sponsor or others and their terms, fees and volumes; improved performance, financial flexibility, coverage and leverage; our joint venture projects including the growth, benefits, operations and risks thereof; our pipelines including current or future demand, capacity, tariffs, growth and profitability; and benefits to our wholesale business from Permian activity or otherwise. Words such as "may," "will," "should," "could," "would," "predicts," "potential," "continue," "expects," "anticipates," "future," "intends," "plans," "believes," "estimates," "appears," "projects" and similar expressions, as well as statements in future tense, identify forward-looking statements. Forward-looking statements should not be read as a guarantee of future performance or results and will not be accurate indications of the times at, or by which such performance or results will be achieved. Forward-looking information is based on information available at the time and/or management's good faith belief with respect to future events, and is subject to risks and uncertainties that could cause actual performance or results to differ materially from those expressed in the statements. We undertake no obligation to update or revise any such forward-looking statements. Non-GAAP Disclosures: Delek Logistics believes that the presentation of earnings before interest, taxes, depreciation and amortization (“EBITDA”), forecasted annualized EBITDA, distributable cash flow and distribution coverage ratio provides useful information to investors in assessing its financial condition, its results of operations and cash flow its business is generating. Distributable cash flow is calculated as net cash flow from operating activities plus or minus changes in assets and liabilities, less maintenance capital expenditures net of reimbursements and other adjustments not expected to settle in cash. EBITDA, distributable cash flow and distribution coverage ratio should not be considered in isolation or as alternatives to net income, operating income, cash from operations or any other measure of financial performance or liquidity presented in accordance with U.S. GAAP. EBITDA, distributable cash flow and distribution coverage ratio have important limitations as analytical tools because they exclude some, but not all, items that affect net income and net cash provided by operating activities. Additionally, because EBITDA and distributable cash flow may be defined differently by other partnerships in its industry, Delek Logistics' definitions may not be comparable to similarly titled measures of other partnerships, thereby diminishing their utility. Please see reconciliations of EBITDA and distributable cash flow to their most directly comparable financial measures calculated and presented in accordance with U.S. GAAP in the appendix. 2
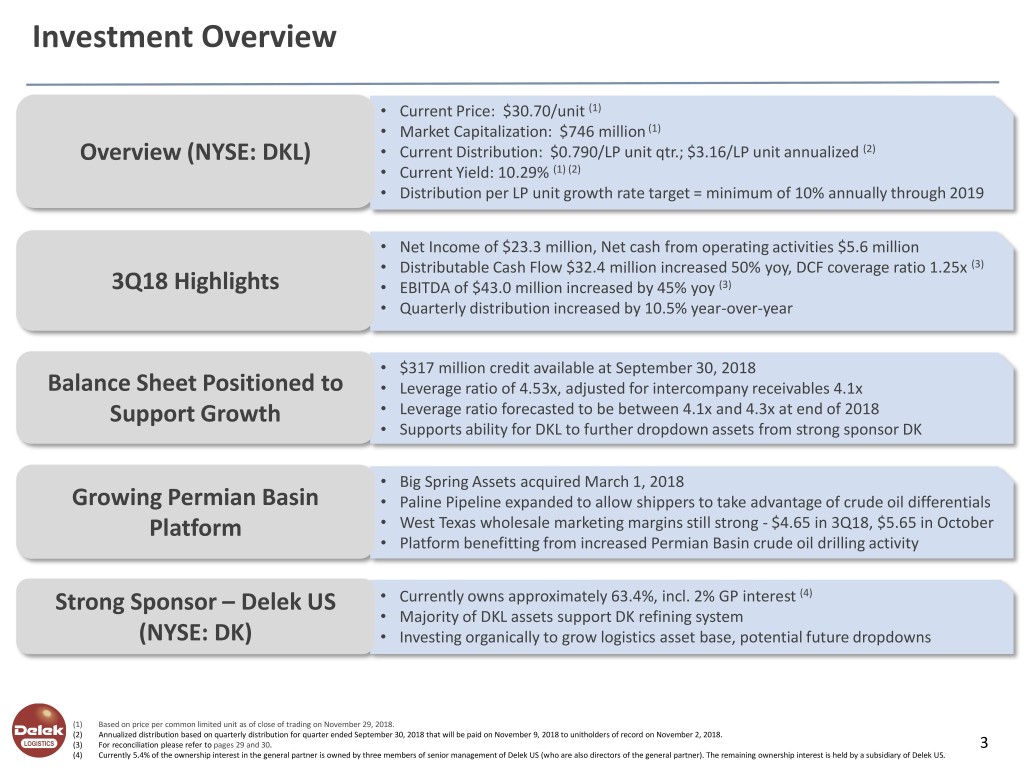
Investment Overview • Current Price: $30.70/unit (1) • Market Capitalization: $746 million (1) Overview (NYSE: DKL) • Current Distribution: $0.790/LP unit qtr.; $3.16/LP unit annualized (2) • Current Yield: 10.29% (1) (2) • Distribution per LP unit growth rate target = minimum of 10% annually through 2019 • Net Income of $23.3 million, Net cash from operating activities $5.6 million • Distributable Cash Flow $32.4 million increased 50% yoy, DCF coverage ratio 1.25x (3) 3Q18 Highlights • EBITDA of $43.0 million increased by 45% yoy (3) • Quarterly distribution increased by 10.5% year-over-year • $317 million credit available at September 30, 2018 Balance Sheet Positioned to • Leverage ratio of 4.53x, adjusted for intercompany receivables 4.1x Support Growth • Leverage ratio forecasted to be between 4.1x and 4.3x at end of 2018 • Supports ability for DKL to further dropdown assets from strong sponsor DK • Big Spring Assets acquired March 1, 2018 Growing Permian Basin • Paline Pipeline expanded to allow shippers to take advantage of crude oil differentials Platform • West Texas wholesale marketing margins still strong - $4.65 in 3Q18, $5.65 in October • Platform benefitting from increased Permian Basin crude oil drilling activity Strong Sponsor – Delek US • Currently owns approximately 63.4%, incl. 2% GP interest (4) • Majority of DKL assets support DK refining system (NYSE: DK) • Investing organically to grow logistics asset base, potential future dropdowns (1) Based on price per common limited unit as of close of trading on November 29, 2018. (2) Annualized distribution based on quarterly distribution for quarter ended September 30, 2018 that will be paid on November 9, 2018 to unitholders of record on November 2, 2018. (3) For reconciliation please refer to pages 29 and 30. 3 (4) Currently 5.4% of the ownership interest in the general partner is owned by three members of senior management of Delek US (who are also directors of the general partner). The remaining ownership interest is held by a subsidiary of Delek US.
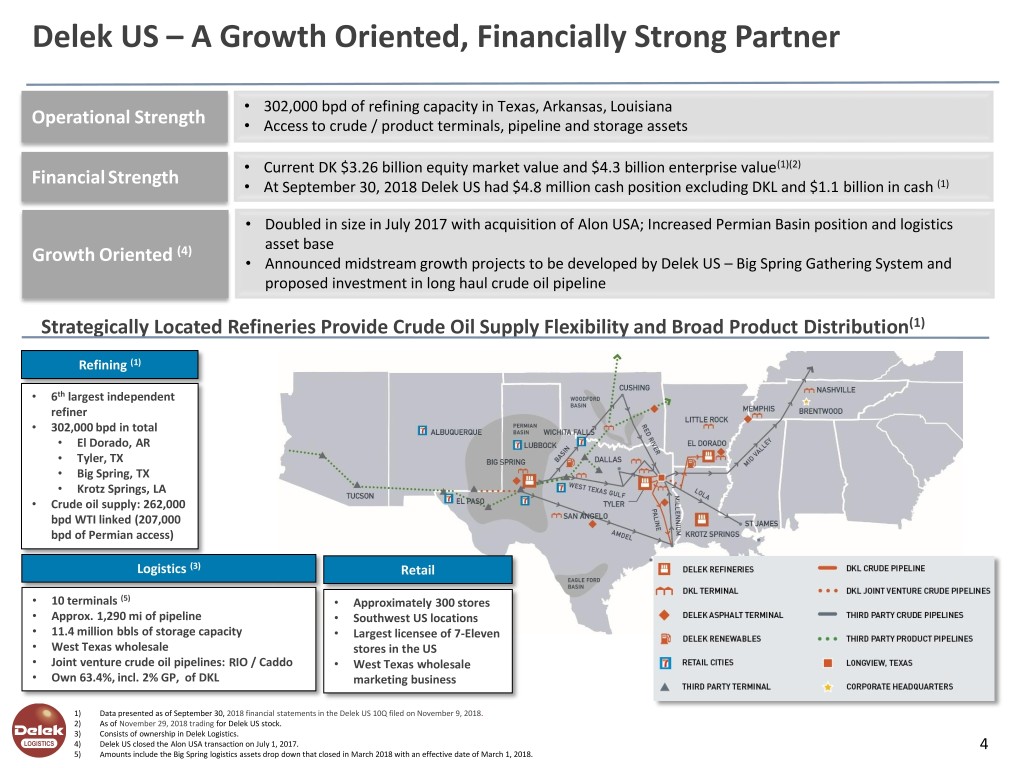
Delek US – A Growth Oriented, Financially Strong Partner • 302,000 bpd of refining capacity in Texas, Arkansas, Louisiana Operational Strength • Access to crude / product terminals, pipeline and storage assets • Current DK $3.26 billion equity market value and $4.3 billion enterprise value(1)(2) Financial Strength • At September 30, 2018 Delek US had $4.8 million cash position excluding DKL and $1.1 billion in cash (1) • Doubled in size in July 2017 with acquisition of Alon USA; Increased Permian Basin position and logistics (4) asset base Growth Oriented • Announced midstream growth projects to be developed by Delek US – Big Spring Gathering System and proposed investment in long haul crude oil pipeline Strategically Located Refineries Provide Crude Oil Supply Flexibility and Broad Product Distribution(1) Refining (1) • 6th largest independent refiner • 302,000 bpd in total • El Dorado, AR • Tyler, TX • Big Spring, TX • Krotz Springs, LA • Crude oil supply: 262,000 bpd WTI linked (207,000 bpd of Permian access) Logistics (3) Retail • 10 terminals (5) • Approximately 300 stores • Approx. 1,290 mi of pipeline • Southwest US locations • 11.4 million bbls of storage capacity • Largest licensee of 7-Eleven • West Texas wholesale stores in the US • Joint venture crude oil pipelines: RIO / Caddo • West Texas wholesale • Own 63.4%, incl. 2% GP, of DKL marketing business 1) Data presented as of September 30, 2018 financial statements in the Delek US 10Q filed on November 9, 2018. 2) As of November 29, 2018 trading for Delek US stock. 3) Consists of ownership in Delek Logistics. 4) Delek US closed the Alon USA transaction on July 1, 2017. 4 5) Amounts include the Big Spring logistics assets drop down that closed in March 2018 with an effective date of March 1, 2018.
Delek Logistics Partners, LP Overview
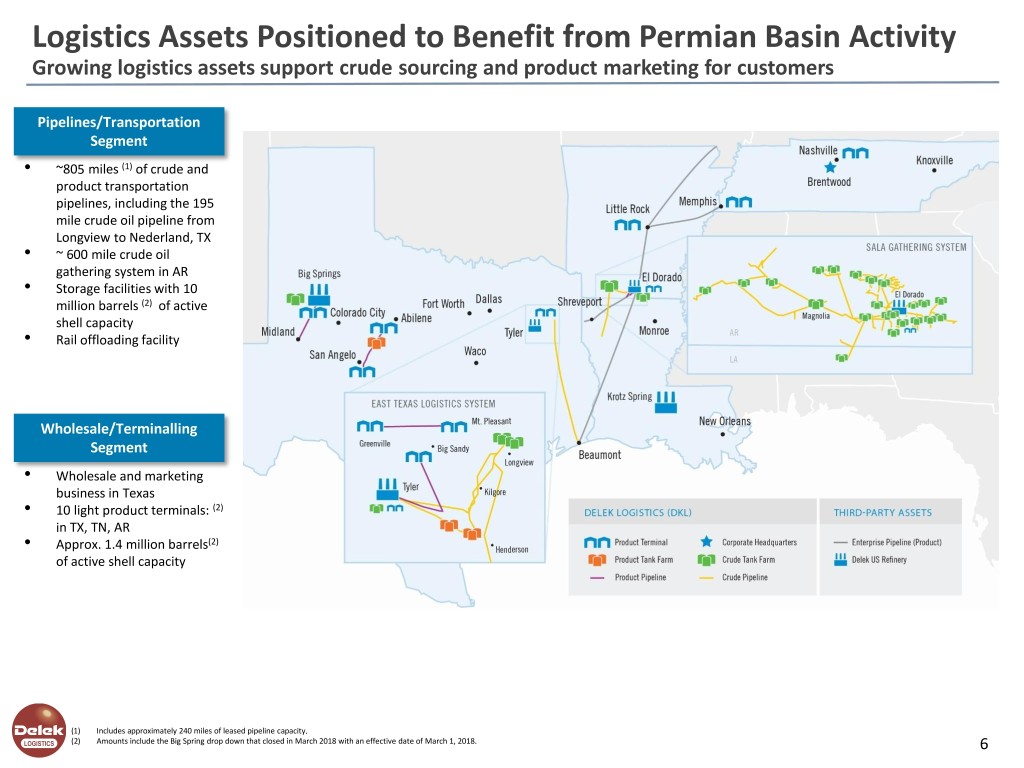
Logistics Assets Positioned to Benefit from Permian Basin Activity Growing logistics assets support crude sourcing and product marketing for customers Pipelines/Transportation Segment • ~805 miles (1) of crude and product transportation pipelines, including the 195 mile crude oil pipeline from Longview to Nederland, TX • ~ 600 mile crude oil gathering system in AR • Storage facilities with 10 million barrels (2) of active shell capacity • Rail offloading facility Wholesale/Terminalling Segment • Wholesale and marketing business in Texas • 10 light product terminals: (2) in TX, TN, AR • Approx. 1.4 million barrels(2) of active shell capacity (1) Includes approximately 240 miles of leased pipeline capacity. (2) Amounts include the Big Spring drop down that closed in March 2018 with an effective date of March 1, 2018. 6
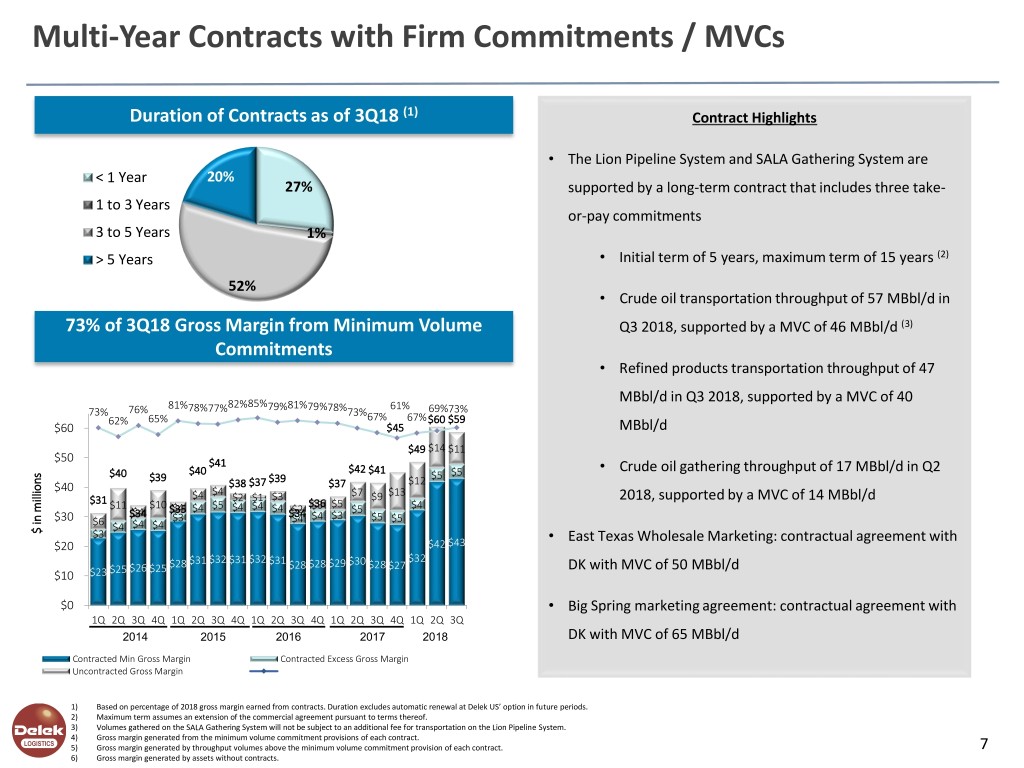
Multi-Year Contracts with Firm Commitments / MVCs Duration of Contracts as of 3Q18 (1) Contract Highlights • The Lion Pipeline System and SALA Gathering System are < 1 Year 20% 27% supported by a long-term contract that includes three take- 1 to 3 Years or-pay commitments 3 to 5 Years 1% > 5 Years • Initial term of 5 years, maximum term of 15 years (2) 52% • Crude oil transportation throughput of 57 MBbl/d in 73% of 3Q18 Gross Margin from Minimum Volume Q3 2018, supported by a MVC of 46 MBbl/d (3) Commitments • Refined products transportation throughput of 47 MBbl/d in Q3 2018, supported by a MVC of 40 81% 82%85% 81% 61% 73% 76% 78%77% 79% 79%78%73% 69%73% 62% 65% 67% 67%$60 $59 $60 $45 MBbl/d $49 $14 $11 $50 $41 $40 $42 $41 • Crude oil gathering throughput of 17 MBbl/d in Q2 $40 $39 $5 $5 $38 $37 $39 $37 $12 $40 $4 $7 $13 $31 $4 $2 $1 $3 $9 2018, supported by a MVC of 14 MBbl/d $11 $10 $5 $4 $36$3 $5 $4 $4 $35$4 $4 $4 $4 $2 $5 $30 $34 $3 $34$4 $4 $3 $5 $5 $6 $4 $4 $4 $ in millions in $ $3 • East Texas Wholesale Marketing: contractual agreement with $20 $42 $43 $31 $32 $31 $32 $31 $29 $30 $32 $25 $26 $25 $28 $28 $28 $28 $27 DK with MVC of 50 MBbl/d $10 $23 $0 • Big Spring marketing agreement: contractual agreement with 1Q 2Q 3Q 4Q 1Q 2Q 3Q 4Q 1Q 2Q 3Q 4Q 1Q 2Q 3Q 4Q 1Q 2Q 3Q 2014 2015 2016 2017 2018 DK with MVC of 65 MBbl/d Contracted Min Gross Margin Contracted Excess Gross Margin Uncontracted Gross Margin 1) Based on percentage of 2018 gross margin earned from contracts. Duration excludes automatic renewal at Delek US’ option in future periods. 2) Maximum term assumes an extension of the commercial agreement pursuant to terms thereof. 3) Volumes gathered on the SALA Gathering System will not be subject to an additional fee for transportation on the Lion Pipeline System. 4) Gross margin generated from the minimum volume commitment provisions of each contract. 5) Gross margin generated by throughput volumes above the minimum volume commitment provision of each contract. 7 6) Gross margin generated by assets without contracts.
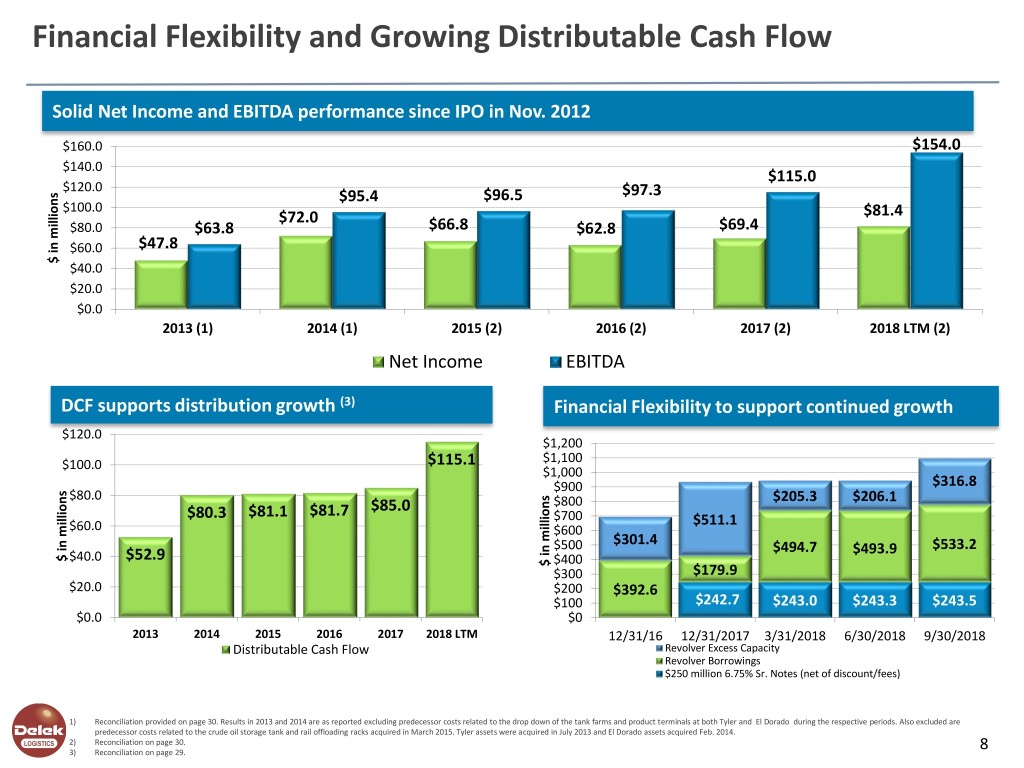
Financial Flexibility and Growing Distributable Cash Flow Solid Net Income and EBITDA performance since IPO in Nov. 2012 $160.0 $154.0 $140.0 $115.0 $120.0 $95.4 $96.5 $97.3 $100.0 $72.0 $81.4 $80.0 $63.8 $66.8 $62.8 $69.4 $60.0 $47.8 $ in $ millions $40.0 $20.0 $0.0 2013 (1) 2014 (1) 2015 (2) 2016 (2) 2017 (2) 2018 LTM (2) Net Income EBITDA DCF supports distribution growth (3) Financial Flexibility to support continued growth $120.0 $1,200 $100.0 $115.1 $1,100 $1,000 $900 $316.8 $80.0 $800 $205.3 $206.1 $81.7 $85.0 $80.3 $81.1 $700 $511.1 $60.0 $600 $301.4 $500 $494.7 $493.9 $533.2 $ in $ millions $40.0 $52.9 $ in $ millions $400 $300 $179.9 $20.0 $200 $392.6 $100 $242.7 $243.0 $243.3 $243.5 $0.0 $0 2013 2014 2015 2016 2017 2018 LTM 12/31/16 12/31/2017 3/31/2018 6/30/2018 9/30/2018 Distributable Cash Flow Revolver Excess Capacity Revolver Borrowings $250 million 6.75% Sr. Notes (net of discount/fees) 1) Reconciliation provided on page 30. Results in 2013 and 2014 are as reported excluding predecessor costs related to the drop down of the tank farms and product terminals at both Tyler and El Dorado during the respective periods. Also excluded are predecessor costs related to the crude oil storage tank and rail offloading racks acquired in March 2015. Tyler assets were acquired in July 2013 and El Dorado assets acquired Feb. 2014. 2) Reconciliation on page 30. 3) Reconciliation on page 29. 8
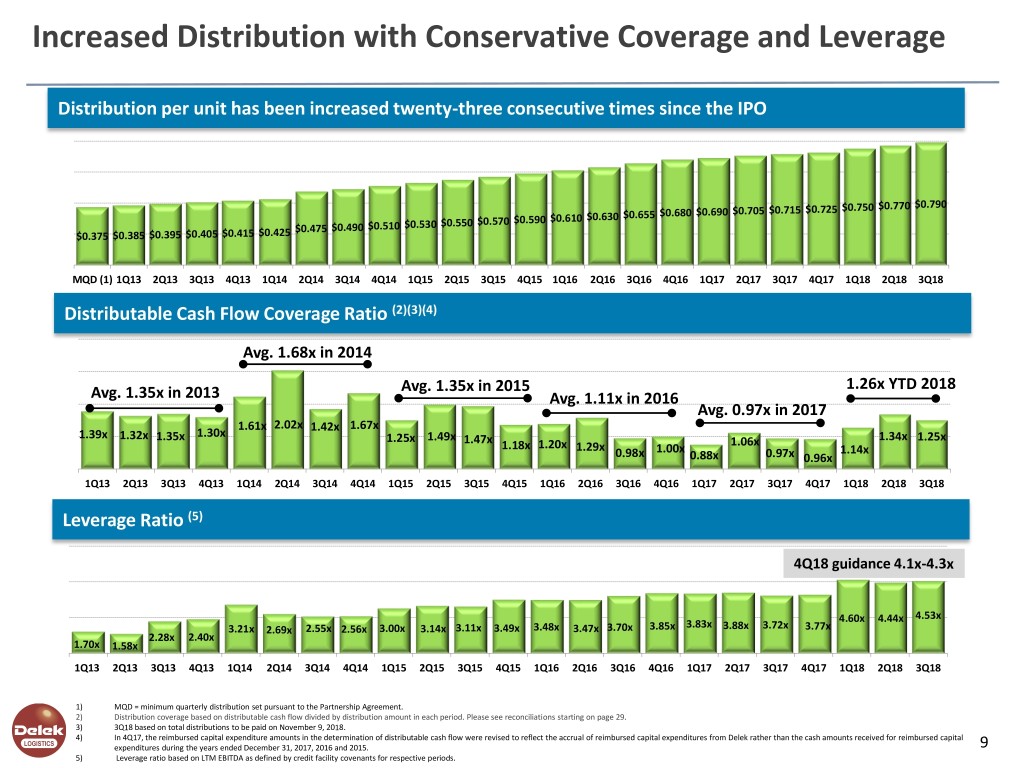
Increased Distribution with Conservative Coverage and Leverage Distribution per unit has been increased twenty-three consecutive times since the IPO $0.790 $0.705 $0.715 $0.725 $0.750 $0.770 $0.630 $0.655 $0.680 $0.690 $0.550 $0.570 $0.590 $0.610 $0.475 $0.490 $0.510 $0.530 $0.375 $0.385 $0.395 $0.405 $0.415 $0.425 MQD (1) 1Q13 2Q13 3Q13 4Q13 1Q14 2Q14 3Q14 4Q14 1Q15 2Q15 3Q15 4Q15 1Q16 2Q16 3Q16 4Q16 1Q17 2Q17 3Q17 4Q17 1Q18 2Q18 3Q18 Distributable Cash Flow Coverage Ratio (2)(3)(4) Avg. 1.68x in 2014 Avg. 1.35x in 2015 1.26x YTD 2018 Avg. 1.35x in 2013 Avg. 1.11x in 2016 Avg. 0.97x in 2017 1.61x 2.02x 1.42x 1.67x 1.39x 1.30x 1.32x 1.35x 1.25x 1.49x 1.47x 1.06x 1.34x 1.25x 1.18x 1.20x 1.29x 1.00x 1.14x 0.98x 0.88x 0.97x 0.96x 1Q13 2Q13 3Q13 4Q13 1Q14 2Q14 3Q14 4Q14 1Q15 2Q15 3Q15 4Q15 1Q16 2Q16 3Q16 4Q16 1Q17 2Q17 3Q17 4Q17 1Q18 2Q18 3Q18 Leverage Ratio (5) 4Q18 guidance 4.1x-4.3x 4.53x 3.83x 4.60x 4.44x 3.21x 2.69x 2.55x 2.56x 3.00x 3.14x 3.11x 3.49x 3.48x 3.47x 3.70x 3.85x 3.88x 3.72x 3.77x 2.28x 2.40x 1.70x 1.58x 1Q13 2Q13 3Q13 4Q13 1Q14 2Q14 3Q14 4Q14 1Q15 2Q15 3Q15 4Q15 1Q16 2Q16 3Q16 4Q16 1Q17 2Q17 3Q17 4Q17 1Q18 2Q18 3Q18 1) MQD = minimum quarterly distribution set pursuant to the Partnership Agreement. 2) Distribution coverage based on distributable cash flow divided by distribution amount in each period. Please see reconciliations starting on page 29. 3) 3Q18 based on total distributions to be paid on November 9, 2018. 4) In 4Q17, the reimbursed capital expenditure amounts in the determination of distributable cash flow were revised to reflect the accrual of reimbursed capital expenditures from Delek rather than the cash amounts received for reimbursed capital expenditures during the years ended December 31, 2017, 2016 and 2015. 9 5) Leverage ratio based on LTM EBITDA as defined by credit facility covenants for respective periods.
Assets Positioned for Permian Basin Growth
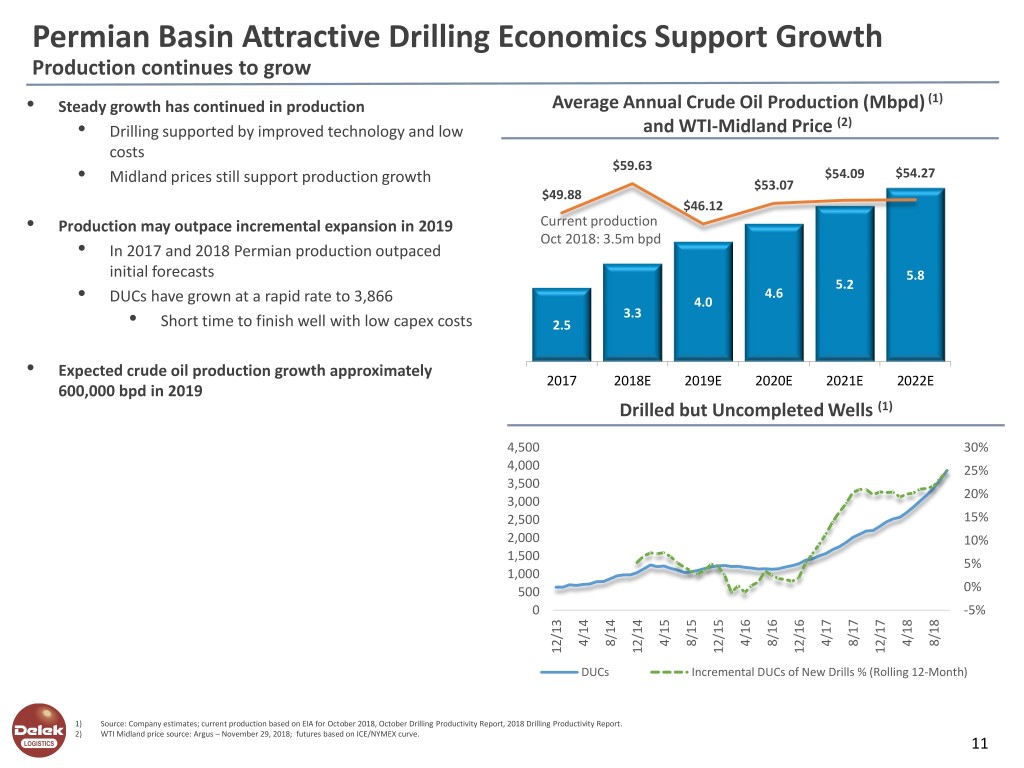
Permian Basin Attractive Drilling Economics Support Growth Production continues to grow (1) • Steady growth has continued in production Average Annual Crude Oil Production (Mbpd) (2) • Drilling supported by improved technology and low and WTI-Midland Price costs 7.00 70.00 $59.63 $54.09 $54.27 • Midland prices still support production growth 6.00 $53.07 60.00 $49.88 5.00 $46.12 50.00 • Production may outpace incremental expansion in 2019 Current production 4.00 Oct 2018: 3.5m bpd 40.00 • In 2017 and 2018 Permian production outpaced initial forecasts 3.00 5.8 30.00 5.2 4.6 • DUCs have grown at a rapid rate to 3,866 2.00 4.0 20.00 • Short time to finish well with low capex costs 3.3 1.00 2.5 10.00 - - • Expected crude oil production growth approximately 2017 2018E 2019E 2020E 2021E 2022E 600,000 bpd in 2019 Drilled but Uncompleted Wells (1) 4,500 30% 4,000 25% 3,500 20% 3,000 2,500 15% 2,000 10% 1,500 5% 1,000 500 0% 0 -5% 4/14 8/14 4/15 8/15 4/16 8/16 4/17 8/17 4/18 8/18 12/13 12/14 12/15 12/16 12/17 DUCs Incremental DUCs of New Drills % (Rolling 12-Month) 1) Source: Company estimates; current production based on EIA for October 2018, October Drilling Productivity Report, 2018 Drilling Productivity Report. 2) WTI Midland price source: Argus – November 29, 2018; futures based on ICE/NYMEX curve. 11
Big Spring Logistics Assets Dropdown Located in the Permian Basin and support Delek US’ Big Spring refinery • Dropdown closed in March with an effective date of March 1, 2018 • Purchase price of $315.0 million which equates to a 7.8x EBITDA multiple. • Forecasted annualized EBITDA of $40.2M (1) • Financed through a combination of cash on hand and borrowings on the revolving credit facility. • This acquisition consists of: • Storage tanks and salt wells – ~3.0 million barrels of aggregate shell capacity, consisting of 75 tanks, 4 salt wells and ancillary assets, including piping and pumps located at the refinery • Product terminals – Consists of an asphalt terminal that operated at 3,900 bpd during 2H17 and a light products terminal with 54,000 bpd throughput capacity, which operated at 28,000 bpd during 2H17 • Marketing agreement – Delek US entered into a new wholesale marketing agreement whereby Delek Logistics will provide services necessary to market various refined products produced at the Big Spring refinery. During 2H17, total sales volume for products to be covered by this agreement was ~74,700 bpd 1) Reconciliation on page 32. 12
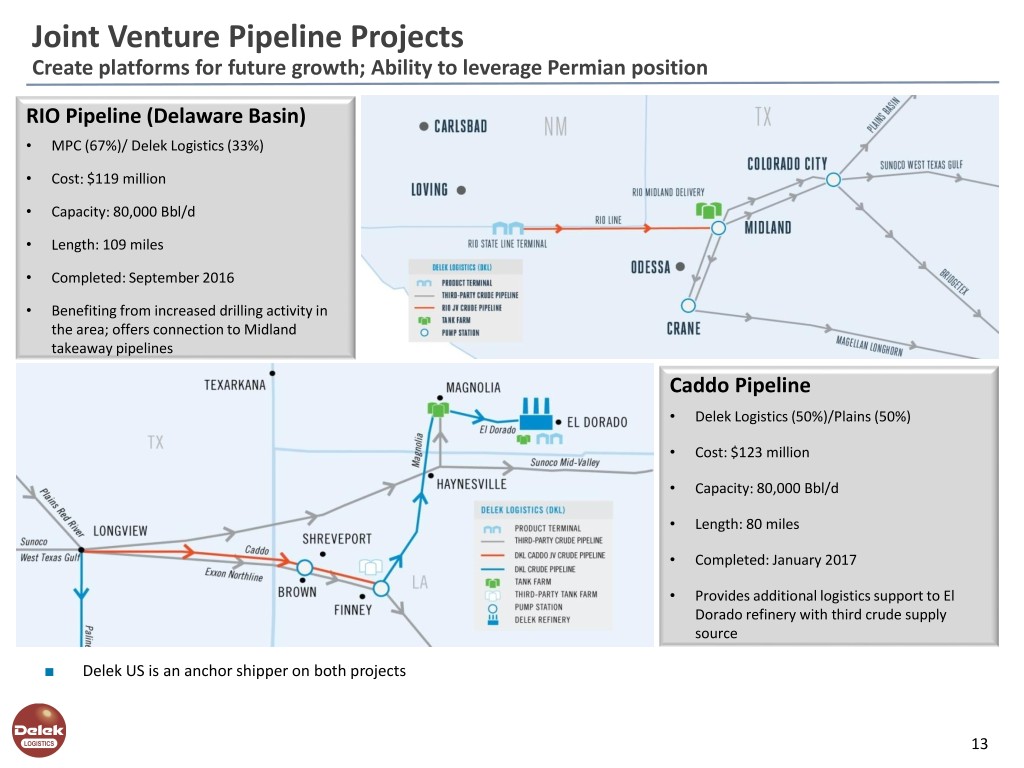
Joint Venture Pipeline Projects Create platforms for future growth; Ability to leverage Permian position RIO Pipeline (Delaware Basin) • MPC (67%)/ Delek Logistics (33%) • Cost: $119 million • Capacity: 80,000 Bbl/d • Length: 109 miles • Completed: September 2016 • Benefiting from increased drilling activity in the area; offers connection to Midland takeaway pipelines Caddo Pipeline • Delek Logistics (50%)/Plains (50%) • Cost: $123 million • Capacity: 80,000 Bbl/d • Length: 80 miles • Completed: January 2017 • Provides additional logistics support to El Dorado refinery with third crude supply source ■ Delek US is an anchor shipper on both projects 13
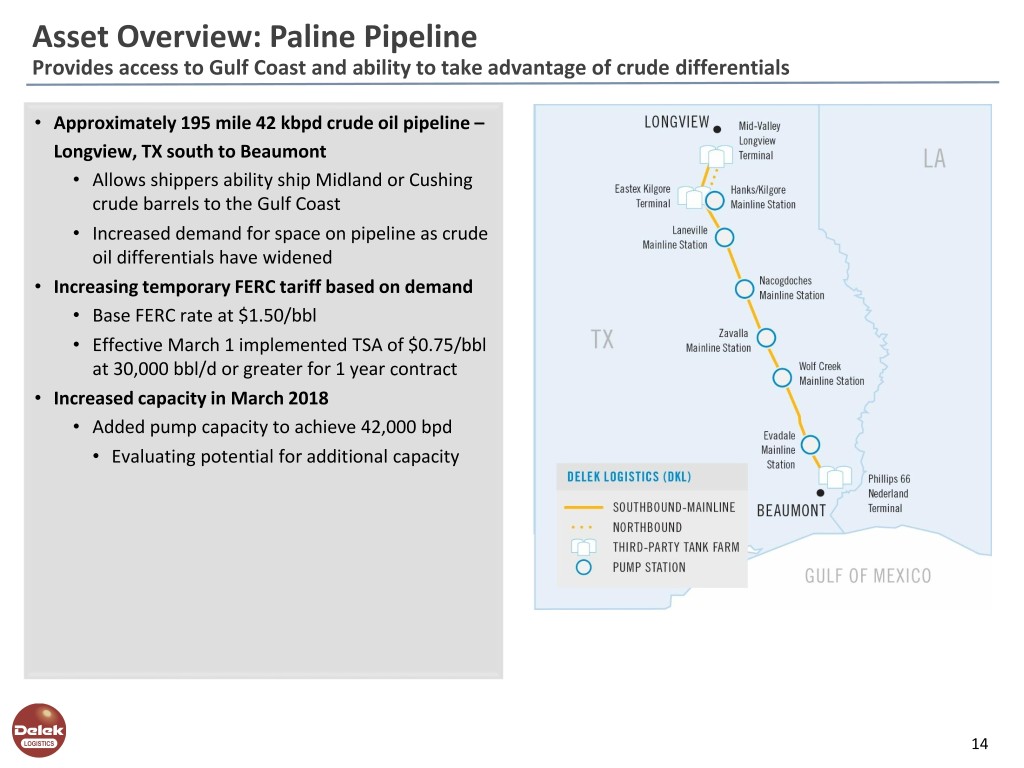
Asset Overview: Paline Pipeline Provides access to Gulf Coast and ability to take advantage of crude differentials • Approximately 195 mile 42 kbpd crude oil pipeline – Longview, TX south to Beaumont • Allows shippers ability ship Midland or Cushing crude barrels to the Gulf Coast • Increased demand for space on pipeline as crude oil differentials have widened • Increasing temporary FERC tariff based on demand • Base FERC rate at $1.50/bbl • Effective March 1 implemented TSA of $0.75/bbl at 30,000 bbl/d or greater for 1 year contract • Increased capacity in March 2018 • Added pump capacity to achieve 42,000 bpd • Evaluating potential for additional capacity 14
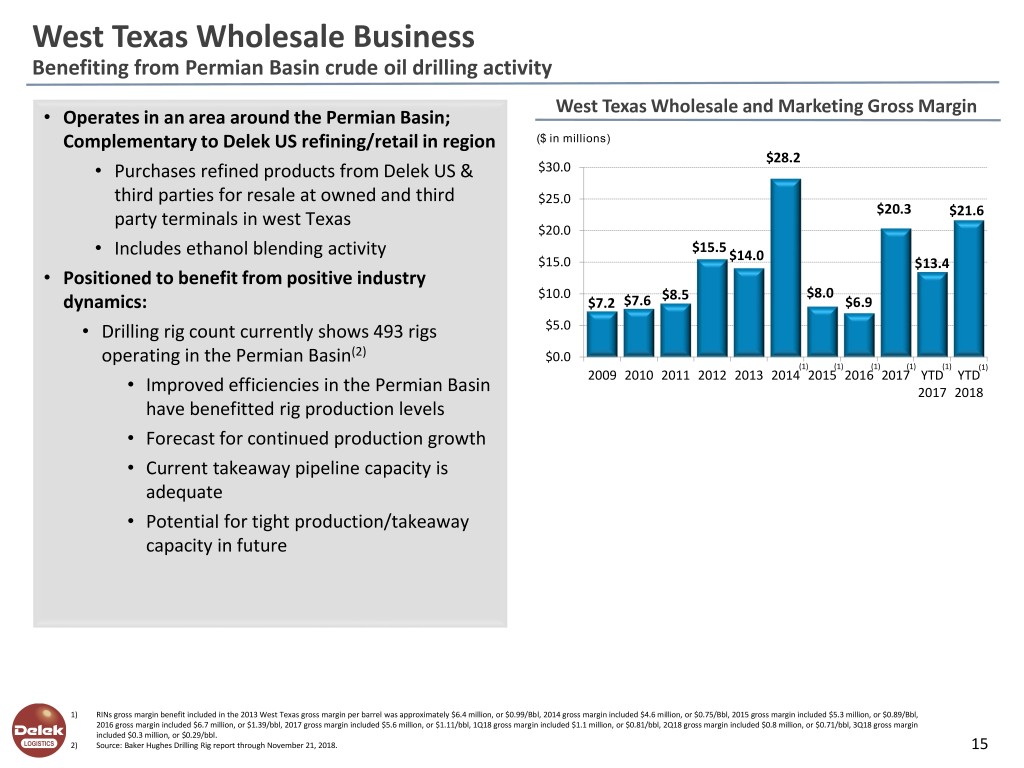
West Texas Wholesale Business Benefiting from Permian Basin crude oil drilling activity West Texas Wholesale and Marketing Gross Margin • Operates in an area around the Permian Basin; Complementary to Delek US refining/retail in region ($ in millions) $28.2 • Purchases refined products from Delek US & $30.0 third parties for resale at owned and third $25.0 $20.3 party terminals in west Texas $21.6 $20.0 $15.5 • Includes ethanol blending activity $14.0 $15.0 $13.4 • Positioned to benefit from positive industry $10.0 $8.5 $8.0 dynamics: $7.2 $7.6 $6.9 • Drilling rig count currently shows 493 rigs $5.0 operating in the Permian Basin(2) $0.0 (1) (1) (1) (1) (1) (1) 2009 2010 2011 2012 2013 2014 2015 2016 2017 YTD YTD • Improved efficiencies in the Permian Basin 2017 2018 have benefitted rig production levels • Forecast for continued production growth • Current takeaway pipeline capacity is adequate • Potential for tight production/takeaway capacity in future 1) RINs gross margin benefit included in the 2013 West Texas gross margin per barrel was approximately $6.4 million, or $0.99/Bbl, 2014 gross margin included $4.6 million, or $0.75/Bbl, 2015 gross margin included $5.3 million, or $0.89/Bbl, 2016 gross margin included $6.7 million, or $1.39/bbl, 2017 gross margin included $5.6 million, or $1.11/bbl, 1Q18 gross margin included $1.1 million, or $0.81/bbl, 2Q18 gross margin included $0.8 million, or $0.71/bbl, 3Q18 gross margin included $0.3 million, or $0.29/bbl. 2) Source: Baker Hughes Drilling Rig report through November 21, 2018. 15
Going Forward Growing Sponsor Midstream Assets
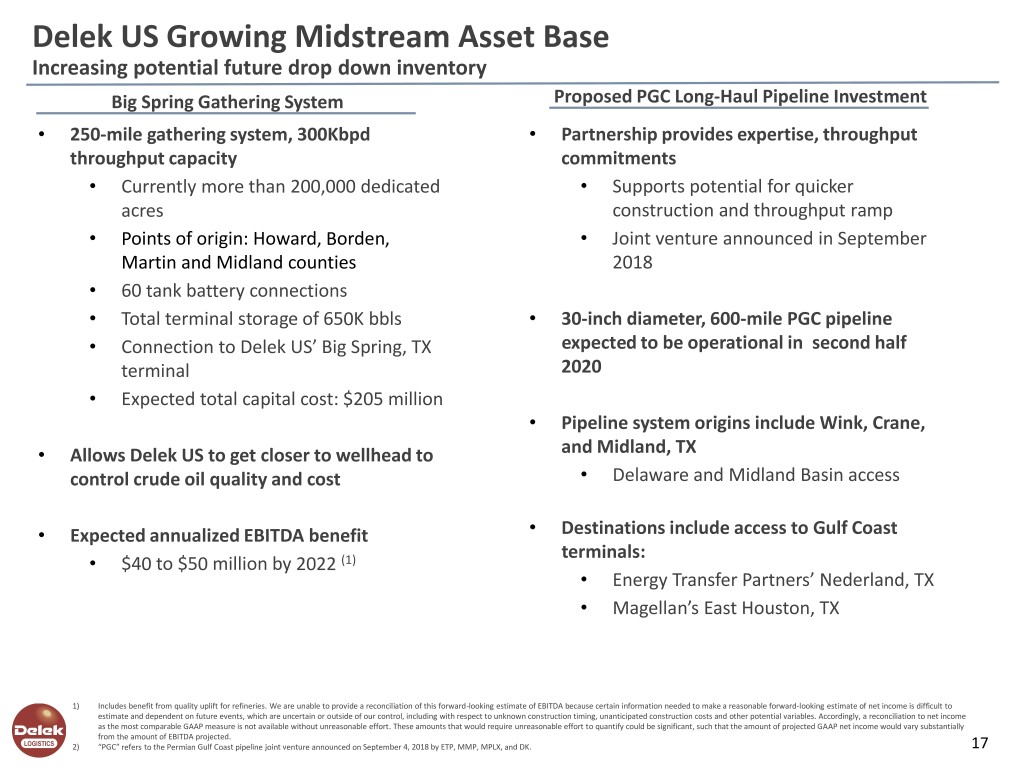
Delek US Growing Midstream Asset Base Increasing potential future drop down inventory Big Spring Gathering System Proposed PGC Long-Haul Pipeline Investment • 250-mile gathering system, 300Kbpd • Partnership provides expertise, throughput throughput capacity commitments • Currently more than 200,000 dedicated • Supports potential for quicker acres construction and throughput ramp • Points of origin: Howard, Borden, • Joint venture announced in September Martin and Midland counties 2018 • 60 tank battery connections • Total terminal storage of 650K bbls • 30-inch diameter, 600-mile PGC pipeline • Connection to Delek US’ Big Spring, TX expected to be operational in second half terminal 2020 • Expected total capital cost: $205 million • Pipeline system origins include Wink, Crane, • Allows Delek US to get closer to wellhead to and Midland, TX control crude oil quality and cost • Delaware and Midland Basin access • Expected annualized EBITDA benefit • Destinations include access to Gulf Coast terminals: • $40 to $50 million by 2022 (1) • Energy Transfer Partners’ Nederland, TX • Magellan’s East Houston, TX 1) Includes benefit from quality uplift for refineries. We are unable to provide a reconciliation of this forward-looking estimate of EBITDA because certain information needed to make a reasonable forward-looking estimate of net income is difficult to estimate and dependent on future events, which are uncertain or outside of our control, including with respect to unknown construction timing, unanticipated construction costs and other potential variables. Accordingly, a reconciliation to net income as the most comparable GAAP measure is not available without unreasonable effort. These amounts that would require unreasonable effort to quantify could be significant, such that the amount of projected GAAP net income would vary substantially from the amount of EBITDA projected. 2) “PGC” refers to the Permian Gulf Coast pipeline joint venture announced on September 4, 2018 by ETP, MMP, MPLX, and DK. 17
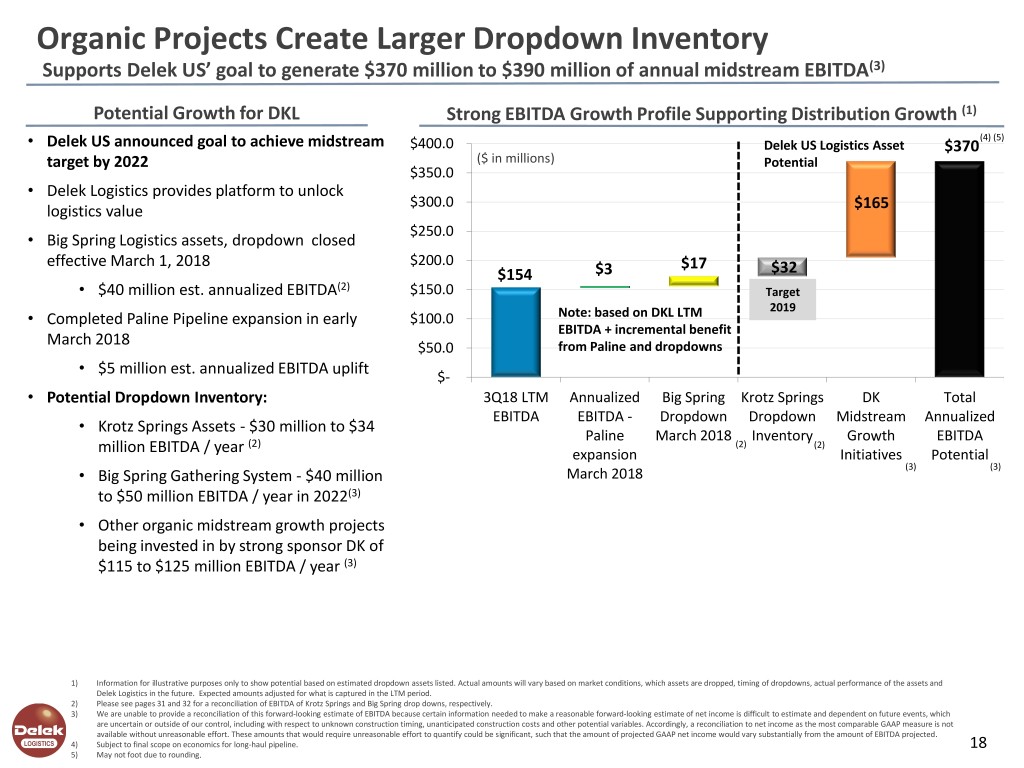
Organic Projects Create Larger Dropdown Inventory Supports Delek US’ goal to generate $370 million to $390 million of annual midstream EBITDA(3) Potential Growth for DKL Strong EBITDA Growth Profile Supporting Distribution Growth (1) (4) (5) • Delek US announced goal to achieve midstream $400.0 Delek US Logistics Asset $370 target by 2022 ($ in millions) Potential $350.0 • Delek Logistics provides platform to unlock $300.0 logistics value $165 $250.0 • Big Spring Logistics assets, dropdown closed effective March 1, 2018 $200.0 $17 $154 $3 $32 • $40 million est. annualized EBITDA(2) $150.0 Target 2019 • Completed Paline Pipeline expansion in early $100.0 Note: based on DKL LTM EBITDA + incremental benefit March 2018 $50.0 from Paline and dropdowns • $5 million est. annualized EBITDA uplift $- • Potential Dropdown Inventory: 3Q18 LTM Annualized Big Spring Krotz Springs DK Total EBITDA EBITDA - Dropdown Dropdown Midstream Annualized • Krotz Springs Assets - $30 million to $34 Paline March 2018 Inventory Growth EBITDA (2) (2) (2) million EBITDA / year expansion Initiatives Potential (3) (3) • Big Spring Gathering System - $40 million March 2018 to $50 million EBITDA / year in 2022(3) • Other organic midstream growth projects being invested in by strong sponsor DK of $115 to $125 million EBITDA / year (3) 1) Information for illustrative purposes only to show potential based on estimated dropdown assets listed. Actual amounts will vary based on market conditions, which assets are dropped, timing of dropdowns, actual performance of the assets and Delek Logistics in the future. Expected amounts adjusted for what is captured in the LTM period. 2) Please see pages 31 and 32 for a reconciliation of EBITDA of Krotz Springs and Big Spring drop downs, respectively. 3) We are unable to provide a reconciliation of this forward-looking estimate of EBITDA because certain information needed to make a reasonable forward-looking estimate of net income is difficult to estimate and dependent on future events, which are uncertain or outside of our control, including with respect to unknown construction timing, unanticipated construction costs and other potential variables. Accordingly, a reconciliation to net income as the most comparable GAAP measure is not available without unreasonable effort. These amounts that would require unreasonable effort to quantify could be significant, such that the amount of projected GAAP net income would vary substantially from the amount of EBITDA projected. 4) Subject to final scope on economics for long-haul pipeline. 18 5) May not foot due to rounding.
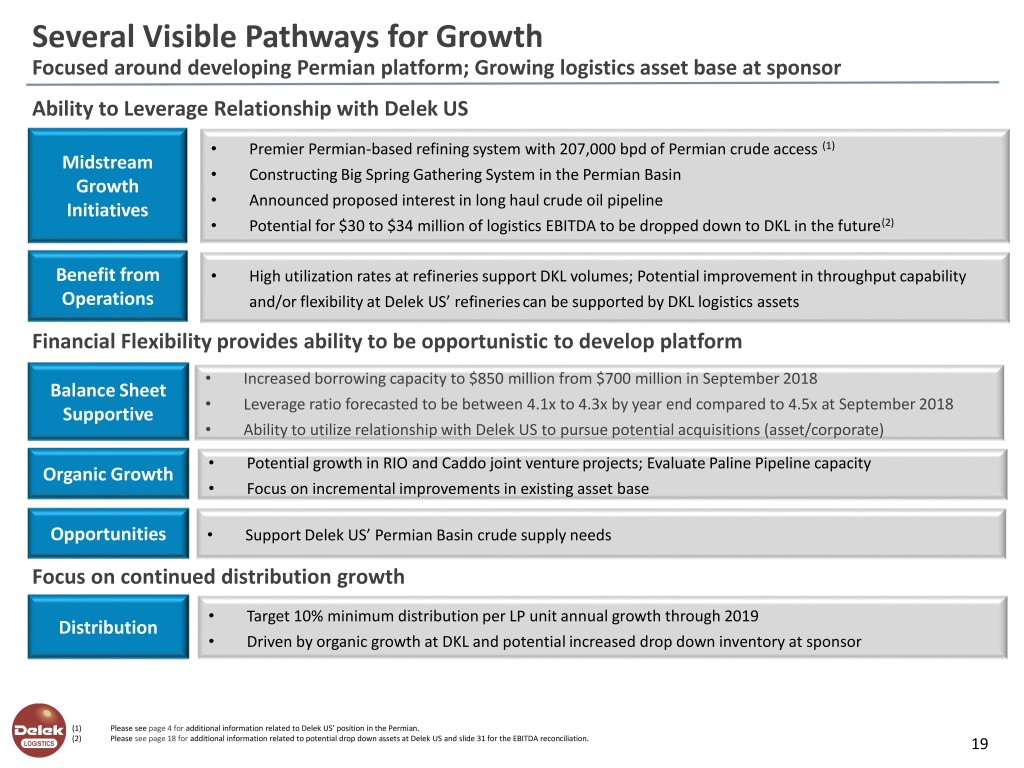
Several Visible Pathways for Growth Focused around developing Permian platform; Growing logistics asset base at sponsor Ability to Leverage Relationship with Delek US • Premier Permian-based refining system with 207,000 bpd of Permian crude access (1) Midstream • Constructing Big Spring Gathering System in the Permian Basin Growth • Announced proposed interest in long haul crude oil pipeline Initiatives • Potential for $30 to $34 million of logistics EBITDA to be dropped down to DKL in the future(2) Benefit from • High utilization rates at refineries support DKL volumes; Potential improvement in throughput capability Operations and/or flexibility at Delek US’ refineries can be supported by DKL logistics assets Financial Flexibility provides ability to be opportunistic to develop platform • Increased borrowing capacity to $850 million from $700 million in September 2018 Balance Sheet • Leverage ratio forecasted to be between 4.1x to 4.3x by year end compared to 4.5x at September 2018 Supportive • Ability to utilize relationship with Delek US to pursue potential acquisitions (asset/corporate) • Potential growth in RIO and Caddo joint venture projects; Evaluate Paline Pipeline capacity Organic Growth • Focus on incremental improvements in existing asset base Opportunities • Support Delek US’ Permian Basin crude supply needs Focus on continued distribution growth • Target 10% minimum distribution per LP unit annual growth through 2019 Distribution • Driven by organic growth at DKL and potential increased drop down inventory at sponsor (1) Please see page 4 for additional information related to Delek US’ position in the Permian. (2) Please see page 18 for additional information related to potential drop down assets at Delek US and slide 31 for the EBITDA reconciliation. 19
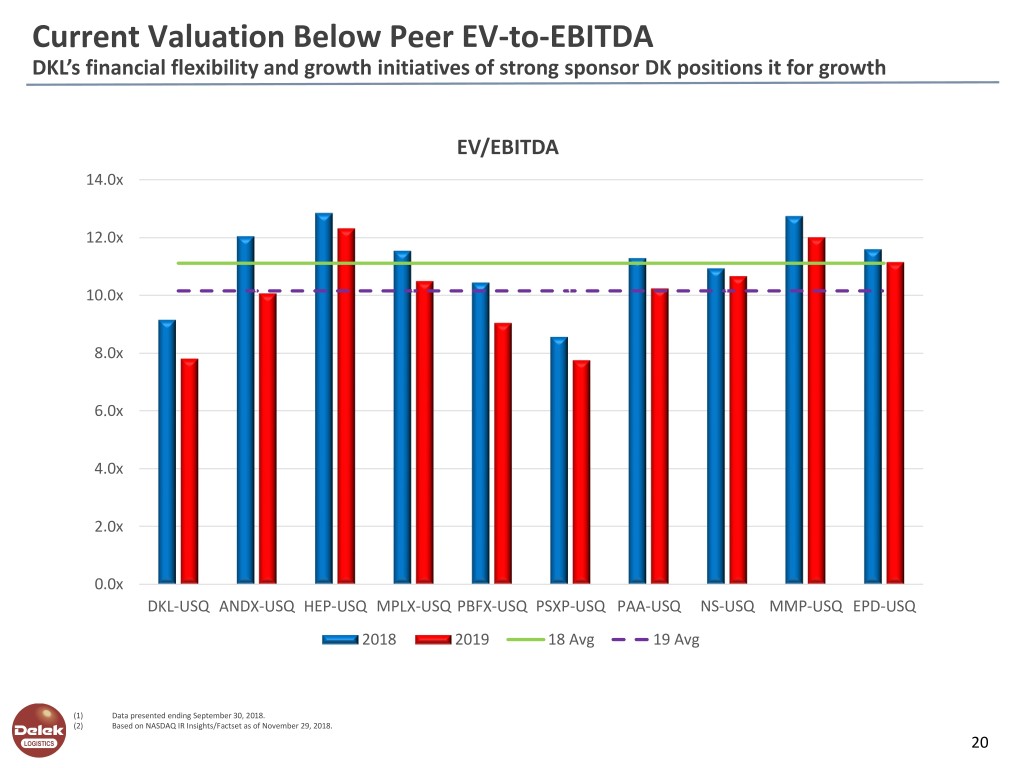
Current Valuation Below Peer EV-to-EBITDA DKL’s financial flexibility and growth initiatives of strong sponsor DK positions it for growth EV/EBITDA 14.0x 12.0x 10.0x 8.0x 6.0x 4.0x 2.0x 0.0x DKL-USQ ANDX-USQ HEP-USQ MPLX-USQ PBFX-USQ PSXP-USQ PAA-USQ NS-USQ MMP-USQ EPD-USQ 2018 2019 18 Avg 19 Avg (1) Data presented ending September 30, 2018. (2) Based on NASDAQ IR Insights/Factset as of November 29, 2018. 20
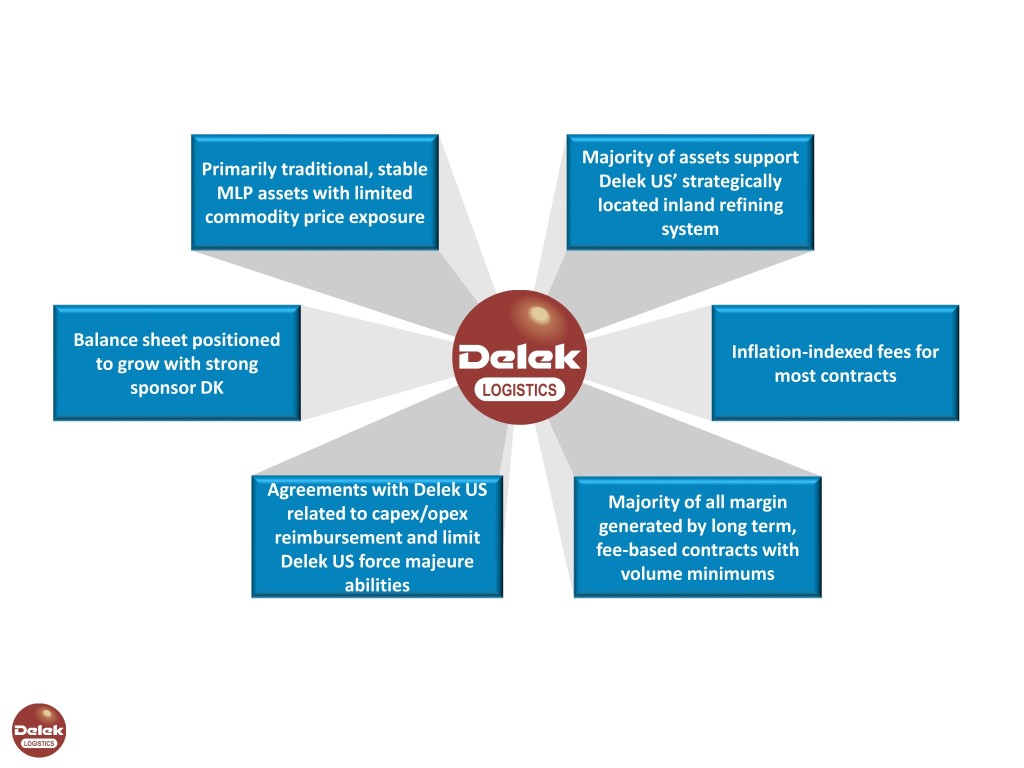
Majority of assets support Primarily traditional, stable Delek US’ strategically MLP assets with limited located inland refining commodity price exposure system Balance sheet positioned Inflation-indexed fees for to grow with strong most contracts sponsor DK Agreements with Delek US Majority of all margin related to capex/opex generated by long term, reimbursement and limit fee-based contracts with Delek US force majeure volume minimums abilities
Appendix
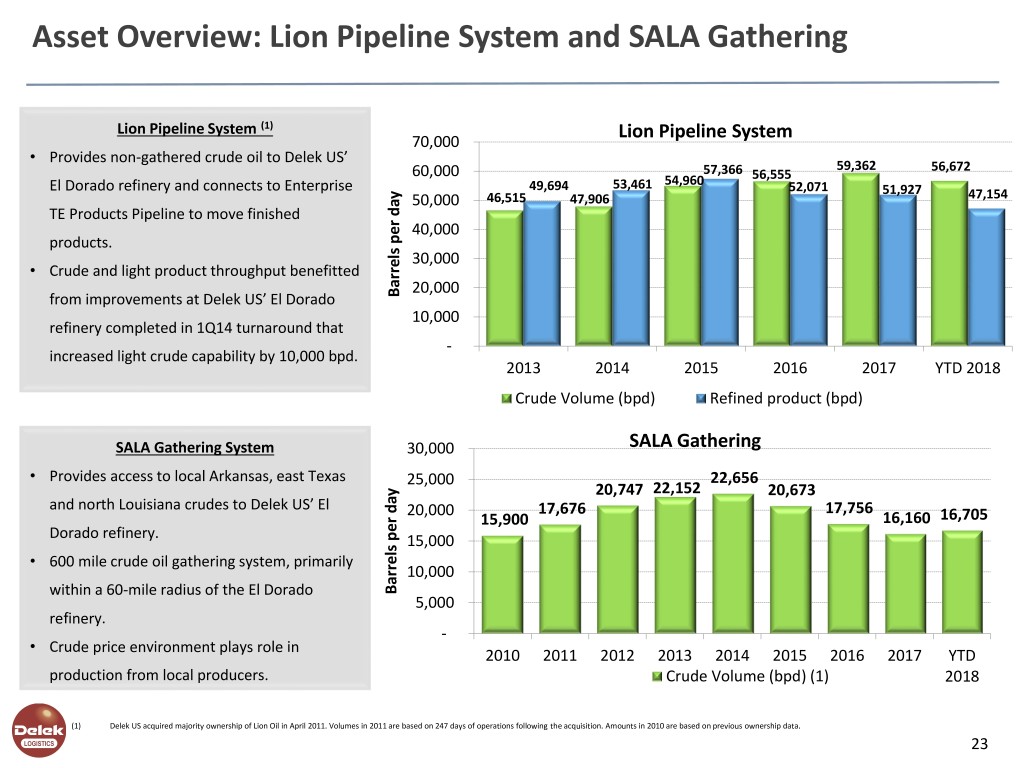
Asset Overview: Lion Pipeline System and SALA Gathering Lion Pipeline System (1) Lion Pipeline System 70,000 • Provides non-gathered crude oil to Delek US’ 60,000 57,366 59,362 56,672 54,960 56,555 El Dorado refinery and connects to Enterprise 49,694 53,461 52,071 51,927 50,000 46,515 47,906 47,154 TE Products Pipeline to move finished 40,000 products. 30,000 • Crude and light product throughput benefitted 20,000 from improvements at Delek US’ El Dorado day per Barrels 10,000 refinery completed in 1Q14 turnaround that - increased light crude capability by 10,000 bpd. 2013 2014 2015 2016 2017 YTD 2018 Crude Volume (bpd) Refined product (bpd) SALA Gathering System 30,000 SALA Gathering • Provides access to local Arkansas, east Texas 25,000 22,656 20,747 22,152 20,673 and north Louisiana crudes to Delek US’ El 20,000 17,676 17,756 15,900 16,160 16,705 Dorado refinery. 15,000 • 600 mile crude oil gathering system, primarily 10,000 within a 60-mile radius of the El Dorado day per Barrels 5,000 refinery. - • Crude price environment plays role in 2010 2011 2012 2013 2014 2015 2016 2017 YTD production from local producers. Crude Volume (bpd) (1) 2018 (1) Delek US acquired majority ownership of Lion Oil in April 2011. Volumes in 2011 are based on 247 days of operations following the acquisition. Amounts in 2010 are based on previous ownership data. 23
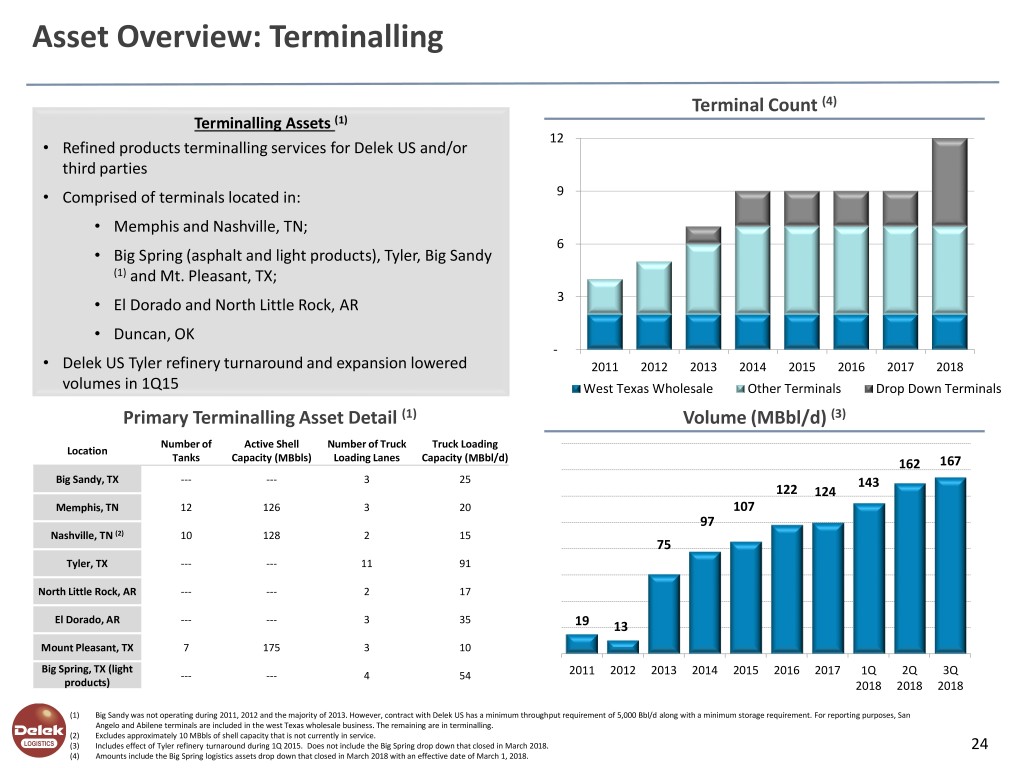
Asset Overview: Terminalling Terminal Count (4) Terminalling Assets (1) 12 • Refined products terminalling services for Delek US and/or third parties • Comprised of terminals located in: 9 • Memphis and Nashville, TN; 6 • Big Spring (asphalt and light products), Tyler, Big Sandy (1) and Mt. Pleasant, TX; • El Dorado and North Little Rock, AR 3 • Duncan, OK - • Delek US Tyler refinery turnaround and expansion lowered 2011 2012 2013 2014 2015 2016 2017 2018 volumes in 1Q15 West Texas Wholesale Other Terminals Drop Down Terminals Primary Terminalling Asset Detail (1) Volume (MBbl/d) (3) Number of Active Shell Number of Truck Truck Loading Location Tanks Capacity (MBbls) Loading Lanes Capacity (MBbl/d) 162 167 Big Sandy, TX --- --- 3 25 143 122 124 Memphis, TN 12 126 3 20 107 97 Nashville, TN (2) 10 128 2 15 75 Tyler, TX --- --- 11 91 North Little Rock, AR --- --- 2 17 El Dorado, AR --- --- 3 35 19 13 Mount Pleasant, TX 7 175 3 10 Big Spring, TX (light --- --- 4 54 2011 2012 2013 2014 2015 2016 2017 1Q 2Q 3Q products) 2018 2018 2018 (1) Big Sandy was not operating during 2011, 2012 and the majority of 2013. However, contract with Delek US has a minimum throughput requirement of 5,000 Bbl/d along with a minimum storage requirement. For reporting purposes, San Angelo and Abilene terminals are included in the west Texas wholesale business. The remaining are in terminalling. (2) Excludes approximately 10 MBbls of shell capacity that is not currently in service. (3) Includes effect of Tyler refinery turnaround during 1Q 2015. Does not include the Big Spring drop down that closed in March 2018. 24 (4) Amounts include the Big Spring logistics assets drop down that closed in March 2018 with an effective date of March 1, 2018.
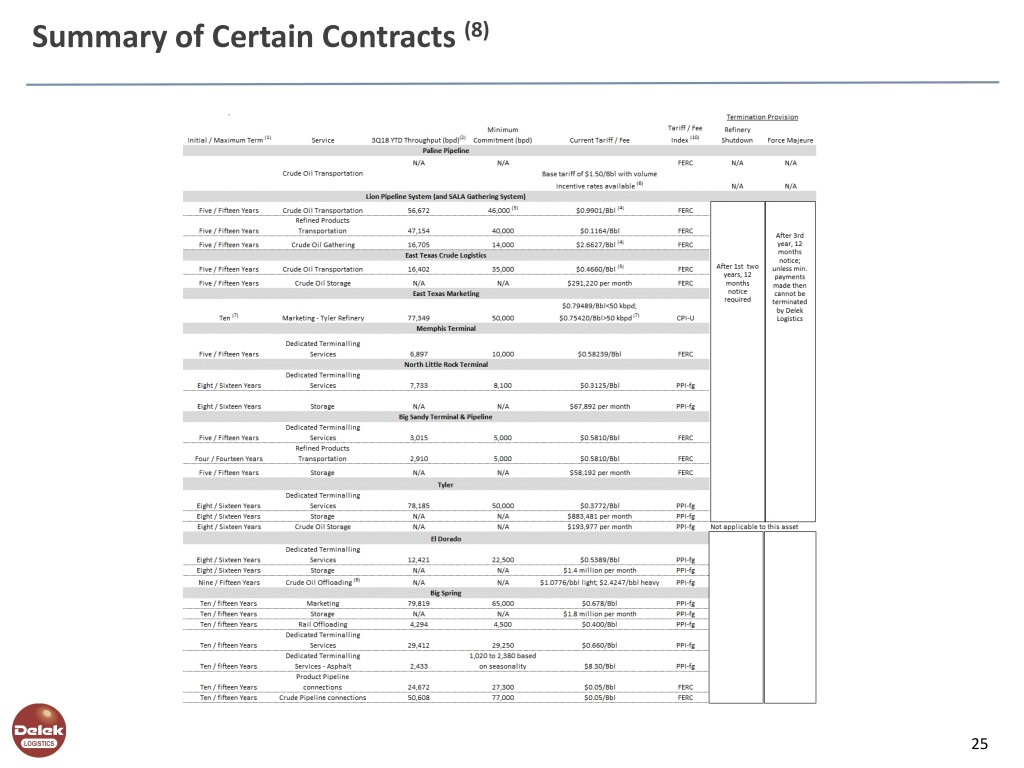
Summary of Certain Contracts (8) 25
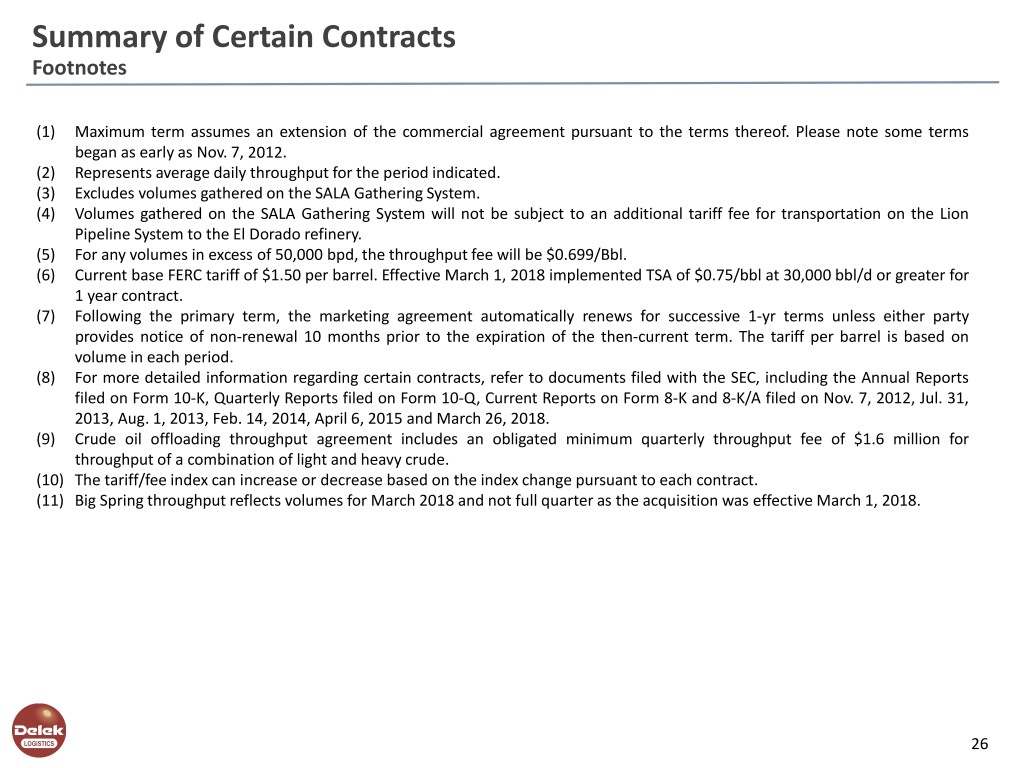
Summary of Certain Contracts Footnotes (1) Maximum term assumes an extension of the commercial agreement pursuant to the terms thereof. Please note some terms began as early as Nov. 7, 2012. (2) Represents average daily throughput for the period indicated. (3) Excludes volumes gathered on the SALA Gathering System. (4) Volumes gathered on the SALA Gathering System will not be subject to an additional tariff fee for transportation on the Lion Pipeline System to the El Dorado refinery. (5) For any volumes in excess of 50,000 bpd, the throughput fee will be $0.699/Bbl. (6) Current base FERC tariff of $1.50 per barrel. Effective March 1, 2018 implemented TSA of $0.75/bbl at 30,000 bbl/d or greater for 1 year contract. (7) Following the primary term, the marketing agreement automatically renews for successive 1-yr terms unless either party provides notice of non-renewal 10 months prior to the expiration of the then-current term. The tariff per barrel is based on volume in each period. (8) For more detailed information regarding certain contracts, refer to documents filed with the SEC, including the Annual Reports filed on Form 10-K, Quarterly Reports filed on Form 10-Q, Current Reports on Form 8-K and 8-K/A filed on Nov. 7, 2012, Jul. 31, 2013, Aug. 1, 2013, Feb. 14, 2014, April 6, 2015 and March 26, 2018. (9) Crude oil offloading throughput agreement includes an obligated minimum quarterly throughput fee of $1.6 million for throughput of a combination of light and heavy crude. (10) The tariff/fee index can increase or decrease based on the index change pursuant to each contract. (11) Big Spring throughput reflects volumes for March 2018 and not full quarter as the acquisition was effective March 1, 2018. 26
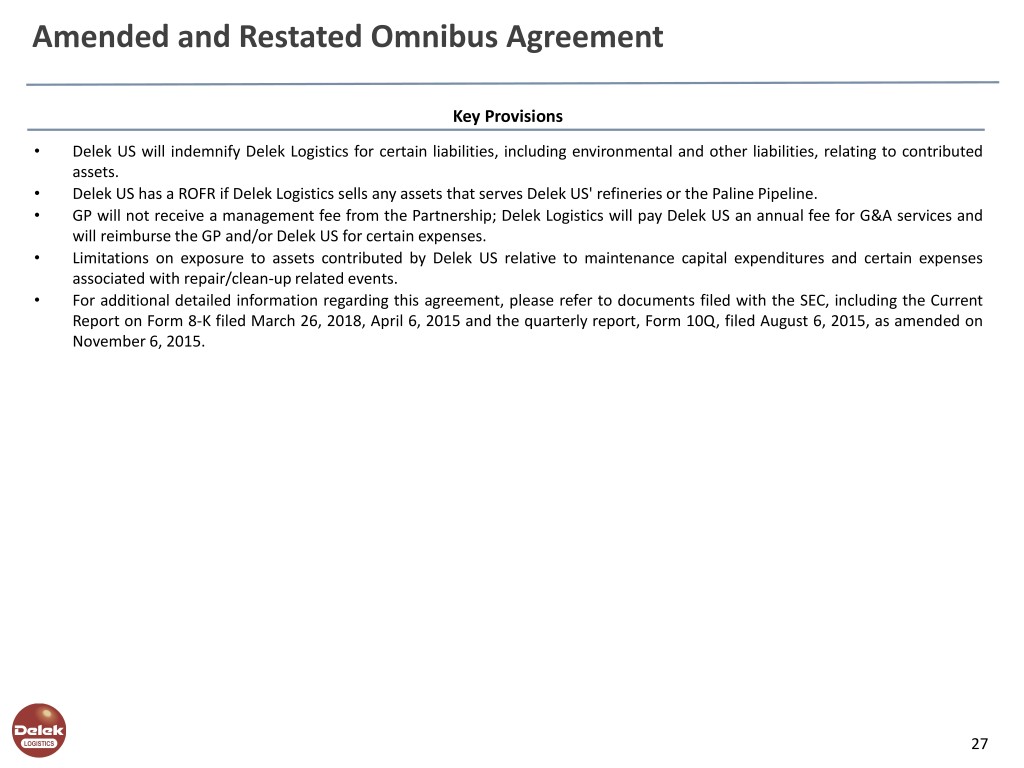
Amended and Restated Omnibus Agreement Key Provisions • Delek US will indemnify Delek Logistics for certain liabilities, including environmental and other liabilities, relating to contributed assets. • Delek US has a ROFR if Delek Logistics sells any assets that serves Delek US' refineries or the Paline Pipeline. • GP will not receive a management fee from the Partnership; Delek Logistics will pay Delek US an annual fee for G&A services and will reimburse the GP and/or Delek US for certain expenses. • Limitations on exposure to assets contributed by Delek US relative to maintenance capital expenditures and certain expenses associated with repair/clean-up related events. • For additional detailed information regarding this agreement, please refer to documents filed with the SEC, including the Current Report on Form 8-K filed March 26, 2018, April 6, 2015 and the quarterly report, Form 10Q, filed August 6, 2015, as amended on November 6, 2015. 27
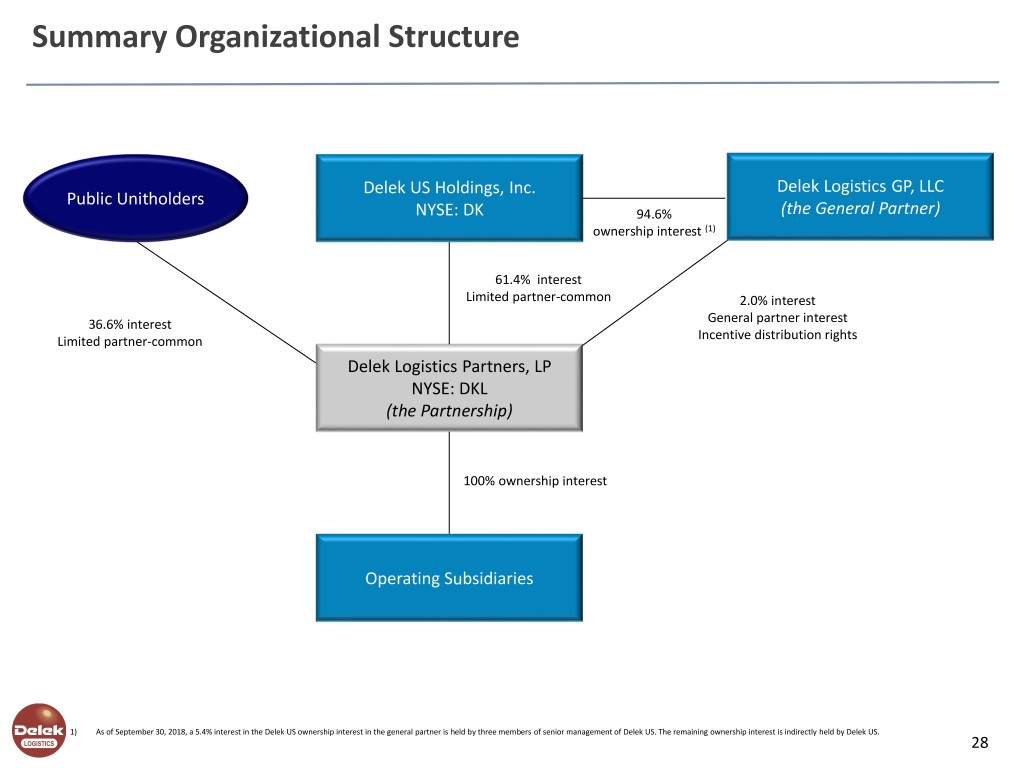
Summary Organizational Structure Delek US Holdings, Inc. Delek Logistics GP, LLC Public Unitholders NYSE: DK 94.6% (the General Partner) ownership interest (1) 61.4% interest Limited partner-common 2.0% interest 36.6% interest General partner interest Limited partner-common Incentive distribution rights Delek Logistics Partners, LP NYSE: DKL (the Partnership) 100% ownership interest Operating Subsidiaries 1) As of September 30, 2018, a 5.4% interest in the Delek US ownership interest in the general partner is held by three members of senior management of Delek US. The remaining ownership interest is indirectly held by Delek US. 28
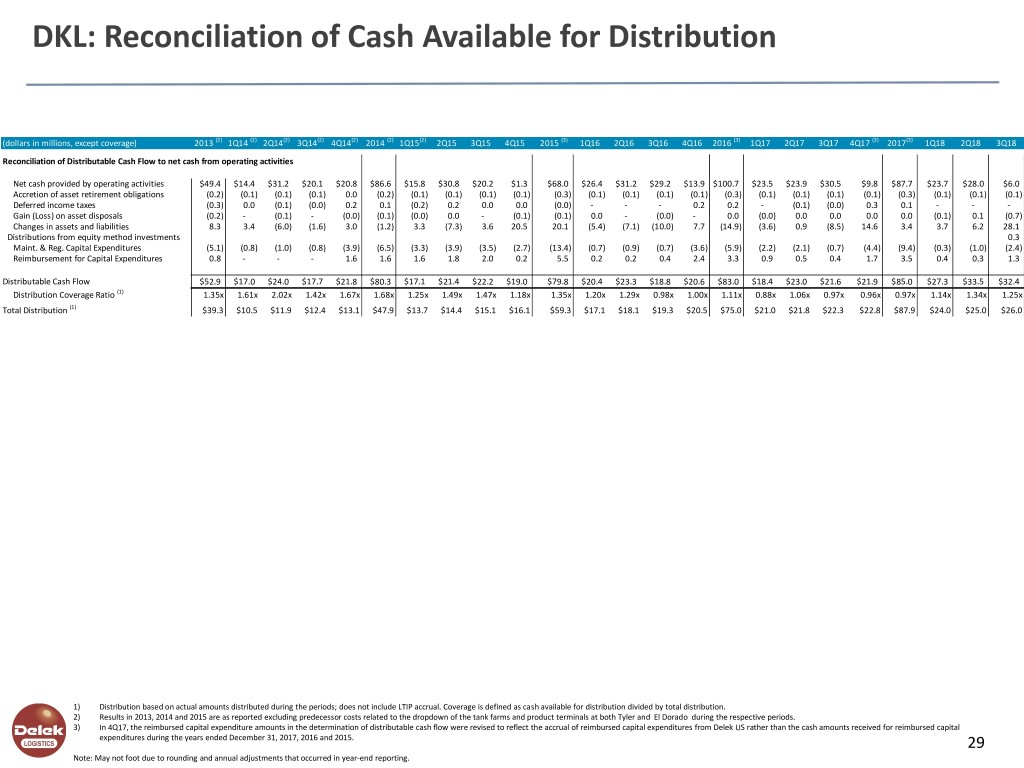
DKL: Reconciliation of Cash Available for Distribution (dollars in millions, except coverage) 2013 (2) 1Q14 (2) 2Q14(2) 3Q14(2) 4Q14(2) 2014 (2) 1Q15(2) 2Q15 3Q15 4Q15 2015 (3) 1Q16 2Q16 3Q16 4Q16 2016 (3) 1Q17 2Q17 3Q17 4Q17 (3) 2017(3) 1Q18 2Q18 3Q18 Reconciliation of Distributable Cash Flow to net cash from operating activities Net cash provided by operating activities $49.4 $14.4 $31.2 $20.1 $20.8 $86.6 $15.8 $30.8 $20.2 $1.3 $68.0 $26.4 $31.2 $29.2 $13.9 $100.7 $23.5 $23.9 $30.5 $9.8 $87.7 $23.7 $28.0 $6.0 Accretion of asset retirement obligations (0.2) (0.1) (0.1) (0.1) 0.0 (0.2) (0.1) (0.1) (0.1) (0.1) (0.3) (0.1) (0.1) (0.1) (0.1) (0.3) (0.1) (0.1) (0.1) (0.1) (0.3) (0.1) (0.1) (0.1) Deferred income taxes (0.3) 0.0 (0.1) (0.0) 0.2 0.1 (0.2) 0.2 0.0 0.0 (0.0) - - - 0.2 0.2 - (0.1) (0.0) 0.3 0.1 - - - Gain (Loss) on asset disposals (0.2) - (0.1) - (0.0) (0.1) (0.0) 0.0 - (0.1) (0.1) 0.0 - (0.0) - 0.0 (0.0) 0.0 0.0 0.0 0.0 (0.1) 0.1 (0.7) Changes in assets and liabilities 8.3 3.4 (6.0) (1.6) 3.0 (1.2) 3.3 (7.3) 3.6 20.5 20.1 (5.4) (7.1) (10.0) 7.7 (14.9) (3.6) 0.9 (8.5) 14.6 3.4 3.7 6.2 28.1 Distributions from equity method investments 0.3 Maint. & Reg. Capital Expenditures (5.1) (0.8) (1.0) (0.8) (3.9) (6.5) (3.3) (3.9) (3.5) (2.7) (13.4) (0.7) (0.9) (0.7) (3.6) (5.9) (2.2) (2.1) (0.7) (4.4) (9.4) (0.3) (1.0) (2.4) Reimbursement for Capital Expenditures 0.8 - - - 1.6 1.6 1.6 1.8 2.0 0.2 5.5 0.2 0.2 0.4 2.4 3.3 0.9 0.5 0.4 1.7 3.5 0.4 0.3 1.3 Distributable Cash Flow $52.9 $17.0 $24.0 $17.7 $21.8 $80.3 $17.1 $21.4 $22.2 $19.0 $79.8 $20.4 $23.3 $18.8 $20.6 $83.0 $18.4 $23.0 $21.6 $21.9 $85.0 $27.3 $33.5 $32.4 Distribution Coverage Ratio (1) 1.35x 1.61x 2.02x 1.42x 1.67x 1.68x 1.25x 1.49x 1.47x 1.18x 1.35x 1.20x 1.29x 0.98x 1.00x 1.11x 0.88x 1.06x 0.97x 0.96x 0.97x 1.14x 1.34x 1.25x Total Distribution (1) $39.3 $10.5 $11.9 $12.4 $13.1 $47.9 $13.7 $14.4 $15.1 $16.1 $59.3 $17.1 $18.1 $19.3 $20.5 $75.0 $21.0 $21.8 $22.3 $22.8 $87.9 $24.0 $25.0 $26.0 1) Distribution based on actual amounts distributed during the periods; does not include LTIP accrual. Coverage is defined as cash available for distribution divided by total distribution. 2) Results in 2013, 2014 and 2015 are as reported excluding predecessor costs related to the dropdown of the tank farms and product terminals at both Tyler and El Dorado during the respective periods. 3) In 4Q17, the reimbursed capital expenditure amounts in the determination of distributable cash flow were revised to reflect the accrual of reimbursed capital expenditures from Delek US rather than the cash amounts received for reimbursed capital expenditures during the years ended December 31, 2017, 2016 and 2015. 29 Note: May not foot due to rounding and annual adjustments that occurred in year-end reporting.
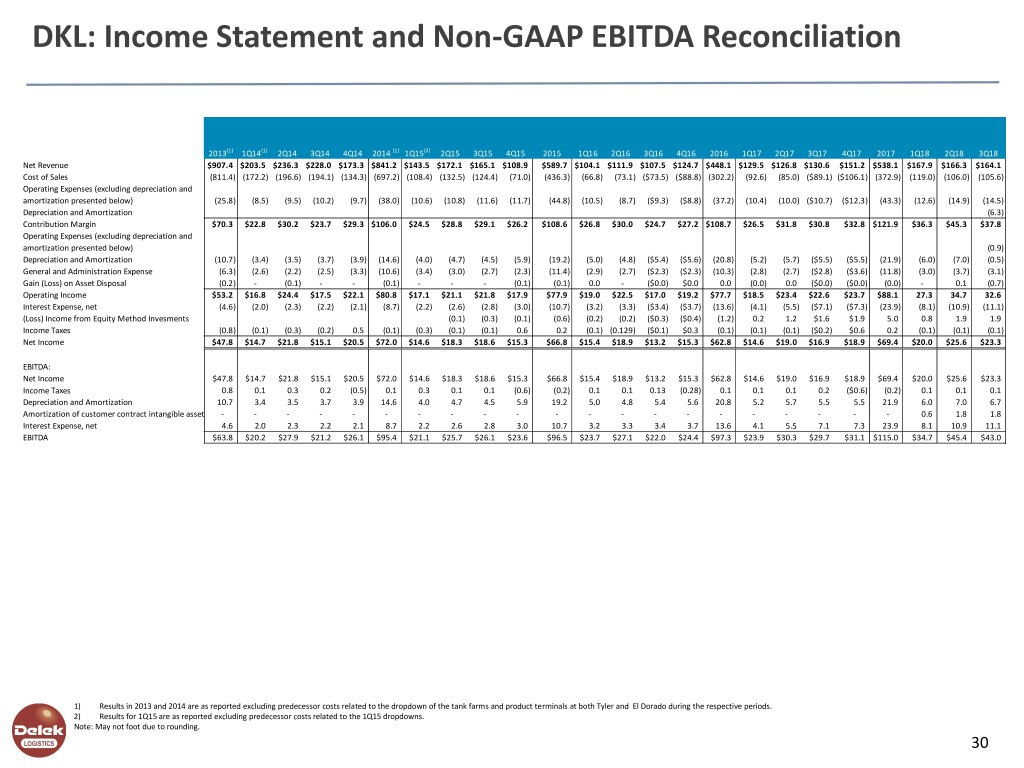
DKL: Income Statement and Non-GAAP EBITDA Reconciliation 2013(1) 1Q14(1) 2Q14 3Q14 4Q14 2014 (1) 1Q15(2) 2Q15 3Q15 4Q15 2015 1Q16 2Q16 3Q16 4Q16 2016 1Q17 2Q17 3Q17 4Q17 2017 1Q18 2Q18 3Q18 Net Revenue $907.4 $203.5 $236.3 $228.0 $173.3 $841.2 $143.5 $172.1 $165.1 $108.9 $589.7 $104.1 $111.9 $107.5 $124.7 $448.1 $129.5 $126.8 $130.6 $151.2 $538.1 $167.9 $166.3 $164.1 Cost of Sales (811.4) (172.2) (196.6) (194.1) (134.3) (697.2) (108.4) (132.5) (124.4) (71.0) (436.3) (66.8) (73.1) ($73.5) ($88.8) (302.2) (92.6) (85.0) ($89.1) ($106.1) (372.9) (119.0) (106.0) (105.6) Operating Expenses (excluding depreciation and amortization presented below) (25.8) (8.5) (9.5) (10.2) (9.7) (38.0) (10.6) (10.8) (11.6) (11.7) (44.8) (10.5) (8.7) ($9.3) ($8.8) (37.2) (10.4) (10.0) ($10.7) ($12.3) (43.3) (12.6) (14.9) (14.5) Depreciation and Amortization (6.3) Contribution Margin $70.3 $22.8 $30.2 $23.7 $29.3 $106.0 $24.5 $28.8 $29.1 $26.2 $108.6 $26.8 $30.0 $24.7 $27.2 $108.7 $26.5 $31.8 $30.8 $32.8 $121.9 $36.3 $45.3 $37.8 Operating Expenses (excluding depreciation and amortization presented below) (0.9) Depreciation and Amortization (10.7) (3.4) (3.5) (3.7) (3.9) (14.6) (4.0) (4.7) (4.5) (5.9) (19.2) (5.0) (4.8) ($5.4) ($5.6) (20.8) (5.2) (5.7) ($5.5) ($5.5) (21.9) (6.0) (7.0) (0.5) General and Administration Expense (6.3) (2.6) (2.2) (2.5) (3.3) (10.6) (3.4) (3.0) (2.7) (2.3) (11.4) (2.9) (2.7) ($2.3) ($2.3) (10.3) (2.8) (2.7) ($2.8) ($3.6) (11.8) (3.0) (3.7) (3.1) Gain (Loss) on Asset Disposal (0.2) - (0.1) - - (0.1) - - - (0.1) (0.1) 0.0 - ($0.0) $0.0 0.0 (0.0) 0.0 ($0.0) ($0.0) (0.0) - 0.1 (0.7) Operating Income $53.2 $16.8 $24.4 $17.5 $22.1 $80.8 $17.1 $21.1 $21.8 $17.9 $77.9 $19.0 $22.5 $17.0 $19.2 $77.7 $18.5 $23.4 $22.6 $23.7 $88.1 27.3 34.7 32.6 Interest Expense, net (4.6) (2.0) (2.3) (2.2) (2.1) (8.7) (2.2) (2.6) (2.8) (3.0) (10.7) (3.2) (3.3) ($3.4) ($3.7) (13.6) (4.1) (5.5) ($7.1) ($7.3) (23.9) (8.1) (10.9) (11.1) (Loss) Income from Equity Method Invesments (0.1) (0.3) (0.1) (0.6) (0.2) (0.2) ($0.3) ($0.4) (1.2) 0.2 1.2 $1.6 $1.9 5.0 0.8 1.9 1.9 Income Taxes (0.8) (0.1) (0.3) (0.2) 0.5 (0.1) (0.3) (0.1) (0.1) 0.6 0.2 (0.1) (0.129) ($0.1) $0.3 (0.1) (0.1) (0.1) ($0.2) $0.6 0.2 (0.1) (0.1) (0.1) Net Income $47.8 $14.7 $21.8 $15.1 $20.5 $72.0 $14.6 $18.3 $18.6 $15.3 $66.8 $15.4 $18.9 $13.2 $15.3 $62.8 $14.6 $19.0 $16.9 $18.9 $69.4 $20.0 $25.6 $23.3 EBITDA: Net Income $47.8 $14.7 $21.8 $15.1 $20.5 $72.0 $14.6 $18.3 $18.6 $15.3 $66.8 $15.4 $18.9 $13.2 $15.3 $62.8 $14.6 $19.0 $16.9 $18.9 $69.4 $20.0 $25.6 $23.3 Income Taxes 0.8 0.1 0.3 0.2 (0.5) 0.1 0.3 0.1 0.1 (0.6) (0.2) 0.1 0.1 0.13 (0.28) 0.1 0.1 0.1 0.2 ($0.6) (0.2) 0.1 0.1 0.1 Depreciation and Amortization 10.7 3.4 3.5 3.7 3.9 14.6 4.0 4.7 4.5 5.9 19.2 5.0 4.8 5.4 5.6 20.8 5.2 5.7 5.5 5.5 21.9 6.0 7.0 6.7 Amortization of customer contract intangible assets - - - - - - - - - - - - - - - - - - - - - 0.6 1.8 1.8 Interest Expense, net 4.6 2.0 2.3 2.2 2.1 8.7 2.2 2.6 2.8 3.0 10.7 3.2 3.3 3.4 3.7 13.6 4.1 5.5 7.1 7.3 23.9 8.1 10.9 11.1 EBITDA $63.8 $20.2 $27.9 $21.2 $26.1 $95.4 $21.1 $25.7 $26.1 $23.6 $96.5 $23.7 $27.1 $22.0 $24.4 $97.3 $23.9 $30.3 $29.7 $31.1 $115.0 $34.7 $45.4 $43.0 1) Results in 2013 and 2014 are as reported excluding predecessor costs related to the dropdown of the tank farms and product terminals at both Tyler and El Dorado during the respective periods. 2) Results for 1Q15 are as reported excluding predecessor costs related to the 1Q15 dropdowns. Note: May not foot due to rounding. 30
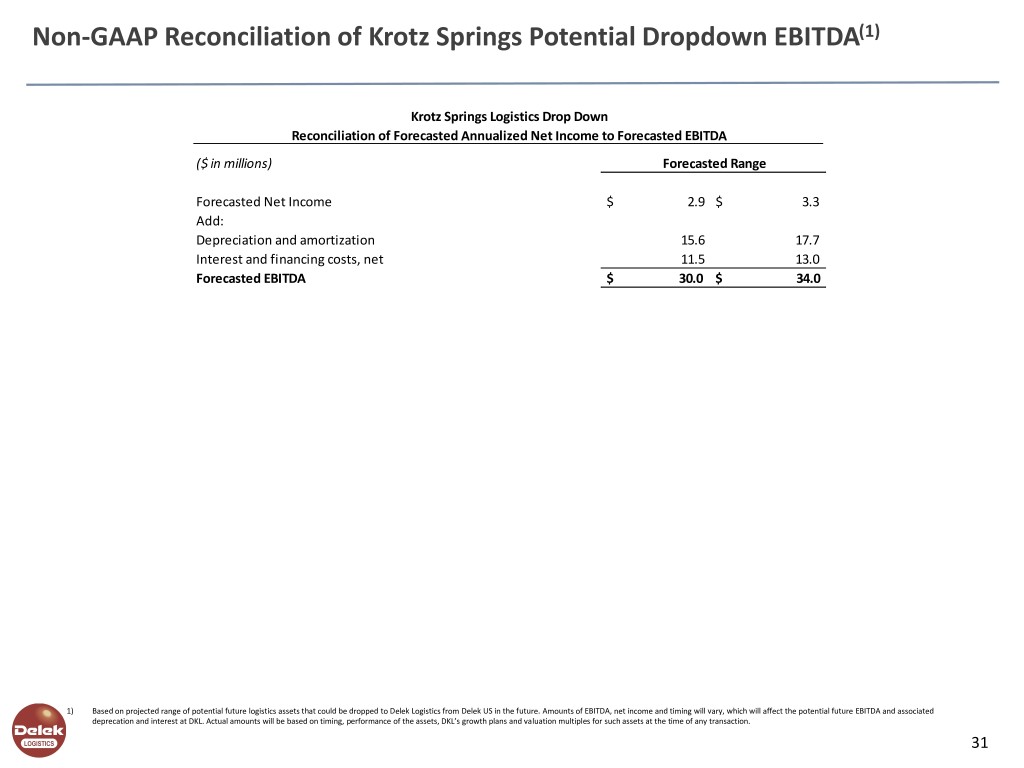
Non-GAAP Reconciliation of Krotz Springs Potential Dropdown EBITDA(1) Krotz Springs Logistics Drop Down Reconciliation of Forecasted Annualized Net Income to Forecasted EBITDA ($ in millions) Forecasted Range Forecasted Net Income $ 2.9 $ 3.3 Add: Depreciation and amortization 15.6 17.7 Interest and financing costs, net 11.5 13.0 Forecasted EBITDA $ 30.0 $ 34.0 1) Based on projected range of potential future logistics assets that could be dropped to Delek Logistics from Delek US in the future. Amounts of EBITDA, net income and timing will vary, which will affect the potential future EBITDA and associated deprecation and interest at DKL. Actual amounts will be based on timing, performance of the assets, DKL’s growth plans and valuation multiples for such assets at the time of any transaction. 31
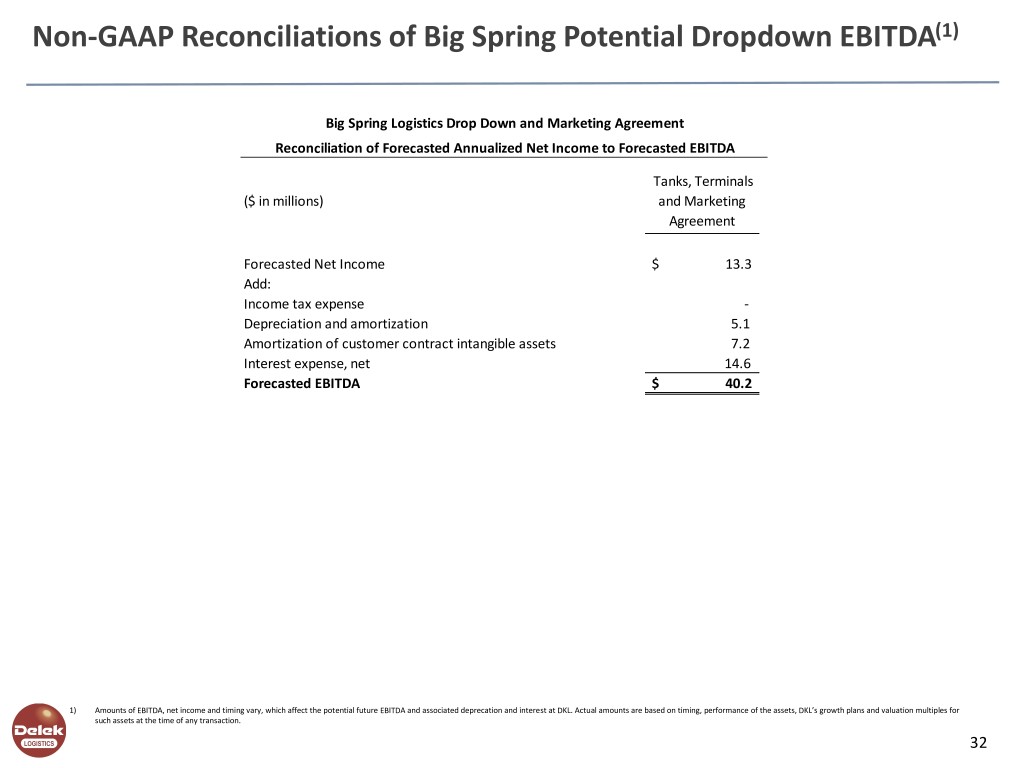
Non-GAAP Reconciliations of Big Spring Potential Dropdown EBITDA(1) Big Spring Logistics Drop Down and Marketing Agreement Reconciliation of Forecasted Annualized Net Income to Forecasted EBITDA Tanks, Terminals ($ in millions) and Marketing Agreement Forecasted Net Income $ 13.3 Add: Income tax expense - Depreciation and amortization 5.1 Amortization of customer contract intangible assets 7.2 Interest expense, net 14.6 Forecasted EBITDA $ 40.2 1) Amounts of EBITDA, net income and timing vary, which affect the potential future EBITDA and associated deprecation and interest at DKL. Actual amounts are based on timing, performance of the assets, DKL’s growth plans and valuation multiples for such assets at the time of any transaction. 32
Investor Relations Contact: Kevin Kremke Keith Johnson Executive Vice President and CFO Vice President of Investor Relations 615-224-1323 615-435-1366
