Attached files
| file | filename |
|---|---|
| 8-K - 8-K - Esquire Financial Holdings, Inc. | f8-k.htm |
Exhibit 99.1
| September 30, 2018 Financial Presentation NASDAQ: ESQ EXHIBIT 99.1 |
| 1 This presentation contains forward-looking statements within the meaning of the federal securities laws. Forward-looking statements express management’s current expectations, forecasts of future events or long-term goals and, by their nature, are subject to assumptions, risks and uncertainties, many of which are beyond the control of the Company. Actual results could differ materially from those indicated. These statements are often, but not always, made through the use of words or phrases such as “may,” “might,” “should,” “could,” “predict,” “potential,” “believe,” “expect,” “attribute,” “continue,” “will,” “anticipate,” “seek,” “estimate,” “intend,” “plan,” “projection,” “goal,” “target,” “outlook,” “aim,” “would,” “annualized” and “outlook,” or the negative version of those words or other comparable words or phrases of a future or forward-looking nature. Forward-looking statements speak only as of the date they are made and are inherently subject to uncertainties and changes in circumstances, including those described under the heading “Risk Factors” in the Company’s 10K, filed with the Securities and Exchange Commission (“SEC”). Forward-looking statements are not guarantees of future performance and should not be relied upon as representing management’s views as of any subsequent date. The Company undertakes no obligation to update forward-looking statements, whether as a result of new information, future events or otherwise, except as may be required by law. Except as otherwise indicated, this presentation speaks as of the date hereof. The delivery of this presentation shall not, under any circumstances, create any implication there has been no change in the affairs of the Company after the date hereof. This presentation includes industry and market data that we obtained from periodic industry publications, third-party studies and surveys. Industry publications and surveys generally state that the information contained therein has been obtained from sources believed to be reliable. Although we believe the industry and market data to be reliable as of the date of this presentation, this information could prove to be inaccurate. Industry and market data could be wrong because of the method by which sources obtained their data and because information cannot always be verified with complete certainty due to the limits on the availability and reliability of raw data, the voluntary nature of the data gathering process and other limitations and uncertainties. In addition, we do not know all of the assumptions regarding general economic conditions or growth that were used in preparing the forecasts from the sources relied upon or cited herein. This presentation contains financial information determined by methods other than in accordance with accounting principles generally accepted in the United States of America (“GAAP”). Management uses these “non-GAAP” measures in its analysis of our performance. Management believes that these non-GAAP financial measures allows for better comparability with prior periods, as well as with peers in the industry who provide a similar presentation, and provide a greater understanding of our ongoing operations. These disclosures should not be viewed as a substitute for operating results determined in accordance with GAAP, nor are they necessarily comparable to non-GAAP performance measures that may be presented by other companies. A reconciliation of the non-GAAP measures used in this presentation to the most directly comparable GAAP measures is provided in the Appendix to this presentation. Forward-Looking Disclosures |
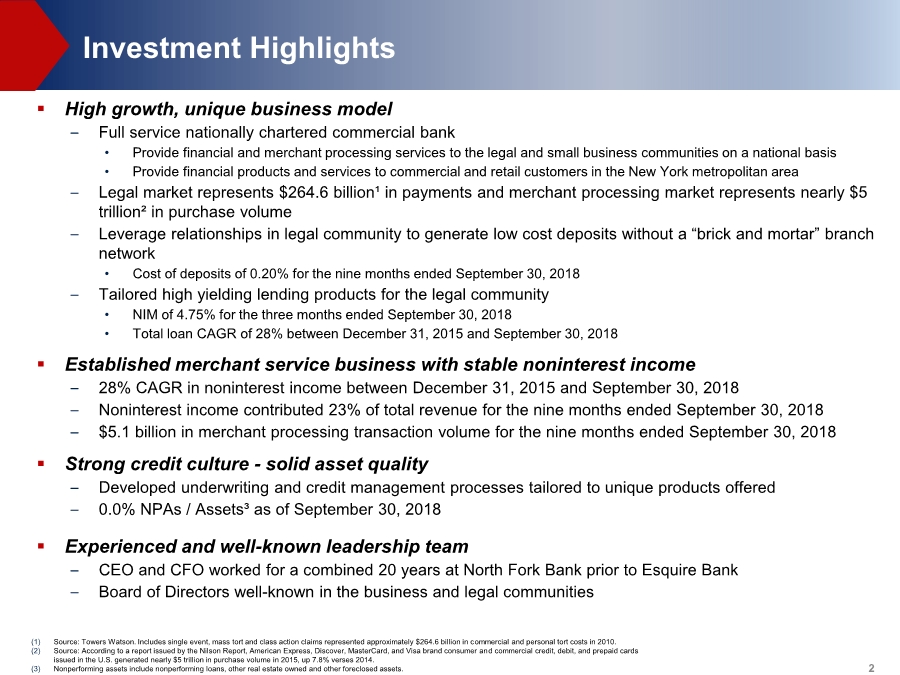
| 2 ▪ High growth, unique business model – Full service nationally chartered commercial bank • Provide financial and merchant processing services to the legal and small business communities on a national basis • Provide financial products and services to commercial and retail customers in the New York metropolitan area – Legal market represents $264.6 billion¹ in payments and merchant processing market represents nearly $5 trillion² in purchase volume – Leverage relationships in legal community to generate low cost deposits without a “brick and mortar” branch network • Cost of deposits of 0.20% for the nine months ended September 30, 2018 – Tailored high yielding lending products for the legal community • NIM of 4.75% for the three months ended September 30, 2018 • Total loan CAGR of 28% between December 31, 2015 and September 30, 2018 ▪ Established merchant service business with stable noninterest income – 28% CAGR in noninterest income between December 31, 2015 and September 30, 2018 – Noninterest income contributed 23% of total revenue for the nine months ended September 30, 2018 – $5.1 billion in merchant processing transaction volume for the nine months ended September 30, 2018 ▪ Strong credit culture - solid asset quality – Developed underwriting and credit management processes tailored to unique products offered – 0.0% NPAs / Assets³ as of September 30, 2018 ▪ Experienced and well-known leadership team – CEO and CFO worked for a combined 20 years at North Fork Bank prior to Esquire Bank – Board of Directors well-known in the business and legal communities (1) Source: Towers Watson. Includes single event, mass tort and class action claims represented approximately $264.6 billion in commercial and personal tort costs in 2010. (2) Source: According to a report issued by the Nilson Report, American Express, Discover, MasterCard, and Visa brand consumer and commercial credit, debit, and prepaid cards issued in the U.S. generated nearly $5 trillion in purchase volume in 2015, up 7.8% verses 2014. (3) Nonperforming assets include nonperforming loans, other real estate owned and other foreclosed assets. Investment Highlights |
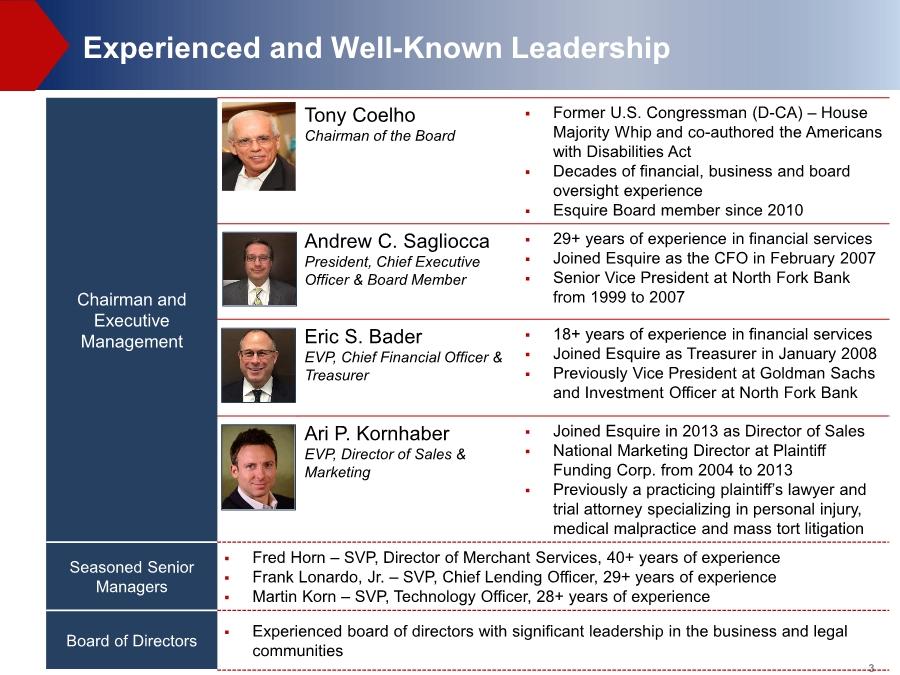
| 3 Chairman and Executive Management Tony Coelho Chairman of the Board ▪ Former U.S. Congressman (D-CA) – House Majority Whip and co-authored the Americans with Disabilities Act ▪ Decades of financial, business and board oversight experience ▪ Esquire Board member since 2010 Andrew C. Sagliocca President, Chief Executive Officer & Board Member ▪ 29+ years of experience in financial services ▪ Joined Esquire as the CFO in February 2007 ▪ Senior Vice President at North Fork Bank from 1999 to 2007 Eric S. Bader EVP, Chief Financial Officer & Treasurer ▪ 18+ years of experience in financial services ▪ Joined Esquire as Treasurer in January 2008 ▪ Previously Vice President at Goldman Sachs and Investment Officer at North Fork Bank Ari P. Kornhaber EVP, Director of Sales & Marketing ▪ Joined Esquire in 2013 as Director of Sales ▪ National Marketing Director at Plaintiff Funding Corp. from 2004 to 2013 ▪ Previously a practicing plaintiff’s lawyer and trial attorney specializing in personal injury, medical malpractice and mass tort litigation Seasoned Senior Managers ▪ Fred Horn – SVP, Director of Merchant Services, 40+ years of experience ▪ Frank Lonardo, Jr. – SVP, Chief Lending Officer, 29+ years of experience ▪ Martin Korn – SVP, Technology Officer, 28+ years of experience Board of Directors ▪ Experienced board of directors with significant leadership in the business and legal communities Experienced and Well-Known Leadership |
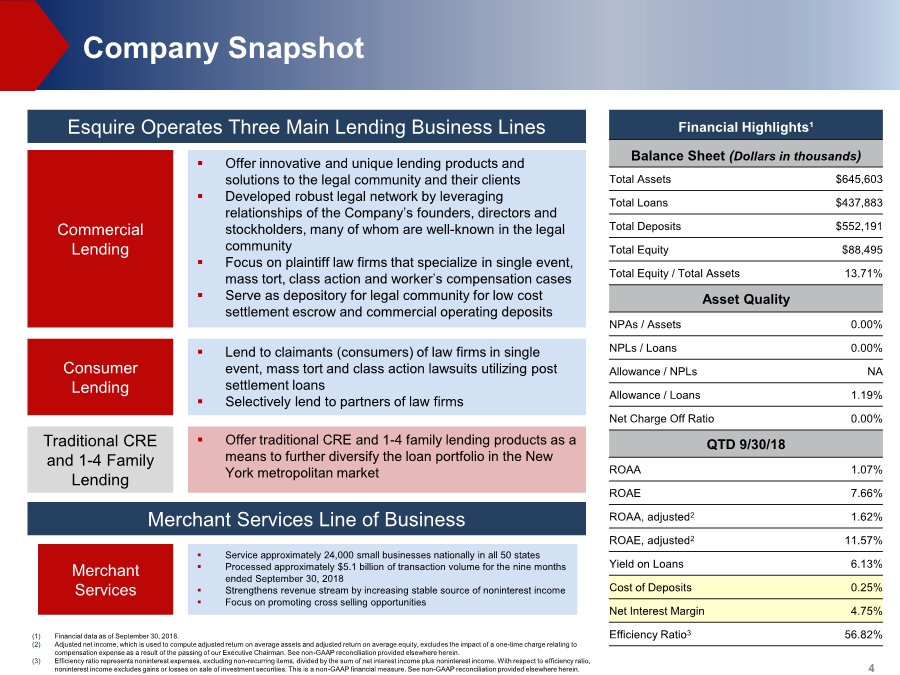
| 4 Company Snapshot (1) Financial data as of September 30, 2018. (2) Adjusted net income, which is used to compute adjusted return on average assets and adjusted return on average equity, excludes the impact of a one-time charge relating to compensation expense as a result of the passing of our Executive Chairman. See non-GAAP reconciliation provided elsewhere herein. (3) Efficiency ratio represents noninterest expenses, excluding non-recurring items, divided by the sum of net interest income plus noninterest income. With respect to efficiency ratio, noninterest income excludes gains or losses on sale of investment securities. This is a non-GAAP financial measure. See non-GAAP reconciliation provided elsewhere herein. Esquire Operates Three Main Lending Business Lines Commercial Lending Consumer Lending Traditional CRE and 1-4 Family Lending Merchant Services Line of Business Merchant Services ▪ Lend to claimants (consumers) of law firms in single event, mass tort and class action lawsuits utilizing post settlement loans ▪ Selectively lend to partners of law firms ▪ Offer innovative and unique lending products and solutions to the legal community and their clients ▪ Developed robust legal network by leveraging relationships of the Company’s founders, directors and stockholders, many of whom are well-known in the legal community ▪ Focus on plaintiff law firms that specialize in single event, mass tort, class action and worker’s compensation cases ▪ Serve as depository for legal community for low cost settlement escrow and commercial operating deposits ▪ Offer traditional CRE and 1-4 family lending products as a means to further diversify the loan portfolio in the New York metropolitan market ▪ Service approximately 24,000 small businesses nationally in all 50 states ▪ Processed approximately $5.1 billion of transaction volume for the nine months ended September 30, 2018 ▪ Strengthens revenue stream by increasing stable source of noninterest income ▪ Focus on promoting cross selling opportunities Financial Highlights¹ Balance Sheet (Dollars in thousands) Total Assets $645,603 Total Loans $437,883 Total Deposits $552,191 Total Equity $88,495 Total Equity / Total Assets 13.71% Asset Quality NPAs / Assets 0.00% NPLs / Loans 0.00% Allowance / NPLs NA Allowance / Loans 1.19% Net Charge Off Ratio 0.00% QTD 9/30/18 ROAA 1.07% ROAE 7.66% ROAA, adjusted2 1.62% ROAE, adjusted2 11.57% Yield on Loans 6.13% Cost of Deposits 0.25% Net Interest Margin 4.75% Efficiency Ratio3 56.82% |
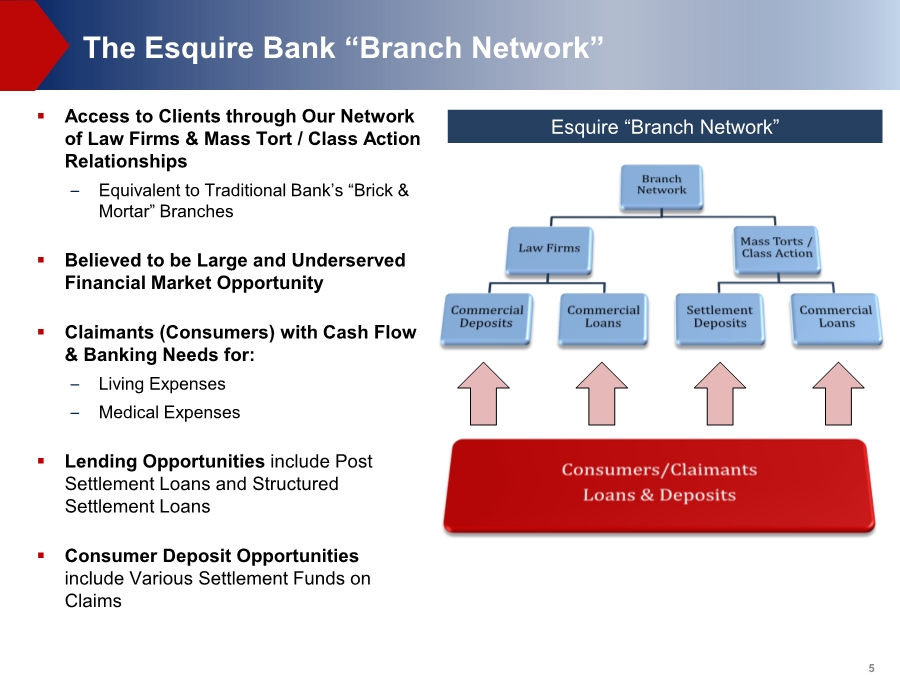
| 5 ▪ Access to Clients through Our Network of Law Firms & Mass Tort / Class Action Relationships – Equivalent to Traditional Bank’s “Brick & Mortar” Branches ▪ Believed to be Large and Underserved Financial Market Opportunity ▪ Claimants (Consumers) with Cash Flow & Banking Needs for: – Living Expenses – Medical Expenses ▪ Lending Opportunities include Post Settlement Loans and Structured Settlement Loans ▪ Consumer Deposit Opportunities include Various Settlement Funds on Claims The Esquire Bank “Branch Network” Esquire “Branch Network” |
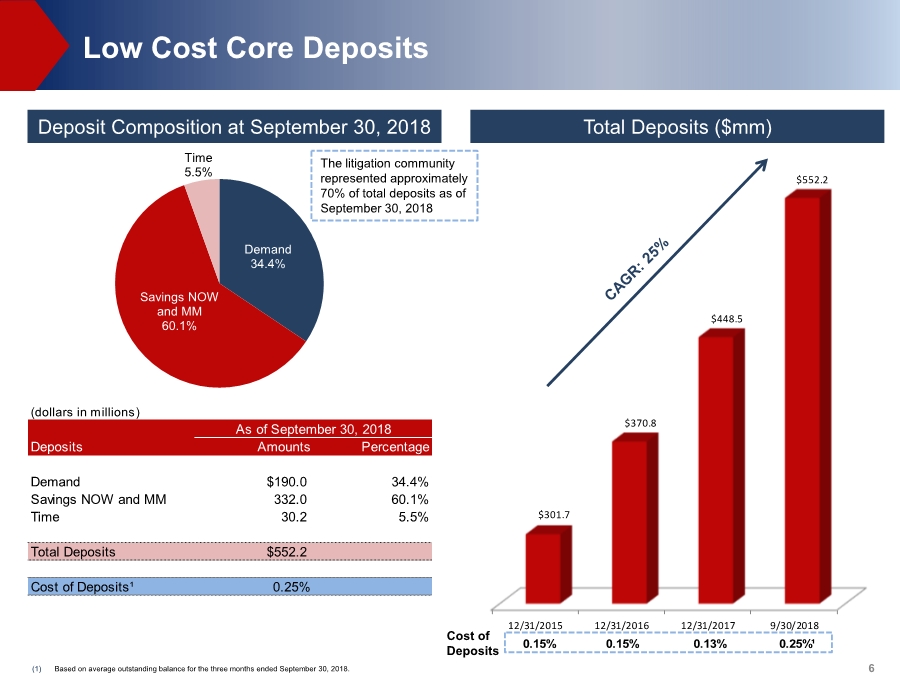
| 6 Total Deposits ($mm) (1) Based on average outstanding balance for the three months ended September 30, 2018. Low Cost Core Deposits 0bps0bps0bps 0bps 0bps Deposit Composition at September 30, 2018 12/31/2015 12/31/2016 12/31/2017 9/30/2018 $301.7 $370.8 $448.5 $552.2 Cost of Deposits The litigation community represented approximately 70% of total deposits as of September 30, 2018 (dollars in millions) As of September 30, 2018 Deposits Amounts Percentage Demand $190.0 34.4% Savings NOW and MM 332.0 60.1% Time 30.2 5.5% Total Deposits $552.2 Cost of Deposits¹ 0.25% 0.15% 0.15% 0.13% 0.25%¹ Demand 34.4% Savings NOW and MM 60.1% Time 5.5% |
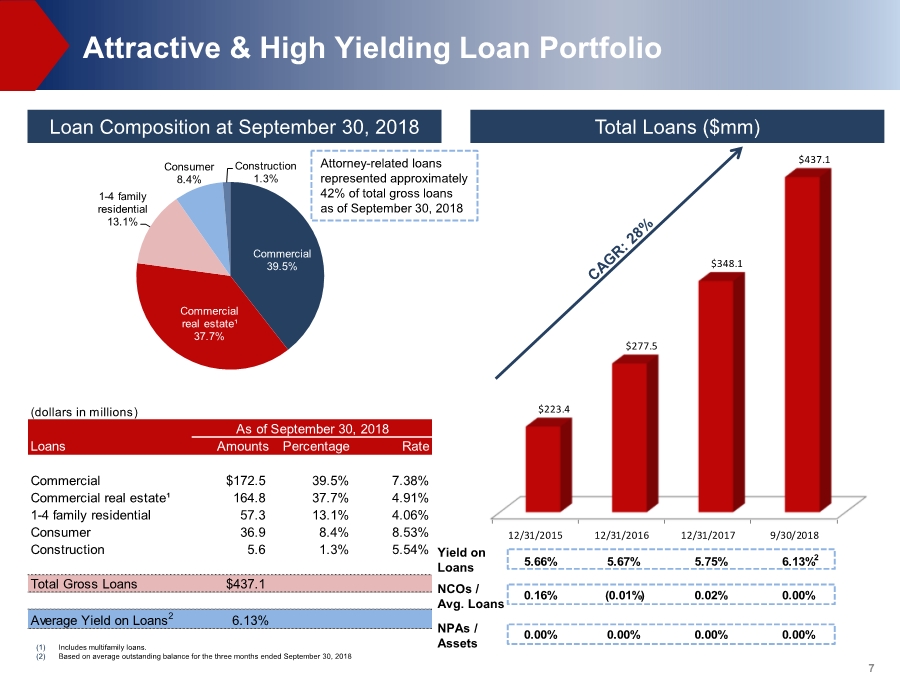
| 7 12/31/2015 12/31/2016 12/31/2017 9/30/2018 $223.4 $277.5 $348.1 $437.1 0.16% (0.01%) 0.02% 0.00% Loan Composition at September 30, 2018 5.66% 5.67% 5.75% 6.13%2 Attractive & High Yielding Loan Portfolio (1) Includes multifamily loans. (2) Based on average outstanding balance for the three months ended September 30, 2018 Total Loans ($mm) Commercial 39.5% Commercial real estate¹ 37.7% 1-4 family residential 13.1% Consumer 8.4% Construction 1.3% Yield on Loans (dollars in millions) As of September 30, 2018 Loans Amounts Percentage Rate Commercial $172.5 39.5% 7.38% Commercial real estate¹ 164.8 37.7% 4.91% 1-4 family residential 57.3 13.1% 4.06% Consumer 36.9 8.4% 8.53% Construction 5.6 1.3% 5.54% Total Gross Loans $437.1 Average Yield on Loans2 6.13% Attorney-related loans represented approximately 42% of total gross loans as of September 30, 2018 NCOs / Avg. Loans NPAs / Assets 0.00% 0.00% 0.00% 0.00% |
| 8 ▪ Commercial and Consumer Loans to the Litigation Market – Enhance overall yield with attractive risk adjusted returns – Generate low cost core deposits without branch network – Generate off balance sheet funds/sweeps and customer fee income ▪ Diversified and Stable Business Model – Simple strategy –“Listen” to the market and tailor products and services to meet needs – Distinguishes Esquire from other “one product fits all” financial institutions – Fragmented lending market – competing with finance companies ▪ Strong Distribution Network – Founders and Board members – Investors and customers – Informal affiliations with national and state trial associations ▪ Strong Credit Quality – Traditional commercial underwriting (tax returns, PFS, PG’s, cash flows) – Independent case inventory evaluation for “borrowing base” – UCC – 1 on all assets including case inventory – No NPAs¹ as of September 30, 2018 (1) Nonperforming assets include nonperforming loans, other real estate owned and other foreclosed assets. Tailored Products & Solutions to the Legal Community on a National Basis |
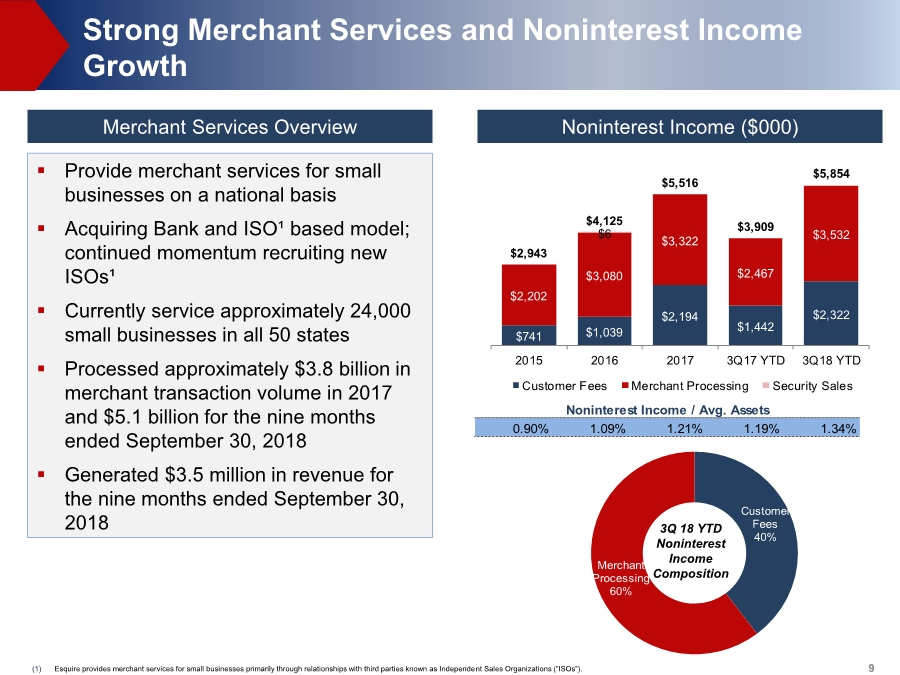
| 9(1) Esquire provides merchant services for small businesses primarily through relationships with third parties known as Independent Sales Organizations (“ISOs”). Strong Merchant Services and Noninterest Income Growth ▪ Provide merchant services for small businesses on a national basis ▪ Acquiring Bank and ISO¹ based model; continued momentum recruiting new ISOs¹ ▪ Currently service approximately 24,000 small businesses in all 50 states ▪ Processed approximately $3.8 billion in merchant transaction volume in 2017 and $5.1 billion for the nine months ended September 30, 2018 ▪ Generated $3.5 million in revenue for the nine months ended September 30, 2018 $741 $1,039 $2,194 $1,442 $2,322 $2,202 $3,080 $3,322 $2,467 $3,532 $2,943 $4,125 $5,516 $3,909 $5,854 $6 2015 2016 2017 3Q17 YTD 3Q18 YTD Customer Fees Merchant Processing Security Sales Noninterest Income / Avg. Assets 0.90% 1.09% 1.21% 1.19% 1.34% Customer Fees 40% Merchant Processing 60% 3Q 18 YTD Noninterest Income Composition Merchant Services Overview Noninterest Income ($000) |
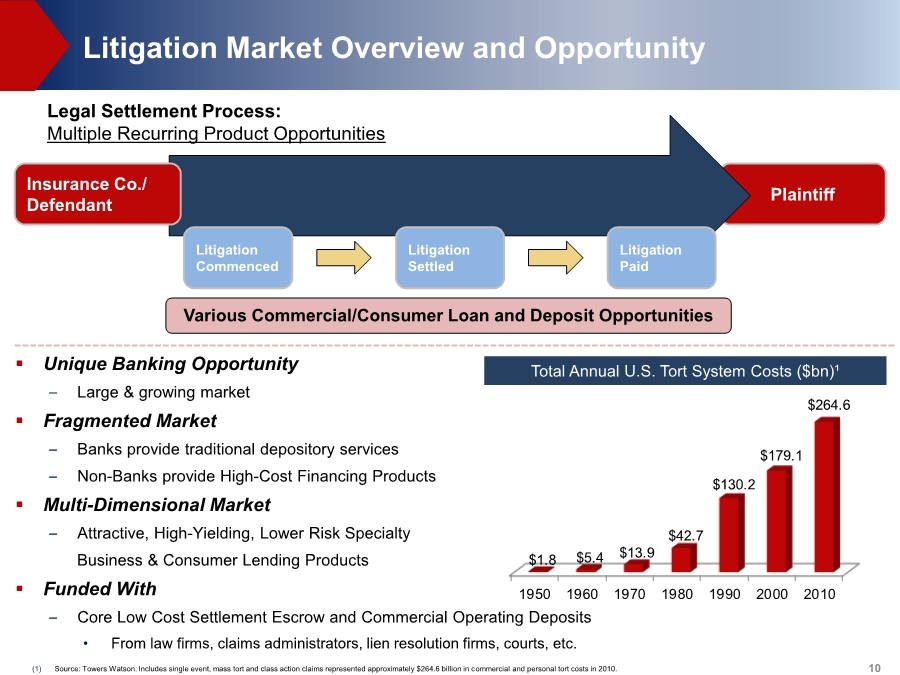
| 10 ▪ Unique Banking Opportunity – Large & growing market ▪ Fragmented Market – Banks provide traditional depository services – Non-Banks provide High-Cost Financing Products ▪ Multi-Dimensional Market – Attractive, High-Yielding, Lower Risk Specialty Business & Consumer Lending Products ▪ Funded With – Core Low Cost Settlement Escrow and Commercial Operating Deposits • From law firms, claims administrators, lien resolution firms, courts, etc. (1) Source: Towers Watson. Includes single event, mass tort and class action claims represented approximately $264.6 billion in commercial and personal tort costs in 2010. Litigation Market Overview and Opportunity Total Annual U.S. Tort System Costs ($bn)¹ 1950 1960 1970 1980 1990 2000 2010 $1.8 $5.4 $13.9 $42.7 $130.2 $179.1 $264.6 $264.6 Billion¹ Annual Flow of Funds Plaintiff Legal Settlement Process: Multiple Recurring Product Opportunities Various Commercial/Consumer Loan and Deposit Opportunities Insurance Co./ Defendant Litigation Commenced Litigation Settled Litigation Paid |
| Appendix |

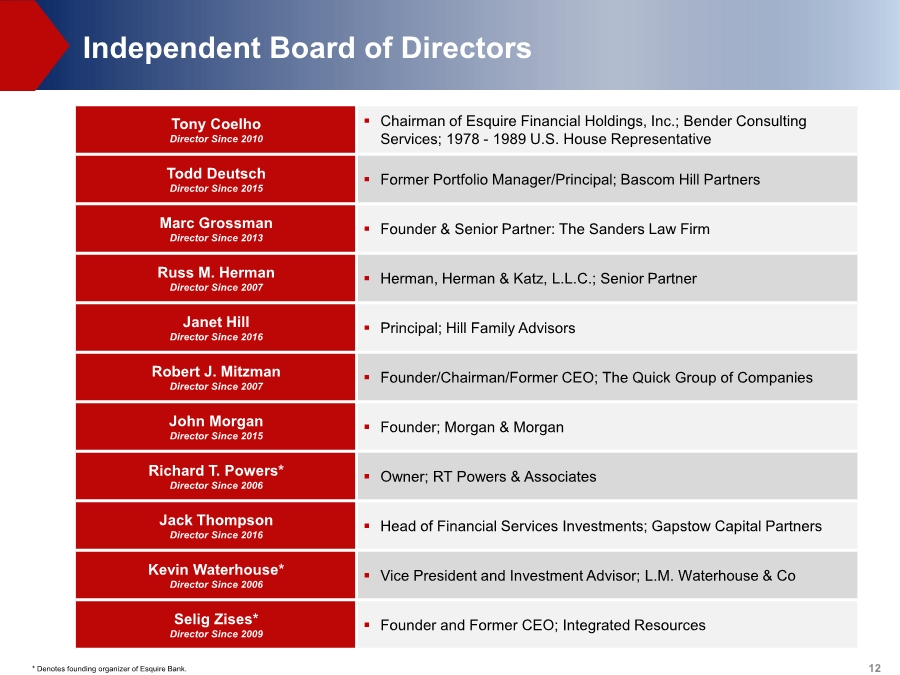
| 12* Denotes founding organizer of Esquire Bank. Independent Board of Directors Tony Coelho Director Since 2010 ▪ Chairman of Esquire Financial Holdings, Inc.; Bender Consulting Services; 1978 - 1989 U.S. House Representative Todd Deutsch Director Since 2015 ▪ Former Portfolio Manager/Principal; Bascom Hill Partners Marc Grossman Director Since 2013 ▪ Founder & Senior Partner: The Sanders Law Firm Russ M. Herman Director Since 2007 ▪ Herman, Herman & Katz, L.L.C.; Senior Partner Janet Hill Director Since 2016 ▪ Principal; Hill Family Advisors Robert J. Mitzman Director Since 2007 ▪ Founder/Chairman/Former CEO; The Quick Group of Companies John Morgan Director Since 2015 ▪ Founder; Morgan & Morgan Richard T. Powers* Director Since 2006 ▪ Owner; RT Powers & Associates Jack Thompson Director Since 2016 ▪ Head of Financial Services Investments; Gapstow Capital Partners Kevin Waterhouse* Director Since 2006 ▪ Vice President and Investment Advisor; L.M. Waterhouse & Co Selig Zises* Director Since 2009 ▪ Founder and Former CEO; Integrated Resources |
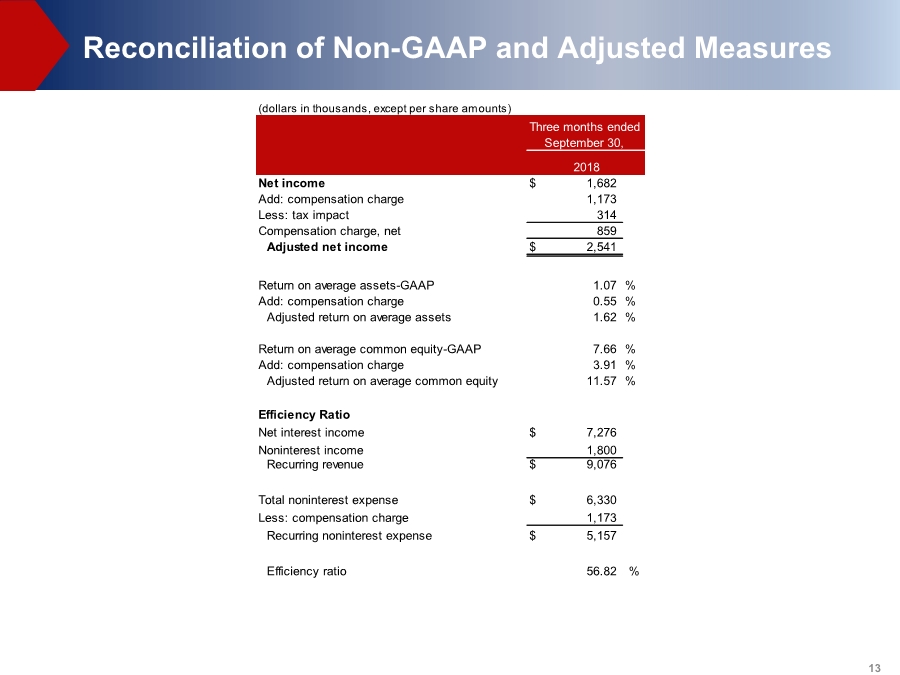
| 13 Reconciliation of Non-GAAP and Adjusted Measures (dollars in thousands, except per share amounts) Net income $ 1,682 Add: compensation charge 1,173 Less: tax impact 314 Compensation charge, net 859 Adjusted net income $ 2,541 Return on average assets-GAAP 1.07 % Add: compensation charge 0.55 % Adjusted return on average assets 1.62 % Return on average common equity-GAAP 7.66 % Add: compensation charge 3.91 % Adjusted return on average common equity 11.57 % Efficiency Ratio Net interest income $ 7,276 Noninterest income 1,800 Recurring revenue $ 9,076 Total noninterest expense $ 6,330 Less: compensation charge 1,173 Recurring noninterest expense $ 5,157 Efficiency ratio 56.82 % Three months ended 2018 September 30, |