Attached files
| file | filename |
|---|---|
| EX-10.3 - CFFN EXHIBIT 10.3 DEFERRED INCENTIVE BONUS PLAN - Capitol Federal Financial, Inc. | cffn-093018xex103.htm |
| EX-32 - CFFN EXHIBIT 32 CERTIFICATION SECTION 1350 - Capitol Federal Financial, Inc. | cffn-093018xex32.htm |
| EX-31.2 - CFFN EXHIBIT 31.2 CERTIFICATION - Capitol Federal Financial, Inc. | cffn-093018xex312.htm |
| EX-31.1 - CFFN EXHIBIT 31.1 CERTIFICATION - Capitol Federal Financial, Inc. | cffn-093018xex311.htm |
| EX-23 - CFFN EXHIBIT 23 CONSENT OF AUDITORS - Capitol Federal Financial, Inc. | cffn-093018xex23.htm |
| EX-21 - CFFN EXHIBIT 21 SUBSIDIARIES OF THE REGISTRANT - Capitol Federal Financial, Inc. | cffn-093018xex21.htm |
| EX-10.6 - CFFN EXHIBIT 10.6 DESCRIPTION OF DIRECTOR FEE ARRANGEMENTS - Capitol Federal Financial, Inc. | cffn-093018xex106.htm |
| EX-10.1(V) - CFFN EXHIBIT 10.1(V) EMPLOYMENT AGREEMENT - Capitol Federal Financial, Inc. | cffn-093018xex101v.htm |
| EX-10.1(IV) - CFFN EXHIBIT 10.1(IV) CHANGE OF CONTROL AGREEMENT - Capitol Federal Financial, Inc. | cffn-093018xex101iv.htm |
UNITED STATES SECURITIES AND EXCHANGE COMMISSION
Washington, D.C. 20549
Form 10-K
(Mark One)
þ ANNUAL REPORT PURSUANT TO SECTION 13 OR 15(d)
OF THE SECURITIES EXCHANGE ACT OF 1934
For the fiscal year ended September 30, 2018
or
¨ TRANSITION REPORT PURSUANT TO SECTION 13 OR 15 (d)
OF THE SECURITIES EXCHANGE ACT OF 1934
For the transition period from __ to __
Commission file number: 001-34814
________________________________
Capitol Federal Financial, Inc.
(Exact name of registrant as specified in its charter)
Maryland | 27-2631712 |
(State or other jurisdiction of incorporation or organization) | (I.R.S. Employer Identification No.) |
700 South Kansas Avenue, Topeka, Kansas | 66603 |
(Address of principal executive offices) | (Zip Code) |
Registrant's telephone number, including area code:
(785) 235-1341
Securities registered pursuant to Section 12(b) of the Act: | |
Common Stock, par value $0.01 per share | The NASDAQ Stock Market LLC |
(Title of Class) | (Name of Each Exchange on Which Registered) |
Securities registered pursuant to Section 12(g) of the Act: None
Indicate by check mark if the registrant is a well-known seasoned issuer, as defined in Rule 405 of the Securities Act. Yes þ No ¨
Indicate by check mark if the registrant is not required to file reports pursuant to Section 13 or Section 15(d) of the Act. Yes ¨ No þ
Indicate by check mark whether the registrant (1) has filed all reports required to be filed by Section 13 or 15(d) of the Securities Exchange Act of 1934 during the preceding 12 months (or for such shorter period that the registrant was required to file such reports), and (2) has been subject to such filing requirements for the past 90 days. Yes þ No ¨
Indicate by check mark whether the registrant has submitted electronically every Interactive Data File required to be submitted pursuant to Rule 405 of Regulation S-T (§ 232.405 of this chapter) during the preceding 12 months (or for such shorter period that the registrant was required to submit such files). Yes þ No ¨
Indicate by check mark if disclosure of delinquent filers pursuant to Item 405 of Regulation S-K is not contained herein, and will not be contained, to the best of the registrant's knowledge, in definitive proxy or information statements incorporated by reference in Part III of this Form 10-K or any amendment to this Form 10-K. ¨
Indicate by check mark whether the registrant is a large accelerated filer, an accelerated filer, a non-accelerated filer, a smaller reporting company, or an emerging growth company. See the definitions of "large accelerated filer," "accelerated filer," "smaller reporting company," and "emerging growth company" in Rule 12b-2 of the Exchange Act.
Large accelerated filer þ | Accelerated filer ¨ | Non-accelerated filer ¨ | |
Smaller Reporting Company ¨ | Emerging Growth Company ¨ | ||
If an emerging growth company, indicate by check mark if the registrant has elected not to use the extended transition period for complying with any new or revised financial accounting standards provided pursuant to Section 13(a) of the Exchange Act. ¨ | |||
Indicate by check mark whether the registrant is a shell company (as defined in Rule 12b-2 of the Act). Yes ¨ No þ
The aggregate market value of the voting and non-voting common stock held by non-affiliates of the registrant, computed by reference to the average of the closing bid and asked price of such stock on the NASDAQ Stock Market as of March 31, 2018, was $1.68 billion.
As of November 21, 2018, there were issued and outstanding 141,238,239 shares of the Registrant's common stock.
DOCUMENTS INCORPORATED BY REFERENCE
Part III of Form 10-K - Portions of the proxy statement for the Annual Meeting of Stockholders for the year ended September 30, 2018.
Page No. | |||
PART I | Item 1. | ||
Item 1A. | |||
Item 1B. | |||
Item 2. | |||
Item 3. | |||
Item 4. | |||
PART II | Item 5. | ||
Item 6. | |||
Item 7. | |||
Item 7A. | |||
Item 8. | |||
Item 9. | |||
Item 9A. | |||
Item 9B. | |||
PART III | Item 10. | ||
Item 11. | |||
Item 12. | |||
Item 13. | |||
Item 14. | |||
PART IV | Item 15. | ||
Private Securities Litigation Reform Act-Safe Harbor Statement
Capitol Federal Financial, Inc. (the "Company"), and Capitol Federal Savings Bank ("Capitol Federal Savings" or the "Bank"), may from time to time make written or oral "forward-looking statements," including statements contained in documents filed or furnished by the Company with the Securities and Exchange Commission ("SEC"). These forward-looking statements may be included in this Annual Report on Form 10-K and the exhibits attached to it, in the Company's reports to stockholders, in the Company's press releases, and in other communications by the Company, which are made in good faith by us pursuant to the "safe harbor" provisions of the Private Securities Litigation Reform Act of 1995.
These forward-looking statements include statements about our beliefs, plans, objectives, goals, expectations, anticipations, estimates and intentions, which are subject to significant risks and uncertainties, and are subject to change based on various factors, some of which are beyond our control. The words "may," "could," "should," "would," "believe," "anticipate," "estimate," "expect," "intend," "plan" and similar expressions are intended to identify forward-looking statements. The following factors, among others, could cause our future results to differ materially from the beliefs, plans, objectives, goals, expectations, anticipations, estimates and intentions expressed in the forward-looking statements:
• | our ability to maintain overhead costs at reasonable levels; |
• | our ability to originate and purchase a sufficient volume of one- to four-family loans in order to maintain the balance of that portfolio at a level desired by management; |
• | our ability to invest funds in wholesale or secondary markets at favorable yields compared to the related funding source; |
• | our ability to access cost-effective funding; |
• | the expected cost savings, synergies and other benefits from the acquisition of Capital City Bancshares, Inc. ("CCB") might not be realized within the anticipated time frames or at all, and costs or difficulties relating to integration matters might be greater than expected; |
• | our ability to extend the commercial banking expertise acquired from CCB through our existing branch footprint; |
• | fluctuations in deposit flows; |
• | the future earnings and capital levels of the Bank and the continued non-objection by our primary federal banking regulators, to the extent required, to distribute capital from the Bank to the Company, which could affect the ability of the Company to pay dividends in accordance with its dividend policy; |
• | the strength of the U.S. economy in general and the strength of the local economies in which we conduct operations, including areas where we have purchased large amounts of correspondent loans; |
• | changes in real estate values, unemployment levels, and the level and direction of loan delinquencies and charge-offs may require changes in the estimates of the adequacy of the allowance for credit losses ("ACL"), which may adversely affect our business; |
• | increases in non-performing assets, which may require the Bank to increase the ACL, charge-off loans and incur elevated collection and carrying costs related to such non-performing assets; |
• | results of examinations of the Bank and the Company by their respective primary federal banking regulators, including the possibility that the regulators may, among other things, require us to increase our ACL; |
• | changes in accounting principles, policies, or guidelines; |
• | the effects of, and changes in, monetary and interest rate policies of the Board of Governors of the Federal Reserve System ("FRB"); |
• | the effects of, and changes in, trade and fiscal policies and laws of the United States government; |
• | the effects of, and changes in, foreign and military policies of the United States government; |
• | inflation, interest rate, market, monetary, and currency fluctuations; |
• | the timely development and acceptance of new products and services and the perceived overall value of these products and services by users, including the features, pricing, and quality compared to competitors' products and services; |
• | the willingness of users to substitute competitors' products and services for our products and services; |
• | our success in gaining regulatory approval of our products and services and branching locations, when required; |
• | the impact of interpretations of, and changes in, financial services laws and regulations, including laws concerning taxes, banking, securities, consumer protection, trust and insurance and the impact of other governmental initiatives affecting the financial services industry; |
• | implementing business initiatives may be more difficult or expensive than anticipated; |
• | significant litigation; |
• | technological changes; |
1
• | our ability to maintain the security of our financial, accounting, technology, and other operating systems and facilities, including the ability to withstand cyber-attacks; |
• | acquisitions and dispositions; |
• | changes in consumer spending, borrowing and saving habits; and |
• | our success at managing the risks involved in our business. |
This list of important factors is not all inclusive. See "Part I, Item 1A. Risk Factors" for a discussion of risks and uncertainties related to our business that could adversely impact our operations and/or financial results. We do not undertake to update any forward-looking statement, whether written or oral, that may be made from time to time by or on behalf of the Company or the Bank.
PART I
As used in this Form 10-K, unless we specify otherwise, "the Company," "we," "us," and "our" refer to Capitol Federal Financial, Inc. a Maryland corporation. "Capitol Federal Savings," and "the Bank," refer to Capitol Federal Savings Bank, a federal savings bank and the wholly-owned subsidiary of Capitol Federal Financial, Inc.
Item 1. Business
General
The Company is a Maryland corporation that was incorporated in April 2010. The Company's common stock is traded on the Global Select tier of the NASDAQ Stock Market under the symbol "CFFN."
The Bank is a wholly-owned subsidiary of the Company and is a federally chartered and insured savings bank headquartered in Topeka, Kansas. The Bank is examined and regulated by the Office of the Comptroller of the Currency (the "OCC"), its primary regulator, and its deposits are insured up to applicable limits by the Deposit Insurance Fund ("DIF"), which is administered by the Federal Deposit Insurance Corporation ("FDIC"). The Company, as a savings and loan holding company, is examined and regulated by the FRB.
On August 31, 2018, the Company completed the acquisition of CCB and its wholly-owned subsidiary Capital City Bank, headquartered in Topeka, Kansas. Capital City Bank owned and leased banking locations in Topeka, Lawrence, and Overland Park, Kansas. As a result of the merger, the Bank is entering the commercial banking business through the origination of commercial lending products and offering of commercial deposit services, and began offering trust and brokerage services. The Company acquired loans and deposits with fair values of $299.7 million and $352.5 million, respectively, at the date of acquisition. Under the terms of the acquisition agreement, the Company issued 3.0 million shares of Company common stock for all outstanding shares of CCB capital stock, for a total merger consideration of $39.1 million, based on the Company's closing stock price of $13.21 on August 31, 2018.
We have been, and intend to continue to be, a community-oriented financial institution offering a variety of financial services to meet the needs of the communities we serve. We attract deposits primarily from the general public and also from businesses and invest those funds primarily in permanent loans secured by first mortgages on owner-occupied, one- to four-family residences. We also originate and participate in commercial loans with other lenders, originate consumer loans primarily secured by mortgages on one- to four-family residences, and invest in certain investment securities and mortgage-backed securities ("MBS") using funding from deposits, repurchase agreements, and Federal Home Loan Bank Topeka ("FHLB") borrowings. We offer a variety of deposit accounts having a wide range of interest rates and terms, which generally include savings accounts, money market accounts, interest-bearing and non-interest-bearing checking accounts, and certificates of deposit with terms ranging from 91 days to 96 months. Our primary revenues are derived from interest on loans, MBS, investment securities, and dividends on FHLB stock.
The Company is significantly affected by prevailing economic conditions, including federal monetary and fiscal policies and federal regulation of financial institutions. Deposit balances are influenced by a number of factors, including interest rates paid on competing investment products, the level of personal income, and the personal rate of savings within our market areas. Lending activities are influenced by the demand for housing and other loans, our loan underwriting guidelines compared to those of our competitors, as well as interest rate pricing competition from other lending institutions.
Our executive offices are located at 700 South Kansas Avenue, Topeka, Kansas 66603, and our telephone number at that address is (785) 235-1341.
2
Available Information
Our Internet website address is www.capfed.com. Our annual reports on Form 10-K, quarterly reports on Form 10-Q, current reports on Form 8-K, and all amendments to those reports can be obtained free of charge from our website. These reports are available on our website as soon as reasonably practicable after they are electronically filed with or furnished to the SEC. These reports are also available on the SEC's website at http://www.sec.gov.
Market Area and Competition
Our corporate office is located in Topeka, Kansas. We currently have a network of 58 branches (48 traditional branches and 10 in-store branches) located in nine counties throughout Kansas and three counties in Missouri. We primarily serve the metropolitan areas of Topeka, Wichita, Lawrence, Manhattan, Emporia, and Salina, Kansas and a portion of the metropolitan area of greater Kansas City. In addition to providing full service banking offices, we provide services through our call center which operates on extended hours, mobile banking, telephone banking, and online banking and bill payment services.
The Bank ranked second in deposit market share, at 7.26%, in the state of Kansas as reported in the June 30, 2018 FDIC "Summary of Deposits - Market Share Report." Deposit market share is measured by total deposits, without consideration for type of deposit. Prior to the acquisition of CCB, we did not offer commercial deposit accounts, while many of our competitors have both commercial and retail deposits in their total deposit base. Some of our competitors also offer products and services that we do not, which may add to their total deposits. Consumers also have the ability to utilize online financial institutions and investment brokerages that are not confined to any specific market area. Management considers our well-established retail banking network together with our reputation for financial strength and customer service to be major factors in our success at attracting and retaining customers in our market areas.
The Bank consistently has been one of the top one- to four-family lenders with regard to mortgage loan origination volume in the state of Kansas. Through our strong relationships with real estate agents and marketing efforts, which reflect our reputation, and pricing, we attract mortgage loan business from walk-in customers, customers that apply online, and existing customers. Competition in originating one- to four-family loans primarily comes from other savings institutions, commercial banks, credit unions, and mortgage bankers. Other savings institutions, commercial banks, credit unions, and finance companies provide vigorous competition in consumer lending.
Lending Practices and Underwriting Standards
General. Originating and purchasing loans secured by one- to four-family residential properties is the Bank's primary lending business, resulting in a loan concentration in residential first mortgage loans secured by properties located in Kansas and Missouri. The Bank also originates consumer loans and construction loans secured by residential properties, and originates and participates in commercial loans.
On August 31, 2018, the Bank acquired loans from CCB with fair values of $299.7 million as of that date. The acquired loans are included in the September 30, 2018 loan discussions and tables, where applicable, throughout this Annual Report on Form 10-K.
One- to Four-Family Residential Real Estate Lending. The Bank originates and services one- to four-family loans that are not guaranteed or insured by the federal government, and purchases one- to four-family loans, on a loan-by-loan basis, from a select group of correspondent lenders.
Originated Loans
While the Bank originates both fixed- and adjustable-rate loans, our origination volume is dependent upon customer demand for loans in our market areas. Demand is affected by the local housing market, competition, and the interest rate environment. During fiscal years 2018 and 2017, the Bank originated and refinanced $543.5 million and $619.0 million of one- to four-family loans, respectively.
Correspondent Purchased Loans
The Bank purchases one- to four-family loans, on a loan-by-loan basis, from a select group of correspondent lenders. Loan purchases enable the Bank to attain geographic diversification in the loan portfolio. At September 30, 2018, the Bank had correspondent lending relationships in 28 states and the District of Columbia. During fiscal years 2018 and 2017, the Bank
3
purchased $391.6 million and $563.2 million, respectively, of one- to four-family loans from correspondent lenders. We generally pay a premium of 0.50% to 1.0% of the loan balance to purchase these loans, and we pay 1.0% of the loan balance to purchase the servicing of these loans.
The Bank has an agreement with a third-party mortgage sub-servicer to service loans originated by the Bank's correspondent lenders in certain states. The sub-servicer has experience servicing loans in the market areas in which the Bank purchases loans and services the loans according to the Bank's servicing standards, which is intended to allow the Bank greater control over servicing and reporting and help maintain a standard of loan performance.
Bulk Purchased Loans
In the past, the Bank has also purchased one- to four-family loans from correspondent and nationwide lenders in bulk loan packages. The last bulk loan package purchase by the Bank was in August 2012. The Bank no longer purchases bulk loan packages. See "Part I, Item 1A. Risk Factors" for additional information regarding why the Bank no longer purchases bulk loan packages.
The servicing rights associated with bulk purchased loans were generally retained by the lender/seller for the loans purchased from nationwide lenders. The servicing by nationwide lenders is governed by a servicing agreement, which outlines collection policies and procedures, as well as oversight requirements, such as servicer certifications attesting to and providing proof of compliance with the servicing agreement.
At September 30, 2018, $194.1 million, or 66% of the Bank's bulk purchased loan portfolio, are loans guaranteed by one seller. Based on the historical performance of these loans and the seller, the Bank believes the seller has the financial ability to repurchase or replace loans if any loans were to become delinquent. The Bank has not experienced any losses with this group of loans since the loan package was purchased in August 2012. For the $99.5 million of bulk purchased loans at September 30, 2018 that do not have the above noted guarantee, the Bank has continued to experience a reduction in loan losses due to an improvement in collateral values. A large portion of these loans were originally interest-only loans with interest-only terms up to 10 years. All of the bulk purchased interest-only loans are now fully amortizing loans.
Underwriting
Full documentation to support an applicant's credit and income, and sufficient funds to cover all applicable fees and reserves at closing, are required on all loans. Generally, loans are underwritten according to the "ability to repay" and "qualified mortgage" standards, as issued by the Consumer Financial Protection Bureau ("CFPB"). Information pertaining to the creditworthiness of the borrower generally consists of a summary of the borrower's credit history, employment stability, sources of income, assets, net worth, and debt ratios. The value of the subject property must be supported by an appraisal report prepared in accordance with our appraisal policy by either a staff appraiser or a fee appraiser, both of which are independent of the loan origination function and who are approved by our Board of Directors.
Loans over $550 thousand, up to and including $800 thousand, must be underwritten by two senior underwriters. Loans over $800 thousand, up to and including $3.0 million, must be approved by our Asset and Liability Management Committee ("ALCO"), while loans over $3.0 million must be approved by our Board of Directors. For loans requiring ALCO and/or Board of Directors' approval, lending management is responsible for presenting to ALCO and/or the Board of Directors information about the creditworthiness of the borrower and the market value of the subject property.
The underwriting standards for loans purchased from correspondent and nationwide lenders are generally similar to the Bank's internal underwriting standards. The underwriting of correspondent loans is performed by the Bank's underwriters. Our standard contractual agreement with the lender/seller includes recourse options for any breach of representation or warranty with respect to the loans purchased. The Bank did not request any lenders/sellers to repurchase loans for breach of representation during fiscal year 2018.
Adjustable-rate Mortgage ("ARM") Loans
ARM loans are offered with a three-year, five-year, or seven-year term to the initial repricing date. After the initial period, the interest rate for each ARM loan adjusts annually for the remainder of the term of the loan. Currently, the repricing index for loan originations and correspondent purchases is tied to London Interbank Offered Rates ("LIBOR"); however, other indices have been used in the past. Current adjustable-rate one- to four-family loans originated by the Bank generally provide for a specified rate limit or cap on the periodic adjustment to the interest rate, as well as a specified maximum
4
lifetime cap and minimum rate, or floor. As a consequence of using caps, the interest rates on these loans may not be as rate sensitive as our cost of funds. Negative amortization of principal is not allowed. For three- and five-year ARM loans, borrowers are qualified based on the principal, interest, tax, and insurance payments at the initial interest rate plus the life of loan cap and the initial interest rate plus the first period cap, respectively. For seven-year ARM loans, borrowers are qualified based on the principal, interest, tax, and insurance payments at the initial rate. After the initial three-, five-, or seven-year period, the interest rate resets annually and the new principal and interest payment is based on the new interest rate, remaining unpaid principal balance, and remaining term of the ARM loan. Our ARM loans are not automatically convertible into fixed-rate loans; however, we do allow borrowers to pay an endorsement fee to convert an ARM loan into a fixed-rate loan. ARM loans can pose greater credit risks than fixed-rate loans, primarily because as interest rates rise, the borrower's payment also rises, increasing the potential for default. This specific type of risk is known as repricing risk.
Pricing
Our pricing strategy for one- to four-family loan products includes setting interest rates based on secondary market prices and local competitor pricing for our local lending markets, and secondary market prices and national competitor pricing for our correspondent markets.
Mortgage Insurance
For a one- to four-family loan with a loan-to-value ("LTV") ratio in excess of 80% at the time of origination, private mortgage insurance ("PMI") is required in order to reduce the Bank's loss exposure. The Bank will lend up to 97% of the lesser of the appraised value or purchase price for one- to four-family loans, provided PMI is obtained. Management continuously monitors the claim-paying ability of our PMI counterparties. We believe our PMI counterparties have the ability to meet potential claim obligations we may file in the foreseeable future.
Repayment
The Bank's one- to four-family loans are primarily fully amortizing fixed-rate or ARM loans. The contractual maturities for fixed-rate loans and ARM loans can be up to 30 years; however, there are certain bulk purchased ARM loans that had original contractual maturities of 40 years. Our one- to four-family loans are generally not assumable and do not contain prepayment penalties. A "due on sale" clause, allowing the Bank to declare the unpaid principal balance due and payable upon the sale of the secured property, is generally included in the security instrument.
Construction Lending
The Bank originates construction and owner-occupied construction-to-permanent loans secured by one- to four-family residential real estate. The majority of these loans are secured by property located within the Bank's Kansas City market area. At September 30, 2018, we had $33.1 million in one- to four-family construction loans outstanding, representing 0.4% of our total loan portfolio, of which $27.1 million were owner occupied construction-to-permanent loans.
The application process for a construction loan includes submission of complete plans, specifications, and costs of the project to be constructed. All construction loans are manually underwritten using the Bank's internal underwriting standards. Construction draw requests and the supporting documentation are reviewed and approved by authorized management or experienced construction loan personnel. The Bank also performs regular documented inspections of the construction project to ensure the funds are being used for the intended purpose. Interest is not capitalized during the construction period; it is billed and collected monthly based on the amount of funds disbursed.
The Bank's owner occupied construction-to-permanent loan program combines the construction loan and the permanent loan into one loan, allowing the borrower to secure the same interest rate structure throughout the construction period and the permanent loan term. Once the construction period is complete on an owner-occupied construction-to-permanent loan, the payment method is changed from interest-only to an amortized principal and interest payment for the remaining term of the loan.
Loan Endorsement Program
In an effort to offset the impact of repayments and to retain our customers, existing loan customers, including customers whose loans were purchased from a correspondent lender, have the opportunity, for a cash fee, to endorse their original loan terms to current loan terms being offered. Customers whose loans have been sold to third parties, or have been delinquent on their contractual loan payments during the previous 12 months, or are currently in bankruptcy, are not eligible to participate in this program. The Bank does not solicit customers for this program, but considers it a valuable opportunity to retain
5
customers who, based on our initial underwriting criteria, could likely obtain similar financing elsewhere. During fiscal years 2018 and 2017, the Bank endorsed $19.4 million and $53.1 million of one- to four-family loans, respectively.
Loan Sales
One- to four-family loans may be sold on a bulk basis or on a flow basis as loans are originated. Loans originated by the Bank and purchased from correspondent lenders are generally eligible for sale in the secondary market. Loans are generally sold for portfolio restructuring purposes, to reduce interest rate risk and/or to maintain a certain liquidity position. The Bank generally retains the servicing on these loans. ALCO determines the criteria upon which one- to four-family loans are to be classified as held-for-sale or held-for-investment. One- to four-family loans classified as held-for-sale are to be sold in accordance with policies set forth by ALCO. During fiscal years 2018 and 2017, the Bank sold $16.6 million and $6.7 million of one- to four-family loans, respectively. The loans sold during fiscal years 2018 and 2017 were completed in order to test the Bank's loan sale processes for liquidity purposes.
Consumer Lending. The Bank offers a variety of secured consumer loans, including home equity loans and lines of credit, home improvement loans, vehicle loans, and loans secured by savings deposits. The Bank also originates a very limited amount of unsecured loans. The Bank does not originate any consumer loans on an indirect basis, such as contracts purchased from retailers of goods or services which have extended credit to their customers. Generally, consumer loans are originated in the Bank's market areas. At September 30, 2018, our consumer loan portfolio totaled $139.6 million, or approximately 2% of our total loan portfolio.
The majority of our consumer loan portfolio is comprised of home equity lines of credit which have adjustable interest rates. For a majority of the home equity lines of credit, the Bank has the first mortgage or the Bank is in the first lien position. Home equity lines of credit may be originated up to 90% of the value of the property securing the loan if no first mortgage exists, or up to 90% of the value of the property securing the loans if taking into consideration an existing first mortgage. Repaid principal may be re-advanced at any time during the draw period, not to exceed the original credit limit of the loan.
Closed-end home equity loans may be originated up to 95% of the value of the property securing the loans if taking into consideration an existing first mortgage, or the lesser of up to $40 thousand or 25% of the value of the property securing the loan if no first mortgage exists. Generally, loan terms are more limiting and rates are higher for a loan in the second lien position. Home equity loans, including lines of credit and closed-end loans, comprised approximately 93% of our consumer loan portfolio, or $129.6 million, at September 30, 2018; of that amount, 86% were adjustable-rate.
The underwriting standards for consumer loans include a determination of the applicant's payment history on other debts and an assessment of the applicant's ability to meet existing obligations and payments on the proposed loan. Although creditworthiness of the applicant is a primary consideration, the underwriting process also includes a comparison of the value of the security in relation to the proposed loan amount.
Consumer loans generally have shorter terms-to-maturity or reprice more frequently, usually without periodic caps, which reduces our exposure to credit risk and changes in interest rates, and usually carry higher rates of interest than do one- to four-family loans. However, consumer loans may entail greater credit risk than do one- to four-family loans, particularly in the case of consumer loans that are secured by rapidly depreciable assets, such as vehicles. Management believes that offering consumer loan products helps to expand and create stronger ties to our existing customer base by increasing the number of customer relationships and providing cross-marketing opportunities.
Commercial Lending. At September 30, 2018, the Bank's commercial loans totaled $569.6 million, or approximately 8% of our total loan portfolio. Of this amount, $296.4 million were participation loans. Total undisbursed loan amounts related to commercial loans were $187.3 million, resulting in a total commercial loan concentration of $756.9 million at September 30, 2018. During fiscal year 2018 and 2017, the Bank entered into commercial real estate loan participations of $135.8 million and $67.7 million, respectively. With the acquisition of CCB, the Bank began offering more commercial lending products.
At September 30, 2018, the Bank's commercial real estate loan portfolio totaled $506.7 million or approximately 89% of our commercial loan portfolio. Our commercial real estate loans include a variety of property types, including hotels, office and retail buildings, senior housing facilities, and multi-family dwellings located in Texas, Missouri, Kansas, Kentucky, Nebraska, Colorado, Arkansas, California, Montana, and Arizona. Our largest commercial real estate loan was $50.0 million at September 30, 2018. This loan was current according to its terms at September 30, 2018.
6
At September 30, 2018, the Bank's commercial and industrial loan portfolio totaled $62.9 million, or approximately 11% of our commercial loan portfolio. The Bank's commercial and industrial loan portfolio consists largely of loans secured by accounts receivable, inventory and equipment. The majority of the Bank's commercial and industrial loan portfolio was purchased as part of the CCB acquisition.
Underwriting
The Bank performs more extensive due diligence in underwriting commercial loans than loans secured by one- to four-family residential properties due to the larger loan amounts, the more complex sources of repayment and the riskier nature of such loans. When participating in a commercial real estate loan, the Bank performs the same underwriting procedures as if the loan was being originated by the Bank. The primary source of repayment is funds from the operation of the subject property. For secondary sources of repayment, the Bank generally requires personal guarantees and also evaluates the real estate collateral.
When underwriting a commercial real estate loan, several factors are considered, such as the income producing potential of the property to support the debt service, cash equity provided by the borrower, the financial strength of the borrower, tenant and/or guarantor(s), managerial expertise of the borrower or tenant, feasibility studies from the borrower or an independent third party, the marketability of the property and our lending experience with the borrower. For non-owner occupied properties, the Bank has a pre-lease requirement, depending on the property type, and overall strength of the credit.
The loan approval method uses a hierarchy of individual credit authorities. Loan relationships over $750 thousand, up to and including $10.0 million, are submitted to the Loan Committee for approval and also require the approval of both the Chief Lending Officer and the Chief Commercial Banking Officer. Loan relationships over $10.0 million, up to and including $40.0 million, are submitted to ALCO for approval and loan relationships over $40.0 million are submitted to the Board of Directors for approval.
For non-construction properties, the historical net operating income, which is the income derived from the operation of the property less all operating expenses, generally must be at least 1.20 times the required payments related to the outstanding debt (debt service coverage ratio) at the time of origination. For construction projects, the minimum debt service coverage ratio requirement of 1.20 applies to the projected cash flows, and the borrower must have successful experience with the construction and operation of properties similar to the subject property. As part of the underwriting process, the historical or projected cash flows are stressed under various scenarios to measure the viability of the project given adverse conditions.
Generally, our maximum LTV ratios conform to supervisory limits, including 65% for raw land, 75% for land development and 80% for commercial real estate loans. Full appraisals on properties securing these loans are performed by independent state certified fee appraisers. Additionally, the Bank has an independent third-party perform a review of each appraisal. The Bank generally requires at least 15% cash equity from the borrower for land acquisition, land development, and commercial real estate construction loans. For non-acquisition, development or construction loans, the equity may be from a combination of cash and the appraised value of the secured property.
Our commercial and industrial loans are primarily made in the Bank's market areas and are underwritten on the basis of the borrower's ability to service the debt from income. Other sources of repayment include the collateral underlying the loans and guarantees from business owners. Working capital loans are primarily collateralized by short-term assets whereas term loans are primarily collateralized by long-term assets. In general, commercial and industrial loans involve more credit risk than commercial real estate loans. The increased risk in commercial and industrial loans is due to the type of collateral securing these loans as well as the expectation that commercial and industrial loans generally will be serviced principally from the operations of the business, and those operations may not be successful. Significant adverse changes in borrowers' industries and businesses could cause a rapid decline in the values of, and collectability associated with, business assets securing the loans, which could result in inadequate collateral coverage of our commercial and industrial loans. Additionally, commercial and industrial loans secured by accounts receivable may be substantially dependent on the ability of the borrower to collect amounts due from clients and loans secured by inventory and equipment are subject to depreciation over time and may be difficult to appraise. As a result of these additional complexities, variables and risks, commercial and industrial loans require more thorough underwriting and servicing than other types of commercial loans.
7
Loan Terms
Commercial loans generally have amortization terms of 15 to 30 years and maturities ranging from 90 days to 20 years, which generally requires balloon payments of the remaining principal balance.
Commercial loans have either fixed or adjustable interest rates based on prevailing market rates. The interest rate on adjustable-rate loans is based on a variety of indices, but is generally determined through negotiation with the borrower or determined by the lead bank in the case of a loan participation.
For a construction loan, generally, the Bank allows interest-only payments during the construction phase of a project and for a stabilization period of 6 to 12 months after occupancy. The Bank requires amortizing payments at the conclusion of the stabilization period.
Additionally, the Bank may include covenants in the loan agreement that allow the Bank to take action when deterioration in the financial strength of the project is detected to potentially prevent the credit from becoming impaired. The covenants are specific to each loan agreement, based on factors such as the purpose of funds, the collateral type, and the financial strength of the project, the borrower and the guarantor, among other factors.
Monitoring of Risk
For the Bank's commercial real estate loan portfolio, borrowers with a loan principal balance of $1.5 million or more are required to provide financial information annually, including borrower financial statements, subject property rental rates and income, maintenance costs, an update of real estate property tax and insurance payments, and personal financial information for the guarantor(s). The annual review process for loans with a principal balance of $1.5 million or more allows the Bank to monitor compliance with loan covenants and review the borrower's performance, including cash flows from operations, debt service coverage, and comparison of performance to projections and year-over-year performance trending. Additionally, the Bank performs a site visit, schedules a drive-by site visit or obtains an update from the lead bank to obtain information regarding the maintenance of the property and surrounding area. Depending on the financial strength of the project and/or the complexity of the borrower's financials, the Bank may also perform a global analysis of cash flows to account for all other properties owned by the borrower or guarantor. If signs of weakness are identified, the Bank may begin performing more frequent financial and/or collateral reviews or will initiate contact with the borrower, or the lead bank will contact the borrower if the loan is a participation loan, to ensure cash flows from operations are maintained at a satisfactory level to meet the debt requirements. Both macro-level and loan-level stress-test scenarios based on existing and forecasted market conditions are part of the on-going portfolio management process for the commercial real estate portfolio.
Commercial real estate construction lending generally involves a greater degree of risk than commercial real estate lending. Repayment of a construction loan is, to a great degree, dependent upon the successful and timely completion of the construction of the subject property. Construction delays, slower than anticipated stabilization or the financial impairment of the builder may negatively affect the borrower's ability to repay the loan. The Bank takes these risks into consideration during the underwriting process including the requirement of personal guarantees. The Bank mitigates the risk of commercial real estate construction lending during the construction period by monitoring inspection reports from an independent third-party, project budget, percentage of completion, on-site inspections and percentage of advanced funds.
Commercial and industrial loans are monitored through a review of borrower performance as indicated by borrower financial statements, borrowing base reports, accounts receivable aging reports, and inventory aging reports. These reports are required to be provided by the borrowers monthly, quarterly, or annually depending on the nature of the borrowing relationship.
Our commercial loans are generally large dollar loans and involve a greater degree of credit risk than one- to four-family loans. Because payments on these loans are often dependent on the successful operation or management of the properties and/or businesses, repayment of such loans may be subject to adverse conditions in the economy, the borrower's line of business, and/or the real estate market. If the cash flows from the project or business operation is reduced, or if leases are not obtained or renewed, the borrower's ability to repay the loan may become impaired. The Bank regularly monitors the level of risk in the portfolio, including concentrations in such factors as geographic locations, collateral types, tenant brand name, borrowing relationships, and lending relationships in the case of participation loans, among other factors.
8
Loan Portfolio. The following table presents the composition of our loan portfolio as of the dates indicated.
September 30, | ||||||||||||||||||||||||||||||||||
2018 | 2017 | 2016 | 2015 | 2014 | ||||||||||||||||||||||||||||||
Amount | Percent | Amount | Percent | Amount | Percent | Amount | Percent | Amount | Percent | |||||||||||||||||||||||||
(Dollars in thousands) | ||||||||||||||||||||||||||||||||||
One- to four-family: | ||||||||||||||||||||||||||||||||||
Originated | $ | 3,965,692 | 52.8 | % | $ | 3,959,232 | 55.1 | % | $ | 4,005,615 | 57.6 | % | $ | 4,010,424 | 60.6 | % | $ | 3,978,342 | 63.8 | % | ||||||||||||||
Correspondent purchased | 2,505,987 | 33.4 | 2,445,311 | 34.0 | 2,206,072 | 31.7 | 1,846,210 | 27.9 | 1,431,745 | 23.0 | ||||||||||||||||||||||||
Bulk purchased | 293,607 | 3.9 | 351,705 | 4.9 | 416,653 | 6.0 | 485,682 | 7.3 | 561,890 | 9.0 | ||||||||||||||||||||||||
Construction | 33,149 | 0.4 | 30,647 | 0.4 | 39,430 | 0.6 | 29,552 | 0.4 | 33,378 | 0.5 | ||||||||||||||||||||||||
Total | 6,798,435 | 90.5 | 6,786,895 | 94.4 | 6,667,770 | 95.9 | 6,371,868 | 96.2 | 6,005,355 | 96.3 | ||||||||||||||||||||||||
Commercial: | ||||||||||||||||||||||||||||||||||
Commercial real estate | 426,243 | 5.7 | 183,030 | 2.6 | 110,768 | 1.6 | 109,314 | 1.6 | 75,677 | 1.2 | ||||||||||||||||||||||||
Commercial and industrial | 62,869 | 0.9 | — | — | — | — | — | — | — | — | ||||||||||||||||||||||||
Construction | 80,498 | 1.1 | 86,952 | 1.2 | 43,375 | 0.6 | 11,523 | 0.2 | 21,465 | 0.3 | ||||||||||||||||||||||||
Total | 569,610 | 7.7 | 269,982 | 3.8 | 154,143 | 2.2 | 120,837 | 1.8 | 97,142 | 1.5 | ||||||||||||||||||||||||
Consumer loans: | ||||||||||||||||||||||||||||||||||
Home equity | 129,588 | 1.7 | 122,066 | 1.7 | 123,345 | 1.8 | 125,844 | 1.9 | 130,484 | 2.1 | ||||||||||||||||||||||||
Other | 10,012 | 0.1 | 3,808 | 0.1 | 4,264 | 0.1 | 4,179 | 0.1 | 4,537 | 0.1 | ||||||||||||||||||||||||
Total | 139,600 | 1.8 | 125,874 | 1.8 | 127,609 | 1.9 | 130,023 | 2.0 | 135,021 | 2.2 | ||||||||||||||||||||||||
Total loans receivable | 7,507,645 | 100.0 | % | 7,182,751 | 100.0 | % | 6,949,522 | 100.0 | % | 6,622,728 | 100.0 | % | 6,237,518 | 100.0 | % | |||||||||||||||||||
Less: | ||||||||||||||||||||||||||||||||||
ACL | 8,463 | 8,398 | 8,540 | 9,443 | 9,227 | |||||||||||||||||||||||||||||
Discounts/unearned loan fees | 33,933 | 24,962 | 24,933 | 24,213 | 23,687 | |||||||||||||||||||||||||||||
Premiums/deferred costs | (49,236 | ) | (45,680 | ) | (41,975 | ) | (35,955 | ) | (28,566 | ) | ||||||||||||||||||||||||
Total loans receivable, net | $ | 7,514,485 | $ | 7,195,071 | $ | 6,958,024 | $ | 6,625,027 | $ | 6,233,170 | ||||||||||||||||||||||||
9
The following table presents the contractual maturity of our loan portfolio, along with associated weighted average yields, at September 30, 2018. Loans which have adjustable interest rates are shown as maturing in the period during which the contract is due. The table does not reflect the effects of possible prepayments or enforcement of due on sale clauses.
One- to Four-Family | Commercial | Construction(2) | Home Equity(3) | Other | Total | ||||||||||||||||||||||||||||||||||||
Amount | Yield | Amount | Yield | Amount | Yield | Amount | Yield | Amount | Yield | Amount | Yield | ||||||||||||||||||||||||||||||
(Dollars in thousands) | |||||||||||||||||||||||||||||||||||||||||
Amounts due: | |||||||||||||||||||||||||||||||||||||||||
Within one year(1) | $ | 12,237 | 4.75 | % | $ | 52,595 | 6.06 | % | $ | 113,175 | 4.62 | % | $ | 6,350 | 5.83 | % | $ | 1,643 | 7.23 | % | $ | 186,000 | 5.10 | % | |||||||||||||||||
After one year: | |||||||||||||||||||||||||||||||||||||||||
Over one to two | 6,125 | 4.44 | 18,842 | 4.32 | 472 | 14.15 | 1,290 | 6.73 | 1,539 | 6.12 | 28,268 | 4.72 | |||||||||||||||||||||||||||||
Over two to three | 8,542 | 4.71 | 121,615 | 4.06 | — | — | 841 | 5.87 | 1,595 | 5.21 | 132,593 | 4.13 | |||||||||||||||||||||||||||||
Over three to five | 40,201 | 3.95 | 40,517 | 5.31 | — | — | 2,571 | 5.78 | 4,654 | 4.80 | 87,943 | 4.68 | |||||||||||||||||||||||||||||
Over five to ten | 577,293 | 3.40 | 135,320 | 4.74 | — | — | 15,230 | 6.12 | 581 | 6.45 | 728,424 | 3.71 | |||||||||||||||||||||||||||||
Over ten to fifteen | 1,148,918 | 3.32 | 56,917 | 4.74 | — | — | 43,945 | 6.00 | — | — | 1,249,780 | 3.48 | |||||||||||||||||||||||||||||
After fifteen years | 4,971,970 | 3.69 | 63,306 | 4.47 | — | — | 59,361 | 5.86 | — | — | 5,094,637 | 3.72 | |||||||||||||||||||||||||||||
Total due after one year | 6,753,049 | 3.60 | 436,517 | 4.55 | 472 | 14.15 | 123,238 | 5.95 | 8,369 | 5.23 | 7,321,645 | 3.70 | |||||||||||||||||||||||||||||
Totals loans | $ | 6,765,286 | 3.61 | $ | 489,112 | 4.71 | $ | 113,647 | 4.66 | $ | 129,588 | 5.94 | $ | 10,012 | 5.56 | 7,507,645 | 3.74 | ||||||||||||||||||||||||
Less: | |||||||||||||||||||||||||||||||||||||||||
ACL | 8,463 | ||||||||||||||||||||||||||||||||||||||||
Discounts/unearned loan fees | 33,933 | ||||||||||||||||||||||||||||||||||||||||
Premiums/deferred costs | (49,236 | ) | |||||||||||||||||||||||||||||||||||||||
Total loans receivable, net | $ | 7,514,485 | |||||||||||||||||||||||||||||||||||||||
(1) | Includes demand loans, loans having no stated maturity, and overdraft loans. |
(2) | Construction loans are presented based upon the estimated term to complete construction. See "One- to Four-Family Residential Real Estate Lending - Construction Lending" above for more information regarding our construction-to-permanent loan program. |
(3) | For home equity loans that were not acquired from CCB, which represent the majority of the home equity loan portfolio, the maturity date calculated assumes the borrower always makes the required minimum payment. The majority of interest-only home equity lines of credit assume a balloon payment of unpaid principal at 120 months, while other home equity lines of credit generally assume a term of 240 months. For home equity loans acquired from CCB, which totaled $7.4 million at September 30, 2018, the maturity date reflected is the contractual maturity date. |
10
The following table presents, as of September 30, 2018, the amount of loans due after September 30, 2019, and whether these loans have fixed or adjustable interest rates.
Fixed | Adjustable | Total | |||||||||
(Dollars in thousands) | |||||||||||
One- to four-family | $ | 5,641,129 | $ | 1,111,920 | $ | 6,753,049 | |||||
Commercial | 280,735 | 155,782 | 436,517 | ||||||||
Construction | — | 472 | 472 | ||||||||
Consumer loans: | |||||||||||
Home equity | 13,527 | 109,711 | 123,238 | ||||||||
Other | 5,408 | 2,961 | 8,369 | ||||||||
Total | $ | 5,940,799 | $ | 1,380,846 | $ | 7,321,645 | |||||
Asset Quality
The Bank's traditional underwriting guidelines have provided the Bank with generally low delinquencies and low levels of non-performing assets compared to national levels. Of particular importance is the complete and full documentation required for each loan the Bank originates, participates in or purchases. Generally, one- to four-family owner occupied loans are underwritten according to the "ability to repay" and "qualified mortgage" standards, as issued by the CFPB. This allows the Bank to make an informed credit decision based upon a thorough assessment of the borrower's ability to repay the loan.
For one- to four-family loans and consumer loans, when a borrower fails to make a loan payment within 10 to 15 days after the due date, a late charge is assessed and a notice is mailed. Collection personnel review all delinquent loan accounts more than 16 days past due. Attempts to contact the borrower occur by personal letter and, if no response is received, by telephone, with the purpose of establishing repayment arrangements for the borrower to bring the loan current. Repayment arrangements must be approved by a designated bank employee. For residential mortgage loans serviced by the Bank, beginning at approximately the 31st day of delinquency, and again at approximately the 50th day of delinquency, information notices are mailed to borrowers to inform them of the availability of payment assistance programs. Borrowers are encouraged to contact the Bank to initiate the process of reviewing such opportunities. Once a loan becomes 90 days delinquent, assuming a loss mitigation solution is not actively in process, a demand letter is issued requiring the loan be brought current or foreclosure procedures will be implemented. Generally, when a loan becomes 120 days delinquent, and an acceptable repayment plan or loss mitigation solution has neither been established nor is in the process of being negotiated, the loan is forwarded to legal counsel to initiate foreclosure. We also monitor whether borrowers who have filed for bankruptcy are meeting their obligation to pay the mortgage debt in accordance with the terms of the bankruptcy petition.
For purchased loans serviced by a third party, we monitor delinquencies using reports received from the servicers. The reports generally provide total principal and interest due and length of delinquency, and are used to prepare monthly management reports and perform delinquent loan trend analysis. The information from the sub-servicer of our correspondent loans is generally received during the first week of the month while the information from the servicers of our bulk loans is received later in the month. Management also utilizes information from the servicers to monitor property valuations and identify the need to charge-off loan balances.
For commercial loans originated by the Bank, when a borrower fails to make a loan payment within 10 to 15 days after the due date, a late notice is mailed. If the loan becomes 30 days or more past due, the Bank begins collection efforts including sending legal notices for payment collection and contacting the borrower by telephone. The primary purpose of such contact is to notify the borrower of the past due payment in case the loan payment was misplaced or lost and to identify any changes in the borrower's income flow that may affect future loan performance. If it is determined that future loan performance may be adversely affected, the Bank initiates discussions with the borrower regarding plans to ensure cash flow from operations is sufficient to satisfy the debt requirements and meet the loan covenants. Generally, once a loan becomes 90 days delinquent, foreclosure procedures are initiated. For participation loans, the lead bank is responsible for all collection efforts and contact with the borrower. However, if the Bank does not receive an expected payment on a participation loan, the Bank contacts the lead bank to determine the cause of the late payment and to initiate discussions with the lead bank of collection efforts, as necessary. See "Lending Practices and Underwriting Standards – Commercial Lending – Monitoring of Risk" for additional information.
11
Delinquent and non-performing loans and other real estate owned ("OREO")
The following table presents the Company's 30 to 89 day delinquent loans at the dates indicated. Of the loans 30 to 89 days delinquent at September 30, 2018, 2017, and 2016, approximately 74%, 67%, and 75%, respectively, were 59 days or less delinquent.
Loans Delinquent for 30 to 89 Days at September 30, | ||||||||||||||||||||
2018 | 2017 | 2016 | ||||||||||||||||||
Number | Amount | Number | Amount | Number | Amount | |||||||||||||||
(Dollars in thousands) | ||||||||||||||||||||
One- to four-family: | ||||||||||||||||||||
Originated | 129 | $ | 10,647 | 129 | $ | 13,257 | 143 | $ | 13,593 | |||||||||||
Correspondent purchased | 18 | 3,803 | 8 | 1,827 | 9 | 3,329 | ||||||||||||||
Bulk purchased | 15 | 3,502 | 22 | 3,194 | 21 | 5,008 | ||||||||||||||
Commercial | 6 | 322 | — | — | — | — | ||||||||||||||
Consumer | 38 | 533 | 35 | 500 | 41 | 697 | ||||||||||||||
206 | $ | 18,807 | 194 | $ | 18,778 | 214 | $ | 22,627 | ||||||||||||
Loans 30 to 89 days delinquent | ||||||||||||||||||||
to total loans receivable, net | 0.25 | % | 0.26 | % | 0.33 | % | ||||||||||||||
12
The table below presents the Company's non-performing loans and OREO at the dates indicated. Non-performing loans are loans that are 90 or more days delinquent or in foreclosure and other loans required to be reported as nonaccrual pursuant to regulatory reporting requirements, even if the loans are current. At all dates presented, there were no loans 90 or more days delinquent that were still accruing interest. Non-performing assets include non-performing loans and OREO. OREO primarily includes assets acquired in settlement of loans. Over the past 12 months, OREO one-to four-family properties acquired in settlement of loans were owned by the Bank, on average, for approximately four months before the properties were sold.
September 30, | ||||||||||||||||||||||||||||||||||
2018 | 2017 | 2016 | 2015 | 2014 | ||||||||||||||||||||||||||||||
Number | Amount | Number | Amount | Number | Amount | Number | Amount | Number | Amount | |||||||||||||||||||||||||
(Dollars in thousands) | ||||||||||||||||||||||||||||||||||
Loans 90 or More Days Delinquent or in Foreclosure: | ||||||||||||||||||||||||||||||||||
One- to four-family: | ||||||||||||||||||||||||||||||||||
Originated | 67 | $ | 5,040 | 67 | $ | 5,515 | 73 | $ | 8,190 | 66 | $ | 6,728 | 82 | $ | 7,880 | |||||||||||||||||||
Correspondent purchased | 1 | 449 | 1 | 91 | 3 | 985 | 1 | 394 | 2 | 709 | ||||||||||||||||||||||||
Bulk purchased | 11 | 3,045 | 13 | 3,371 | 28 | 7,323 | 36 | 8,898 | 28 | 7,120 | ||||||||||||||||||||||||
Commercial | — | — | — | — | — | — | — | — | — | — | ||||||||||||||||||||||||
Consumer | 30 | 569 | 22 | 410 | 31 | 529 | 28 | 509 | 29 | 410 | ||||||||||||||||||||||||
109 | 9,103 | 103 | 9,387 | 135 | 17,027 | 131 | 16,529 | 141 | 16,119 | |||||||||||||||||||||||||
Loans 90 or more days delinquent or in foreclosure | ||||||||||||||||||||||||||||||||||
as a percentage of total loans | 0.12 | % | 0.13 | % | 0.24 | % | 0.25 | % | 0.26 | % | ||||||||||||||||||||||||
Nonaccrual loans less than 90 Days Delinquent:(1) | ||||||||||||||||||||||||||||||||||
One- to four-family: | ||||||||||||||||||||||||||||||||||
Originated | 19 | $ | 1,482 | 50 | $ | 4,567 | 70 | $ | 8,956 | 77 | $ | 9,004 | 67 | $ | 7,473 | |||||||||||||||||||
Correspondent purchased | 2 | 396 | 8 | 1,690 | 9 | 2,786 | 1 | 25 | 4 | 553 | ||||||||||||||||||||||||
Bulk purchased | — | — | 4 | 846 | 1 | 31 | 1 | 82 | 5 | 724 | ||||||||||||||||||||||||
Consumer | 2 | 9 | 7 | 113 | 12 | 328 | 12 | 295 | 2 | 45 | ||||||||||||||||||||||||
23 | 1,887 | 69 | 7,216 | 92 | 12,101 | 91 | 9,406 | 78 | 8,795 | |||||||||||||||||||||||||
Total non-performing loans | 132 | 10,990 | 172 | 16,603 | 227 | 29,128 | 222 | 25,935 | 219 | 24,914 | ||||||||||||||||||||||||
Non-performing loans as a percentage of total loans | 0.15 | % | 0.23 | % | 0.42 | % | 0.39 | % | 0.40 | % | ||||||||||||||||||||||||
13
September 30, | ||||||||||||||||||||||||||||||||||
2018 | 2017 | 2016 | 2015 | 2014 | ||||||||||||||||||||||||||||||
Number | Amount | Number | Amount | Number | Amount | Number | Amount | Number | Amount | |||||||||||||||||||||||||
(Dollars in thousands) | ||||||||||||||||||||||||||||||||||
OREO: | ||||||||||||||||||||||||||||||||||
One- to four-family: | ||||||||||||||||||||||||||||||||||
Originated(2) | 8 | $ | 843 | 4 | $ | 58 | 12 | $ | 692 | 29 | $ | 1,752 | 25 | $ | 2,040 | |||||||||||||||||||
Correspondent purchased | — | — | — | — | 1 | 499 | 1 | 499 | 1 | 179 | ||||||||||||||||||||||||
Bulk purchased | 1 | 454 | 5 | 1,279 | 4 | 1,265 | 2 | 796 | 2 | 575 | ||||||||||||||||||||||||
Commercial | 1 | 600 | — | — | — | — | — | — | — | — | ||||||||||||||||||||||||
Consumer | — | — | 1 | 67 | — | — | 1 | 8 | — | — | ||||||||||||||||||||||||
Other | — | — | — | — | 1 | 1,278 | 1 | 1,278 | 1 | 1,300 | ||||||||||||||||||||||||
10 | 1,897 | 10 | 1,404 | 18 | 3,734 | 34 | 4,333 | 29 | 4,094 | |||||||||||||||||||||||||
Total non-performing assets | 142 | $ | 12,887 | 182 | $ | 18,007 | 245 | $ | 32,862 | 256 | $ | 30,268 | 248 | $ | 29,008 | |||||||||||||||||||
Non-performing assets as a percentage of total assets | 0.14 | % | 0.20 | % | 0.35 | % | 0.31 | % | 0.29 | % | ||||||||||||||||||||||||
(1) | Represents loans required to be reported as nonaccrual pursuant to regulatory reporting requirements, even if the loans are current. The decrease in the balance of these loans at September 30, 2017 compared to September 30, 2016 was due to fewer loans being classified as troubled debt restructurings ("TDRs") as a result of management refining its methodology for assessing whether a loan modification qualifies as a TDR. At September 30, 2018, 2017, 2016, 2015, and 2014, this amount was comprised of $1.1 million, $1.8 million, $2.3 million, $2.2 million, and $1.1 million, respectively, of loans that were 30 to 89 days delinquent and were reported as such, and $800 thousand, $5.4 million, $9.8 million, $7.2 million, and $7.7 million, respectively, of loans that were current. |
(2) | Real estate-related consumer loans where we also hold the first mortgage are included in the one- to four-family category as the underlying collateral is one- to four-family property. |
The amount of interest income on nonaccrual loans and TDRs as of September 30, 2018 included in interest income was $1.1 million for the year ended September 30, 2018. The amount of additional interest income that would have been recorded on nonaccrual loans and TDRs as of September 30, 2018, if they had performed in accordance with their original terms, was $90 thousand for the year ended September 30, 2018.
14
The following table presents the states where the properties securing one percent or more of the total amount of our one- to four-family loans are located and the corresponding balance of loans 30 to 89 days delinquent, 90 or more days delinquent or in foreclosure, and weighted average LTV ratios for loans 90 or more days delinquent or in foreclosure at September 30, 2018. The LTV ratios were based on the current loan balance and either the lesser of the purchase price or original appraisal, or the most recent Bank appraisal, if available. At September 30, 2018, potential losses, after taking into consideration anticipated PMI proceeds and estimated selling costs, have been charged-off.
Loans 30 to 89 | Loans 90 or More Days Delinquent | |||||||||||||||||||||||
One- to Four-Family | Days Delinquent | or in Foreclosure | ||||||||||||||||||||||
State | Amount | % of Total | Amount | % of Total | Amount | % of Total | LTV | |||||||||||||||||
(Dollars in thousands) | ||||||||||||||||||||||||
Kansas | $ | 3,640,185 | 53.8 | % | $ | 9,186 | 51.2 | % | $ | 4,765 | 55.8 | % | 62 | % | ||||||||||
Missouri | 1,236,483 | 18.3 | 3,320 | 18.5 | 1,060 | 12.4 | 62 | |||||||||||||||||
Texas | 743,013 | 11.0 | 1,848 | 10.3 | 450 | 5.3 | 45 | |||||||||||||||||
Tennessee | 226,820 | 3.3 | — | — | — | — | n/a | |||||||||||||||||
California | 195,710 | 2.9 | — | — | — | — | n/a | |||||||||||||||||
Pennsylvania | 108,818 | 1.6 | 299 | 1.6 | — | — | n/a | |||||||||||||||||
Georgia | 94,604 | 1.4 | — | — | 391 | 4.6 | 50 | |||||||||||||||||
Alabama | 91,526 | 1.3 | — | — | — | — | n/a | |||||||||||||||||
North Carolina | 64,596 | 1.0 | — | — | 122 | 1.4 | 79 | |||||||||||||||||
Other states | 363,531 | 5.4 | 3,299 | 18.4 | 1,746 | 20.5 | 67 | |||||||||||||||||
$ | 6,765,286 | 100.0 | % | $ | 17,952 | 100.0 | % | $ | 8,534 | 100.0 | % | 61 | ||||||||||||
Troubled Debt Restructurings. For borrowers experiencing financial difficulties, the Bank may grant a concession to the borrower, resulting in a TDR. Such concessions generally involve extensions of loan maturity dates, the granting of periods during which the payment of only interest and escrow is required, reductions in interest rates, and loans that have been discharged under Chapter 7 bankruptcy proceedings where the borrower has not reaffirmed the debt. The Bank does not forgive principal or interest, nor does it commit to lend additional funds, except for situations generally involving the capitalization of delinquent interest and/or escrow not to exceed the original loan balance, to these borrowers. See "Part II, Item 8. Financial Statements and Supplementary Data – Notes to Consolidated Financial Statements – Note 1. Summary of Significant Accounting Policies and Note 5. Loans Receivable and Allowance for Credit Losses" for additional information related to TDRs.
The following table presents the Company's TDRs, based on accrual status, at the dates indicated.
September 30, | |||||||||||||||||||
2018 | 2017 | 2016 | 2015 | 2014 | |||||||||||||||
(Dollars in thousands) | |||||||||||||||||||
Accruing TDRs | $ | 20,216 | $ | 27,383 | $ | 23,177 | $ | 24,331 | $ | 24,636 | |||||||||
Nonaccrual TDRs(1) | 4,652 | 11,742 | 18,725 | 15,511 | 13,370 | ||||||||||||||
Total TDRs | $ | 24,868 | $ | 39,125 | $ | 41,902 | $ | 39,842 | $ | 38,006 | |||||||||
(1) | Nonaccrual TDRs are included in the non-performing loan table above. |
Impaired Loans. A loan is considered impaired when, based on current information and events, it is probable that the Bank will be unable to collect all amounts due, including principal and interest, according to the original contractual terms of the loan agreement. Interest income on impaired loans is recognized in the period collected unless the ultimate collection of principal is considered doubtful. The unpaid principal balance of loans reported as impaired at September 30, 2018, 2017, and 2016 was $29.9 million, $44.4 million, and $58.9 million, respectively. During the fourth quarter of fiscal year 2017, management refined its methodology for classifying loans as impaired which, though not material, resulted in fewer loans being classified as impaired in the current fiscal year.
15
See "Part II, Item 8. Financial Statements and Supplementary Data – Notes to Consolidated Financial Statements – Note 1. Summary of Significant Accounting Policies and Note 5. Loans Receivable and Allowance for Credit Losses" for additional information related to impaired loans.
Classified Assets. In accordance with the Bank's asset classification policy, management regularly reviews the problem assets in the Bank's portfolio to determine whether any assets require classification. See "Part II, Item 8. Financial Statements and Supplementary Data – Notes to Consolidated Financial Statements – Note 5. Loans Receivable and Allowance for Credit Losses" for asset classification definitions.
The following table sets forth the recorded investment in assets, classified as either special mention or substandard, as of September 30, 2018. See "Part II, Item 8. Financial Statements and Supplementary Data – Notes to Consolidated Financial Statements – Note 5. Loans Receivable and Allowance for Credit Losses" for information regarding asset classification definitions. At September 30, 2018, there were no loans classified as doubtful, and all loans classified as loss were fully charged-off.
Special Mention | Substandard | ||||||||||||
Number | Amount | Number | Amount | ||||||||||
(Dollars in thousands) | |||||||||||||
One- to four-family: | |||||||||||||
Originated | 76 | $ | 8,660 | 255 | $ | 22,409 | |||||||
Correspondent purchased | 4 | 997 | 13 | 3,126 | |||||||||
Bulk purchased | — | — | 29 | 7,195 | |||||||||
Commercial | 3 | 2,377 | 1 | 1,368 | |||||||||
Consumer Loans: | |||||||||||||
Home equity | 14 | 298 | 57 | 894 | |||||||||
Other | — | — | 4 | 10 | |||||||||
Total loans | 97 | 12,332 | 359 | 35,002 | |||||||||
OREO: | |||||||||||||
Originated | — | — | 8 | 843 | |||||||||
Bulk purchased | — | — | 1 | 454 | |||||||||
Commercial | — | — | 1 | 600 | |||||||||
Total OREO | — | — | 10 | 1,897 | |||||||||
Total classified assets | 97 | $ | 12,332 | 369 | $ | 36,899 | |||||||
Allowance for credit losses and Provision for credit losses. Management maintains an ACL to absorb inherent losses in the loan portfolio based on quarterly assessments of the loan portfolio. The ACL is maintained through provisions for credit losses which are either charged to or credited to income. Our ACL methodology considers a number of factors including the trend and composition of delinquent loans, trends in foreclosed property and short sale transactions and charge-off activity, the current status and trends of local and national employment levels, trends and current conditions in the real estate and housing markets, loan portfolio growth and concentrations, industry and peer charge-off activity and ACL ratios, and the Bank's ACL ratios. For our commercial loan portfolio, we also consider qualitative factors such as geographic locations, collateral types, tenant brand name, borrowing relationships, and lending relationships in the case of participation loans, among other factors. See "Part II, Item 7. Management's Discussion and Analysis of Financial Condition and Results of Operations – Critical Accounting Policies – Allowance for Credit Losses" and "Part II, Item 8. Financial Statements and Supplementary Data – Notes to Consolidated Financial Statements – Note 1. Summary of Significant Accounting Policies" for a full discussion of our ACL methodology. See "Part II, Item 8. Financial Statements and Supplementary Data – Notes to Consolidated Financial Statements – Note 5. Loans Receivable and Allowance for Credit Losses" for additional information on the ACL.
16
The Bank did not record a provision for credit losses during the current fiscal year or during the prior fiscal year. Based on management's assessment of the ACL formula analysis model and several other factors, management determined that no provision for credit losses was necessary. Net recoveries were $65 thousand during the current fiscal year and net charge-offs were $142 thousand during the prior fiscal year. At September 30, 2018 and 2017, respectively, loans 30 to 89 days delinquent were 0.25% and 0.26% of total loans and loans 90 or more days delinquent or in foreclosure were 0.12% and 0.13% of total loans.
The following table presents ACL activity and related ratios at the dates and for the periods indicated. Using the Bank's annualized net historical loan losses from the Bank's ACL formula analysis model over the past five years, the Bank would have approximately 22 years of net loan loss coverage based on the ACL balance at September 30, 2018.
Year Ended September 30, | |||||||||||||||||||
2018 | 2017 | 2016 | 2015 | 2014 | |||||||||||||||
(Dollars in thousands) | |||||||||||||||||||
Balance at beginning of period | $ | 8,398 | $ | 8,540 | $ | 9,443 | $ | 9,227 | $ | 8,822 | |||||||||
Charge-offs: | |||||||||||||||||||
One- to four-family: | |||||||||||||||||||
Originated | (136 | ) | (72 | ) | (200 | ) | (424 | ) | (284 | ) | |||||||||
Correspondent | (128 | ) | — | — | (11 | ) | (96 | ) | |||||||||||
Bulk purchased | — | (216 | ) | (342 | ) | (228 | ) | (653 | ) | ||||||||||
Total | (264 | ) | (288 | ) | (542 | ) | (663 | ) | (1,033 | ) | |||||||||
Consumer: | |||||||||||||||||||
Home equity | (32 | ) | (51 | ) | (83 | ) | (29 | ) | (103 | ) | |||||||||
Other | (6 | ) | (9 | ) | (5 | ) | (43 | ) | (6 | ) | |||||||||
Total | (38 | ) | (60 | ) | (88 | ) | (72 | ) | (109 | ) | |||||||||
Total charge-offs | (302 | ) | (348 | ) | (630 | ) | (735 | ) | (1,142 | ) | |||||||||
Recoveries: | |||||||||||||||||||
One- to four-family: | |||||||||||||||||||
Originated | 144 | 4 | 77 | 56 | 1 | ||||||||||||||
Bulk purchased | 196 | 165 | 374 | 58 | 64 | ||||||||||||||
Total | 340 | 169 | 451 | 114 | 65 | ||||||||||||||
Consumer: | |||||||||||||||||||
Home equity | 22 | 26 | 25 | 64 | 72 | ||||||||||||||
Other | 5 | 11 | 1 | 2 | 1 | ||||||||||||||
Total | 27 | 37 | 26 | 66 | 73 | ||||||||||||||
Total recoveries | 367 | 206 | 477 | 180 | 138 | ||||||||||||||
Net recoveries (charge-offs) | 65 | (142 | ) | (153 | ) | (555 | ) | (1,004 | ) | ||||||||||
Provision for credit losses | — | — | (750 | ) | 771 | 1,409 | |||||||||||||
Balance at end of period | $ | 8,463 | $ | 8,398 | $ | 8,540 | $ | 9,443 | $ | 9,227 | |||||||||
Ratio of net charge-offs during the period to | |||||||||||||||||||
average loans outstanding during the period | — | % | — | % | — | % | 0.01 | % | 0.02 | % | |||||||||
Ratio of net (recoveries) charge-offs during the | |||||||||||||||||||
period to average non-performing assets | (0.42 | ) | 0.56 | 0.48 | 1.87 | 3.38 | |||||||||||||
ACL to non-performing loans at end of period | 77.01 | 50.58 | 29.32 | 36.41 | 37.04 | ||||||||||||||
ACL to loans receivable, net at end of period | 0.11 | 0.12 | 0.12 | 0.14 | 0.15 | ||||||||||||||
ACL to net charge-offs | N/M(1) | 58.9x | 55.8x | 17.0x | 9.2x | ||||||||||||||
(1) | This ratio is not presented for the time period noted due to loan recoveries exceeding loan charge-offs during the period. |
17
The distribution of our ACL at the dates indicated is summarized below.
September 30, | ||||||||||||||||||||||||||||||||||
2018 | 2017 | 2016 | 2015 | 2014 | ||||||||||||||||||||||||||||||
% of | % of | % of | % of | % of | ||||||||||||||||||||||||||||||
Amount | Loans to | Amount | Loans to | Amount | Loans to | Amount | Loans to | Amount | Loans to | |||||||||||||||||||||||||
of ACL | Total Loans | of ACL | Total Loans | of ACL | Total Loans | of ACL | Total Loans | of ACL | Total Loans | |||||||||||||||||||||||||
(Dollars in thousands) | ||||||||||||||||||||||||||||||||||
One- to four-family: | ||||||||||||||||||||||||||||||||||
Originated | $ | 2,933 | 52.8 | % | $ | 3,149 | 55.1 | % | $ | 3,892 | 57.6 | % | $ | 4,833 | 60.6 | % | $ | 6,228 | 86.0 | % | ||||||||||||||
Correspondent purchased(1) | 1,861 | 33.4 | 1,922 | 34.0 | 2,102 | 31.7 | 2,115 | 27.9 | N/A | N/A | ||||||||||||||||||||||||
Bulk purchased | 925 | 3.9 | 1,000 | 4.9 | 1,065 | 6.0 | 1,434 | 7.3 | 2,323 | 8.9 | ||||||||||||||||||||||||
Construction | 20 | 0.4 | 24 | 0.4 | 36 | 0.6 | 32 | 0.4 | 35 | 1.1 | ||||||||||||||||||||||||
Total | 5,739 | 90.5 | 6,095 | 94.4 | 7,095 | 95.9 | 8,414 | 96.2 | 8,586 | 96.0 | ||||||||||||||||||||||||
Commercial: | ||||||||||||||||||||||||||||||||||
Commercial real estate | 1,801 | 5.7 | 1,242 | 2.6 | 774 | 1.6 | 604 | 1.6 | 312 | 1.2 | ||||||||||||||||||||||||
Commercial and industrial | 21 | 0.8 | — | — | — | — | — | — | — | — | ||||||||||||||||||||||||
Construction | 734 | 1.1 | 870 | 1.2 | 434 | 0.6 | 138 | 0.2 | 88 | 0.6 | ||||||||||||||||||||||||
Total | 2,556 | 7.6 | 2,112 | 3.8 | 1,208 | 2.2 | 742 | 1.8 | 400 | 1.8 | ||||||||||||||||||||||||
Consumer loans: | ||||||||||||||||||||||||||||||||||
Home equity | 129 | 1.8 | 159 | 1.7 | 187 | 1.8 | 222 | 1.9 | 211 | 2.1 | ||||||||||||||||||||||||
Other consumer | 39 | 0.1 | 32 | 0.1 | 50 | 0.1 | 65 | 0.1 | 30 | 0.1 | ||||||||||||||||||||||||
Total consumer loans | 168 | 1.9 | 191 | 1.8 | 237 | 1.9 | 287 | 2.0 | 241 | 2.2 | ||||||||||||||||||||||||
$ | 8,463 | 100.0 | % | $ | 8,398 | 100.0 | % | $ | 8,540 | 100.0 | % | $ | 9,443 | 100.0 | % | $ | 9,227 | 100.0 | % | |||||||||||||||
(1) | The disaggregation of data related to correspondent purchased loans is not available for years prior to fiscal year 2015. For fiscal year 2014, correspondent purchased amounts were combined with originated loans in the ACL formula analysis model. |
Loans purchased from CCB are included in the table above. The majority of these loans were not deemed purchased credit impaired ("PCI") as of the acquisition date ("non-PCI loans"). The net purchase discounts associated with non-PCI loans was compared to the amount of hypothetical ACL estimated for these loans at September 30, 2018. See "Part II, Item 7. Management's Discussion and Analysis of Financial Condition and Results of Operations – Critical Accounting Policies – Allowance for Credit Losses" for additional information regarding management's estimation of the hypothetical ACL for non-PCI loans. As a result of this analysis, management determined the net purchase discounts were sufficient and no ACL was required on those loans at September 30, 2018.
18
Investment Activities
Federally chartered savings institutions have the authority to invest in various types of liquid assets, including U.S. Treasury obligations; securities of various federal agencies; government-sponsored enterprises ("GSEs"), including callable agency securities; municipal bonds; certain certificates of deposit of insured banks and savings institutions; certain bankers' acceptances; repurchase agreements; and federal funds. Subject to various restrictions, federally chartered savings institutions may also invest their assets in investment grade commercial paper, corporate debt securities, and mutual funds whose assets conform to the investments that a federally chartered savings institution is otherwise authorized to make directly. As a member of FHLB, the Bank is required to maintain a specified investment in FHLB stock. See "Regulation and Supervision – Federal Home Loan Bank System" and "Office of the Comptroller of the Currency" for a discussion of additional restrictions on our investment activities.
ALCO considers various factors when making investment decisions, including the liquidity, credit, interest rate risk, and tax consequences of the proposed investment options. The composition of the investment portfolio will be affected by various market conditions, including the slope of the yield curve, the level of interest rates, the impact on the Bank's interest rate risk, the trend of net deposit flows, the volume of loan sales, repayments of borrowings, and loan originations and purchases.
The general objectives of the Bank's investment portfolio are to provide liquidity when loan demand is high, to assist in maintaining earnings when loan demand is low, and to maximize earnings while satisfactorily managing liquidity risk, interest rate risk, reinvestment risk, and credit risk. Liquidity may increase or decrease depending upon the availability of funds and comparative yields on investments in relation to the return on loans. Cash flow projections are reviewed regularly and updated to ensure that adequate liquidity is maintained.
We classify securities as either trading, available-for-sale ("AFS"), or held-to-maturity ("HTM") at the date of purchase. Securities that are purchased and held principally for resale in the near future are classified as trading securities and are reported at fair value with unrealized gains and losses reported in the consolidated statements of income. AFS securities are reported at fair value with unrealized gains and losses reported as a component of accumulated other comprehensive income (loss) ("AOCI") within stockholders' equity, net of deferred income taxes. HTM securities are reported at cost, adjusted for amortization of premium and accretion of discount. We have both the ability and intent to hold our HTM securities to maturity.
On a quarterly basis, management conducts a formal review of securities for the presence of an other-than-temporary impairment. The process involves monitoring market events and other items that could impact issuers. See "Part II, Item 8. Financial Statements and Supplementary Data – Notes to Consolidated Financial Statements – Note 1. Summary of Significant Accounting Policies" for additional information. Management does not believe any other-than-temporary impairments existed at September 30, 2018.
Investment Securities. Our investment securities portfolio consists primarily of debentures issued by GSEs (primarily Federal National Mortgage Association ("FNMA"), Federal Home Loan Mortgage Corporation ("FHLMC") and the Federal Home Loan Banks) and non-taxable municipal bonds. At September 30, 2018, our investment securities portfolio totaled $289.9 million. The portfolio consisted of securities classified as either HTM or AFS. See "Part II, Item 8. Financial Statements and Supplementary Data – Notes to Consolidated Financial Statements – Note 4. Securities" and "Part II, Item 7. Management's Discussion and Analysis of Financial Condition and Results of Operations – Financial Condition – Investment Securities" for additional information.
Mortgage-Backed Securities. At September 30, 2018, our MBS portfolio totaled $1.04 billion. The portfolio consisted of securities classified as either HTM or AFS and were primarily issued by GSEs. The principal and interest payments of MBS issued by GSEs are collateralized by the underlying mortgage assets with principal and interest payments guaranteed by the GSEs. The underlying mortgage assets are conforming mortgages that comply with FNMA and FHLMC underwriting guidelines, as applicable, and are therefore not considered subprime. See "Part II, Item 8. Financial Statements and Supplementary Data – Notes to Consolidated Financial Statements – Note 4. Securities" and "Management's Discussion and Analysis of Financial Condition and Results of Operations – Financial Condition – Mortgage-Backed Securities" for additional information.
19
MBS generally yield less than the loans that underlie such securities because of the servicing fee retained by the servicer and the cost of payment guarantees or credit enhancements retained by the GSEs that reduce credit risk. However, MBS are generally more liquid than individual mortgage loans and may be used to collateralize certain borrowings and public unit deposits of the Bank. In general, MBS issued or guaranteed by FNMA and FHLMC are weighted at no more than 20% for risk-based capital purposes compared to the 50% risk-weighting assigned to most non-securitized one- to four-family loans.
When securities are purchased for a price other than par value, the difference between the price paid and par is accreted to or amortized against the interest earned over the life of the security, depending on whether a discount or premium to par was paid. Movements in interest rates affect prepayment rates which, in turn, affect the average lives of MBS and the speed at which the discount or premium is accreted to or amortized against earnings.
At September 30, 2018, the MBS portfolio included $145.5 million of collateralized mortgage obligations ("CMOs"). CMOs are special types of MBS in which the stream of principal and interest payments on the underlying mortgages or MBS are used to create investment classes with different maturities and, in some cases, different amortization schedules, as well as a residual interest, with each such class possessing different risk characteristics. We do not purchase residual interest bonds.
While MBS issued by FNMA and FHLMC carry a reduced credit risk compared to whole mortgage loans, these securities remain subject to the risk that a fluctuating interest rate environment, along with other factors such as the geographic distribution of the underlying mortgage loans, may alter the prepayment rate of the underlying mortgage loans and consequently affect both the prepayment speed and value of the securities. As noted above, the Bank, on some transactions, pays a premium over par value on MBS purchased. Large premiums could cause significant negative yield adjustments due to accelerated prepayments on the underlying mortgages. The balance of net premiums on our portfolio of MBS at September 30, 2018 was $3.4 million.
20
The following table sets forth the composition of our investment and MBS portfolios as of the dates indicated. At September 30, 2018, our investment securities portfolio did not contain securities of any issuer with an aggregate book value in excess of 10% of our stockholders' equity, excluding those issued by GSEs. The HTM security portfolio had an unrealized loss of $11.2 million at September 30, 2018 compared to an unrealized gain of $5.3 million at September 30, 2017. The change from an unrealized gain position to an unrealized loss position was due primarily to an increase in market interest rates between periods.
September 30, | ||||||||||||||||||||||||||||||||
2018 | 2017 | 2016 | ||||||||||||||||||||||||||||||
Carrying | % of | Fair | Carrying | % of | Fair | Carrying | % of | Fair | ||||||||||||||||||||||||
Value | Total | Value | Value | Total | Value | Value | Total | Value | ||||||||||||||||||||||||
(Dollars in thousands) | ||||||||||||||||||||||||||||||||
AFS: | ||||||||||||||||||||||||||||||||
MBS | $ | 445,090 | 62.3 | % | $ | 445,090 | $ | 141,516 | 34.0 | % | $ | 141,516 | $ | 178,507 | 33.9 | % | $ | 178,507 | ||||||||||||||
GSE debentures | 265,398 | 37.1 | 265,398 | 270,729 | 65.1 | 270,729 | 347,038 | 65.8 | 347,038 | |||||||||||||||||||||||
Trust Preferred Securities | — | — | — | 2,051 | 0.5 | 2,051 | 1,756 | 0.3 | 1,756 | |||||||||||||||||||||||
Municipal bonds | 4,126 | 0.6 | 4,126 | 1,535 | 0.4 | 1,535 | — | — | — | |||||||||||||||||||||||
714,614 | 100.0 | % | 714,614 | 415,831 | 100.0 | % | 415,831 | 527,301 | 100.0 | % | 527,301 | |||||||||||||||||||||
HTM: | ||||||||||||||||||||||||||||||||
MBS | 591,900 | 96.7 | % | 580,825 | 800,931 | 96.8 | % | 806,096 | 1,067,571 | 97.0 | % | 1,089,214 | ||||||||||||||||||||
Municipal bonds | 20,418 | 3.3 | 20,246 | 26,807 | 3.2 | 26,913 | 33,303 | 3.0 | 33,653 | |||||||||||||||||||||||
612,318 | 100.0 | % | 601,071 | 827,738 | 100.0 | % | 833,009 | 1,100,874 | 100.0 | % | 1,122,867 | |||||||||||||||||||||
$ | 1,326,932 | $ | 1,315,685 | $ | 1,243,569 | $ | 1,248,840 | $ | 1,628,175 | $ | 1,650,168 | |||||||||||||||||||||
21
The composition and maturities of the investment and MBS portfolio at September 30, 2018 are indicated in the following table by remaining contractual maturity, without consideration of call features or pre-refunding dates, along with associated weighted average yields. Yields on tax-exempt investments are not calculated on a fully taxable equivalent basis.
1 year or less | More than 1 to 5 years | More than 5 to 10 years | Over 10 years | Total Securities | ||||||||||||||||||||||||||||||||||
Carrying | Carrying | Carrying | Carrying | Carrying | Fair | |||||||||||||||||||||||||||||||||
Value | Yield | Value | Yield | Value | Yield | Value | Yield | Value | Yield | Value | ||||||||||||||||||||||||||||
(Dollars in thousands) | ||||||||||||||||||||||||||||||||||||||
AFS: | ||||||||||||||||||||||||||||||||||||||
MBS | $ | 525 | 4.18 | % | $ | 25,130 | 3.80 | % | $ | 78,104 | 3.13 | % | $ | 341,331 | 2.96 | % | $ | 445,090 | 3.04 | % | $ | 445,090 | ||||||||||||||||
GSE debentures | 52,823 | 1.31 | 212,575 | 2.28 | — | — | — | — | 265,398 | 2.09 | 265,398 | |||||||||||||||||||||||||||
Municipal bonds | 1,653 | 1.69 | 2,473 | 1.54 | — | — | — | — | 4,126 | 1.60 | 4,126 | |||||||||||||||||||||||||||
55,001 | 1.35 | 240,178 | 2.43 | 78,104 | 3.13 | 341,331 | 2.96 | 714,614 | 2.68 | 714,614 | ||||||||||||||||||||||||||||
HTM: | ||||||||||||||||||||||||||||||||||||||
MBS | 843 | 3.63 | 97,587 | 1.50 | 308,982 | 2.09 | 184,488 | 2.78 | 591,900 | 2.21 | 580,825 | |||||||||||||||||||||||||||
Municipal bonds | 4,161 | 1.31 | 16,257 | 1.61 | — | — | — | — | 20,418 | 1.55 | 20,246 | |||||||||||||||||||||||||||
5,004 | 1.70 | 113,844 | 1.52 | 308,982 | 2.09 | 184,488 | 2.78 | 612,318 | 2.19 | 601,071 | ||||||||||||||||||||||||||||
$ | 60,005 | 1.37 | $ | 354,022 | 2.14 | $ | 387,086 | 2.30 | $ | 525,819 | 2.90 | $ | 1,326,932 | 2.45 | $ | 1,315,685 | ||||||||||||||||||||||
22
Sources of Funds
General. Our primary sources of funds are deposits, FHLB borrowings, repurchase agreements, repayments and maturities of outstanding loans and MBS and other short-term investments, and funds provided by operations.
Deposits. We offer a variety of retail deposit accounts, and with the acquisition of CCB, we began offering commercial deposit accounts and services. Our deposit account offerings have a wide range of interest rates and terms. Our deposits consist of savings accounts, money market deposit accounts, interest-bearing and non-interest-bearing checking accounts, and certificates of deposit. We rely primarily upon competitive pricing policies, marketing, and customer service to attract and retain deposits. The flow of deposits is influenced significantly by general economic conditions, changes in money market and prevailing interest rates, and competition. The variety of deposit accounts we offer has allowed us to utilize strategic pricing to obtain funds and to respond with flexibility to changes in consumer demand. We seek to manage the pricing of our deposits in keeping with our asset and liability management, liquidity, and profitability objectives. Based on our experience, we believe that our deposits are stable sources of funds. Despite this stability, our ability to attract and maintain these deposits and the rates paid on them has been, and will continue to be, significantly affected by market conditions.
With the acquisition of CCB on August 31, 2018, we started obtaining interest-bearing deposits through the Promontory Interfinancial Network Insured Cash Sweep Service ("Promontory Cash Sweep deposits"). Through this service, customers elect to place their deposit account funds in deposit accounts at various members of the insured cash sweep network, which provides customers with access to additional FDIC insurance coverage. The average Promontory Cash Sweep deposits totaled $49.8 million during the month of September 2018.
The Board of Directors has authorized the utilization of brokers to obtain deposits as a source of funds. Depending on market conditions, the Bank may use brokered deposits to fund asset growth and gather deposits that may help to manage interest rate risk. No brokered deposits were acquired during fiscal year 2018 and there were no brokered deposits outstanding at September 30, 2018 or 2017.
The Board of Directors also has authorized the utilization of public unit deposits as a source of funds. In order to qualify to obtain such deposits, the Bank must have a branch in each county in which it collects public unit deposits and, by law, must pledge securities as collateral for all such balances in excess of the FDIC insurance limits. At September 30, 2018 and 2017, the balance of public unit certificates of deposit was $407.7 million and $460.0 million, respectively.
As of September 30, 2018, the Bank's policy allows for combined brokered and public unit deposits up to 15% of total deposits. At September 30, 2018, that amount was approximately 8% of total deposits.
Borrowings. We utilize borrowings when we need additional capacity to fund loan demand or when they help us meet our asset and liability management objectives. Historically, our term borrowings have consisted primarily of FHLB advances. FHLB advances may be made pursuant to several different credit programs, each of which has its own interest rate, maturity, repayment, and embedded options, if any. At September 30, 2018, $1.60 billion of our FHLB advances were fixed-rate advances with no embedded options and $475.0 million of our FHLB advances were variable-rate, also with no embedded options. The variable-rate advances are tied to interest rate swaps, effectively converting the adjustable-rate borrowings into fixed-rate liabilities. The Bank supplements FHLB borrowings with repurchase agreements, wherein the Bank enters into agreements with Board approved counterparties to sell securities under agreements to repurchase them. These agreements are recorded as financing transactions as the Bank maintains effective control over the transferred securities. Repurchase agreements are made at mutually agreed upon terms between counterparties and the Bank. The use of repurchase agreements allows for the diversification of funding sources and the use of securities that were not being leveraged as collateral. The Bank also regularly uses its FHLB line of credit as a source of funding. The Bank's internal policy limits total borrowings to 55% of total assets.
During fiscal year 2018, the Bank continued, at times, to utilize a leverage strategy (the "leverage strategy") to increase earnings. The leverage strategy during the current fiscal year involved borrowing up to $2.10 billion either on the Bank's FHLB line of credit or by entering into short-term FHLB advances, depending on the rates offered by FHLB. The borrowings were repaid prior to each quarter end, or earlier if the strategy was suspended. The proceeds of the borrowings, net of the required FHLB stock holdings, were deposited at the Federal Reserve Bank of Kansas City ("FRB of Kansas City"). Management suspended the strategy at times during fiscal year 2018 due to the negative interest rate spread, which
23
resulted in the strategy not being profitable. Management continues to monitor the net interest rate spread and overall profitability of the strategy. It is expected that the strategy will be reimplemented if it reaches a position that is profitable.
At September 30, 2018, we had $2.08 billion of FHLB advances, at par, outstanding. Total FHLB borrowings are secured by certain qualifying loans pursuant to a blanket collateral agreement with FHLB. Per FHLB's lending guidelines, total FHLB borrowings cannot exceed 40% of Bank Call Report total assets without the pre-approval of FHLB senior management. In July 2018, the president of the FHLB renewed the approval of the increase in the Bank's borrowing limit to 55% of Bank Call Report total assets through July 2019. This approval was also in place throughout fiscal year 2018. When the full leverage strategy is in place, FHLB borrowings may be in excess of 40% of the Bank's Call Report total assets, and may continue to be in excess of 40% as long as the Bank continues its leverage strategy and FHLB senior management continues to approve the Bank's borrowing limit being in excess of 40% of Call Report total assets.
At September 30, 2018, repurchase agreements totaled $100.0 million, or approximately 1% of total assets. The Bank may enter into additional repurchase agreements as management deems appropriate, not to exceed 15% of total assets and subject to the internal policy limit on total borrowings of 55%. The securities underlying the agreements continue to be reported in the Bank's securities portfolio. At September 30, 2018, we had securities with a fair value of $107.4 million pledged as collateral on repurchase agreements.
The following table sets forth certain information relating to the category of borrowings for which the average short-term balance outstanding during the period was at least 30% of stockholders' equity at the end of each period shown. The maximum balance, average balance, and weighted average contractual interest rate during the fiscal years shown reflect borrowings that were scheduled to mature within one year at any month-end during those years.
2018 | 2017 | 2016 | |||||||||
(Dollars in thousands) | |||||||||||
Short-Term FHLB Borrowings: | |||||||||||
Balance at end of period | $ | 975,000 | $ | 475,000 | $ | 500,000 | |||||
Maximum balance outstanding at any month-end during the period | 2,975,000 | 2,675,000 | 2,600,000 | ||||||||
Average balance | 2,189,483 | 2,520,217 | 2,436,749 | ||||||||
Weighted average contractual interest rate during the period | 1.65 | % | 1.27 | % | 0.70 | % | |||||
Weighted average contractual interest rate at end of period | 2.00 | 1.91 | 2.69 | ||||||||
Subsidiary Activities
At September 30, 2018, the Company had one wholly-owned subsidiary, the Bank. The Bank provides a full range of retail banking services through 58 banking offices serving primarily the metropolitan areas of Topeka, Wichita, Lawrence, Manhattan, Emporia and Salina, Kansas and portions of the metropolitan area of greater Kansas City. At September 30, 2018, the Bank had two wholly-owned subsidiaries, Capitol Funds, Inc. and Capital City Investments, Inc. At September 30, 2018, Capitol Funds, Inc. had one wholly-owned subsidiary, Capitol Federal Mortgage Reinsurance Company ("CFMRC"), which serves as a reinsurance company for certain PMI companies the Bank uses in its normal course of operations. CFMRC stopped writing new business for the Bank in January 2010. Capital City Investments, Inc. is a real estate and investment holding company. Each wholly-owned subsidiary is reported with the Company on a consolidated basis.
Regulation and Supervision
Set forth below is a description of certain laws and regulations that are applicable to Capitol Federal Financial, Inc. and the Bank.
General. The Bank, as a federally chartered savings bank, is subject to regulation and oversight by the OCC extending to all aspects of its operations. This regulation of the Bank is intended for the protection of depositors and other customers and not for the purpose of protecting the Company's stockholders. The Bank is required to maintain minimum levels of regulatory capital and is subject to some limitations on capital distributions to the Company. The Bank also is subject to regulation and examination by the FDIC, which insures the deposits of the Bank to the maximum extent permitted by law.
24
The Company is a unitary savings and loan holding company within the meaning of the Home Owners' Loan Act ("HOLA"). As such, the Company is registered with the FRB and subject to the FRB regulations, examinations, supervision, and reporting requirements. In addition, the FRB has enforcement authority over the Company. Among other things, this authority permits the FRB to restrict or prohibit activities that are determined to be a serious risk to the Bank.
The OCC and FRB enforcement authority includes, among other things, the ability to assess civil monetary penalties, to issue cease-and-desist or removal orders, and to initiate injunctive actions. In general, these enforcement actions may be initiated for violations of laws and regulations and unsafe or unsound practices. Other actions or inactions may provide the basis for enforcement action, including misleading or untimely reports filed. Except under certain circumstances, public disclosure of final enforcement actions by the OCC or the FRB is required by law.
Office of the Comptroller of the Currency. The investment and lending authority of the Bank is prescribed by federal laws and regulations and the Bank is prohibited from engaging in any activities not permitted by such laws and regulations.
As a federally chartered savings bank, the Bank is required to meet a Qualified Thrift Lender ("QTL") test. This test requires the Bank to have at least 65% of its portfolio assets, as defined by statute, in qualified thrift investments at month-end for 9 out of every 12 months on a rolling basis. Under an alternative test, the Bank's business must consist primarily of acquiring the savings of the public and investing in loans, while maintaining 60% of its assets in those assets specified in Section 7701(a)(19) of the Internal Revenue Code. Under either test, the Bank is required to maintain a significant portion of its assets in residential housing related loans and investments. An institution that fails to qualify as a QTL based upon one of these tests is immediately subject to certain restrictions on its operations, including a prohibition against capital distributions, except with the prior approval of both the OCC and the FRB, as necessary to meet the obligations of a company controlling the institution. If the Bank fails the QTL test and does not regain QTL status within one year, or fails the test for a second time, the Company must immediately register as, and become subject to, the restrictions applicable to a bank holding company. The activities authorized for a bank holding company are more limited than are the activities authorized for a savings and loan holding company. Three years after failing the test, an institution must divest all investments and cease all activities not permissible for both a national bank and a savings association. Failure to meet the QTL test is a statutory violation subject to enforcement action. As of September 30, 2018, the Bank met the QTL test.
The Bank is subject to a 35% of total assets limit on non-real estate consumer loans, commercial paper and corporate debt securities, and a 20% limit on commercial non-mortgage loans. At September 30, 2018, the Bank was in compliance with these limits.
The Bank's relationship with its depositors and borrowers is regulated to a great extent by federal laws and regulations, especially in such matters as the ownership of savings accounts and the form and content of mortgage requirements. In addition, the branching authority of the Bank is regulated by the OCC. The Bank is generally authorized to branch nationwide.
The Bank is subject to a statutory lending limit on aggregate loans to one person or a group of persons combined because of certain common interests. The general limit is equal to 15% of our unimpaired capital and surplus, plus an additional 10% for loans fully secured by readily marketable collateral. At September 30, 2018, the Bank's lending limit under this restriction was $181.6 million. The Bank has no loans or loan relationships in excess of its lending limit. Total loan commitments and loans outstanding to the Bank's largest borrowing relationship totaled $50.0 million at September 30, 2018, all of which was current according to its terms.
The Bank is subject to periodic examinations by the OCC. During these examinations, the examiners may require the Bank to increase its ACL and/or recognize additional charge-offs based on their judgments, which can impact our capital and earnings. As a federally chartered savings bank, the Bank is subject to a semi-annual assessment, based upon its total assets, to fund the operations of the OCC.
The OCC has adopted guidelines establishing safety and soundness standards on such matters as loan underwriting and documentation, asset quality, earnings standards, internal controls and audit systems, interest rate risk exposure, and compensation and other employee benefits. Any institution regulated by the OCC that fails to comply with these standards must submit a compliance plan.
25
Insurance of Accounts and Regulation by the FDIC. The DIF of the FDIC insures deposit accounts in the Bank up to applicable limits. The Dodd-Frank Wall Street Reform and Consumer Protection Act (the "Dodd-Frank Act") permanently increased the maximum amount of deposit insurance for banks, savings institutions, and credit unions to $250 thousand per separately insured deposit ownership right or category.
Under the FDIC's system for assessing insurance premiums, insured institutions that have not reported assets of $10 billion or more at the end of the quarter for at least four consecutive quarters on their Call Reports are assessed based on CAMELS component ratings and certain financial ratios. For these institutions, total base assessment rates currently range from 1.5 to 16 basis points for institutions with CAMELS composite ratings of 1 or 2, 3 to 30 basis points for those with a CAMELS composite score of 3, and 11 to 30 basis points for those with CAMELS composite scores of 4 or 5, all subject to adjustments. For the fiscal year ended September 30, 2018, the Bank paid $2.9 million in FDIC premiums. Assessment rates are applied to an institution's assessment base, which is its average consolidated total assets minus its average tangible equity during the assessment period.
An institution that has reported total assets at the end of the quarter of $10 billion or more for at least four consecutive quarters is assessed under a complex scorecard method employing many factors, including weighted average CAMELS ratings; a performance score; leverage ratio; ability to withstand asset-related stress; certain measures of concentration, core earnings, core deposits, credit quality, and liquidity; and a loss severity score and loss severity measure. Total base assessment rates for these institutions currently range from 1.5 to 40 basis points, subject to certain adjustments. For all institutions, the base assessment rates are expected to decrease when the reserve ratio increases to specified thresholds of 2% and 2.5%.
The FDIC has authority to increase insurance assessments, and any significant increases would have an adverse effect on the operating expenses and results of operations of the Company. Management cannot predict what assessment rates will be in the future. In an emergency, the FDIC may also impose a special assessment.
Insurance of deposits may be terminated by the FDIC upon a finding that an institution has engaged in unsafe or unsound practices, is in an unsafe or unsound condition to continue operations or has violated any applicable law, regulation, rule, order or condition imposed by the FDIC. We do not currently know of any practice, condition, or violation that may lead to termination of our deposit insurance.
The Dodd-Frank Act requires large institutions to bear the burden of raising the reserve ratio from 1.15% to 1.35%. To implement this mandate, large and highly complex institutions must pay an annual surcharge of 4.5 basis points on their assessment base. If the DIF reserve ratio has not reached 1.35% by December 31, 2018, the FDIC plans to impose a shortfall assessment on large institutions on March 31, 2019.
Since established small institutions will be contributing to the DIF while the reserve ratio remains between 1.15% and 1.35% and the large institutions are paying a surcharge, the FDIC will provide assessment credits to the established small institutions for the portion of their assessments that contribute to the increase. When the reserve ratio reaches 1.38%, the FDIC will automatically apply an established small institution's assessment credit to reduce its regular deposit insurance assessments.
FDIC-insured institutions are required to pay additional quarterly assessments called the FICO assessments in order to fund the interest on bonds issued to resolve thrift failures in the 1980s. The rate for these assessments is adjusted quarterly and is applied to the same base as used for the deposit insurance assessment. These assessments are expected to continue until the bonds mature through 2019. For the fiscal year ended September 30, 2018, the Bank paid $377 thousand in FICO assessments.
Transactions with Affiliates. Transactions between the Bank and its affiliates are required to be on terms as favorable to the institution as transactions with non-affiliates, and certain of these transactions are restricted to a percentage of the Bank's capital, and, in the case of loans, require eligible collateral in specified amounts. In addition, the Bank may not lend to any affiliate engaged in activities not permissible for a bank holding company or purchase or invest in the securities of affiliates.
26
Regulatory Capital Requirements. The Bank and Company are required to maintain specified levels of regulatory capital under regulations of the OCC and FRB, respectively. The current regulatory capital rules, sometimes referred to as the Basel III rules, became effective for the Company and Bank in January 2016, with some rules being transitioned into full effectiveness over two-to-four years.
Under the Basel III rules, the minimum capital ratios are as follows:
• | 4.5% common equity Tier 1 ("CET1") to risk-weighted assets. |
• | 6.0% Tier 1 capital to risk-weighted assets. |
• | 8.0% total capital to risk-weighted assets. |
• | 4.0% Tier 1 capital to average consolidated assets as reported on Call Reports, minus certain items deducted from Tier 1 capital (known as the "leverage ratio"). |
CET1 capital and Tier 1 capital for the Company and the Bank generally consists of common stock plus related surplus and retained earnings, adjusted for goodwill and other intangible assets and AOCI-related amounts. Also included in Tier 1 capital for the Company are trust preferred securities that were assumed in conjunction with the acquisition of CCB on August 31, 2018. Tier 2 capital for the Company and the Bank includes the balance of ACL; however, the amount of includable ACL in Tier 2 capital may be limited if the amount exceeds 1.25% of risk-weighted assets. At September 30, 2018, the Bank had $8.5 million of ACL, which was less than the 1.25% risk-weighted assets limit; therefore, the entire amount of ACL was includable in Tier 2 and total risk-based capital. Total capital for the Company and the Bank consists of Tier 1 capital plus the amount of includable ACL (Tier 2 capital).
The Basel III rules allow certain savings and loan holding companies to include certain hybrid securities, such as trust preferred securities, in Tier 1 capital so long as the institution had less than $15 billion in assets as of December 31, 2009, and the securities were issued before May 19, 2010. As mentioned above, the Company assumed trust preferred securities in conjunction with the acquisition of CCB on August 31, 2018 and the amounts will be included in Tier 1 capital until they have been redeemed, which management anticipates will occur in fiscal year 2019.
The Basel III rules require the Company and the Bank to maintain a capital conservation buffer above certain minimum capital ratios in order to avoid certain restrictions on capital distributions and other payments including dividends, share repurchases, and certain compensation. This requirement, which was 1.875% at September 30, 2018, became effective January 1, 2016 and is being phased in over a four year period by increasing the required buffer amount by 0.625% each year. At September 30, 2018 and 2017, the Bank and Company held capital in excess of the capital conservation buffer requirement. Once the buffer requirement is fully phased-in on January 1, 2019, the Bank and Company must maintain a balance of capital that exceeds by more than 2.5% each of the minimum risk-based capital ratios in order to satisfy the requirement, so that the required ratios will bear: (1) a CET1 capital ratio of more than 7.0%, (2) a Tier 1 capital ratio of more than 8.5%, and (3) a total capital (Tier 1 plus Tier 2) ratio of more than 10.5%.
The capital rules assign a risk weight to every asset and to certain off-balance sheet items, such as binding loan commitments, which are multiplied by credit conversion factors to convert them into asset equivalents. The risk weights for the Bank's and Company's assets and off-balance sheet items generally range from 0% to 150%. At September 30, 2018, the Bank and the Company each had risk-weighted assets of $4.79 billion.
For the quarter ended September 30, 2018, the Bank reported in its Call Report quarterly average assets of $9.26 billion and the Company reported to the FRB quarterly average assets of $9.28 billion.
A depository institution is considered to be well capitalized if it has (i) a total risk-based capital ratio of 10.0% or more, (ii) a CET1 risk-based capital ratio of 6.5% or more, (iii) a Tier 1 risk-based capital ratio of 8.0% or more, and (iv) a leverage ratio of 5.0% or more, and is not subject to any of certain specified requirements to meet and maintain a specific capital level for any capital measure. An institution that is not well capitalized is subject to certain restrictions on brokered deposits, including restrictions on the rates it can offer on its deposits generally. At September 30, 2018, the Bank was considered well capitalized under OCC regulations. See "Part II, Item 8. Financial Statements and Supplementary Data – Notes to Consolidated Financial Statements – Note 14. Regulatory Capital Requirements" and "Part II, Item 7. Management's Discussion and Analysis of Financial Condition and Results of Operations – Liquidity and Capital Resources" for additional regulatory capital information.
27
The OCC has the ability to establish individual minimum capital requirements for a particular institution which vary from the capital levels that would otherwise be required under the capital regulations, based on such factors as concentrations of credit risk, levels of interest rate risk, the risks of non-traditional activities, and other circumstances. The OCC has not imposed any such requirement on the Bank.
The OCC is authorized and, under certain circumstances, required to take certain actions against federal savings banks that are considered not to be adequately capitalized because they fail to meet the minimum ratios under the Basel III rules. Any such institution must submit a capital restoration plan for OCC approval and may not increase its assets, acquire another institution, establish a branch or engage in any new activities, and may not make capital distributions. The OCC may impose further restrictions. The plan must include a guaranty by the institution's holding company limited to the lesser of 5% of the institution's assets when it became undercapitalized, or the amount necessary to restore the institution to adequately capitalized status.
Federal regulations state that any institution that fails to comply with its capital plan or has a CET1 risk-based capital ratio of less than 4.0%, a Tier 1 risk-based capital ratio of less than 4.0%, a total risk-based capital ratio of less than 6.0%, or a leverage ratio of less than 3.0% is considered significantly undercapitalized and must be made subject to one or more additional specified actions and restrictions that may cover all aspects of its operations and may include a forced merger or acquisition of the institution. An institution with tangible equity to total assets of less than 2.0% is critically undercapitalized and becomes subject to further mandatory restrictions on its operations. The OCC generally is authorized to reclassify an institution into a lower capital category and impose the restrictions applicable to such category if the institution is engaged in unsafe or unsound practices or is in an unsafe or unsound condition. The imposition by the OCC of any of these measures on the Bank may have a substantial adverse effect on its operations and profitability. In general, the FDIC must be appointed receiver for a critically undercapitalized institution whose capital is not restored within the time provided.
When the FDIC as receiver liquidates an institution, the claims of depositors and the FDIC as their successor (for deposits covered by FDIC insurance) have priority over other unsecured claims against the institution.
Community Reinvestment and Consumer Protection Laws. In connection with its lending activities, the Bank is subject to a number of federal laws designed to protect borrowers and promote lending to various sectors of the economy and population. These include the Equal Credit Opportunity Act, the Truth-in-Lending Act, the Home Mortgage Disclosure Act, the Real Estate Settlement Procedures Act, the Secure and Fair Enforcement for Mortgage Licensing Act of 2008 ("SAFE Act"), and the Community Reinvestment Act ("CRA"). In addition, federal banking regulators, pursuant to the Gramm-Leach-Bliley Act, have enacted regulations limiting the ability of banks and other financial institutions to disclose nonpublic consumer information to non-affiliated third parties. The regulations require disclosure of privacy policies and allow consumers to prevent certain personal information from being shared with non-affiliated parties. With respect to federal consumer protection laws, regulations are generally promulgated by the CFPB, but the OCC examines the Bank for compliance with such laws.
The CRA requires the appropriate federal banking agency, in connection with its examination of an FDIC-insured institution, to assess its record in meeting the credit needs of the communities served by the bank, including low and moderate income neighborhoods. The federal banking regulators take into account the institution's record of performance under the CRA when considering applications for mergers, acquisitions, and branches. Under the CRA, institutions are assigned a rating of outstanding, satisfactory, needs to improve, or substantial non-compliance. The Bank received a satisfactory rating in its most recently completed CRA evaluation.
Bank Secrecy Act /Anti-Money Laundering Laws. The Bank is subject to the Bank Secrecy Act and other anti-money laundering laws and regulations, including the USA PATRIOT Act of 2001. These laws and regulations require the Bank to implement policies, procedures, and controls to detect, prevent, and report money laundering and terrorist financing and to verify the identity and source of deposits and wealth of its customers. Violations of these requirements can result in substantial civil and criminal sanctions. In addition, provisions of the USA PATRIOT Act require the federal financial institution regulatory agencies to consider the effectiveness of a financial institution's anti-money laundering activities when reviewing mergers and acquisitions.
28
Stress Testing. As required by the Dodd-Frank Act and the regulations of the FRB and the OCC, FDIC-insured institutions and their holding companies with average total consolidated assets greater than $10 billion must conduct annual, company-run stress tests under the baseline, adverse and severely adverse scenarios provided by the federal banking regulators. The Company and the Bank are not subject to this requirement as their average total consolidated assets for this purpose are not greater than $10 billion.
Federal Securities Law. The common stock of the Company is registered with the SEC under the Securities Exchange Act of 1934, as amended. The Company is subject to the information, proxy solicitation, insider trading restrictions and other requirements of the SEC under the Securities Exchange Act of 1934.
The Company stock held by persons who are affiliates of the Company may not be resold without registration or unless sold in accordance with certain resale restrictions. For this purpose, affiliates are generally considered to be executive officers, directors and principal stockholders. If the Company meets specified current public information requirements, each affiliate of the Company will be able to sell in the public market, without registration, a limited number of shares in any three-month period.
Federal Reserve System. The FRB requires all depository institutions to maintain reserves at specified levels against their transaction accounts, primarily checking accounts. At September 30, 2018, the Bank was in compliance with these reserve requirements. The Bank is authorized to borrow from the Federal Reserve Bank "discount window." An eligible institution need not exhaust other sources of funds before going to the discount window, nor are there restrictions on the purposes for which the borrower can use primary credit. At September 30, 2018, the Bank had no outstanding borrowings from the discount window.
Federal Home Loan Bank System. The Bank is a member of one of 11 regional Federal Home Loan Banks, each of which serves as a reserve, or central bank, for its members within its assigned region and is funded primarily from proceeds derived from the sale of consolidated obligations of the Federal Home Loan Bank System. It makes loans, called advances, to members and provides access to a line of credit in accordance with policies and procedures established by the Board of Directors of FHLB, which are subject to the oversight of the Federal Housing Finance Agency ("FHFA").
As a member, the Bank is required to purchase and maintain capital stock in FHLB. The minimum required FHLB stock amount is generally 4.5% of the Bank's FHLB advances and outstanding balance against the FHLB line of credit, and 2% of the outstanding principal of loans sold into the Mortgage Partnership Finance program. At September 30, 2018, the Bank had a balance of $99.7 million in FHLB stock, which was in compliance with this requirement. In past years, the Bank has received dividends on its FHLB stock, although no assurance can be given that these dividends will continue. On a quarterly basis, management conducts a review of FHLB to determine whether an other-than-temporary impairment of the FHLB stock is present. At September 30, 2018, management concluded there was no such impairment.
Federal Savings and Loan Holding Company Regulation. The purpose and powers of the Company are to pursue any or all of the lawful objectives of a savings and loan holding company and to exercise any of the powers accorded to a savings and loan holding company.
The HOLA prohibits a savings and loan holding company (directly or indirectly, or through one or more subsidiaries) from acquiring another savings association, or holding company thereof, without prior written approval from the FRB; acquiring or retaining, with certain exceptions, more than 5% of a non-subsidiary savings association, a non-subsidiary holding company, or a non-subsidiary company engaged in activities other than those permitted by the HOLA; or acquiring or retaining control of a depository institution that is not federally insured. In evaluating applications by savings and loan holding companies to acquire savings associations, the FRB must consider the financial and managerial resources and future prospects of the company and institution involved, the effect of the acquisition on the risk to the insurance funds, the convenience and needs of the community, competitive factors, and other factors.
The Dodd-Frank Act extended to savings and loan holding companies and codified the FRB's "source of strength" doctrine, which has long applied to bank holding companies. The FRB has promulgated regulations implementing its "source of strength" policy, which requires holding companies to act as a source of strength to their subsidiary depository institutions by providing capital, liquidity and other support in times of financial stress.
29
2018 Regulatory Reform. In May 2018, the Economic Growth, Regulatory Relief and Consumer Protection Act (the "Regulatory Relief Act"), was enacted to modify or remove certain financial reform rules and regulations, including some of those implemented under the Dodd-Frank Act. While the Regulatory Relief Act maintains most of the regulatory structure established by the Dodd-Frank Act, it amends certain aspects of the regulatory framework for small depository institutions with assets of less than $10 billion and for large banks with assets of more than $50 billion. Many of these changes could result in meaningful regulatory changes for community banks such as the Bank, and their holding companies.
The Regulatory Relief Act, among other matters, expands the definition of qualified mortgages which may be held by a financial institution and simplifies the regulatory capital rules for financial institutions and their holding companies with total consolidated assets of less than $10 billion by instructing the federal banking regulators to establish a single "Community Bank Leverage Ratio" of between 8 and 10 percent. Any qualifying depository institution or its holding company that exceeds the "community bank leverage ratio" will be considered to have met generally applicable leverage and risk-based regulatory capital requirements and any qualifying depository institution that exceeds the new ratio will be considered to be "well capitalized" under the prompt corrective action rules. In addition, the Regulatory Relief Act includes regulatory relief for community banks regarding regulatory examination cycles, call reports, the Volcker Rule (proprietary trading prohibitions), mortgage disclosures and risk weights for certain high-risk commercial real estate loans.
It is difficult at this time to predict when or how any new standards under the Regulatory Relief Act will ultimately be applied to the Bank or the Company or what specific impact the Regulatory Relief Act and the yet-to-be-written implementing rules and regulations will have on the Bank or the Company.
Taxation
Federal Taxation
General
The Company and the Bank are subject to federal income taxation in the same general manner as other corporations, with some exceptions discussed below. The Company files a consolidated federal income tax return. The Company is no longer subject to federal income tax examination for fiscal years prior to 2015.
Method of Accounting
For federal income tax purposes, the Bank currently reports its income and expenses on the accrual method of accounting and uses a fiscal year ending on September 30 for filing its federal income tax return.
Minimum Tax
The Internal Revenue Code imposes an alternative minimum tax at a rate of 20% on a base of regular taxable income plus certain tax preferences, called alternative minimum taxable income. The alternative minimum tax is payable to the extent such alternative minimum taxable income is in excess of the regular tax. The Tax Cuts and Jobs Act (the "Tax Act") enacted in December 2017 repealed the alternative minimum tax, but the repeal is not applicable to the Company until its September 30, 2019 federal income tax return. See additional information regarding the Tax Act in "Part II, Item 7. Management's Discussion and Analysis of Financial Condition and Results of Operations – Executive Summary."
Net Operating Loss Carryovers
For federal income tax purposes, a financial institution may carry back net operating losses to the preceding two taxable years and forward to the succeeding 20 taxable years. As of September 30, 2018, the Company assumed a net operating loss carryover of $1.1 million ($266 thousand tax effected) with the acquisition of CCB.
State Taxation
The earnings/losses of Capitol Federal Financial, Inc., Capitol Funds, Inc. and Capital City Investments, Inc. are combined for purposes of filing a consolidated Kansas corporate tax return. The Kansas corporate tax rate is 4.0%, plus a surcharge of 3.0% on earnings greater than $50 thousand.
30
The Bank files a Kansas privilege tax return. For Kansas privilege tax purposes, the minimum tax rate is 4.5% of earnings, which is calculated based on federal taxable income, subject to certain adjustments. The Bank has not received notification from the state of any potential tax liability for any years still subject to audit.
Additionally, the Bank files state tax returns in various other states where it has significant purchased loans and/or foreclosure activities. In these states, the Bank has either established nexus under an economic nexus theory or has exceeded enumerated nexus thresholds based on the amount of interest derived from sources within the state.
Employees
At September 30, 2018, we had a total of 775 employees, including 137 part-time employees. The full-time equivalent of our total employees at September 30, 2018 was 733. Our employees are not represented by any collective bargaining group. Management considers its employee relations to be good.
Executive Officers of the Registrant
John B. Dicus. Age 57 years. Mr. Dicus is Chairman of the Board of Directors, Chief Executive Officer, and President of the Bank and the Company. He has served as Chairman since January 2009 and Chief Executive Officer since January 2003. He has served as President of the Bank since 1996 and of the Company since its inception in March 1999. Prior to accepting the responsibilities of Chief Executive Officer, he served as Chief Operating Officer of the Bank and the Company. Prior to that, he served as the Executive Vice President of Corporate Services for the Bank for four years. He has been with the Bank in various other positions since 1985.
Kent G. Townsend. Age 57 years. Mr. Townsend serves as Executive Vice President and Chief Financial Officer of the Bank, its subsidiary, and the Company. Mr. Townsend also serves as Treasurer for the Company, Capitol Funds, Inc. and CFMRC. Mr. Townsend was promoted to Executive Vice President, Chief Financial Officer and Treasurer on September 1, 2005. Prior to that, he served as Senior Vice President, a position he held since April 1999, and Controller of the Company, a position he held since March 1999. He has served in similar positions with the Bank since September 1995. He served as the Financial Planning and Analysis Officer with the Bank for three years and other financial related positions since joining the Bank in 1984.
Rick C. Jackson. Age 53 years. Mr. Jackson serves as Executive Vice President, Chief Lending Officer and Community Development Director of the Bank and the Company. He also serves as the President of Capitol Funds, Inc., a subsidiary of the Bank and President of CFMRC. He has been with the Bank since 1993 and has held the position of Community Development Director since that time. He has held the position of Chief Lending Officer since February 2010.
Natalie G. Haag. Age 59 years. Ms. Haag serves as Executive Vice President and General Counsel of the Bank and the Company. Prior to joining the Bank and the Company in August 2012, Ms. Haag was 2nd Vice President, Director of Governmental Affairs and Assistant General Counsel for Security Benefit Corporation and Security Benefit Life Insurance Company in Topeka, Kansas. Security Benefit provides retirement products and services, including annuities and mutual funds. Ms. Haag was employed by Security Benefit since 2003. The Security Benefit companies are not parents, subsidiaries or affiliates of the Bank or the Company.
Carlton A. Ricketts. Age 61 years. Mr. Ricketts serves as Executive Vice President, Chief Corporate Services Officer of the Bank and the Company. Prior to accepting those responsibilities in April 2012, he served as Chief Strategic Planning Officer of the Bank, a position held since February 2007.
Daniel L. Lehman. Age 53 years. Mr. Lehman serves as Executive Vice President, Chief Retail Operations Officer of the Bank and Company. Prior to accepting those responsibilities in October 2016, he served as First Vice President and Accounting Director, a position held since May 2003 and Controller, a position held since 2005.
Robert D. Kobbeman. Age 63 years. Mr. Kobbeman joined the Bank and the Company at the time of the acquisition of CCB and serves as Executive Vice President, Chief Commercial Banking Officer. Prior to joining the Bank and the Company, Mr. Kobbeman was the President and Chief Executive Officer and a director of Capital City Bank since 2002. From 1998 to 2002, Mr. Kobbeman served as Executive Vice President, Chief Lending Officer of Capital City Bank.
31
Item 1A. Risk Factors
There are risks inherent in the Bank's and Company's business. The following is a summary of material risks and uncertainties relating to the operations of the Bank and the Company. Adverse experiences with these could have a material impact on the Company's financial condition and results of operations. Some of these risks and uncertainties are interrelated, and the occurrence of one or more of them may exacerbate the effect of others. These material risks and uncertainties are not necessarily presented in order of significance. In addition to the risks set forth below and the other risks described in this Annual Report, there may also be additional risks and uncertainties that are not currently known to us or that we currently deem to be immaterial that could materially and adversely affect our business, financial condition or operating results.
Changes in interest rates could have an adverse impact on our results of operations and financial condition.
Our results of operations are primarily dependent on net interest income, which is the difference between the interest earned on loans, securities, cash at the Federal Reserve Bank and dividends received on FHLB stock, and the interest paid on deposits and borrowings. Changes in interest rates could have an adverse impact on our results of operations and financial condition because the majority of our interest-earning assets are long-term, fixed-rate loans, while the majority of our interest-bearing liabilities are shorter term, and therefore subject to a greater degree of interest rate fluctuations. This type of risk is known as interest rate risk and is affected by prevailing economic and competitive conditions, including monetary policies of the FRB and fiscal policies of the United States federal government.
The impact of changes in interest rates is generally observed on the income statement. The magnitude of the impact will be determined by the difference between the amount of interest-earning assets and interest-bearing liabilities, both of which either reprice or mature within a given period of time. This difference provides an indication of the extent to which our net interest rate spread will be impacted by changes in interest rates. In addition, changes in interest rates will impact the expected level of repricing of the Bank's mortgage-related assets and callable debt securities. Generally, as interest rates decline, the amount of interest-earning assets expected to reprice will increase as borrowers have an economic incentive to reduce the cost of their mortgage or debt, which would negatively impact the Bank's interest income. Conversely, as interest rates rise, the amount of interest-earning assets expected to reprice will decline as the economic incentive to refinance the mortgage or debt is diminished. As this occurs, the amount of interest-earning assets repricing could diminish to the point where interest-bearing liabilities reprice to a higher interest rate at a faster pace than interest-earning assets, thus negatively impacting the Bank's net interest income.
Changes in interest rates can also have an adverse effect on our financial condition as AFS securities are reported at estimated fair value. We increase or decrease our stockholders' equity, specifically AOCI (loss), by the amount of change in the estimated fair value of our AFS securities, net of deferred taxes. Increases in interest rates generally decrease the fair value of AFS securities. Decreases in the fair value of AFS securities would, therefore, adversely impact stockholders' equity.
Changes in interest rates, as they relate to customers, can also have an adverse impact on our financial condition and results of operations. In times of rising interest rates, default risk may increase among borrowers with adjustable-rate loans as the rates on their loans adjust upward and their payments increase. Fluctuations in interest rates also affect customer demand for deposit products. Local competition could affect our ability to attract deposits, or could result in us paying more than competitors for deposits.
As was announced in July 2017, LIBOR is anticipated to be phased out by the end of 2021. As of September 30, 2018, the Bank's loan portfolio included $831.1 million of adjustable-rate loans for which the repricing index was tied to LIBOR. Additionally, the Bank has interest rate swaps with a notional amount of $475.0 million tied to LIBOR. Our loan agreements generally allow the Bank to choose a new index based upon comparable information if the current index is no longer available. The use of a new index could reduce our interest income and therefore have an adverse effect on our results of operations. Management continues to monitor the status and discussions regarding LIBOR.
In addition to general changes in interest rates, changes that affect the shape of the yield curve could negatively impact the Bank. The Bank's interest-bearing liabilities are generally priced based on short-term interest rates while the majority of the Bank's interest-earning assets are priced based on long-term interest rates. Income for the Bank is primarily driven by the spread between these rates. As a result, a steeper yield curve, meaning long-term interest rates are significantly higher than short-term interest rates, would provide the Bank with a better opportunity to increase net interest income. When the yield curve is flat, meaning long-term interest rates and short-term interest rates are essentially the same, or when the yield curve is inverted, meaning long-term interest rates are lower than short-term interest rates, the yield between interest-earning assets
32
and interest-bearing liabilities that reprice is compressed or diminished and would likely negatively impact the Bank's net interest income. See "Part II, Item 7A. Quantitative and Qualitative Disclosures About Market Risk" for additional information about the Bank's interest rate risk management.
The occurrence of any information system failure or interruption, breach of security or cyber-attack, at the Company, at its third-party service providers or counterparties may have an adverse effect on our business, reputation, financial condition or results of operations.
Information systems are essential to the conduct of our business, as we use such systems to manage our customer relationships, our general ledger, our deposits and our loans. In the normal course of our business, we collect, process, retain and transmit (by email and other electronic means) sensitive and confidential information regarding our customers, employees and others. We also outsource certain aspects of our data processing, data processing operations, remote network monitoring, engineering and managed security services to third-party service providers. In addition to confidential information regarding our customers, employees and others, we, and in some cases a third party, compile, process, transmit and store proprietary, non-public information concerning our business, operations, plans and strategies.
Information security risks for financial institutions continue to increase in part because of evolving technologies, the use of the Internet and telecommunications technologies (including mobile devices) to conduct financial and other business transactions and the increased sophistication and activities of organized crime, perpetrators of fraud, hackers, terrorists and others. Cyber criminals use a variety of tactics, such as ransomware, denial of service, and theft of sensitive business and customer information to extort payment or other concessions from victims. In some cases, these attacks have caused significant impacts on other businesses' access to data and ability to provide services. We are not able to anticipate or implement effective preventive measures against all incidents of these types, especially because the techniques used change frequently and because attacks can originate from a wide variety of sources.
We use a variety of physical, procedural and technological safeguards to prevent or limit the impact of system failures, interruptions and security breaches and to protect confidential information from mishandling, misuse or loss, including detection and response mechanisms designed to contain and mitigate security incidents. However, there can be no assurance that such events will not occur or that they will be promptly detected and adequately addressed if they do, and early detection of security breaches may be thwarted by sophisticated attacks and malware designed to avoid detection. If there is a failure in or breach of our information systems, or those of a third-party service provider, the confidential and other information processed and stored in, and transmitted through, such information systems could potentially be jeopardized, or could otherwise cause interruptions or malfunctions in our operations or the operations of our customers, employees, or others.
Our business and operations depend on the secure processing, storage and transmission of confidential and other information in our information systems and those of our third-party service providers. Although we devote significant resources and management focus to ensuring the integrity of our information systems through information security measures, risk management practices, relationships with threat intelligence providers and business continuity planning, our facilities, computer systems, software and networks, and those of our third-party service providers, may be vulnerable to external or internal security breaches, acts of vandalism, unauthorized access, misuse, computer viruses or other malicious code and cyber attacks that could have a security impact. In addition, breaches of security may occur through intentional or unintentional acts by those having authorized or unauthorized access to our confidential or other information or the confidential or other information of our customers, employees or others. While we regularly conduct security and risk assessments on our systems and those of our third-party service providers, there can be no assurance that their information security protocols are sufficient to withstand a cyber-attack or other security breach. The Company has not experienced any material breaches.
The occurrence of any of the foregoing could subject us to litigation or regulatory scrutiny, cause us significant reputational damage or erode confidence in the security of our information systems, products and services, cause us to lose customers or have greater difficulty in attracting new customers, have an adverse effect on the value of our common stock or subject us to financial losses that may not be covered by insurance, any of which could have a material adverse effect on our business, financial condition or results of operations. As information security risks and cyber threats continue to evolve, we may be required to expend significant additional resources to further enhance or modify our information security measures and/or to investigate and remediate any information security vulnerabilities or other exposures arising from operational and security risks.
33
Furthermore, there has recently been heightened legislative and regulatory focus on privacy, data protection and information security. New or revised laws and regulations may significantly impact our current and planned privacy, data protection and information security-related practices, the collection, use, sharing, retention and safeguarding of consumer and employee information, and current or planned business activities. Compliance with current or future privacy, data protection and information security laws could result in higher compliance and technology costs and could restrict our ability to provide certain products and services, which could have a material adverse effect on our business, financial condition or results of operations.
Our customers are also the target of cyber-attacks and identity theft. There have been several recent instances involving financial services and consumer-based companies reporting the unauthorized disclosure of client or customer information or the destruction or theft of corporate data. Large scale identity theft could result in customers' accounts being compromised and fraudulent activities being performed in their name. We have implemented certain safeguards against these types of activities but they may not fully protect us from fraudulent financial losses. The occurrence of a breach of security involving our customers' information, regardless of its origin, could damage our reputation and result in a loss of customers and business and subject us to additional regulatory scrutiny, and could expose us to litigation and possible financial liability. Any of these events could have a material adverse effect on our financial condition and results of operations.
An economic downturn, especially one affecting our geographic market area and certain regions of the country where we have correspondent loans, could adversely impact our business and financial results.
Our primary lending emphasis is the origination and purchase of one- to four-family first mortgage loans on residential properties; therefore, we are particularly exposed to downturns in regional housing markets and, to a lesser extent, the U.S. housing market, along with changes in the levels of unemployment or underemployment. We monitor the current status and trends of local and national employment levels and trends and current conditions in the real estate and housing markets in our local market areas and certain areas where we have correspondent loans. Adverse conditions in our local economies and in certain areas where we have correspondent loans, such as inflation, unemployment, recession, natural disasters, or other factors beyond our control, could impact the ability of our borrowers to repay their loans. Any one or a combination of these events may have an adverse impact on borrowers' ability to repay their loans, which could result in increased delinquencies, non-performing assets, loan losses, and future loan loss provisions. Decreases in local real estate values could adversely affect the value of the property used as collateral for our loans, which could cause us to realize a loss in the event of a foreclosure.
The increase in commercial loans in our loan portfolio exposes us to increased lending and credit risks.
A growing portion of our loan portfolio consists of commercial loans. In addition, as a result of the acquisition of CCB, it is anticipated that commercial lending will continue to be a growing portion of our business. These loan types tend to be larger than and in different geographic regions from most of our existing loan portfolio and are generally considered to have different and greater risks than one- to four-family residential real estate loans. Furthermore, these loan types can expose us to a greater risk of delinquencies, non-performing assets, loan losses, and future loan loss provisions than one- to four-family residential real estate loans because repayment of such loans often depends on the successful operations of a business or of the underlying property. Repayment of such loans may be affected by factors outside the borrower's control, such as adverse conditions in the real estate market, the economy, environmental factors, natural disasters, and/or changes in government regulation. Also, there are risks inherent in commercial real estate construction lending as the value of the project is uncertain prior to the completion of construction and subsequent lease-up. A sudden downturn in the economy or other unforeseen events could result in stalled projects or collateral shortfalls, thus exposing us to increased credit risk. Additionally, a large portion of our commercial loans were originated/participated in during the past five fiscal years, which makes it difficult to assess the future performance of these loans because of the borrowers' relatively limited income history and loan payment history.
Our recently acquired commercial and industrial loans are primarily made based on the identified cash flow of the borrower and secondarily on the collateral underlying the loans. The borrowers' cash flow may prove to be unpredictable, and collateral securing these loans may fluctuate in value. Most often, this collateral consists of accounts receivable, inventory and equipment. Significant adverse changes in a borrower's industries and businesses could cause rapid declines in values of, and collectability associated with, those business assets, which could result in inadequate collateral coverage for our commercial and industrial loans and expose us to future losses. In the case of loans secured by accounts receivable, the availability of funds for the repayment of these loans may be substantially dependent on the ability of the borrower to collect amounts due from its clients. Inventory and equipment may depreciate over time, may be difficult to appraise, may be illiquid and may
34
fluctuate in value based on the success of the business. If the cash flow from business operations is reduced, the borrower's ability to repay the loan may be impaired. An increase in specific reserves and charge-offs related to our recently acquired commercial and industrial loan portfolio could have an adverse effect on our business, financial condition, results of operations and future prospects.
Our commercial loans generally have significantly larger average loan balances compared to one- to four-family residential real estate loans and may involve multiple loans to groups of related borrowers. Our largest commercial lending relationship was $50.0 million at September 30, 2018.
A growing commercial loan portfolio subjects us to greater regulatory scrutiny. Regulatory agencies have observed that many commercial markets are experiencing substantial growth, and as a result, concentration levels of commercial loans have been rising at some institutions.
We regularly monitor the risks in our commercial loan portfolio, including concentrations in such factors as geographic locations, property types, tenant brand name, borrowing relationships, and lending relationships in the case of participation loans, among other factors. We continually strive to maintain high underwriting standards, including selecting borrowers and guarantors that are financially sound and experienced in the industry, and selecting projects that meet the Bank's lending policies and risk appetite. The properties securing our commercial loan portfolio are diverse in terms of type and geographic location. This diversity helps reduce our exposure to adverse economic events, environmental factors and natural disasters that may affect any single market or industry. For additional information regarding our commercial loan underwriting and monitoring of risk, see "Part 1, Item 1. Business - Lending Practices and Underwriting Standards - Commercial Lending."
We are heavily reliant on technology, and a failure to effectively implement technology initiatives or anticipate future technology needs or demands could adversely affect our business or performance.
Like most financial institutions, the Bank significantly depends on technology to deliver its products and other services and to otherwise conduct business. To remain technologically competitive and operationally efficient, the Bank invests in system upgrades, new technological solutions, and other technology initiatives. Many of these solutions and initiatives have a significant duration, are tied to critical information systems, and require substantial resources. Although the Bank takes steps to mitigate the risks and uncertainties associated with these solutions and initiatives, there is no guarantee that they will be implemented on time, within budget, or without negative operational or customer impact. The Bank also may not succeed in anticipating its future technology needs, the technology demands of its customers, or the competitive landscape for technology. If the Bank were to falter in any of these areas, it could have an adverse effect on our business, financial condition or results of operations.
We may be required to provide remedial consideration to borrowers whose loans we purchase from correspondent and nationwide lenders if it is discovered that the originating company did not properly comply with lending regulations during the origination process.
We purchase whole one- to four-family loans from correspondent and nationwide lenders. While loans purchased on a loan-by-loan basis from correspondent lenders are underwritten by the Bank's underwriters and loans purchased in bulk packages from correspondent and nationwide lenders are evaluated on a certain set of criteria before being purchased, we are still subject to some risks associated with the loan origination process itself. By law, loan originators are required to comply with lending regulations at all times during the origination process. Even though the Bank can contractually pursue the originating company, certain compliance related risks associated with the origination process itself may shift from the originating company to the Bank once the Bank purchases the loan. Should it be discovered, at any point, that an instance of noncompliance occurred by the originating company during the origination process, the Bank may still be held responsible and required to remedy the issue for the loans it purchased from the originator. Remedial actions can include refunding interest paid by the borrower and adjusting the contractual interest rate on the loan to the current market rate if advantageous to the borrower. The Bank no longer purchases loans in bulk from nationwide lenders due primarily to these risks.
Strong competition may limit growth and profitability.
While we are one of the largest mortgage loan originators in the state of Kansas, we compete in the same market areas as local, regional, and national banks, credit unions, mortgage brokerage firms, investment banking firms, investment brokerage firms, and savings institutions. We must also compete with online investment and mortgage brokerages and online banks that are not confined to any specific market area. Many of these competitors operate on a national or regional level, are a conglomerate of various financial services providers housed under one corporation, or otherwise have substantially greater
35
financial or technological resources than the Bank. We compete primarily on the basis of the interest rates offered to depositors, the terms of loans offered to borrowers, and the benefits afforded to customers as a local institution and portfolio lender. Our pricing strategy for loan and deposit products includes setting interest rates based on secondary market prices and local competitor pricing for our local markets, and secondary market prices and national competitor pricing for our correspondent lending markets. Should we face competitive pressure to increase deposit rates or decrease loan rates, our net interest income could be adversely affected. Additionally, our competitors may offer products and services that we do not or cannot provide, as certain deposit and loan products fall outside of our accepted level of risk. Our profitability depends upon our ability to compete in our local market areas.
We operate in a highly regulated environment which limits the manner and scope of our business activities and we may be adversely affected by new and/or changes in laws and regulations or interpretation of existing laws and regulations.
We are subject to extensive regulation, supervision, and examination by the OCC, FRB, and the FDIC. These regulatory authorities exercise broad discretion in connection with their supervisory and enforcement activities, including the ability to impose restrictions on a bank's operations, reclassify assets, determine the adequacy of a bank's ACL, and determine the level of deposit insurance premiums assessed. The Dodd-Frank Act created the CFPB with broad powers to supervise and enforce consumer protection laws, including a wide range of consumer protection laws that apply to all banks and savings institutions, like the authority to prohibit "unfair, deceptive or abusive" acts and practices. The CFPB also has examination and enforcement authority over all banks with regulatory assets exceeding $10 billion at four consecutive quarter-ends. The Bank has not exceeded $10 billion in regulatory assets at four consecutive quarter-ends, but it may at some point in the future. Smaller banks, like the Bank, will continue to be examined for compliance with the consumer laws and regulations of the CFPB by their primary bank regulators (the OCC, in the case of the Bank). The Dodd-Frank Act also weakens the federal preemption rules that have been applicable for national banks and federal savings associations, and gives state attorneys general the ability to enforce federal consumer protection laws.
Any change in such regulation and oversight, whether in the form of regulatory policy, regulations, legislation, interpretation or application, could have a material adverse impact on our operations. Moreover, bank regulatory agencies have been active in responding to concerns and trends identified in examinations, and have issued formal enforcement orders requiring capital ratios in excess of regulatory requirements and/or assessing monetary penalties. Bank regulatory agencies, such as the OCC and the FDIC, govern the activities in which we may engage, primarily for the protection of depositors, and not for the protection or benefit of investors. The CFPB enforces consumer protection laws and regulations for the benefit of the consumer and not the protection or benefit of investors. In addition, new laws and regulations may continue to increase our costs of regulatory compliance and of doing business, and otherwise affect our operations. New laws and regulations may significantly affect the markets in which we do business, the markets for and value of our loans and securities, the products we offer, the fees we can charge and our ongoing operations, costs, and profitability.
The Company is also directly subject to the requirements of entities that set and interpret the accounting standards such as the Financial Accounting Standards Board, and indirectly subject to the actions and interpretations of the Public Company Accounting Oversight Board, which establishes auditing and related professional practice standards for registered public accounting firms and inspects registered firms to assess their compliance with certain laws, rules, and professional standards in public company audits. These regulations, along with the currently existing tax, accounting, securities, and monetary laws, regulations, rules, standards, policies and interpretations, control the methods by which financial institutions and their holding companies conduct business, engage in strategic and tax planning, implement strategic initiatives, and govern financial reporting.
The Company's failure to comply with laws, regulations or policies could result in civil or criminal sanctions and money penalties by state and federal agencies, and/or reputation damage, which could have a material adverse effect on the Company's business, financial condition and results of operations. See "Part I, Item 1. Business - Regulation and Supervision" for more information about the regulations to which the Company is subject.
The Company's ability to pay dividends is subject to the ability of the Bank to make capital distributions to the Company.
The long-term ability of the Company to pay dividends to its stockholders is based primarily upon the ability of the Bank to make capital distributions to the Company, and also on the availability of cash at the holding company level in the event earnings are not sufficient to pay dividends. Under certain circumstances, capital distributions from the Bank to the
36
Company may be subject to regulatory approvals. See "Part II, Item 7. Management's Discussion and Analysis of Financial Condition and Results of Operations – Limitations on Dividends and Other Capital Distributions" for additional information.
Our risk-management and compliance programs and functions may not be effective in mitigating risk and loss.
We maintain an enterprise risk management program that is designed to identify, quantify, monitor, report, and control the risks that we face. These risks include: interest-rate, credit, liquidity, operations, reputation, compliance and litigation. We also maintain a compliance program to identify, measure, assess, and report on our adherence to applicable laws, policies and procedures. While we assess and improve these programs on an ongoing basis, there can be no assurance that our risk management or compliance programs, along with other related controls, will effectively mitigate all risk and limit losses in our business. If conditions or circumstances arise that expose flaws or gaps in our risk management or compliance programs, or if our controls do not function as designed, the performance and value of our business could be adversely affected.
The Company may not attract and retain skilled employees.
The Company's success depends, in large part, on its ability to attract and retain key people. Competition for the best people can be intense, and the Company spends considerable time and resources attracting and hiring qualified people for its operations. The unexpected loss of the services of one or more of the Company's key personnel could have a material adverse impact on the Company's business because of their skills, knowledge of the Company's market, and years of industry experience, as well as the difficulty of promptly finding qualified replacement personnel.
The Company may not realize all of the anticipated benefits of the acquisition of CCB.
The success of the Company's acquisition of CCB will depend on, among other things, the ability to realize anticipated cost savings and to combine the businesses of the companies in a manner that does not materially disrupt the existing customer relationships of the companies or result in decreased revenues from customers. If the Company is unable to achieve these objectives, the anticipated benefits of the acquisition may not be realized fully, if at all, or may take longer to realize than expected. Additionally, the integration of the two companies could result in the loss of key employees, the disruption of each company's ongoing businesses or inconsistencies in standards, weakness in our internal control over financial reporting, procedures and policies that adversely affect the Company's ability to maintain relationships with clients, customers, depositors and employees or to achieve the anticipated benefits of the acquisition. Integration efforts will also divert management attention and resources.
Item 1B. Unresolved Staff Comments
None.
Item 2. Properties
At September 30, 2018, we had 48 traditional branch offices and 10 in-store branch offices. The Bank owns the office building and related land in which its home office and executive offices are located, and 34 of its other branch offices. The remaining 23 branches are either leased or partially owned.
For additional information regarding our lease obligations, see "Part II, Item 8. Financial Statements and Supplementary Data – Notes to Consolidated Financial Statements – Note 6. Premises and Equipment, net."
Management believes that our current facilities are adequate to meet our present and immediately foreseeable needs. However, we will continue to monitor customer growth and expand our branching network, if necessary, to serve our customers' needs.
Item 3. Legal Proceedings
The Company and the Bank are involved as plaintiff or defendant in various legal actions arising in the normal course of business. In our opinion, after consultation with legal counsel, we believe it unlikely that such pending legal actions will have a material adverse effect on our financial condition, results of operations or liquidity.
Item 4. Mine Safety Disclosures
None.
37
PART II
Item 5. Market for Registrant's Common Equity, Related Stockholder Matters and Issuer Purchases of Equity Securities
Stock Listing
Capitol Federal Financial, Inc. common stock is traded on the Global Select tier of the NASDAQ Stock Market under the symbol "CFFN". At November 21, 2018, there were approximately 9,220 Capitol Federal Financial, Inc. stockholders of record.
Share Repurchases
On October 28, 2015, the Company announced a stock repurchase plan for up to $70.0 million of common stock. The plan does not have an expiration date. Since the Company completed its second-step conversion in December 2010, $368.0 million worth of shares have been repurchased.
The following table summarizes our share repurchase activity during the three months ended September 30, 2018 and additional information regarding our share repurchase program.
Approximate | |||||||||||||
Total | Total Number of | Dollar Value of | |||||||||||
Number of | Average | Shares Purchased as | Shares that May | ||||||||||
Shares | Price Paid | Part of Publicly | Yet Be Purchased | ||||||||||
Purchased | per Share | Announced Plans | Under the Plan | ||||||||||
July 1, 2018 through | |||||||||||||
July 31, 2018 | — | $ | — | — | $ | 70,000,000 | |||||||
August 1, 2018 through | |||||||||||||
August 31, 2018 | — | — | — | 70,000,000 | |||||||||
September 1, 2018 through | |||||||||||||
September 30, 2018 | — | — | — | 70,000,000 | |||||||||
Total | — | — | — | 70,000,000 | |||||||||
Stockholders and General Inquiries
Copies of our Annual Report on Form 10-K for the fiscal year ended September 30, 2018 are available to stockholders at no charge in the Investor Relations section of our website, www.capfed.com.
38
Stockholder Return Performance Presentation
The information presented below assumes $100 invested on September 30, 2013 in the Company's common stock and in each of the indices, and assumes the reinvestment of all dividends. Historical stock price performance is not necessarily indicative of future stock price performance.
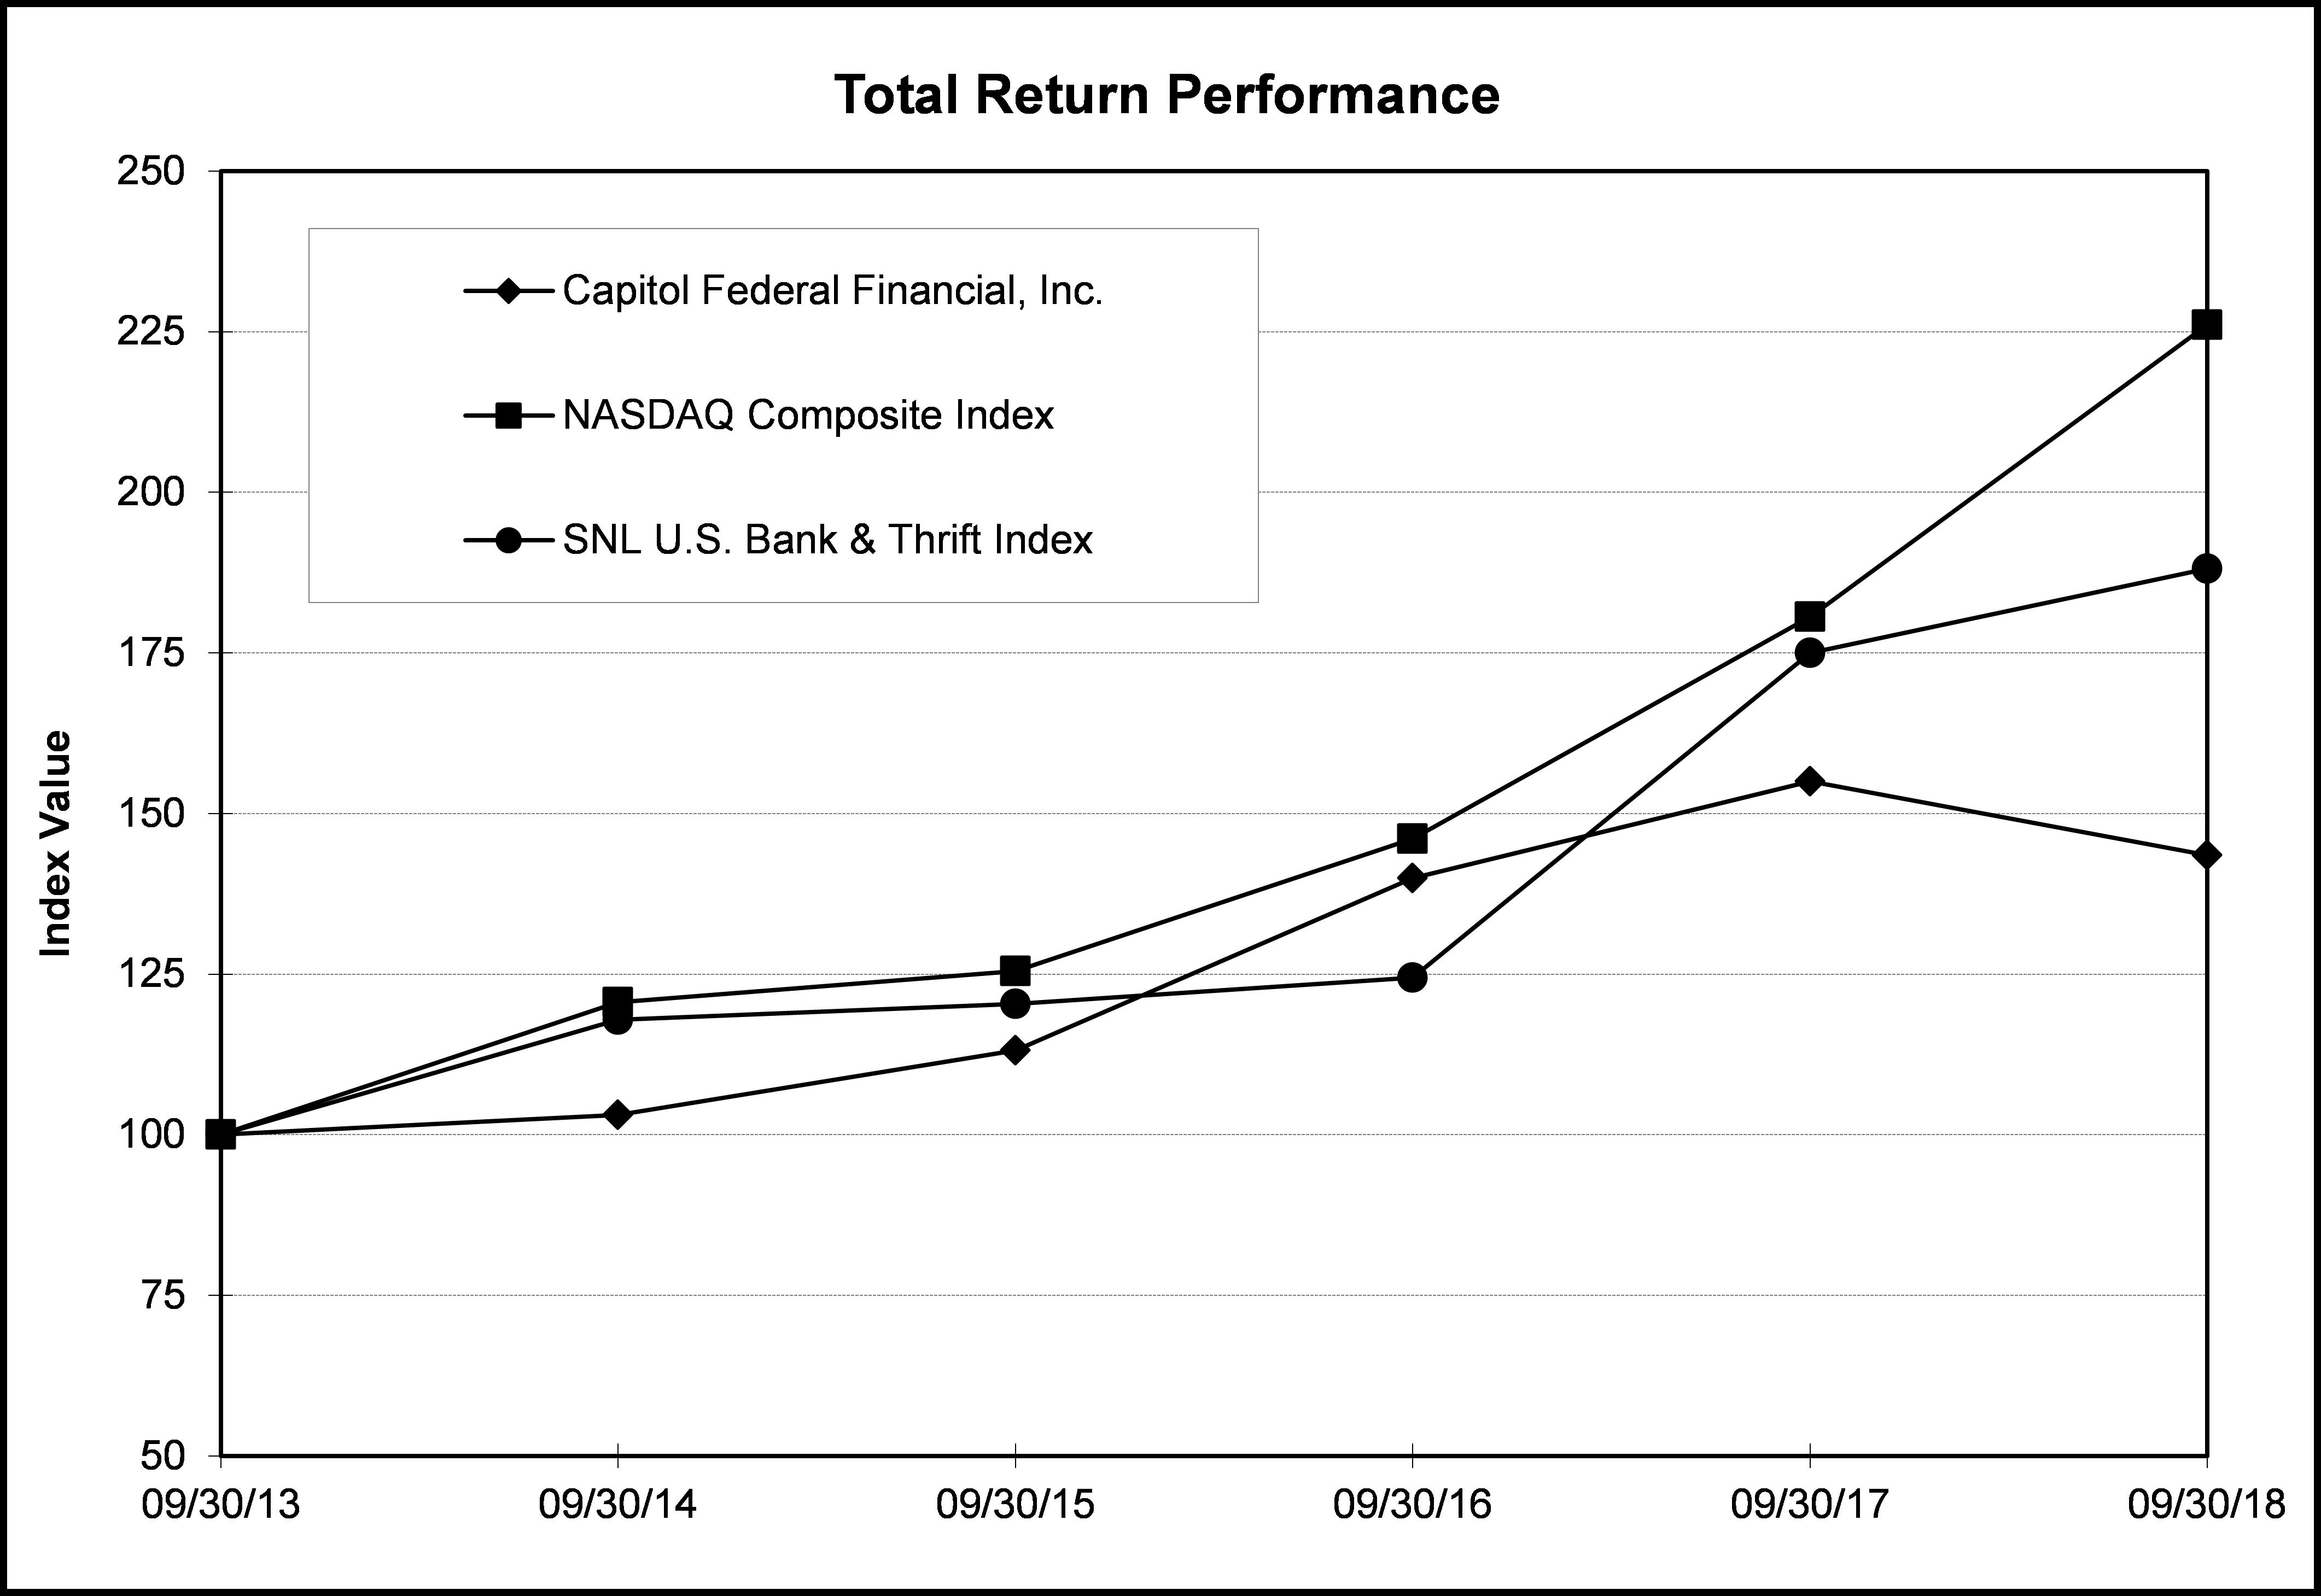
Period Ending | ||||||||||||
Index | 9/30/2013 | 9/30/2014 | 9/30/2015 | 9/30/2016 | 9/30/2017 | 9/30/2018 | ||||||
Capitol Federal Financial, Inc. | 100.00 | 103.05 | 113.10 | 139.97 | 155.01 | 143.51 | ||||||
NASDAQ Composite Index | 100.00 | 120.61 | 125.43 | 146.03 | 180.62 | 226.08 | ||||||
SNL U.S. Bank & Thrift Index | 100.00 | 117.86 | 120.33 | 124.41 | 174.98 | 188.09 | ||||||
Source: S&P Global Market Intelligence
Restrictions on the Payments of Dividends
The Company's ability to pay dividends is dependent, in part, upon its ability to obtain capital distributions from the Bank. The dividend policy of the Company is subject to the discretion of the Board of Directors and will depend upon a number of factors, including the Company's financial condition and results of operations, regulatory capital requirements, regulatory limitations on the Bank's ability to make capital distributions to the Company, and the amount of cash at the holding company level. See "Part II, Item 7. Management's Discussion and Analysis of Financial Condition and Results of Operations – Limitations on Dividends and Other Capital Distributions" for additional information regarding the Company's ability to pay dividends.
39
Item 6. Selected Financial Data
The summary information presented below under "Selected Balance Sheet Data" and "Selected Operations Data" for, and as of the end of, each of the years ended September 30 is derived from our audited consolidated financial statements. The following information is only a summary and should be read in conjunction with our consolidated financial statements.
September 30, | |||||||||||||||||||
2018 | 2017 | 2016 | 2015 | 2014 | |||||||||||||||
(Dollars in thousands) | |||||||||||||||||||
Selected Balance Sheet Data: | |||||||||||||||||||
Total assets | $ | 9,449,547 | $ | 9,192,916 | $ | 9,267,247 | $ | 9,844,161 | $ | 9,865,028 | |||||||||
Loans receivable, net | 7,514,485 | 7,195,071 | 6,958,024 | 6,625,027 | 6,233,170 | ||||||||||||||
Securities: | |||||||||||||||||||
AFS | 714,614 | 415,831 | 527,301 | 758,171 | 840,790 | ||||||||||||||
HTM | 612,318 | 827,738 | 1,100,874 | 1,271,122 | 1,552,699 | ||||||||||||||
FHLB stock | 99,726 | 100,954 | 109,970 | 150,543 | 213,054 | ||||||||||||||
Deposits | 5,603,354 | 5,309,868 | 5,164,018 | 4,832,520 | 4,655,272 | ||||||||||||||
Borrowings | 2,285,033 | 2,373,808 | 2,572,389 | 3,470,521 | 3,589,677 | ||||||||||||||
Stockholders' equity | 1,391,622 | 1,368,313 | 1,392,964 | 1,416,226 | 1,492,882 | ||||||||||||||
For the Year Ended September 30, | |||||||||||||||||||
2018 | 2017 | 2016 | 2015 | 2014 | |||||||||||||||
(Dollars and counts in thousands, except per share amounts) | |||||||||||||||||||
Selected Operations Data: | |||||||||||||||||||
Total interest and dividend income | $ | 321,892 | $ | 313,186 | $ | 301,113 | $ | 297,362 | $ | 290,246 | |||||||||
Total interest expense | 123,119 | 117,804 | 108,931 | 107,594 | 106,103 | ||||||||||||||
Net interest and dividend income | 198,773 | 195,382 | 192,182 | 189,768 | 184,143 | ||||||||||||||
Provision for credit losses | — | — | (750 | ) | 771 | 1,409 | |||||||||||||
Net interest and dividend income after | |||||||||||||||||||
provision for credit losses | 198,773 | 195,382 | 192,932 | 188,997 | 182,734 | ||||||||||||||
Deposit service fees | 15,636 | 15,053 | 14,835 | 14,897 | 14,937 | ||||||||||||||
Other non-interest income | 6,399 | 7,143 | 8,477 | 6,243 | 8,018 | ||||||||||||||
Total non-interest income | 22,035 | 22,196 | 23,312 | 21,140 | 22,955 | ||||||||||||||
Salaries and employee benefits | 46,563 | 43,437 | 42,378 | 43,309 | 43,757 | ||||||||||||||
Other non-interest expense | 50,339 | 46,221 | 51,927 | 51,060 | 46,780 | ||||||||||||||
Total non-interest expense | 96,902 | 89,658 | 94,305 | 94,369 | 90,537 | ||||||||||||||
Income before income tax expense | 123,906 | 127,920 | 121,939 | 115,768 | 115,152 | ||||||||||||||
Income tax expense | 24,979 | 43,783 | 38,445 | 37,675 | 37,458 | ||||||||||||||
Net income | $ | 98,927 | $ | 84,137 | $ | 83,494 | $ | 78,093 | $ | 77,694 | |||||||||
Basic earnings per share | $ | 0.73 | $ | 0.63 | $ | 0.63 | $ | 0.58 | $ | 0.56 | |||||||||
Average basic shares outstanding | 134,698 | 134,082 | 133,045 | 135,384 | 139,440 | ||||||||||||||
Diluted earnings per share | $ | 0.73 | $ | 0.63 | $ | 0.63 | $ | 0.58 | $ | 0.56 | |||||||||
Average diluted shares outstanding | 134,759 | 134,244 | 133,176 | 135,409 | 139,442 | ||||||||||||||
40
2018 | 2017 | 2016 | 2015 | 2014 | |||||||||||||||
Performance Ratios: | |||||||||||||||||||
Return on average assets(1) | 0.94 | % | 0.75 | % | 0.74 | % | 0.70 | % | 0.82 | % | |||||||||
Return on average equity(1) | 7.25 | 6.09 | 5.95 | 5.32 | 5.00 | ||||||||||||||
Dividends paid per share | $ | 0.88 | $ | 0.88 | $ | 0.84 | $ | 0.84 | $ | 0.98 | |||||||||
Dividend payout ratio | 119.60 | % | 140.20 | % | 133.86 | % | 146.19 | % | 177.84 | % | |||||||||
Operating expense ratio | 0.92 | 0.80 | 0.84 | 0.84 | 0.96 | ||||||||||||||
Efficiency ratio(1) | 43.89 | 41.21 | 43.76 | 44.74 | 43.72 | ||||||||||||||
Ratio of average interest-earning assets | |||||||||||||||||||
to average interest-bearing liabilities | 1.13x | 1.12x | 1.13x | 1.14x | 1.18x | ||||||||||||||
Net interest margin(1) | 1.95 | % | 1.79 | % | 1.75 | % | 1.73 | % | 2.00 | % | |||||||||
Interest rate spread information: | |||||||||||||||||||
Average during period(1) | 1.80 | 1.66 | 1.63 | 1.59 | 1.79 | ||||||||||||||
End of period | 2.18 | 2.04 | 1.92 | 1.85 | 1.84 | ||||||||||||||
Asset Quality Ratios: | |||||||||||||||||||
Non-performing assets to total assets | 0.14 | 0.20 | 0.35 | 0.31 | 0.29 | ||||||||||||||
Non-performing loans to total loans | 0.15 | 0.23 | 0.42 | 0.39 | 0.40 | ||||||||||||||
ACL to non-performing loans | 77.01 | 50.58 | 29.32 | 36.41 | 37.04 | ||||||||||||||
ACL to loans receivable, net | 0.11 | 0.12 | 0.12 | 0.14 | 0.15 | ||||||||||||||
Capital Ratios: | |||||||||||||||||||
Equity to total assets at end of period | 14.7 | 14.9 | 15.0 | 14.4 | 15.1 | ||||||||||||||
Average equity to average assets | 13.0 | 12.4 | 12.4 | 13.1 | 16.4 | ||||||||||||||
Company Tier 1 leverage ratio | 14.9 | 12.3 | 12.3 | 12.6 | N/A | ||||||||||||||
Bank Tier 1 leverage ratio(2) | 13.0 | 10.8 | 10.9 | 11.3 | 13.2 | ||||||||||||||
Other Data: | |||||||||||||||||||
Number of traditional offices | 48 | 37 | 37 | 37 | 37 | ||||||||||||||
Number of in-store offices | 10 | 10 | 10 | 10 | 10 | ||||||||||||||
(1) | The table below provides a reconciliation between certain performance ratios presented in accordance with accounting principles generally accepted in the United States of America ("GAAP") and the performance ratios excluding the effects of the leverage strategy, which are not presented in accordance with GAAP. Management believes it is important for comparability purposes to provide the performance ratios without the leverage strategy because of its unique nature. The leverage strategy reduces some of our performance ratios due to the amount of earnings associated with the transaction in comparison to the size of the transaction, while increasing our net income. Management can discontinue the leverage strategy at any point in time. |
For the Year Ended September 30, | ||||||||||||||||||||||||||
2018 | 2017 | 2016 | ||||||||||||||||||||||||
Actual | Leverage | Non- | Actual | Leverage | Non- | Actual | Leverage | Non- | ||||||||||||||||||
(GAAP) | Strategy | GAAP | (GAAP) | Strategy | GAAP | (GAAP) | Strategy | GAAP | ||||||||||||||||||
Return on average assets | 0.94 | % | (0.13 | )% | 1.07 | % | 0.75 | % | (0.14 | )% | 0.89 | % | 0.74 | % | (0.14 | )% | 0.88 | % | ||||||||
Return on average equity | 7.25 | 0.13 | 7.12 | 6.09 | 0.21 | 5.88 | 5.95 | 0.17 | 5.78 | |||||||||||||||||
Efficiency ratio | 43.89 | (0.30 | ) | 44.19 | 41.21 | (0.63 | ) | 41.84 | 43.76 | (0.42 | ) | 44.18 | ||||||||||||||
Net interest margin | 1.95 | (0.29 | ) | 2.24 | 1.79 | (0.36 | ) | 2.15 | 1.75 | (0.35 | ) | 2.10 | ||||||||||||||
Average interest rate spread | 1.80 | (0.26 | ) | 2.06 | 1.66 | (0.32 | ) | 1.98 | 1.63 | (0.30 | ) | 1.93 | ||||||||||||||
For the Year Ended September 30, | |||||||||||||||||
2015 | 2014 | ||||||||||||||||
Actual | Leverage | Non- | Actual | Leverage | Non- | ||||||||||||
(GAAP) | Strategy | GAAP | (GAAP) | Strategy | GAAP | ||||||||||||
Return on average assets | 0.70 | % | (0.13 | )% | 0.83 | % | 0.82 | % | (0.03 | )% | 0.85 | % | |||||
Return on average equity | 5.32 | 0.19 | 5.13 | 5.00 | 0.03 | 4.97 | |||||||||||
Efficiency ratio | 44.74 | (0.61 | ) | 45.35 | 43.72 | (0.10 | ) | 43.82 | |||||||||
Net interest margin | 1.73 | (0.34 | ) | 2.07 | 2.00 | (0.07 | ) | 2.07 | |||||||||
Average interest rate spread | 1.59 | (0.28 | ) | 1.87 | 1.79 | (0.05 | ) | 1.84 | |||||||||
(2) | Prior to September 30, 2015, this ratio was calculated using end-of-period total assets in the denominator in accordance with then applicable regulatory capital requirements. Since September 30, 2015, this ratio has been calculated using current quarter average assets in the denominator in accordance with current regulatory capital requirements. |
41
Item 7. Management's Discussion and Analysis of Financial Condition and Results of Operations
The following discussion and analysis is intended to assist in understanding the financial condition, results of operations, liquidity, and capital resources of the Company. The Bank comprises almost all of the consolidated assets and liabilities of the Company and the Company is dependent primarily upon the performance of the Bank for the results of its operations. Because of this relationship, references to management actions, strategies and results of actions apply to both the Bank and the Company.
Executive Summary
The following summary should be read in conjunction with the Management's Discussion and Analysis of Financial Condition and Results of Operations section in its entirety.
The Company provides a full range of retail banking services through the Bank, which is a wholly-owned subsidiary of the Company, headquartered in Topeka Kansas. The Bank has 48 traditional and 10 in-store banking offices serving primarily the metropolitan areas of Topeka, Wichita, Lawrence, Manhattan, Emporia and Salina, Kansas and portions of the metropolitan area of greater Kansas City. We have been, and intend to continue to be, a community-oriented financial institution offering a variety of financial services to meet the needs of the communities we serve.
On August 31, 2018, the Company completed the acquisition of CCB, the parent company of Capital City Bank, a Kansas state chartered bank headquartered in Topeka, Kansas. Immediately upon closing the merger, Capital City Bank merged with and into the Bank. Capital City Bank owned and leased banking locations in Topeka, Lawrence, and Overland Park, Kansas. The Company acquired loans and deposits with fair values of $299.7 million and $352.5 million, respectively, at the date of acquisition. As a result of the merger, the Bank is entering the commercial banking business through the origination of commercial lending products and offering of commercial deposit services and began offering trust and brokerage services. Under the terms of the acquisition agreement, the Company issued 3.0 million shares of Company common stock for all outstanding shares of CCB capital stock, for a total merger consideration of $39.1 million, based on the Company's closing stock price of $13.21 on August 31, 2018. As of September 30, 2018, the Company recognized goodwill of $8.0 million, which is calculated as the consideration exchanged in excess of the fair value of assets, net of the liabilities assumed. Additionally, the Company recognized $9.8 million of core deposit and other intangibles. Integration of information systems is anticipated to be completed early in the second calendar quarter of 2019. After integration, the Company will review its branch network to determine which branches, if any, should be closed in order to maintain or improve its efficiency.
The Company's results of operations are primarily dependent on net interest income, which is the difference between the interest earned on loans, securities, and cash, and the interest paid on deposits and borrowings. On a weekly basis, management reviews deposit flows, loan demand, cash levels, and changes in several market rates to assess all pricing strategies. The Bank's pricing strategy for first mortgage loan products includes setting interest rates based on secondary market prices and competitor pricing for our local lending markets, and secondary market prices and competitor pricing for our correspondent lending markets. Pricing for commercial loans is generally based on competitor pricing and the credit risk of the borrower with consideration given to the overall relationship of the borrower. Generally, deposit pricing is based upon a survey of competitors in the Bank's market areas, and the need to attract funding and retain maturing deposits. The majority of our loans are fixed-rate products with maturities up to 30 years, while the majority of our retail deposits have stated maturities or repricing dates of less than two years.
The Company is significantly affected by prevailing economic conditions, including federal monetary and fiscal policies and federal regulation of financial institutions. Deposit balances are influenced by a number of factors, including interest rates paid on competing investment products, the level of personal income, and the personal rate of savings within our market areas. Lending activities are influenced by the demand for housing and other loans, our loan underwriting guidelines compared to those of our competitors, as well as interest rate pricing competition from other lending institutions.
Local economic conditions have a significant impact on the ability of borrowers to repay loans and the value of the collateral securing these loans. The industries in the Bank's local market areas, where the properties securing approximately 67% of the Bank's one- to four-family loans are located, are diversified, especially in the Kansas City metropolitan statistical area, which comprises the largest segment of our loan portfolio and deposit base. As of October 2018, the unemployment rate was 3.3% for Kansas and 3.1% for Missouri, compared to the national average of 3.7% based on information from the Bureau of Labor Statistics. The Kansas City market area has an average household income of approximately $87 thousand per annum, based
42
on 2018 estimates from Claritas Pop-Facts Premier. The average household income in our combined local market areas is approximately $81 thousand per annum, with 91% of the population at or above the poverty level based on the 2018 estimates from Claritas Pop-Facts Premier. The FHFA price index for Kansas and Missouri continues to indicate relative stability in property values in our local market areas. Management also monitors broad industry and economic indicators and trends in the states and/or metropolitan statistical areas with the highest concentrations of correspondent purchased loans.
The Bank continued, at times, to utilize a leverage strategy to increase earnings in fiscal year 2018. The leverage strategy during the current fiscal year involved borrowing up to $2.10 billion either on the Bank's FHLB line of credit or by entering into short-term FHLB advances, depending on the rates offered by FHLB. The borrowings were repaid prior to each quarter end, or earlier if the strategy was not profitable and therefore suspended. The proceeds from the borrowings, net of the required FHLB stock holdings, which yielded approximately 6.7% during the current fiscal year, were deposited at the FRB of Kansas City. Net income attributable to the leverage strategy is largely derived from the dividends received on FHLB stock holdings, plus the net interest rate spread between the yield on the cash at the FRB of Kansas City and the rate paid on the related FHLB borrowings, less applicable federal insurance premiums and estimated taxes. Net income attributable to the leverage strategy was $1.7 million during the current fiscal year, compared to $2.8 million for the prior fiscal year. The decrease was due mainly to the suspension of the strategy at certain times during the last half of the current fiscal year due to the negative interest rate spread, which resulted in the strategy not being profitable. Management continues to monitor the net interest rate spread and overall profitability of the strategy. It is expected that strategy will be reimplemented if it reaches a position that is profitable.
For fiscal year 2018, the Company recognized net income of $98.9 million, or $0.73 per share, an increase of $14.8 million, or 17.6%, from fiscal year 2017. The increase in net income was due primarily to a decrease in income tax expense. During December 2017, the Tax Act was enacted which made significant changes to the U.S. corporate income tax laws, such as a permanent reduction in the federal corporate income tax rate from 35% to 21% effective January 1, 2018, and changes to and/or limitations on certain income tax deductions. The Company has a fiscal year end of September 30, so the change in the income tax rate resulted in the use of a blended federal income tax rate for fiscal year 2018. In accordance with GAAP, the Company revalued its deferred tax assets and liabilities as of December 22, 2017 to account for the future impact of a lower income tax rate. The revaluation of the Company's deferred tax assets and liabilities reduced income tax expense in the current fiscal year by $7.5 million. The effective tax rate for the current fiscal year was 20.2%. Management estimates the effective income tax rate for fiscal year 2019 will be approximately 22%.
The net interest margin increased 16 basis points, from 1.79% for the prior fiscal year to 1.95% for the current fiscal year. Excluding the effects of the leverage strategy, the net interest margin would have increased nine basis points, from 2.15% for the prior fiscal year to 2.24% for the current fiscal year. The increase in the net interest margin was due mainly to an increase in interest-earning asset yields.
Total assets were $9.45 billion at September 30, 2018 compared to $9.19 billion at September 30, 2017. The $256.6 million increase was due primarily to acquiring loans with a fair value of $299.7 million from CCB. The loans receivable portfolio, net, totaled $7.51 billion at September 30, 2018 compared to $7.20 billion at September 30, 2017. During the current fiscal year, the Bank originated and refinanced $633.4 million of loans with a weighted average rate of 4.17% and purchased $391.6 million of one- to four-family loans from correspondent lenders with a weighted average rate of 3.80%. The Bank also entered into participations of $135.8 million of commercial real estate loans with a weighted average rate of 4.22%, of which $108.4 million had not yet been funded as of September 30, 2018.
The Bank is continuing to manage the size and mix of its loan portfolio, as it manages its liquidity levels, as measured by the ratio of securities and cash to total assets, to a target level of approximately 15%. The ratio of securities and cash to total assets was 15.5% at September 30, 2018. The size of the loan portfolio has been managed by controlling correspondent loan volume primarily through the rates offered to correspondent lenders. Management intends to continue to manage the size of the loan portfolio by utilizing cash flows from the correspondent loan portfolio to fund commercial loan growth. Given the balance of total assets, it is unlikely that loan growth will substantially increase in the current environment. Generally, over the past few years, cash flows from the securities portfolio have been used primarily to purchase loans and in part to pay down FHLB advances. By moving cash from lower yielding assets to higher yielding assets and repaying higher costing liabilities, we have been able to maintain our net interest margin. In addition to the repayment of securities, the Bank has emphasized growth in the deposit portfolio in part to pay down term borrowings.
43
Total liabilities were $8.06 billion at September 30, 2018 compared to $7.82 billion at September 30, 2017. The $233.3 million increase was due mainly to acquiring deposits totaling $352.5 million from CCB. Deposits were $5.60 billion at September 30, 2018 compared to $5.31 billion at September 30, 2017.
Stockholders' equity was $1.39 billion at September 30, 2018 compared to $1.37 billion at September 30, 2017. The $23.3 million increase was due primarily to net income of $98.9 million, along with the issuance of 3.0 million shares, or $39.1 million, related to the acquisition of CCB, partially offset by the payment of $118.3 million in cash dividends. In the long run, management considers a 10% ratio of stockholders' equity to total assets at the Bank an appropriate level of capital. At September 30, 2018, this ratio was 12.9%.
Critical Accounting Policies
Our most critical accounting policies are the methodologies used to determine the ACL and fair value measurements. These policies are important to the presentation of our financial condition and results of operations, involve a high degree of complexity, and require management to make difficult and subjective judgments that may require assumptions or estimates about highly uncertain matters. The use of different judgments, assumptions, and estimates could cause reported results to differ materially. These critical accounting policies and their application are reviewed at least annually by our audit committee. The following is a description of our critical accounting policies and an explanation of the methods and assumptions underlying their application.
Allowance for Credit Losses. The Company maintains an ACL to absorb inherent losses in the loan portfolio based upon ongoing quarterly assessments of the loan portfolio. The ACL is maintained through provisions for credit losses which are either charged or credited to income. The methodology for determining the ACL is considered a critical accounting policy by management because of the high degree of judgment involved, the subjectivity of the assumptions used, and the potential for changes in economic conditions that could result in changes to the amount of the recorded ACL. Additionally, bank regulators review the ACL and could have a differing view from management regarding the ACL balance, which could result in an increase in the ACL and/or the recognition of additional charge-offs. Although management believes that the Bank has established and maintained the ACL at appropriate levels, additions may be necessary if economic and other conditions worsen substantially from the current operating environment, and/or if bank regulators have a differing view from management regarding the ACL balance.
Our primary lending emphasis is the origination and purchase of one- to four-family loans and, to a lesser extent, consumer loans secured by one- to four-family residential properties, resulting in a loan concentration in residential mortgage loans. We believe the primary risks inherent in our one- to four-family and consumer loan portfolios are a decline in economic conditions, elevated levels of unemployment or underemployment, and declines in residential real estate values. Changes in any one or a combination of these events may adversely affect borrowers' ability to repay their loans, resulting in increased delinquencies, non-performing assets, loan losses, and future loan loss provisions. Although the commercial loan portfolio is subject to the same risk of declines in economic conditions, the primary risk characteristics inherent in this portfolio include the ability of the borrower to sustain sufficient cash flows from leases and business operations and to control operational and/or business expenses to satisfy their contractual debt payments, and/or the ability to utilize personal and/or business resources to pay their contractual debt payments if the cash flows are not sufficient. Additionally, if the Bank were to repossess the secured collateral of a commercial real estate loan, the pool of potential buyers is more limited than that for a residential property. Therefore, the Bank could hold the property for an extended period of time and/or potentially be forced to sell at a discounted price, resulting in additional losses. Our commercial and industrial loans are primarily secured by accounts receivable, inventory and equipment, which may be difficult to appraise, may be illiquid and may fluctuate in value based on the success of the business.
Each quarter, we prepare a formula analysis model which segregates our loan portfolio into categories based on certain risk characteristics such as loan type (one- to four-family, commercial, etc.), interest payments (fixed-rate and adjustable-rate), loan source (originated, correspondent purchased, bulk purchased, or participation), LTV ratios, borrower's credit score and payment status (i.e. current or number of days delinquent). Consumer loans, such as second mortgages and home equity lines of credit, with the same underlying collateral as a one- to four-family loan are combined with the one- to four-family loan in the formula analysis model to calculate a combined LTV ratio.
44
Historical loss factors are applied to each loan category in the formula analysis model. Additionally, qualitative loss factors that management believes impact the collectability of the loan portfolio as of the evaluation date are applied to each loan category. Qualitative loss factors increase as loans are classified or become delinquent. See "Part II, Item 8. Financial Statements and Supplementary Data – Notes to Consolidated Financial Statements – Note 1. Summary of Significant Accounting Policies" for additional information related to the loss factors utilized in the formula analysis model.
The loss factors applied in the formula analysis model are reviewed quarterly by management to assess whether the factors adequately cover probable and estimable losses inherent in the loan portfolio. Our ACL methodology permits modifications to the formula analysis model in the event that, in management's judgment, significant factors which affect the collectability of the portfolio or any category of the loan portfolio, as of the evaluation date, have changed from the current formula analysis model. Management's evaluation of the qualitative factors with respect to these conditions is subject to a higher degree of uncertainty because they are not identified with a specific problem loan or portfolio segment.
Non-PCI loans that have not become impaired subsequent to the acquisition date are included in the formula analysis model. For these loans, the Company estimates a hypothetical amount of ACL. The Company uses the acquired bank's past loss history adjusted for qualitative factors to establish the hypothetical amount of ACL. This amount is compared with the remaining net purchase discount for the non-PCI loans to test for credit quality deterioration and the possible need for an additional loan loss provision. To the extent the remaining net purchase discount of the pool is greater than the hypothetical ACL, no additional ACL is necessary. If the remaining net purchase discount of the pool is less than the hypothetical ACL, the difference results in an increase to the ACL recorded through a provision for credit losses.
Management utilizes the formula analysis model, along with analyzing and considering several other relevant internal and external data elements, when evaluating the adequacy of the ACL. Such data elements include the trend and composition of delinquent and non-performing loans, trends in foreclosed property and short sale transactions and charge-off activity, the current status and trends of local and national employment levels, trends and current conditions in the housing markets, loan growth and concentrations, industry and peer charge-off and ACL information, and certain ACL ratios such as ACL to loans receivable, net and annualized historical losses. Since our loan portfolio is primarily concentrated in one- to four-family real estate, management monitors residential real estate market value trends in the Bank's local market areas and geographic sections of the U.S. by reference to various industry and market reports, economic releases and surveys, and management's general and specific knowledge of the real estate markets in which we lend, in order to determine what impact, if any, such trends may have on the level of ACL. Reviewing these data elements assists management in evaluating the overall credit quality of the loan portfolio and the reasonableness of the ACL on an ongoing basis, and whether changes need to be made to our ACL methodology. In addition, the adequacy of the Company's ACL is reviewed during bank regulatory examinations. We consider any comments from our regulators when assessing the appropriateness of our ACL. We seek to apply ACL methodology in a consistent manner; however, the methodology can be modified in response to changing conditions.
Fair Value Measurements. The Company uses fair value measurements to record fair value adjustments to certain financial instruments and to determine fair value disclosures in accordance with Accounting Standards Codification ("ASC") 820 and ASC 825. The Company groups its financial instruments at fair value in three levels based on the markets in which the instruments are traded and the reliability of the assumptions used to determine fair value, with Level 1 (quoted prices for identical assets in an active market) being considered the most reliable, and Level 3 having the most unobservable inputs and therefore being considered the least reliable. The Company bases its fair values on the price that would be received from the sale of an asset in an orderly transaction between market participants at the measurement date. The Company maximizes the use of observable inputs and minimizes the use of unobservable inputs when measuring fair value.
The Company's AFS securities are measured at fair value on a recurring basis. Changes in the fair value of AFS securities are recorded, net of tax, as AOCI in stockholders' equity. The Company primarily uses prices obtained from third party pricing services to determine the fair value of its AFS securities. Various modeling techniques are used to determine pricing for the Company's securities, including option pricing, discounted cash flow models, and similar techniques. The inputs to these models may include benchmark yields, reported trades, broker/dealer quotes, issuer spreads, benchmark securities, bids, offers and reference data. All AFS securities are classified as Level 2.
45
The Company's interest rate swaps are measured at fair value on a recurring basis. The Company uses a discounted cash flow analysis using observable market-based inputs to determine the fair value of its interest rate swaps. Changes in the fair value of the interest rate swaps are recorded, net of tax, as AOCI in stockholders' equity. The Company did not have any other financial instruments that were measured at fair value on a recurring basis at September 30, 2018.
Loans individually evaluated for impairment and OREO are measured at fair value on a non-recurring basis. These non-recurring fair value adjustments involve the application of lower-of-cost-or-fair value accounting or write-downs of individual assets. Fair values of loans individually evaluated for impairment are estimated through current appraisals. OREO fair values are estimated using current appraisals or listing prices. Fair values may be adjusted by management to reflect current economic and market conditions and, as such, are classified as Level 3.
Recent Accounting Pronouncements
For a discussion of Recent Accounting Pronouncements, see "Part II, Item 8. Financial Statements and Supplementary Data – Notes to Financial Statements – Note 1. Summary of Significant Accounting Policies."
46
Management Strategy
We are a community-oriented financial institution dedicated to serving the needs of customers in our market areas. Our commitment is to provide qualified borrowers the broadest possible access to home ownership through our mortgage lending programs and to offer a complete set of personal and commercial banking products and services to our customers. We strive to enhance stockholder value while maintaining a strong capital position. To achieve these goals, we focus on the following strategies:
• | Lending. We are one of the leading originators of one- to four-family loans in the state of Kansas. We originate these loans primarily for our own portfolio, and we service the loans we originate. We also purchase one- to four-family loans from correspondent lenders. We offer both fixed- and adjustable-rate products with various terms to maturity and pricing options. We maintain strong relationships with local real estate agents to attract mortgage loan business. With the acquisition of CCB, we can offer more commercial lending options to our customers. We rely on our marketing efforts and customer service reputation to attract mortgage business from walk-in customers, customers that apply online, and existing customers. |
• | Deposit Services. We offer a wide array of deposit products and services. These products include checking, savings, money market, certificates of deposit, and retirement accounts. With the acquisition of CCB, we began offering commercial deposit services. Our deposit services are provided through a branch network of 58 locations, including traditional branches and retail in-store locations, our call center which operates on extended hours, mobile banking, telephone banking, and online banking and bill payment services. |
• | Cost Control. We generally are very effective at controlling our costs of operations. By using technology, we are able to centralize our loan servicing and deposit support functions for efficient processing. We serve a broad range of customers through relatively few branch locations. Our average deposit base per traditional branch at September 30, 2018 was approximately $101.9 million. This large average deposit base per branch helps to control costs. Our one- to four-family lending strategy and our effective management of credit risk allows us to service a large portfolio of loans at efficient levels because it costs less to service a portfolio of performing loans. |
• | Asset Quality. We utilize underwriting standards for our lending products that are designed to limit our exposure to credit risk. We require complete documentation for both originated and purchased loans, and make credit decisions based on our assessment of the borrower's ability to repay the loan in accordance with its terms. |
• | Capital Position. Our policy has always been to protect the safety and soundness of the Bank through credit and operational risk management, balance sheet strength, and sound operations. The end result of these activities has been a capital ratio in excess of the well-capitalized standards set by the OCC. We believe that maintaining a strong capital position safeguards the long-term interests of the Bank, the Company, and our stockholders. |
• | Stockholder Value. We strive to provide stockholder value while maintaining a strong capital position. One way that we continue to provide returns to stockholders is through our dividend payments. Total dividends declared and paid during fiscal year 2018 were $118.3 million, including a $0.25 per share, or $33.6 million, True Blue® Capitol Dividend paid in June 2018. The Company's cash dividend payout policy is reviewed quarterly by management and the Board of Directors, and the ability to pay dividends under the policy depends upon a number of factors, including the Company's financial condition and results of operations, regulatory capital requirements, regulatory limitations on the Bank's ability to make capital distributions to the Company, and the amount of cash at the holding company level. For fiscal year 2019, it is the intent of the Board of Directors and management to continue with the payout of 100% of the Company's earnings to its stockholders through regular quarterly dividends and a true-up dividend. |
• | Interest Rate Risk Management. Changes in interest rates are our primary market risk as our balance sheet is almost entirely comprised of interest-earning assets and interest-bearing liabilities. As such, fluctuations in interest rates have a significant impact not only upon our net income but also upon the cash flows related to those assets and liabilities and the market value of our assets and liabilities. In order to maintain what we believe to be acceptable levels of net interest income in varying interest rate environments, we actively manage our interest rate risk and assume a moderate amount of interest rate risk consistent with board policies. |
47
Financial Condition
Assets. Total assets were $9.45 billion at September 30, 2018 compared to $9.19 billion at September 30, 2017. The $256.6 million increase was due primarily to an increase in loans receivable due to the acquisition of CCB.
Loans Receivable. Loans receivable, net, increased $319.4 million to $7.51 billion at September 30, 2018 from $7.20 billion at September 30, 2017. The increase was due primarily to acquiring loans with a fair value of $299.7 million from CCB. The following table presents the balance and weighted average rate of our loan portfolio as of the dates indicated. The weighted average rate of the portfolio increased 13 basis points to 3.74% at September 30, 2018. The increase in the weighted average rate was due primarily to the acquisition of loans from CCB and the repricing of existing loans to higher market rates, along with the origination and purchase of loans at higher market rates. Approximately 60% of the one- to four-family loan portfolio at September 30, 2018 had a balance of $453 thousand or less at the time of origination.
September 30, 2018 | September 30, 2017 | ||||||||||||
Amount | Rate | Amount | Rate | ||||||||||
(Dollars in thousands) | |||||||||||||
One- to four-family: | |||||||||||||
Originated | $ | 3,965,692 | 3.74 | % | $ | 3,959,232 | 3.70 | % | |||||
Correspondent purchased | 2,505,987 | 3.59 | 2,445,311 | 3.53 | |||||||||
Bulk purchased | 293,607 | 2.60 | 351,705 | 2.29 | |||||||||
Construction | 33,149 | 4.03 | 30,647 | 3.45 | |||||||||
Total | 6,798,435 | 3.64 | 6,786,895 | 3.56 | |||||||||
Commercial: | |||||||||||||
Commercial real estate | 426,243 | 4.33 | 183,030 | 4.24 | |||||||||
Commercial and industrial | 62,869 | 5.00 | — | — | |||||||||
Construction | 80,498 | 4.59 | 86,952 | 3.80 | |||||||||
Total | 569,610 | 4.44 | 269,982 | 4.10 | |||||||||
Consumer loans: | |||||||||||||
Home equity | 129,588 | 5.97 | 122,066 | 5.40 | |||||||||
Other | 10,012 | 4.59 | 3,808 | 4.05 | |||||||||
Total | 139,600 | 5.87 | 125,874 | 5.36 | |||||||||
Total loans receivable | 7,507,645 | 3.74 | 7,182,751 | 3.61 | |||||||||
Less: | |||||||||||||
ACL | 8,463 | 8,398 | |||||||||||
Discounts/unearned loan fees | 33,933 | 24,962 | |||||||||||
Premiums/deferred costs | (49,236 | ) | (45,680 | ) | |||||||||
Total loans receivable, net | $ | 7,514,485 | $ | 7,195,071 | |||||||||
48
Loan Activity - The following table summarizes activity in the loan portfolio, along with weighted average rates where applicable, for the periods indicated, excluding changes in ACL, discounts/unearned loan fees, and premiums/deferred costs. Loans that were paid-off as a result of refinances and loans that are sold are included in repayments. Loan endorsements are not included in the activity in the following table because a new loan is not generated at the time of the endorsement. The endorsed balance and rate are included in the ending loan portfolio balance and rate. Commercial loan renewals are not included in the activity in the following table unless new funds are disbursed at the time of renewal.
For the Three Months Ended | |||||||||||||||||||||||||||
September 30, 2018 | June 30, 2018 | March 31, 2018 | December 31, 2017 | ||||||||||||||||||||||||
Amount | Rate | Amount | Rate | Amount | Rate | Amount | Rate | ||||||||||||||||||||
(Dollars in thousands) | |||||||||||||||||||||||||||
Beginning balance | $ | 7,226,169 | 3.66 | % | $ | 7,187,742 | 3.63 | % | $ | 7,177,504 | 3.62 | % | $ | 7,182,751 | 3.61 | % | |||||||||||
Originated and refinanced: | |||||||||||||||||||||||||||
Fixed | 117,904 | 4.44 | 143,059 | 4.21 | 77,825 | 3.80 | 109,102 | 3.70 | |||||||||||||||||||
Adjustable | 56,996 | 4.55 | 54,385 | 4.42 | 36,612 | 4.28 | 37,502 | 4.26 | |||||||||||||||||||
Purchased and participations: | |||||||||||||||||||||||||||
Fixed | 80,138 | 4.40 | 78,650 | 4.04 | 120,155 | 3.85 | 85,565 | 3.73 | |||||||||||||||||||
Adjustable | 20,105 | 3.92 | 30,017 | 3.49 | 48,062 | 3.61 | 64,689 | 3.87 | |||||||||||||||||||
Acquisition of CCB loans, net | 299,659 | 4.77 | — | — | — | — | — | — | |||||||||||||||||||
Change in undisbursed loan funds | (8,104 | ) | 19,808 | (25,002 | ) | (17,706 | ) | ||||||||||||||||||||
Repayments | (284,927 | ) | (286,923 | ) | (246,894 | ) | (283,880 | ) | |||||||||||||||||||
Principal recoveries (charge-offs), net | 119 | (46 | ) | 20 | (28 | ) | |||||||||||||||||||||
Other | (414 | ) | (523 | ) | (540 | ) | (491 | ) | |||||||||||||||||||
Ending balance | $ | 7,507,645 | 3.74 | $ | 7,226,169 | 3.66 | $ | 7,187,742 | 3.63 | $ | 7,177,504 | 3.62 | |||||||||||||||
For the Year Ended September 30, | |||||||||||||
2018 | 2017 | ||||||||||||
Amount | Rate | Amount | Rate | ||||||||||
(Dollars in thousands) | |||||||||||||
Beginning balance | $ | 7,182,751 | 3.61 | % | $ | 6,949,522 | 3.60 | % | |||||
Originations and refinances: | |||||||||||||
Fixed | 447,890 | 4.07 | 511,223 | 3.62 | |||||||||
Adjustable | 185,495 | 4.40 | 187,255 | 3.83 | |||||||||
Purchases and participations: | |||||||||||||
Fixed | 364,508 | 3.98 | 543,473 | 3.73 | |||||||||
Adjustable | 162,873 | 3.73 | 87,396 | 3.03 | |||||||||
Acquisition of CCB loans, net | 299,659 | 4.77 | — | — | |||||||||
Change in undisbursed loan funds | (31,004 | ) | 77,029 | ||||||||||
Repayments | (1,102,624 | ) | (1,169,808 | ) | |||||||||
Principal recoveries (charge-offs), net | 65 | (142 | ) | ||||||||||
Other | (1,968 | ) | (3,197 | ) | |||||||||
Ending balance | $ | 7,507,645 | 3.74 | $ | 7,182,751 | 3.61 | |||||||
49
The following table presents loan origination, refinance, and purchase activity for the periods indicated, excluding endorsement and renewal activity and $299.7 million of loans at a rate of 4.77% purchased in connection with the acquisition of CCB during fiscal year 2018, along with associated weighted average rates and percent of total. Loan originations, purchases, and refinances are reported together. The fixed-rate one- to four-family loans less than or equal to 15 years have an original maturity at origination of less than or equal to 15 years, while fixed-rate one- to four-family loans greater than 15 years have an original maturity at origination of greater than 15 years. The adjustable-rate one- to four-family loans less than or equal to 36 months have a term to first reset of less than or equal to 36 months at origination and adjustable-rate one- to four-family loans greater than 36 months have a term to first reset of greater than 36 months at origination.
For the Year Ended | |||||||||||||||||||
September 30, 2018 | September 30, 2017 | ||||||||||||||||||
Amount | Rate | % of Total | Amount | Rate | % of Total | ||||||||||||||
(Dollars in thousands) | |||||||||||||||||||
Fixed-rate: | |||||||||||||||||||
One- to four-family: | |||||||||||||||||||
<= 15 years | $ | 160,099 | 3.51 | % | 13.8 | % | $ | 202,997 | 3.04 | % | 15.3 | % | |||||||
> 15 years | 530,606 | 4.12 | 45.7 | 736,429 | 3.81 | 55.4 | |||||||||||||
One- to four-family construction | 43,604 | 4.11 | 3.8 | 45,600 | 3.61 | 3.4 | |||||||||||||
Commercial: | |||||||||||||||||||
Commercial real estate | 10,644 | 4.48 | 0.9 | 11,714 | 3.97 | 0.9 | |||||||||||||
Commercial and industrial | 1,579 | 5.24 | 0.1 | — | — | — | |||||||||||||
Commercial construction | 60,417 | 4.30 | 5.2 | 53,982 | 4.04 | 4.0 | |||||||||||||
Home equity | 4,758 | 6.18 | 0.4 | 3,510 | 5.87 | 0.3 | |||||||||||||
Other | 691 | 7.54 | 0.1 | 464 | 9.87 | — | |||||||||||||
Total fixed-rate | 812,398 | 4.03 | 70.0 | 1,054,696 | 3.68 | 79.3 | |||||||||||||
Adjustable-rate: | |||||||||||||||||||
One- to four-family: | |||||||||||||||||||
<= 36 months | 8,233 | 3.39 | 0.7 | 5,074 | 2.77 | 0.4 | |||||||||||||
> 36 months | 173,775 | 3.49 | 15.0 | 168,785 | 3.06 | 12.7 | |||||||||||||
One- to four-family construction | 18,791 | 3.58 | 1.6 | 23,271 | 3.07 | 1.8 | |||||||||||||
Commercial: | |||||||||||||||||||
Commercial real estate | 570 | 5.03 | — | 2,992 | 3.25 | 0.2 | |||||||||||||
Commercial and industrial | 325 | 5.81 | — | — | — | — | |||||||||||||
Commercial construction | 69,543 | 4.16 | 6.0 | — | — | — | |||||||||||||
Home equity | 74,042 | 5.66 | 6.4 | 72,245 | 5.03 | 5.4 | |||||||||||||
Other | 3,089 | 3.24 | 0.3 | 2,284 | 3.40 | 0.2 | |||||||||||||
Total adjustable-rate | 348,368 | 4.09 | 30.0 | 274,651 | 3.58 | 20.7 | |||||||||||||
Total originated, refinanced and purchased | $ | 1,160,766 | 4.05 | 100.0 | % | $ | 1,329,347 | 3.66 | 100.0 | % | |||||||||
Purchased and participation loans included above: | |||||||||||||||||||
Fixed-rate: | |||||||||||||||||||
Correspondent - one- to four-family | $ | 298,299 | 3.92 | $ | 478,772 | 3.70 | |||||||||||||
Participations - commercial | 66,209 | 4.28 | 64,701 | 4.01 | |||||||||||||||
Total fixed-rate purchased/participations | 364,508 | 3.98 | 543,473 | 3.73 | |||||||||||||||
Adjustable-rate: | |||||||||||||||||||
Correspondent - one- to four-family | 93,330 | 3.41 | 84,404 | 3.02 | |||||||||||||||
Participations - commercial | 69,543 | 4.16 | 2,992 | 3.25 | |||||||||||||||
Total adjustable-rate purchased/participations | 162,873 | 3.73 | 87,396 | 3.03 | |||||||||||||||
Total purchased/participation loans | $ | 527,381 | 3.91 | $ | 630,869 | 3.64 | |||||||||||||
50
One- to Four-Family Loans - The following table presents, for our portfolio of one- to four-family loans, the amount, percent of total, weighted average credit score, weighted average LTV ratio, and average balance per loan as of the dates presented. Credit scores are updated at least semiannually, with the latest update in September 2018, from a nationally recognized consumer rating agency. The LTV ratios were based on the current loan balance and either the lesser of the purchase price or original appraisal, or the most recent Bank appraisal, if available. In most cases, the most recent appraisal was obtained at the time of origination.
September 30, 2018 | ||||||||||||||||
% of | Credit | Average | ||||||||||||||
Amount | Total | Score | LTV | Balance | ||||||||||||
(Dollars in thousands) | ||||||||||||||||
Originated | $ | 3,965,692 | 58.6 | % | 767 | 62 | % | $ | 138 | |||||||
Correspondent purchased | 2,505,987 | 37.1 | 764 | 67 | 378 | |||||||||||
Bulk purchased | 293,607 | 4.3 | 758 | 62 | 304 | |||||||||||
$ | 6,765,286 | 100.0 | % | 765 | 64 | 186 | ||||||||||
September 30, 2017 | ||||||||||||||||
% of | Credit | Average | ||||||||||||||
Amount | Total | Score | LTV | Balance | ||||||||||||
(Dollars in thousands) | ||||||||||||||||
Originated | $ | 3,959,232 | 58.6 | % | 767 | 63 | % | $ | 135 | |||||||
Correspondent purchased | 2,445,311 | 36.2 | 764 | 68 | 375 | |||||||||||
Bulk purchased | 351,705 | 5.2 | 757 | 63 | 305 | |||||||||||
$ | 6,756,248 | 100.0 | % | 765 | 65 | 182 | ||||||||||
The following table presents originated, refinanced, and correspondent purchased activity in our one- to four-family loan portfolio, excluding endorsement activity, along with associated weighted average LTVs and weighted average credit scores for the periods indicated. Of the loans originated during the current year, $74.8 million were refinanced from other lenders. Of the loans originated and refinanced during the current year, 77% had loan values of $453 thousand or less. Of the correspondent loans purchased during the current year, 21% had loan values of $453 thousand or less.
For the Year Ended | |||||||||||||||||||
September 30, 2018 | September 30, 2017 | ||||||||||||||||||
Credit | Credit | ||||||||||||||||||
Amount | LTV | Score | Amount | LTV | Score | ||||||||||||||
(Dollars in thousands) | |||||||||||||||||||
Originated | $ | 473,140 | 77 | % | 762 | $ | 498,145 | 77 | % | 766 | |||||||||
Refinanced by Bank customers | 70,339 | 67 | 750 | 120,835 | 66 | 760 | |||||||||||||
Correspondent purchased | 391,629 | 74 | 766 | 563,176 | 74 | 765 | |||||||||||||
$ | 935,108 | 75 | 763 | $ | 1,182,156 | 74 | 765 | ||||||||||||
The following table presents the amount, percent of total, and weighted average rate, by state, of one- to four-family loan originations and correspondent purchases where originations and purchases in the state exceeded five percent of the total amount originated and purchased during the year ended September 30, 2018.
State | Amount | % of Total | Rate | |||||||
(Dollars in thousands) | ||||||||||
Kansas | $ | 477,001 | 51.0 | % | 3.94 | % | ||||
Missouri | 173,857 | 18.6 | 3.92 | |||||||
Texas | 153,891 | 16.5 | 3.74 | |||||||
Other states | 130,359 | 13.9 | 3.79 | |||||||
$ | 935,108 | 100.0 | % | 3.88 | ||||||
51
The following table summarizes our one- to four-family loan origination and refinance commitments and one- to four-family correspondent loan purchase commitments as of September 30, 2018, along with associated weighted average rates. Loan commitments generally have fixed expiration dates or other termination clauses and may require the payment of a rate lock fee. It is expected that some of the loan commitments will expire unfunded, so the amounts reflected in the table below are not necessarily indicative of future cash needs.
Fixed-Rate | ||||||||||||||||||
15 years | More than | Adjustable- | Total | |||||||||||||||
or less | 15 years | Rate | Amount | Rate | ||||||||||||||
(Dollars in thousands) | ||||||||||||||||||
Originate/refinance | $ | 9,651 | $ | 28,915 | $ | 11,920 | $ | 50,486 | 4.20 | % | ||||||||
Correspondent | 1,822 | 58,897 | 10,669 | 71,388 | 4.26 | |||||||||||||
$ | 11,473 | $ | 87,812 | $ | 22,589 | $ | 121,874 | 4.23 | ||||||||||
Rate | 3.98 | % | 4.38 | % | 3.80 | % | ||||||||||||
Commercial Loans - During the current fiscal year, the Bank entered into commercial loan participations of $135.8 million, which included $129.8 million of commercial real estate construction loans. The majority of the $129.8 million of commercial real estate construction loans had not yet been funded as of September 30, 2018.
The following table presents the Bank's commercial real estate loans and loan commitments by industry classification, as defined by the North American Industry Classification System, as of September 30, 2018. Based on the terms of the construction loans as of September 30, 2018, of the $166.6 million of undisbursed amounts in the table, which does not include outstanding commitments, approximately $35.2 million is projected to be disbursed by December 31, 2018, and an additional $92.2 million is projected to be disbursed by September 30, 2019. It is possible that not all of the funds will be disbursed due to the nature of the funding of construction projects. Included in the gross loan amounts in the table, which does not include outstanding commitments, are fixed-rate loans totaling $415.6 million at a weighted average rate of 4.20% and adjustable-rate loans totaling $257.8 million at a weighted average rate of 4.80%. The weighted average rate of fixed-rate loans is lower than that of adjustable-rate loans due primarily to the majority of the fixed-rate loans in the portfolio at September 30, 2018 having shorter terms to maturity. Additionally, the credit risk for most of the Bank's commercial real estate borrowing relationships is mitigated due to the amount of equity injected into the projects, strong debt service coverage ratios, and the liquidity, personal cash flow and net worth of the guarantors. Several of these borrowing relationships have a preference for fixed-rate loans and the market interest rates are typically lower for these types of borrowers.
Unpaid | Undisbursed | Gross Loan | Outstanding | % of | ||||||||||||||||||
Principal | Amount | Amount | Commitments | Total | Total | |||||||||||||||||
(Dollars in thousands) | ||||||||||||||||||||||
Health care and social assistance | $ | 96,426 | $ | 87,478 | $ | 183,904 | $ | 765 | $ | 184,669 | 24.4 | % | ||||||||||
Accommodation and food services | 147,966 | 32,706 | 180,672 | — | 180,672 | 23.8 | ||||||||||||||||
Real estate rental and leasing | 121,332 | 24,671 | 146,003 | 16,924 | 162,927 | 21.5 | ||||||||||||||||
Retail trade | 34,213 | 1,385 | 35,598 | 37,761 | 73,359 | 9.7 | ||||||||||||||||
Multi-family | 25,787 | 18,609 | 44,396 | 25,871 | 70,267 | 9.3 | ||||||||||||||||
Arts, entertainment, and recreation | 36,564 | — | 36,564 | 1,460 | 38,024 | 5.0 | ||||||||||||||||
Other | 44,453 | 1,743 | 46,196 | 1,360 | 47,556 | 6.3 | ||||||||||||||||
$ | 506,741 | $ | 166,592 | $ | 673,333 | $ | 84,141 | $ | 757,474 | 100.0 | % | |||||||||||
Weighted average rate | 4.37 | % | 4.62 | % | 4.43 | % | 5.18 | % | 4.51 | % | ||||||||||||
52
The following table summarizes the Bank's commercial real estate loans and loan commitments by state as of September 30, 2018.
Unpaid | Undisbursed | Gross Loan | Outstanding | % of | ||||||||||||||||||
Principal | Amount | Amount | Commitments | Total | Total | |||||||||||||||||
(Dollars in thousands) | ||||||||||||||||||||||
Missouri | $ | 146,870 | $ | 95,008 | $ | 241,878 | $ | 4,758 | $ | 246,636 | 32.6 | % | ||||||||||
Kansas | 200,811 | 10,605 | 211,416 | 19,174 | 230,590 | 30.4 | ||||||||||||||||
Texas | 129,956 | 41,324 | 171,280 | 34,650 | 205,930 | 27.2 | ||||||||||||||||
Kentucky | — | — | — | 25,559 | 25,559 | 3.4 | ||||||||||||||||
Nebraska | 4,295 | 17,857 | 22,152 | — | 22,152 | 2.9 | ||||||||||||||||
Colorado | 9,064 | 148 | 9,212 | — | 9,212 | 1.2 | ||||||||||||||||
Arkansas | 7,766 | 150 | 7,916 | — | 7,916 | 1.1 | ||||||||||||||||
California | 6,290 | — | 6,290 | — | 6,290 | 0.8 | ||||||||||||||||
Montana | 1,397 | 1,500 | 2,897 | — | 2,897 | 0.4 | ||||||||||||||||
Arizona | 292 | — | 292 | — | 292 | — | ||||||||||||||||
$ | 506,741 | $ | 166,592 | $ | 673,333 | $ | 84,141 | $ | 757,474 | 100.0 | % | |||||||||||
The following table presents the Bank's commercial and industrial loans and loan commitments by business purpose, as of September 30, 2018.
Unpaid | Undisbursed | Gross Loan | Outstanding | % of | ||||||||||||||||||
Principal | Amount | Amount | Commitments | Total | Total | |||||||||||||||||
(Dollars in thousands) | ||||||||||||||||||||||
Working capital | $ | 34,922 | $ | 18,955 | $ | 53,877 | $ | 230 | $ | 54,107 | 64.4 | % | ||||||||||
Equipment | 16,029 | 595 | 16,624 | 175 | 16,799 | 20.0 | ||||||||||||||||
Small Business Administration | 6,438 | 345 | 6,783 | — | 6,783 | 8.1 | ||||||||||||||||
Auto lease | 4,441 | 364 | 4,805 | — | 4,805 | 5.7 | ||||||||||||||||
Other | 1,039 | 406 | 1,445 | 100 | 1,545 | 1.8 | ||||||||||||||||
$ | 62,869 | $ | 20,665 | $ | 83,534 | $ | 505 | $ | 84,039 | 100.0 | % | |||||||||||
The following table presents the Bank's commercial loan portfolio and outstanding loan commitments, categorized by gross loan amount (unpaid principal plus undisbursed amounts) or outstanding loan commitment amount, as of September 30, 2018.
Amount | |||
(Dollars in thousands) | |||
Greater than $30 million | $ | 155,126 | |
>$15 to $30 million | 284,045 | ||
>$10 to $15 million | 37,040 | ||
>$5 to $10 million | 44,047 | ||
$1 to $5 million | 173,518 | ||
Less than $1 million | 147,737 | ||
$ | 841,513 | ||
53
Securities. Securities increased $92.6 million from $1.24 billion at September 30, 2017 to $1.33 billion at September 30, 2018. The increase was due mainly to acquiring securities with a fair value of $91.6 million in the acquisition of CCB. The following table presents the distribution of our securities portfolio, at amortized cost, at the dates indicated. Overall, fixed-rate securities comprised 77% of our securities portfolio at September 30, 2018. The weighted average life ("WAL") is the estimated remaining maturity (in years) after three-month historical prepayment speeds and projected call option assumptions have been applied. Weighted average yields on tax-exempt securities are not calculated on a fully taxable equivalent basis.
September 30, 2018 | September 30, 2017 | ||||||||||||||||||
Amount | Yield | WAL | Amount | Yield | WAL | ||||||||||||||
(Dollars in thousands) | |||||||||||||||||||
Fixed-rate securities: | |||||||||||||||||||
MBS | $ | 732,095 | 2.43 | % | 3.0 | $ | 632,422 | 2.14 | % | 2.9 | |||||||||
GSE debentures | 268,525 | 2.09 | 2.3 | 271,300 | 1.29 | 1.3 | |||||||||||||
Municipal bonds | 24,574 | 1.56 | 1.8 | 28,337 | 1.65 | 2.0 | |||||||||||||
Total fixed-rate securities | 1,025,194 | 2.32 | 2.8 | 932,059 | 1.88 | 2.4 | |||||||||||||
Adjustable-rate securities: | |||||||||||||||||||
MBS | 305,688 | 2.89 | 4.5 | 304,153 | 2.55 | 4.6 | |||||||||||||
Trust preferred securities | — | — | — | 2,067 | 2.58 | 19.7 | |||||||||||||
Total adjustable-rate securities | 305,688 | 2.89 | 4.5 | 306,220 | 2.55 | 4.7 | |||||||||||||
Total securities portfolio | $ | 1,330,882 | 2.45 | 3.2 | $ | 1,238,279 | 2.05 | 3.0 | |||||||||||
The following table presents the carrying value of MBS in our portfolio by issuer at the dates presented.
At September 30, | |||||||
2018 | 2017 | ||||||
(Dollars in thousands) | |||||||
FNMA | $ | 680,717 | $ | 575,142 | |||
FHLMC | 265,441 | 306,196 | |||||
Government National Mortgage Association | 90,832 | 61,109 | |||||
$ | 1,036,990 | $ | 942,447 | ||||
54
Mortgage-Backed Securities - The balance of MBS, which primarily consists of securities of U.S. GSEs, increased $94.5 million to $1.04 billion at September 30, 2018 from $942.4 million at September 30, 2017. The increase was due primarily to securities acquired in the acquisition of CCB. The following table summarizes the activity in our portfolio of MBS for the periods presented. The weighted average yields and WALs for purchases are presented as recorded at the time of purchase. The weighted average yields for the beginning balances are as of the last day of the period previous to the period presented and the weighted average yields for the ending balances are as of the last day of the period presented and are generally derived from recent prepayment activity on the securities in the portfolio as of the dates presented. The beginning and ending WAL is the estimated remaining principal repayment term (in years) after three-month historical prepayment speeds have been applied.
For the Three Months Ended | |||||||||||||||||||||||||||||||||||||||
September 30, 2018 | June 30, 2018 | March 31, 2018 | December 31, 2017 | ||||||||||||||||||||||||||||||||||||
Amount | Yield | WAL | Amount | Yield | WAL | Amount | Yield | WAL | Amount | Yield | WAL | ||||||||||||||||||||||||||||
(Dollars in thousands) | |||||||||||||||||||||||||||||||||||||||
Beginning balance - carrying value | $ | 958,269 | 2.46 | % | 3.7 | $ | 982,405 | 2.39 | % | 3.8 | $ | 951,238 | 2.31 | % | 3.7 | $ | 942,447 | 2.28 | % | 3.5 | |||||||||||||||||||
Maturities and repayments | (77,985 | ) | (69,843 | ) | (63,520 | ) | (66,116 | ) | |||||||||||||||||||||||||||||||
Net amortization of (premiums)/discounts | (624 | ) | (702 | ) | (788 | ) | (854 | ) | |||||||||||||||||||||||||||||||
Purchases: | |||||||||||||||||||||||||||||||||||||||
Fixed | 74,178 | 3.11 | 3.7 | 24,348 | 2.90 | 3.7 | 77,437 | 2.92 | 4.1 | 25,908 | 2.46 | 5.5 | |||||||||||||||||||||||||||
Adjustable | — | — | — | 23,544 | 2.35 | 3.0 | 19,610 | 2.68 | 4.3 | 50,874 | 2.35 | 4.7 | |||||||||||||||||||||||||||
Acquisition of CCB securities, net | 85,741 | 3.13 | 2.5 | — | — | — | — | — | — | — | — | — | |||||||||||||||||||||||||||
Change in valuation on AFS securities | (2,589 | ) | (1,483 | ) | (1,572 | ) | (1,021 | ) | |||||||||||||||||||||||||||||||
Ending balance - carrying value | $ | 1,036,990 | 2.57 | 3.4 | $ | 958,269 | 2.46 | 3.7 | $ | 982,405 | 2.39 | 3.8 | $ | 951,238 | 2.31 | 3.7 | |||||||||||||||||||||||
For the Year Ended September 30, | |||||||||||||||||||
2018 | 2017 | ||||||||||||||||||
Amount | Yield | WAL | Amount | Yield | WAL | ||||||||||||||
(Dollars in thousands) | |||||||||||||||||||
Beginning balance - carrying value | $ | 942,447 | 2.28 | % | 3.5 | $ | 1,246,078 | 2.19 | % | 3.5 | |||||||||
Maturities and repayments | (277,464 | ) | (307,094 | ) | |||||||||||||||
Net amortization of (premiums)/discounts | (2,968 | ) | (4,234 | ) | |||||||||||||||
Purchases: | |||||||||||||||||||
Fixed | 201,871 | 2.93 | 4.1 | 10,890 | 1.99 | 3.8 | |||||||||||||
Adjustable | 94,028 | 2.42 | 4.2 | — | — | — | |||||||||||||
Acquisition of CCB securities, net | 85,741 | 3.13 | 2.5 | — | — | — | |||||||||||||
Change in valuation on AFS securities | (6,665 | ) | (3,193 | ) | |||||||||||||||
Ending balance - carrying value | $ | 1,036,990 | 2.57 | 3.4 | $ | 942,447 | 2.28 | 3.5 | |||||||||||
55
Investment Securities - Investment securities, which consist of U.S. GSE debentures (primarily issued by FNMA, FHLMC, or Federal Home Loan Banks) and municipal investments, decreased $11.2 million to $289.9 million at September 30, 2018 from $301.1 million at September 30, 2017. The following table summarizes the activity of investment securities for the periods presented. The weighted average yields and WALs for purchases are presented as recorded at the time of purchase. The weighted average yields for the beginning balances are as of the last day of the period previous to the period presented and the weighted average yields for the ending balances are as of the last day of the period presented. The beginning and ending WALs represent the estimated remaining principal repayment terms (in years) of the securities after projected call dates have been considered, based upon market rates at each date presented.
For the Three Months Ended | |||||||||||||||||||||||||||||||||||||||
September 30, 2018 | June 30, 2018 | March 31, 2018 | December 31, 2017 | ||||||||||||||||||||||||||||||||||||
Amount | Yield | WAL | Amount | Yield | WAL | Amount | Yield | WAL | Amount | Yield | WAL | ||||||||||||||||||||||||||||
(Dollars in thousands) | |||||||||||||||||||||||||||||||||||||||
Beginning balance - carrying value | $ | 261,614 | 1.95 | % | 2.2 | $ | 293,113 | 1.61 | % | 1.5 | $ | 321,452 | 1.40 | % | 1.2 | $ | 301,122 | 1.33 | % | 1.5 | |||||||||||||||||||
Maturities, calls and sales | (2,010 | ) | (71,700 | ) | (52,360 | ) | (3,768 | ) | |||||||||||||||||||||||||||||||
Net amortization of (premiums)/discounts | (48 | ) | (43 | ) | (43 | ) | (48 | ) | |||||||||||||||||||||||||||||||
Purchases: | |||||||||||||||||||||||||||||||||||||||
Fixed | 24,996 | 3.01 | 3.0 | 40,564 | 3.02 | 2.1 | 25,000 | 2.81 | 1.0 | 25,000 | 2.45 | 1.0 | |||||||||||||||||||||||||||
Acquisition of CCB securities, net | 5,855 | 2.12 | 1.0 | — | — | — | — | — | — | — | — | — | |||||||||||||||||||||||||||
Change in valuation on AFS securities | (465 | ) | (320 | ) | (936 | ) | (854 | ) | |||||||||||||||||||||||||||||||
Ending balance - carrying value | $ | 289,942 | 2.05 | 2.2 | $ | 261,614 | 1.95 | 2.2 | $ | 293,113 | 1.61 | 1.5 | $ | 321,452 | 1.40 | 1.2 | |||||||||||||||||||||||
For the Year Ended September 30, | |||||||||||||||||||
2018 | 2017 | ||||||||||||||||||
Amount | Yield | WAL | Amount | Yield | WAL | ||||||||||||||
(Dollars in thousands) | |||||||||||||||||||
Beginning balance - carrying value | $ | 301,122 | 1.33 | % | 1.5 | $ | 382,097 | 1.20 | % | 1.2 | |||||||||
Maturities, calls and sales | (129,838 | ) | (106,238 | ) | |||||||||||||||
Net amortization of (premiums)/discounts | (182 | ) | (245 | ) | |||||||||||||||
Purchases: | |||||||||||||||||||
Fixed | 115,560 | 2.85 | 1.8 | 26,535 | 1.68 | 4.0 | |||||||||||||
Acquisition of CCB securities, net | 5,855 | 2.12 | 1.0 | — | — | — | |||||||||||||
Change in valuation on AFS securities | (2,575 | ) | (1,027 | ) | |||||||||||||||
Ending balance - carrying value | $ | 289,942 | 2.05 | 2.2 | $ | 301,122 | 1.33 | 1.5 | |||||||||||
56
Liabilities. Total liabilities were $8.06 billion at September 30, 2018 compared to $7.82 billion at September 30, 2017. The $233.3 million increase was due mainly to deposits of $352.5 million assumed in the acquisition of CCB, partially offset by a decrease in public unit certificates of deposits and savings accounts both excluding the impact of acquired deposits.
Deposits - Deposits were $5.60 billion at September 30, 2018 compared to $5.31 billion at September 30, 2017. We continue to be competitive on deposit rates and, in some cases, our offer rates for longer-term certificates of deposit have been higher than peers. Offering competitive rates on longer-term certificates of deposit has been an on-going balance sheet strategy by management in anticipation of higher interest rates. If interest rates continue to rise, our customers may move funds from their checking, savings and money market accounts to higher yielding deposit products within the Bank or withdraw their funds from these accounts, including certificates of deposit, to invest in higher yielding investments outside of the Bank.
The following table presents the amount, weighted average rate and percent of total for the components of our deposit portfolio at the dates presented. The decrease in the savings rate at September 30, 2018 compared to September 30, 2017 was due to the conversion of retirement savings accounts into a money market account type during the last quarter of fiscal year 2018.
At September 30, | |||||||||||||||||||
2018 | 2017 | ||||||||||||||||||
% of | % of | ||||||||||||||||||
Amount | Rate | Total | Amount | Rate | Total | ||||||||||||||
(Dollars in thousands) | |||||||||||||||||||
Non-interest-bearing checking | $ | 336,454 | — | % | 6.0 | % | $ | 243,670 | — | % | 4.6 | % | |||||||
Interest-bearing checking | 724,066 | 0.08 | 12.9 | 615,615 | 0.05 | 11.6 | |||||||||||||
Savings | 352,896 | 0.07 | 6.3 | 349,977 | 0.24 | 6.6 | |||||||||||||
Money market | 1,252,881 | 0.47 | 22.4 | 1,190,185 | 0.24 | 22.4 | |||||||||||||
Retail/business certificates of deposit | 2,529,368 | 1.79 | 45.1 | 2,450,418 | 1.52 | 46.1 | |||||||||||||
Public unit certificates of deposit | 407,689 | 1.89 | 7.3 | 460,003 | 1.28 | 8.7 | |||||||||||||
$ | 5,603,354 | 1.06 | 100.0 | % | $ | 5,309,868 | 0.89 | 100.0 | % | ||||||||||
The following tables set forth scheduled maturity information for our certificates of deposit, including public unit certificates of deposit, along with associated weighted average rates, at September 30, 2018.
Amount Due | |||||||||||||||||||||||
More than | More than | ||||||||||||||||||||||
1 year | 1 year to | 2 years to 3 | More than | Total | |||||||||||||||||||
Rate range | or less | 2 years | years | 3 years | Amount | Rate | |||||||||||||||||
(Dollars in thousands) | |||||||||||||||||||||||
0.00 – 0.99% | $ | 214,426 | $ | 4,433 | $ | 2,681 | $ | 46 | $ | 221,586 | 0.73 | % | |||||||||||
1.00 – 1.99% | 723,290 | 563,639 | 327,697 | 281,913 | 1,896,539 | 1.68 | |||||||||||||||||
2.00 – 2.99% | 292,143 | 244,813 | 41,953 | 239,787 | 818,696 | 2.37 | |||||||||||||||||
3.00 – 3.99% | — | — | — | 236 | 236 | 3.00 | |||||||||||||||||
$ | 1,229,859 | $ | 812,885 | $ | 372,331 | $ | 521,982 | $ | 2,937,057 | 1.80 | |||||||||||||
Percent of total | 41.8 | % | 27.7 | % | 12.7 | % | 17.8 | % | |||||||||||||||
Weighted average rate | 1.55 | 1.94 | 1.86 | 2.13 | |||||||||||||||||||
Weighted average maturity (in years) | 0.5 | 1.4 | 2.5 | 3.7 | 1.6 | ||||||||||||||||||
Weighted average maturity for the retail/business certificate of deposit portfolio (in years) | 1.7 | ||||||||||||||||||||||
57
Amount Due | |||||||||||||||||||
Over | Over | ||||||||||||||||||
3 months | 3 to 6 | 6 to 12 | Over | ||||||||||||||||
or less | months | months | 12 months | Total | |||||||||||||||
(Dollars in thousands) | |||||||||||||||||||
Retail/business certificates of deposit less than $100,000 | $ | 130,716 | $ | 124,939 | $ | 307,654 | $ | 946,966 | $ | 1,510,275 | |||||||||
Retail/business certificates of deposit of $100,000 or more | 76,775 | 57,856 | 203,485 | 680,977 | 1,019,093 | ||||||||||||||
Public unit certificates of deposit of $100,000 or more | 117,693 | 53,305 | 157,436 | 79,255 | 407,689 | ||||||||||||||
$ | 325,184 | $ | 236,100 | $ | 668,575 | $ | 1,707,198 | $ | 2,937,057 | ||||||||||
58
Borrowings - The following tables present borrowing activity for the periods shown. The borrowings presented in the table have original contractual terms of one year or longer. Management expects to prepay the other borrowings assumed in the acquisition of CCB during the first half of fiscal year 2019. FHLB advances are presented at par. The weighted average effective rate includes the impact of interest rate swaps and the amortization of deferred prepayment penalties resulting from FHLB advances previously prepaid. The weighted average maturity ("WAM") is the remaining weighted average contractual term in years. The beginning and ending WAMs represent the remaining maturity at each date presented. For new borrowings, the WAMs presented are as of the date of issue.
For the Three Months Ended | |||||||||||||||||||||||||||||||||||||||
September 30, 2018 | June 30, 2018 | March 31, 2018 | December 31, 2017 | ||||||||||||||||||||||||||||||||||||
Effective | Effective | Effective | Effective | ||||||||||||||||||||||||||||||||||||
Amount | Rate | WAM | Amount | Rate | WAM | Amount | Rate | WAM | Amount | Rate | WAM | ||||||||||||||||||||||||||||
(Dollars in thousands) | |||||||||||||||||||||||||||||||||||||||
Beginning balance | $ | 2,175,000 | 2.10 | % | 2.7 | $ | 2,175,000 | 2.09 | % | 2.4 | $ | 2,175,000 | 2.09 | % | 2.7 | $ | 2,375,000 | 2.16 | % | 2.7 | |||||||||||||||||||
Maturities: | |||||||||||||||||||||||||||||||||||||||
FHLB advances | (275,000 | ) | 2.17 | (100,000 | ) | 2.82 | — | — | (100,000 | ) | 2.53 | ||||||||||||||||||||||||||||
Repurchase agreements | — | — | — | — | — | — | (100,000 | ) | 3.35 | ||||||||||||||||||||||||||||||
Other borrowings from CCB acquisition | 10,052 | 8.75 | 12.7 | — | — | — | — | — | — | — | — | — | |||||||||||||||||||||||||||
New FHLB borrowings: | |||||||||||||||||||||||||||||||||||||||
Interest rate swaps(1) | 275,000 | 2.53 | 5.6 | 100,000 | 2.92 | 10.0 | — | — | — | — | — | — | |||||||||||||||||||||||||||
Ending balance | $ | 2,185,052 | 2.17 | 2.9 | $ | 2,175,000 | 2.10 | 2.7 | $ | 2,175,000 | 2.09 | 2.4 | $ | 2,175,000 | 2.09 | 2.7 | |||||||||||||||||||||||
For the Year Ended September 30, | |||||||||||||||||||
2018 | 2017 | ||||||||||||||||||
Effective | Effective | ||||||||||||||||||
Amount | Rate | WAM | Amount | Rate | WAM | ||||||||||||||
(Dollars in thousands) | |||||||||||||||||||
Beginning balance | $ | 2,375,000 | 2.16 | % | 2.7 | $ | 2,575,000 | 2.29 | % | 2.9 | |||||||||
Maturities: | |||||||||||||||||||
FHLB advances | (475,000 | ) | 2.38 | (500,000 | ) | 2.72 | |||||||||||||
Repurchase agreements | (100,000 | ) | 3.35 | — | — | ||||||||||||||
Other borrowings from CCB acquisition | 10,052 | 8.75 | 12.7 | — | — | — | |||||||||||||
New FHLB borrowings: | |||||||||||||||||||
Fixed-rate | — | — | — | 100,000 | 1.85 | 3.0 | |||||||||||||
Interest rate swaps(1) | 375,000 | 2.64 | 6.8 | 200,000 | 2.05 | 6.0 | |||||||||||||
Ending balance | $ | 2,185,052 | 2.17 | 2.9 | $ | 2,375,000 | 2.16 | 2.7 | |||||||||||
(1) | Represents adjustable-rate FHLB advances for which the Bank has entered into interest rate swaps to hedge the variability in cash flows associated with the advances. The effective rate and WAM presented include the effect of the interest rate swaps. |
59
Maturities - The following table presents the maturity of term borrowings (including FHLB advances, at par, and repurchase agreements), along with associated weighted average contractual and effective rates as of September 30, 2018. Included in the table are $475.0 million of 12-month adjustable-rate FHLB advances that are hedged with interest rate swaps with a notional amount of $475.0 million. The 12-month adjustable-rate FHLB advances are presented in the table below based on their contractual maturity dates, which occur in fiscal year 2019. These advances will be renewed each year until the maturity or termination of the swaps. The interest rate swaps had an expected WAL of 5.8 years at September 30, 2018.
FHLB | Repurchase | |||||||||||||||
Maturity by | Advances | Agreements | Total | Contractual | Effective | |||||||||||
Fiscal Year | Amount | Amount | Amount | Rate | Rate(1) | |||||||||||
(Dollars in thousands) | ||||||||||||||||
2019 | 875,000 | — | 875,000 | 1.96 | 2.10 | |||||||||||
2020 | 350,000 | 100,000 | 450,000 | 2.11 | 2.11 | |||||||||||
2021 | 550,000 | — | 550,000 | 2.27 | 2.27 | |||||||||||
2022 | 200,000 | — | 200,000 | 2.23 | 2.23 | |||||||||||
2023 | 100,000 | — | 100,000 | 1.82 | 1.82 | |||||||||||
$ | 2,075,000 | $ | 100,000 | $ | 2,175,000 | 2.09 | 2.14 | |||||||||
(1) | The effective rate includes the impact of interest rate swaps and the amortization of deferred prepayment penalties resulting from FHLB advances previously prepaid. |
As of September 30, 2018, the Bank had $100.0 million outstanding on its FHLB line of credit. The average rate paid on FHLB line of credit borrowings during fiscal year 2018 was 1.88%.
The following table presents the maturity and weighted average repricing rate, which is also the weighted average effective rate, of certificates of deposit, split between retail and public unit amounts, and term borrowings for the next four quarters as of September 30, 2018.
Retail/Business | Public Unit | Term | ||||||||||||||||||||||||||
Maturity by | Certificate | Repricing | Certificate | Repricing | Borrowings | Repricing | Repricing | |||||||||||||||||||||
Quarter End | Amount | Rate | Amount | Rate | Amount | Rate | Total | Rate | ||||||||||||||||||||
(Dollars in thousands) | ||||||||||||||||||||||||||||
December 31, 2018 | $ | 207,491 | 1.26 | % | $ | 117,693 | 1.86 | % | $ | 300,000 | 1.73 | % | $ | 625,184 | 1.60 | % | ||||||||||||
March 31, 2019 | 182,795 | 1.25 | 53,305 | 1.65 | — | — | 236,100 | 1.34 | ||||||||||||||||||||
June 30, 2019 | 232,504 | 1.40 | 89,790 | 1.86 | 200,000 | 2.11 | 522,294 | 1.75 | ||||||||||||||||||||
September 30, 2019 | 278,635 | 1.77 | 67,646 | 1.89 | 375,000 | 2.38 | 721,281 | 2.10 | ||||||||||||||||||||
$ | 901,425 | 1.45 | $ | 328,434 | 1.84 | $ | 875,000 | 2.10 | $ | 2,104,859 | 1.78 | |||||||||||||||||
60
Stockholders' Equity. Stockholders' equity was $1.39 billion at September 30, 2018 compared to $1.37 billion at September 30, 2017. The $23.3 million increase was due primarily to net income of $98.9 million, along with the issuance of 3.0 million shares, or $39.1 million, related to the acquisition of CCB, partially offset by the payment of $118.3 million in cash dividends. The cash dividends paid during the current fiscal year totaled $0.88 per share and consisted of a $0.29 per share cash true-up dividend related to fiscal year 2017 earnings per the Company's dividend policy, a $0.25 per share True Blue Capitol dividend, and four regular quarterly cash dividends totaling $0.34 per share.
On October 17, 2018, the Company announced a regular quarterly cash dividend of $0.085 per share, or approximately $11.7 million, payable on November 16, 2018 to stockholders of record as of the close of business on November 2, 2018. On October 26, 2018, the Company announced a fiscal year 2018 cash true-up dividend of $0.39 per share, or approximately $53.7 million, related to fiscal year 2018 earnings. The $0.39 per share cash true-up dividend was determined by taking the difference between total earnings for fiscal year 2018 and total regular quarterly cash dividends paid during fiscal year 2018, divided by the number of shares outstanding as of October 23, 2018. The cash true-up dividend is payable on November 30, 2018 to stockholders of record as of the close of business on November 16, 2018, and is the result of the Board of Directors' commitment to distribute to stockholders 100% of the annual earnings of the Company for fiscal year 2018.
At September 30, 2018, Capitol Federal Financial, Inc., at the holding company level, had $137.7 million on deposit at the Bank. For fiscal year 2019, it is the intent of the Board of Directors and management to continue with the payout of 100% of the Company's earnings to its stockholders. The payout is expected to be in the form of regular quarterly cash dividends of $0.085 per share, totaling $0.34 for the year, and a cash true-up dividend equal to fiscal year 2019 earnings in excess of the amount paid as regular quarterly cash dividends during fiscal year 2019. It is anticipated that the fiscal year 2019 cash true-up dividend will be paid in December 2019. Dividend payments depend upon a number of factors including the Company's financial condition and results of operations, regulatory capital requirements, regulatory limitations on the Bank's ability to make capital distributions to the Company, and the amount of cash at the holding company.
The Company works to find multiple ways to provide stockholder value. Recently, this has primarily been through the payment of cash dividends and historically, the Company has also utilized stock buybacks. The Company has maintained a dividend policy of paying out 100% of its earnings to stockholders in the form of quarterly cash dividends and an annual true-up dividend in December of each year. In order to provide additional stockholder value, the Company has paid a True Blue dividend of $0.25 cash per share in June of each of the past five years, including June 2018, and in December prior to that. The Company has paid the True Blue dividend primarily due to excess capital levels at the Company and Bank. The Company considers various business strategies and their impact on capital and asset measures on both a current and future basis, as well as regulatory capital levels and requirements, in determining the amount, if any, and timing of the True Blue dividend.
The following table presents regular quarterly dividends and special dividends paid in calendar years 2018, 2017, and 2016. The amounts represent cash dividends paid during each period. The 2018 true-up dividend amount presented represents the dividend payable on November 30, 2018 to stockholders of record as of November 16, 2018.
Calendar Year | |||||||||||||||||||||||
2018 | 2017 | 2016 | |||||||||||||||||||||
Amount | Per Share | Amount | Per Share | Amount | Per Share | ||||||||||||||||||
(Dollars in thousands, except per share amounts) | |||||||||||||||||||||||
Regular quarterly dividends paid | |||||||||||||||||||||||
Quarter ended March 31 | $ | 11,427 | $ | 0.085 | $ | 11,386 | $ | 0.085 | $ | 11,305 | $ | 0.085 | |||||||||||
Quarter ended June 30 | 11,429 | 0.085 | 11,409 | 0.085 | 11,314 | 0.085 | |||||||||||||||||
Quarter ended September 30 | 11,430 | 0.085 | 11,411 | 0.085 | 11,323 | 0.085 | |||||||||||||||||
Quarter ended December 31 | 11,696 | 0.085 | 11,427 | 0.085 | 11,363 | 0.085 | |||||||||||||||||
True-up dividends paid | 53,666 | 0.390 | 38,985 | 0.290 | 38,835 | 0.290 | |||||||||||||||||
True Blue dividends paid | 33,614 | 0.250 | 33,559 | 0.250 | 33,274 | 0.250 | |||||||||||||||||
Calendar year-to-date dividends paid | $ | 133,262 | $ | 0.980 | $ | 118,177 | $ | 0.880 | $ | 117,414 | $ | 0.880 | |||||||||||
61
The Company has $70.0 million of common stock remaining on its stock repurchase plan. It is anticipated that shares will be purchased from time to time based upon market conditions and available liquidity. There is no expiration for this repurchase plan and no shares have been repurchased under this repurchase plan.
Weighted Average Yields and Rates. The following table presents the weighted average yields on interest-earning assets, the weighted average rates paid on interest-bearing liabilities, and the resultant interest rate spreads at the dates indicated. As previously discussed, the leverage strategy was not in place at September 30, 2018, 2017, and 2016, so the end of period yields/rates presented in the table below do not reflect the effects of this strategy. The weighted average yields and rates include amortization of fees, costs, premiums and discounts, which are considered adjustments to yields/rates. The weighted average rate on FHLB borrowings includes the impact of interest rate swaps. Weighted average yields on tax-exempt securities are not calculated on a fully taxable equivalent basis.
At September 30, | ||||||||
2018 | 2017 | 2016 | ||||||
Yield on: | ||||||||
Loans receivable | 3.74 | % | 3.59 | % | 3.58 | % | ||
MBS | 2.57 | 2.28 | 2.19 | |||||
Investment securities | 2.05 | 1.33 | 1.20 | |||||
FHLB stock | 7.22 | 6.47 | 5.98 | |||||
Cash and cash equivalents | 2.19 | 1.25 | 0.49 | |||||
Combined yield on interest-earning assets | 3.57 | 3.32 | 3.22 | |||||
Rate paid on: | ||||||||
Checking | 0.05 | 0.04 | 0.04 | |||||
Savings | 0.07 | 0.24 | 0.17 | |||||
Money market | 0.47 | 0.24 | 0.24 | |||||
Retail/business certificates | 1.79 | 1.52 | 1.43 | |||||
Wholesale certificates | 1.89 | 1.28 | 0.70 | |||||
Total deposits | 1.06 | 0.89 | 0.80 | |||||
FHLB borrowings | 2.13 | 2.09 | 2.24 | |||||
Other borrowings | 3.10 | 2.94 | 2.94 | |||||
Total borrowings | 2.18 | 2.16 | 2.29 | |||||
Combined rate paid on interest-bearing liabilities | 1.39 | 1.28 | 1.30 | |||||
Net interest rate spread | 2.18 | 2.04 | 1.92 | |||||
62
Rate/Volume Analysis. The table below presents the dollar amount of changes in interest income and interest expense for major components of interest-earning assets and interest-bearing liabilities, comparing fiscal years 2018 to 2017 and fiscal years 2017 to 2016. For each category of interest-earning assets and interest-bearing liabilities, information is provided on changes attributable to (1) changes in volume, which are changes in the average balance multiplied by the previous year's average rate, and (2) changes in rate, which are changes in the average rate multiplied by the average balance from the previous year. The net changes attributable to the combined impact of both rate and volume have been allocated proportionately to the changes due to volume and the changes due to rate.
For the Year Ended September 30, | |||||||||||||||||||||||
2018 vs. 2017 | 2017 vs. 2016 | ||||||||||||||||||||||
Increase (Decrease) Due to | Increase (Decrease) Due to | ||||||||||||||||||||||
Volume | Rate | Total | Volume | Rate | Total | ||||||||||||||||||
(Dollars in thousands) | |||||||||||||||||||||||
Interest-earning assets: | |||||||||||||||||||||||
Loans receivable | $ | 3,182 | $ | 3,623 | $ | 6,805 | $ | 13,480 | $ | (3,398 | ) | $ | 10,082 | ||||||||||
MBS | (2,911 | ) | 1,721 | (1,190 | ) | (6,083 | ) | 98 | (5,985 | ) | |||||||||||||
Investment securities | (690 | ) | 998 | 308 | (1,783 | ) | 220 | (1,563 | ) | ||||||||||||||
FHLB stock | (1,956 | ) | 685 | (1,271 | ) | (753 | ) | 734 | (19 | ) | |||||||||||||
Cash and cash equivalents | (6,607 | ) | 10,661 | 4,054 | (252 | ) | 9,810 | 9,558 | |||||||||||||||
Total interest-earning assets | (8,982 | ) | 17,688 | 8,706 | 4,609 | 7,464 | 12,073 | ||||||||||||||||
Interest-bearing liabilities: | |||||||||||||||||||||||
Checking | 23 | 11 | 34 | 15 | (5 | ) | 10 | ||||||||||||||||
Savings | 56 | 625 | 681 | 38 | 143 | 181 | |||||||||||||||||
Money market | (45 | ) | 1,709 | 1,664 | 81 | 25 | 106 | ||||||||||||||||
Certificates of deposit | 414 | 6,864 | 7,278 | 1,067 | 3,745 | 4,812 | |||||||||||||||||
FHLB borrowings | (8,939 | ) | 7,188 | (1,751 | ) | (5,262 | ) | 9,042 | 3,780 | ||||||||||||||
Other borrowings | (2,094 | ) | (497 | ) | (2,591 | ) | (8 | ) | (8 | ) | (16 | ) | |||||||||||
Total interest-bearing liabilities | (10,585 | ) | 15,900 | 5,315 | (4,069 | ) | 12,942 | 8,873 | |||||||||||||||
Net change in net interest income | $ | 1,603 | $ | 1,788 | $ | 3,391 | $ | 8,678 | $ | (5,478 | ) | $ | 3,200 | ||||||||||
Average Balance Sheets. The following table presents the average balances of our assets, liabilities, and stockholders' equity, and the related weighted average yields and rates on our interest-earning assets and interest-bearing liabilities for the periods indicated. Weighted average yields are derived by dividing annual income by the average balance of the related assets, and weighted average rates are derived by dividing annual expense by the average balance of the related liabilities, for the periods shown. Average outstanding balances are derived from average daily balances. The weighted average yields and rates include amortization of fees, costs, premiums and discounts which are considered adjustments to yields/rates. Weighted average yields on tax-exempt securities are not calculated on a fully taxable equivalent basis.
63
For the Year Ended September 30, | ||||||||||||||||||||||||||||||||
2018 | 2017 | 2016 | ||||||||||||||||||||||||||||||
Average | Interest | Average | Interest | Average | Interest | |||||||||||||||||||||||||||
Outstanding | Earned/ | Yield/ | Outstanding | Earned/ | Yield/ | Outstanding | Earned/ | Yield/ | ||||||||||||||||||||||||
Amount | Paid | Rate | Amount | Paid | Rate | Amount | Paid | Rate | ||||||||||||||||||||||||
Assets: | ||||||||||||||||||||||||||||||||
Interest-earning assets: | ||||||||||||||||||||||||||||||||
Loans receivable(1) | $ | 7,236,915 | $ | 260,198 | 3.60 | % | $ | 7,150,686 | $ | 253,393 | 3.54 | % | $ | 6,766,317 | $ | 243,311 | 3.60 | % | ||||||||||||||
MBS(2) | 961,251 | 22,619 | 2.35 | 1,088,495 | 23,809 | 2.19 | 1,366,605 | 29,794 | 2.18 | |||||||||||||||||||||||
Investment securities(2)(3) | 291,726 | 4,670 | 1.60 | 341,149 | 4,362 | 1.28 | 481,223 | 5,925 | 1.23 | |||||||||||||||||||||||
FHLB stock | 163,307 | 10,962 | 6.71 | 192,896 | 12,233 | 6.34 | 204,894 | 12,252 | 5.98 | |||||||||||||||||||||||
Cash and cash equivalents(4) | 1,514,625 | 23,443 | 1.53 | 2,114,722 | 19,389 | 0.90 | 2,168,896 | 9,831 | 0.45 | |||||||||||||||||||||||
Total interest-earning assets(1)(2) | 10,167,824 | 321,892 | 3.16 | 10,887,948 | 313,186 | 2.87 | 10,987,935 | 301,113 | 2.74 | |||||||||||||||||||||||
Other non-interest-earning assets | 313,902 | 299,338 | 293,692 | |||||||||||||||||||||||||||||
Total assets | $ | 10,481,726 | $ | 11,187,286 | $ | 11,281,627 | ||||||||||||||||||||||||||
Liabilities and stockholders' equity: | ||||||||||||||||||||||||||||||||
Interest-bearing liabilities: | ||||||||||||||||||||||||||||||||
Checking | $ | 888,076 | 334 | 0.04 | $ | 827,677 | 302 | 0.04 | $ | 784,303 | 291 | 0.04 | ||||||||||||||||||||
Savings | 369,833 | 1,465 | 0.40 | 346,495 | 783 | 0.23 | 326,744 | 603 | 0.18 | |||||||||||||||||||||||
Money market | 1,192,027 | 4,532 | 0.38 | 1,210,644 | 2,868 | 0.24 | 1,173,983 | 2,762 | 0.24 | |||||||||||||||||||||||
Retail/business certificates | 2,441,982 | 39,779 | 1.63 | 2,434,470 | 35,449 | 1.46 | 2,370,286 | 32,181 | 1.36 | |||||||||||||||||||||||
Wholesale certificates | 414,107 | 6,515 | 1.57 | 391,902 | 3,566 | 0.91 | 370,707 | 2,022 | 0.55 | |||||||||||||||||||||||
Total deposits | 5,306,025 | 52,625 | 0.99 | 5,211,188 | 42,968 | 0.82 | 5,026,023 | 37,859 | 0.75 | |||||||||||||||||||||||
FHLB borrowings(5) | 3,558,032 | 67,120 | 1.88 | 4,269,494 | 68,871 | 1.61 | 4,530,835 | 65,091 | 1.43 | |||||||||||||||||||||||
Other borrowings | 122,886 | 3,374 | 2.71 | 200,000 | 5,965 | 2.94 | 200,000 | 5,981 | 2.94 | |||||||||||||||||||||||
Total borrowings | 3,680,918 | 70,494 | 1.90 | 4,469,494 | 74,836 | 1.67 | 4,730,835 | 71,072 | 1.50 | |||||||||||||||||||||||
Total interest-bearing liabilities | 8,986,943 | 123,119 | 1.36 | 9,680,682 | 117,804 | 1.21 | 9,756,858 | 108,931 | 1.11 | |||||||||||||||||||||||
Other non-interest-bearing liabilities | 129,749 | 124,443 | 120,636 | |||||||||||||||||||||||||||||
Stockholders' equity | 1,365,034 | 1,382,161 | 1,404,133 | |||||||||||||||||||||||||||||
Total liabilities and stockholders' equity | $ | 10,481,726 | $ | 11,187,286 | $ | 11,281,627 | ||||||||||||||||||||||||||
Net interest income(6) | $ | 198,773 | $ | 195,382 | $ | 192,182 | ||||||||||||||||||||||||||
Net interest rate spread(7)(8) | 1.80 | 1.66 | 1.63 | |||||||||||||||||||||||||||||
Net interest-earning assets | $ | 1,180,881 | $ | 1,207,266 | $ | 1,231,077 | ||||||||||||||||||||||||||
Net interest margin(8)(9) | 1.95 | 1.79 | 1.75 | |||||||||||||||||||||||||||||
Ratio of interest-earning assets to interest-bearing liabilities | 1.13x | 1.12x | 1.13x | |||||||||||||||||||||||||||||
64
(1) | Calculated net of unearned loan fees and deferred costs. Loans that are 90 or more days delinquent are included in the loans receivable average balance with a yield of zero percent. Balances include loans receivable held-for-sale. |
(2) | MBS and investment securities classified as AFS are stated at amortized cost, adjusted for unamortized purchase premiums or discounts. |
(3) | The average balance of investment securities includes an average balance of nontaxable securities of $24.9 million, $30.7 million, and $37.0 million for the years ended September 30, 2018, 2017, and 2016, respectively. |
(4) | The average balance of cash and cash equivalents includes an average balance of cash related to the leverage strategy of $1.33 billion, $1.93 billion, and $1.97 billion for the years ended September 30, 2018, 2017, and 2016, respectively. |
(5) | Included in this line, for the years ended September 30, 2018, 2017, and 2016, respectively, are FHLB borrowings related to the leverage strategy with an average outstanding amount of $1.39 billion, $2.02 billion, and $2.06 billion, respectively, interest paid of $22.1 million, $18.5 million, and $10.1 million, respectively, at a rate of 1.57%, 0.91%, and 0.48%, respectively, and FHLB borrowings not related to the leverage strategy with an average outstanding amount of $2.17 billion, $2.25 billion, and $2.47 billion, respectively, interest paid of $45.0 million, $50.3 million, and $55.0 million, respectively, at a rate of 2.07%, 2.24%, and 2.23%, respectively. The FHLB advance amounts and rates included in this line include the effect of interest rate swaps and are net of deferred prepayment penalties. |
(6) | Net interest income represents the difference between interest income earned on interest-earning assets and interest paid on interest-bearing liabilities. Net interest income depends on the balance of interest-earning assets and interest-bearing liabilities, and the interest rates earned or paid on them. |
(7) | Net interest rate spread represents the difference between the average yield on interest-earning assets and the average cost of interest-bearing liabilities. |
(8) | The table below provides a reconciliation between certain performance ratios presented in accordance with GAAP and the performance ratios excluding the effects of the leverage strategy, which are not presented in accordance with GAAP. Management believes it is important for comparability purposes to provide the performance ratios without the leverage strategy because of the unique nature of the leverage strategy. The leverage strategy reduces some of our performance ratios due to the amount of earnings associated with the transaction in comparison to the size of the transaction, while increasing our net income. The pre-tax yield on the leverage strategy was 0.15%, 0.21% and 0.16% for the years ended September 30, 2018, 2017, and 2016, respectively. |
For the Year Ended September 30, | |||||||||||||||||||||||||||
2018 | 2017 | 2016 | |||||||||||||||||||||||||
Actual | Leverage | Adjusted | Actual | Leverage | Adjusted | Actual | Leverage | Adjusted | |||||||||||||||||||
(GAAP) | Strategy | (Non-GAAP) | (GAAP) | Strategy | (Non-GAAP) | (GAAP) | Strategy | (Non-GAAP) | |||||||||||||||||||
Net interest margin | 1.95 | % | (0.29 | )% | 2.24 | % | 1.79 | % | (0.36 | )% | 2.15 | % | 1.75 | % | (0.35 | )% | 2.10 | % | |||||||||
Net interest rate spread | 1.80 | (0.26 | ) | 2.06 | 1.66 | (0.32 | ) | 1.98 | 1.63 | (0.30 | ) | 1.93 | |||||||||||||||
(9) | Net interest margin represents net interest income as a percentage of average interest-earning assets. |
65
Comparison of Operating Results for the Years Ended September 30, 2018 and 2017
The Company recognized net income of $98.9 million, or $0.73 per share, for the fiscal year ended September 30, 2018 compared to net income of $84.1 million, or $0.63 per share, for the fiscal year ended September 30, 2017. The increase in net income was due primarily to a decrease in income tax expense. During the current fiscal year, the Tax Act was enacted which reduced the federal corporate income tax rate from 35% to 21% effective January 1, 2018. In accordance with GAAP, the Company revalued its deferred tax assets and liabilities as of December 22, 2017 to account for the lower corporate income tax rate. The revaluation of the Company's deferred income tax assets and liabilities reduced income tax expense by $7.5 million. The effective tax rate for the current fiscal year was 20.2%. Management estimates the effective income tax rate for fiscal year 2019 will be approximately 22%.
The net interest margin increased 16 basis points, from 1.79% for the prior fiscal year to 1.95% for the current fiscal year. Excluding the effects of the leverage strategy, the net interest margin would have increased nine basis points, from 2.15% for the prior fiscal year to 2.24% for the current fiscal year. The increase in the net interest margin was due mainly to an increase in interest-earning asset yields.
Interest and Dividend Income
The weighted average yield on total interest-earning assets increased 29 basis points, from 2.87% for the prior fiscal year to 3.16% for the current fiscal year, while the average balance of interest-earning assets decreased $720.1 million from the prior fiscal year. Absent the impact of the leverage strategy, the weighted average yield on total interest-earning assets would have increased 12 basis points, from 3.27% for the prior fiscal year to 3.39% for the current fiscal year, while the average balance of interest-earning assets would have decreased $93.0 million. The following table presents the components of interest and dividend income for the time periods presented along with the change measured in dollars and percent.
For the Year Ended | ||||||||||||||
September 30, | Change Expressed in: | |||||||||||||
2018 | 2017 | Dollars | Percent | |||||||||||
(Dollars in thousands) | ||||||||||||||
INTEREST AND DIVIDEND INCOME: | ||||||||||||||
Loans receivable | $ | 260,198 | $ | 253,393 | $ | 6,805 | 2.7 | % | ||||||
Cash and cash equivalents | 23,443 | 19,389 | 4,054 | 20.9 | ||||||||||
MBS | 22,619 | 23,809 | (1,190 | ) | (5.0 | ) | ||||||||
FHLB stock | 10,962 | 12,233 | (1,271 | ) | (10.4 | ) | ||||||||
Investment securities | 4,670 | 4,362 | 308 | 7.1 | ||||||||||
Total interest and dividend income | $ | 321,892 | $ | 313,186 | $ | 8,706 | 2.8 | |||||||
The increase in interest income on loans receivable was due to a six basis point increase in the weighted average yield on the portfolio to 3.60% for the current fiscal year, as well as an $86.2 million increase in the average balance of the portfolio. The increase in the weighted average yield was due primarily to adjustable-rate loans repricing to higher market rates, along with the origination and purchase of new loans at higher market rates.
The table above includes interest income on cash and cash equivalents associated and not associated with the leverage strategy. Interest income on cash and cash equivalents not related to the leverage strategy increased $1.4 million from the prior fiscal year due to a 71 basis point increase in the weighted average yield. Interest income on cash associated with the leverage strategy increased $2.7 million from the prior fiscal year due to a 61 basis point increase in the weighted average yield. In both cases, the increase in the weighted average yield was related to cash balances held at the FRB of Kansas City.
The decrease in interest income on the MBS portfolio was due to a $127.2 million decrease in the average balance of the portfolio, partially offset by a 16 basis point increase in the weighted average yield on the portfolio to 2.35% for the current fiscal year. Cash flows not reinvested were used primarily to fund loan growth and pay off certain maturing term borrowings. The increase in the weighted average yield was due primarily to adjustable-rate MBS repricing to higher market rates, as well as a decrease in the impact of net premium amortization. Net premium amortization of $3.0 million during the current fiscal year decreased the weighted average yield on the portfolio by 31 basis points. During the prior fiscal year, $4.2 million of net
66
premiums were amortized which decreased the weighted average yield on the portfolio by 39 basis points. As of September 30, 2018, the remaining net balance of premiums on our portfolio of MBS was $3.4 million.
The decrease in dividend income on FHLB stock was due mainly to the leverage strategy being in place less often during the current fiscal year, as the strategy was not always profitable. See additional discussion regarding the leverage strategy in the Financial Condition section below.
Interest Expense
The weighted average rate paid on total interest-bearing liabilities increased 15 basis points, from 1.21% for the prior fiscal year to 1.36% for the current fiscal year, while the average balance of interest-bearing liabilities decreased $693.7 million from the prior fiscal year. Absent the impact of the leverage strategy, the weighted average rate paid on total interest-bearing liabilities would have increased four basis points, from 1.29% for the prior fiscal year to 1.33% for the current fiscal year, while the average balance of interest-bearing liabilities would have decreased $68.6 million. The following table presents the components of interest expense for the time periods presented, along with the change measured in dollars and percent.
For the Year Ended | ||||||||||||||
September 30, | Change Expressed in: | |||||||||||||
2018 | 2017 | Dollars | Percent | |||||||||||
(Dollars in thousands) | ||||||||||||||
INTEREST EXPENSE: | ||||||||||||||
FHLB borrowings | $ | 67,120 | $ | 68,871 | $ | (1,751 | ) | (2.5 | )% | |||||
Deposits | 52,625 | 42,968 | 9,657 | 22.5 | ||||||||||
Other borrowings | 3,374 | 5,965 | (2,591 | ) | (43.4 | ) | ||||||||
Total interest expense | $ | 123,119 | $ | 117,804 | $ | 5,315 | 4.5 | |||||||
The table above includes interest expense on FHLB borrowings associated and not associated with the leverage strategy. Interest expense on FHLB borrowings not related to the leverage strategy decreased $5.4 million from the prior fiscal year due to a 17 basis point decrease in the weighted average rate paid on the portfolio, to 2.07% for the current fiscal year, and an $84.3 million decrease in the average balance of the portfolio. The decrease in the weighted average rate paid was due to certain maturing advances being replaced at lower effective interest rates. Interest expense on FHLB borrowings associated with the leverage strategy increased $3.6 million from the prior fiscal year due to a 66 basis point increase in the weighted average rate paid as a result of an increase in interest rates between periods, partially offset by a decrease in the average balance due the strategy not being in place as often during the current fiscal year.
The increase in interest expense on deposits was due primarily to a 17 basis point increase in the weighted average rate, to 0.99% for the current fiscal year. The increase in the weighted average rate was primarily related to the certificate of deposit portfolio, which increased 24 basis points to 1.62% for the current fiscal year. The weighted average rate paid on wholesale certificates increased 66 basis points, to 1.57% for the current fiscal year.
The decrease in interest expense on other borrowings was due mainly to the maturity of a $100.0 million repurchase agreement, which was not replaced, during the current fiscal year.
Provision for Credit Losses
The Bank did not record a provision for credit losses during the current fiscal year or the prior fiscal year. Based on management's assessment of the ACL formula analysis model and several other factors, it was determined that no provision for credit losses was necessary. Net loan recoveries were $65 thousand during the current fiscal year compared to net charge-offs of $142 thousand in the prior fiscal year. At September 30, 2018, loans 30 to 89 days delinquent were 0.25% of total loans and loans 90 or more days delinquent or in foreclosure were 0.12% of total loans. At September 30, 2017, loans 30 to 89 days delinquent were 0.26% of total loans and loans 90 or more days delinquent or in foreclosure were 0.13% of total loans.
67
Non-Interest Income
The following table presents the components of non-interest income for the time periods presented, along with the change measured in dollars and percent.
For the Year Ended | ||||||||||||||
September 30, | Change Expressed in: | |||||||||||||
2018 | 2017 | Dollars | Percent | |||||||||||
(Dollars in thousands) | ||||||||||||||
NON-INTEREST INCOME: | ||||||||||||||
Deposit service fees | $ | 15,636 | $ | 15,053 | $ | 583 | 3.9 | % | ||||||
Income from bank-owned life insurance ("BOLI") | 1,875 | 2,233 | (358 | ) | (16.0 | ) | ||||||||
Other non-interest income | 4,524 | 4,910 | (386 | ) | (7.9 | ) | ||||||||
Total non-interest income | $ | 22,035 | $ | 22,196 | $ | (161 | ) | (0.7 | ) | |||||
The increase in deposit service fees was due mainly to increases in debit card income due to higher transaction volume in the current year and a reduction in waived fees as customers and vendors more fully utilize the chip card technology. The decrease in income from BOLI was due mainly to a one-time adjustment, in the current fiscal year, to the benchmark interest rate associated with one of the policies. The decrease in other non-interest income was due mainly to a loss on the sale of loans during the current fiscal year compared to a gain on the sale of loans during the prior fiscal year as management tested loan sale processes for liquidity purposes.
Non-Interest Expense
The following table presents the components of non-interest expense for the time periods presented, along with the change measured in dollars and percent.
For the Year Ended | ||||||||||||||
September 30, | Change Expressed in: | |||||||||||||
2018 | 2017 | Dollars | Percent | |||||||||||
(Dollars in thousands) | ||||||||||||||
NON-INTEREST EXPENSE: | ||||||||||||||
Salaries and employee benefits | $ | 46,563 | $ | 43,437 | $ | 3,126 | 7.2 | % | ||||||
Information technology and related expense | 13,999 | 11,282 | 2,717 | 24.1 | ||||||||||
Occupancy, net | 11,455 | 10,814 | 641 | 5.9 | ||||||||||
Regulatory and outside services | 5,709 | 5,821 | (112 | ) | (1.9 | ) | ||||||||
Deposit and loan transaction costs | 5,621 | 5,284 | 337 | 6.4 | ||||||||||
Advertising and promotional | 5,034 | 4,673 | 361 | 7.7 | ||||||||||
Federal insurance premium | 3,277 | 3,539 | (262 | ) | (7.4 | ) | ||||||||
Office supplies and related expense | 1,888 | 1,981 | (93 | ) | (4.7 | ) | ||||||||
Other non-interest expense | 3,356 | 2,827 | 529 | 18.7 | ||||||||||
Total non-interest expense | $ | 96,902 | $ | 89,658 | $ | 7,244 | 8.1 | |||||||
The increase in salaries and employee benefits expense was due primarily to an increase in payroll expense, as well as $1.0 million related to the 2018 Tax Savings Bonus Plan and approximately $730 thousand related to the addition of CCB employees and other payroll-related costs associated with the acquisition. The 2018 Tax Savings Bonus plan is a one-time bonus award to qualifying non-officer employees. Management anticipates salaries and employee benefits associated with CCB employees, based on current staffing levels, will be approximately $5.6 million in fiscal year 2019. The increase in information technology and related expense was due mainly to a change in the presentation of certain information technology professional and consulting expenses beginning in fiscal year 2018. Information technology professional and consulting expenses are now being reported in information technology and related expenses rather than regulatory and outside services. Additionally, these expenses increased compared to the prior year due primarily to ongoing enhancements to the Bank's
68
online banking services, along with increases in information technology expenses related to software licensing and depreciation. The change in the presentation of expenses resulted in a decrease in the amount of regulatory and outside services expenses for the current fiscal year, but this was offset by approximately $875 thousand of acquisition-related expenses. The increase in other non-interest expense was due primarily to $242 thousand of expense related to the amortization of deposit intangibles associated with the CCB acquisition and an increase in OREO operations expense. Management anticipates that the deposit intangible amortization expense will be approximately $2.4 million in fiscal year 2019.
The Company's efficiency ratio was 43.89% for the current fiscal year compared to 41.21% for the prior fiscal year. The change in the efficiency ratio was due primarily to higher non-interest expense in the current fiscal year compared to the prior fiscal year. The efficiency ratio is a measure of a financial institution's total non-interest expense as a percentage of the sum of net interest income (pre-provision for credit losses) and non-interest income. A lower value indicates that the financial institution is generating revenue with a proportionally lower level of expense.
Income Tax Expense
Income tax expense was $25.0 million for the current fiscal year compared to $43.8 million for the prior fiscal year. The effective tax rate was 20.2% for the current fiscal year compared to 34.2% for the prior fiscal year. The decrease in the effective tax rate was due mainly to the Tax Act being signed into law in December 2017.
Comparison of Operating Results for the Years Ended September 30, 2017 and 2016
For fiscal year 2017, the Company recognized net income of $84.1 million, or $0.63 per share, compared to net income of $83.5 million, or $0.63 per share, for fiscal year 2016. The increase in net income was due primarily to a $3.2 million increase in net interest income, partially offset by a $1.1 million decrease in non-interest income. Partially offsetting this increase, no provision for credit losses was recorded in fiscal year 2017, compared to a negative provision for credit losses of $750 thousand in fiscal year 2016.
The net interest margin increased four basis points, from 1.75% for fiscal year 2016 to 1.79% for fiscal year 2017. Excluding the effects of the leverage strategy, the net interest margin would have increased five basis points, from 2.10% for fiscal year 2016 to 2.15% for fiscal year 2017. The increase in the net interest margin was due mainly to a shift in the mix of interest-earning assets from relatively lower yielding securities to higher yielding loans, partially offset by a decrease in the weighted average yield on loans. The positive impact of the decrease in interest expense on borrowings not related to the leverage strategy was offset by an increase in interest expense on deposits.
Interest and Dividend Income
The weighted average yield on total interest-earning assets increased 13 basis points, from 2.74% for fiscal year 2016 to 2.87% for fiscal year 2017, while the average balance of interest-earning assets decreased $100.0 million. Absent the impact of the leverage strategy, the weighted average yield on total interest-earning assets would have increased six basis points, from 3.21% for fiscal year 2016 to 3.27% for fiscal year 2017, while the average balance would have decreased $59.6 million. The following table presents the components of interest and dividend income for the time periods presented along with the change measured in dollars and percent.
For the Year Ended | ||||||||||||||
September 30, | Change Expressed in: | |||||||||||||
2017 | 2016 | Dollars | Percent | |||||||||||
(Dollars in thousands) | ||||||||||||||
INTEREST AND DIVIDEND INCOME: | ||||||||||||||
Loans receivable | $ | 253,393 | $ | 243,311 | $ | 10,082 | 4.1 | % | ||||||
MBS | 23,809 | 29,794 | (5,985 | ) | (20.1 | ) | ||||||||
Cash and cash equivalents | 19,389 | 9,831 | 9,558 | 97.2 | ||||||||||
FHLB Stock | 12,233 | 12,252 | (19 | ) | (0.2 | ) | ||||||||
Investment securities | 4,362 | 5,925 | (1,563 | ) | (26.4 | ) | ||||||||
Total interest and dividend income | $ | 313,186 | $ | 301,113 | $ | 12,073 | 4.0 | |||||||
69
The increase in interest income on loans receivable was due to a $384.4 million increase in the average balance of the portfolio, partially offset by a six basis point decrease in the weighted average yield on the portfolio to 3.54% for fiscal year 2017. Loan growth was funded through cash flows from the securities portfolio. The decrease in the weighted average yield was due primarily to endorsements and refinances repricing loans to lower market rates, the origination and purchase of loans at rates lower than the overall loan portfolio rate at certain points during each year, and an increase in the amortization of premiums related to correspondent loans.
The decrease in interest income on the MBS portfolio was due to a $278.1 million decrease in the average balance of the portfolio as cash flows not reinvested were used primarily to fund loan growth and pay off maturing FHLB borrowings. The weighted average yield on the MBS portfolio increased one basis point, from 2.18% during fiscal year 2016 to 2.19% for fiscal year 2017. Net premium amortization of $4.2 million during fiscal year 2017 decreased the weighted average yield on the portfolio by 39 basis points. During fiscal year 2016, $5.0 million of net premiums were amortized, which decreased the weighted average yield on the portfolio by 37 basis points. As of September 30, 2017, the remaining net balance of premiums on our portfolio of MBS was $9.0 million.
The increase in interest income on cash and cash equivalents was due to a 45 basis point increase in the weighted average yield resulting from an increase in the yield earned on balances held at the FRB of Kansas City.
The decrease in interest income on investment securities was due to a $140.1 million decrease in the average balance. Cash flows not reinvested in the portfolio were used primarily to fund loan growth and pay off maturing FHLB borrowings.
Interest Expense
The weighted average rate paid on total interest-bearing liabilities increased 10 basis points, from 1.11% for fiscal year 2016 to 1.21% for fiscal year 2017, while the average balance of interest-bearing liabilities decreased $76.2 million. Absent the impact of the leverage strategy, the weighted average rate paid on total interest-bearing liabilities would have increased one basis point, from 1.28% for fiscal year 2016 to 1.29% for fiscal year 2017, while the average balance of interest-bearing liabilities would have decreased $35.8 million. The following table presents the components of interest expense for the time periods presented, along with the change measured in dollars and percent.
For the Year Ended | ||||||||||||||
September 30, | Change Expressed in: | |||||||||||||
2017 | 2016 | Dollars | Percent | |||||||||||
(Dollars in thousands) | ||||||||||||||
INTEREST EXPENSE: | ||||||||||||||
FHLB borrowings | $ | 68,871 | $ | 65,091 | $ | 3,780 | 5.8 | % | ||||||
Deposits | 42,968 | 37,859 | 5,109 | 13.5 | ||||||||||
Repurchase agreements | 5,965 | 5,981 | (16 | ) | (0.3 | ) | ||||||||
Total interest expense | $ | 117,804 | $ | 108,931 | $ | 8,873 | 8.1 | |||||||
The table above includes interest expense on FHLB borrowings both associated and not associated with the leverage strategy. Interest expense on FHLB borrowings not related to the leverage strategy decreased $4.6 million from fiscal year 2016 due to a $221.0 million decrease in the average balance of the portfolio as a result of not replacing all of the advances that matured between periods. Funds generated from deposit growth were primarily used to pay off the maturing advances, along with some cash flows from the securities portfolio. The weighted average rate paid on FHLB borrowings not related to the leverage strategy increased one basis point, to 2.24% for fiscal year 2017. Interest expense on FHLB borrowings associated with the leverage strategy increased $8.4 million from fiscal year 2016 due to a 43 basis point increase in the weighted average rate paid as a result of an increase in interest rates between periods.
The increase in interest expense on deposits was due primarily to a seven basis point increase in the weighted average rate, to 0.82% for fiscal year 2017, along with growth in the portfolio. The increase in the weighted average rate was primarily related to the retail certificate of deposit portfolio, which increased 10 basis points to 1.46% for fiscal year 2017. The average balance of the deposit portfolio increased $185.2 million during fiscal year 2017, with the majority of the increase in retail deposits.
70
Provision for Credit Losses
The Bank did not record a provision for credit losses during fiscal year 2017, compared to a negative provision for credit losses of $750 thousand during fiscal year 2016. Based on management's assessment of the ACL formula analysis model and several other factors, it was determined that no provision for credit losses was necessary for fiscal year 2017. Net loan charge-offs were $142 thousand during fiscal year 2017 compared to $153 thousand in fiscal year 2016. At September 30, 2017, loans 30 to 89 days delinquent were 0.26% of total loans and loans 90 or more days delinquent or in foreclosure were 0.13% of total loans.
Non-Interest Income
The following table presents the components of non-interest income for the time periods presented, along with the change measured in dollars and percent.
For the Year Ended | ||||||||||||||
September 30, | Change Expressed in: | |||||||||||||
2017 | 2016 | Dollars | Percent | |||||||||||
(Dollars in thousands) | ||||||||||||||
NON-INTEREST INCOME: | ||||||||||||||
Deposit service fees | $ | 15,053 | $ | 14,835 | $ | 218 | 1.5 | % | ||||||
Income from BOLI | 2,233 | 3,420 | (1,187 | ) | (34.7 | ) | ||||||||
Other non-interest income | 4,910 | 5,057 | (147 | ) | (2.9 | ) | ||||||||
Total non-interest income | $ | 22,196 | $ | 23,312 | $ | (1,116 | ) | (4.8 | ) | |||||
The decrease in income from BOLI was due mainly to the receipt of a death benefit during fiscal year 2016 with no such death benefit in fiscal year 2017.
Non-Interest Expense
The following table presents the components of non-interest expense for the time periods presented, along with the change measured in dollars and percent.
For the Year Ended | ||||||||||||||
September 30, | Change Expressed in: | |||||||||||||
2017 | 2016 | Dollars | Percent | |||||||||||
(Dollars in thousands) | ||||||||||||||
NON-INTEREST EXPENSE: | ||||||||||||||
Salaries and employee benefits | $ | 43,437 | $ | 42,378 | $ | 1,059 | 2.5 | % | ||||||
Information technology and related expense | 11,282 | 10,540 | 742 | 7.0 | ||||||||||
Occupancy, net | 10,814 | 10,576 | 238 | 2.3 | ||||||||||
Regulatory and outside services | 5,821 | 5,645 | 176 | 3.1 | ||||||||||
Deposit and loan transaction costs | 5,284 | 5,585 | (301 | ) | (5.4 | ) | ||||||||
Advertising and promotional | 4,673 | 4,609 | 64 | 1.4 | ||||||||||
Federal insurance premium | 3,539 | 5,076 | (1,537 | ) | (30.3 | ) | ||||||||
Office supplies and related expense | 1,981 | 2,640 | (659 | ) | (25.0 | ) | ||||||||
Low income housing partnerships | — | 3,872 | (3,872 | ) | (100.0 | ) | ||||||||
Other non-interest expense | 2,827 | 3,384 | (557 | ) | (16.5 | ) | ||||||||
Total non-interest expense | $ | 89,658 | $ | 94,305 | $ | (4,647 | ) | (4.9 | ) | |||||
The increase in salaries and employee benefits was due primarily to an increase in employee health care costs. The increase in information technology and communications was due largely to software licensing expenses, website hosting expenses, and communication network expenses. The decrease in federal insurance premiums was due primarily to a decrease in the FDIC base assessment rate effective July 1, 2016. The decrease in office supplies and related expense was due primarily to
71
lower debit card expenses compared to fiscal year 2016, during which time the Bank began issuing debit cards enabled with chip card technology. The decrease in low income housing partnerships expense was due to a change in the Bank's method of accounting for those investments. The Bank had been accounting for these partnerships using the equity method of accounting as two of the Bank's officers were involved in the operational management of the low income housing partnership investment group. Effective September 30, 2016, those two Bank officers discontinued their involvement in the operational management of the investment group. On October 1, 2016, the Bank began using the proportional method of accounting for those investments rather than the equity method. As a result, the Bank no longer reports low income housing partnership expenses in non-interest expense; rather, the pretax operating losses and related tax benefits from the investments are reported as a component of income tax expense. The decrease in other non-interest expense was due mainly to a decrease in OREO operations expense, along with lower deposit account charge-offs related to debit card fraud in fiscal year 2017.
The Company's efficiency ratio was 41.21% for fiscal year 2017 compared to 43.76% for fiscal year 2016. The improvement in the efficiency ratio was due primarily to lower non-interest expense in fiscal year 2017 compared to fiscal year 2016.
Income Tax Expense
Income tax expense was $43.8 million for fiscal year 2017 compared to $38.4 million for fiscal year 2016. The effective tax rate for fiscal year 2017 was 34.2% compared to 31.5% for fiscal year 2016. The increase in effective tax rate was due mainly to the change in accounting method for low income housing partnerships as previously discussed.
Liquidity and Capital Resources
Liquidity refers to our ability to generate sufficient cash to fund ongoing operations, to repay maturing certificates of deposit and other deposit withdrawals, to repay maturing borrowings, and to fund loan commitments. Liquidity management is both a daily and long-term function of our business management. The Company's most available liquid assets are represented by cash and cash equivalents, AFS securities, and short-term investment securities. The Bank's primary sources of funds are deposits, FHLB borrowings, repurchase agreements, repayments and maturities of outstanding loans and MBS and other short-term investments, and funds provided by operations. The Bank's long-term borrowings primarily have been used to manage the Bank's interest rate risk with the intent to improve the earnings of the Bank while maintaining capital ratios in excess of regulatory standards for well-capitalized financial institutions. In addition, the Bank's focus on managing risk has provided additional liquidity capacity by maintaining a balance of MBS and investment securities available as collateral for borrowings.
We generally intend to manage cash reserves sufficient to meet short-term liquidity needs, which are routinely forecasted for 10, 30, and 365 days. Additionally, on a monthly basis, we perform a liquidity stress test in accordance with the Interagency Policy Statement on Funding and Liquidity Risk Management. The liquidity stress test incorporates both short-term and long-term liquidity scenarios in order to identify and to quantify liquidity risk. Management also monitors key liquidity statistics related to items such as wholesale funding gaps, borrowings capacity, and available unpledged collateral, as well as various liquidity ratios.
In the event short-term liquidity needs exceed available cash, the Bank has access to a line of credit at FHLB and the FRB of Kansas City's discount window. Per FHLB's lending guidelines, total FHLB borrowings cannot exceed 40% of regulatory total assets without the pre-approval of FHLB senior management. In July 2018, the president of FHLB approved an increase, through July 2019, in the Bank's borrowing limit to 55% of Bank Call Report total assets. When the leverage strategy is in place, the Bank maintains the resulting excess cash reserves from the FHLB borrowings at the FRB of Kansas City, which can be used to meet any short-term liquidity needs. The amount that can be borrowed from the FRB of Kansas City's discount window is based upon the fair value of securities pledged as collateral and certain other characteristics of those securities, and is used only when other sources of short-term liquidity are unavailable. Management tests the Bank's access to the FRB of Kansas City's discount window annually with a nominal, overnight borrowing.
If management observes a trend in the amount and frequency of line of credit utilization and/or short-term borrowings that is not in conjunction with a planned strategy, such as the leverage strategy, the Bank will likely utilize long-term wholesale borrowing sources such as FHLB advances and/or repurchase agreements to provide long-term, fixed-rate funding. The maturities of these long-term borrowings are generally staggered in order to mitigate the risk of a highly negative cash flow position at maturity. The Bank's internal policy limits total borrowings to 55% of total assets. At September 30, 2018, the Bank had total borrowings, at par, of $2.29 billion, or approximately 24% of total assets.
72
The amount of FHLB advances outstanding at September 30, 2018 was $2.18 billion, of which $875.0 million was scheduled to mature in the next 12 months, including $475.0 million of FHLB advances tied to interest rate swaps. All FHLB borrowings are secured by certain qualifying loans pursuant to a blanket collateral agreement with FHLB. At September 30, 2018, the Bank's ratio of the par value of FHLB borrowings to Call Report total assets was 23%. When the full leverage strategy is in place, FHLB borrowings may be in excess of 40% of the Bank's Call Report total assets, and may be in excess of 40% as long as the Bank continues its leverage strategy and FHLB senior management continues to approve the Bank's borrowing limit being in excess of 40% of Call Report total assets. All or a portion of the FHLB borrowings in conjunction with the leverage strategy could be repaid at any point in time while the strategy is in effect, if necessary.
At September 30, 2018, the Bank had repurchase agreements of $100.0 million, or approximately 1% of total assets, none of which were scheduled to mature in the next 12 months. The Bank may enter into additional repurchase agreements as management deems appropriate, not to exceed 15% of total assets, and subject to the total borrowings limit of 55% as discussed above. The Bank has pledged securities with an estimated fair value of $107.4 million as collateral for repurchase agreements as of September 30, 2018. The securities pledged for the repurchase agreements will be delivered back to the Bank when the repurchase agreements mature.
The Bank could utilize the repayment and maturity of outstanding loans, MBS, and other investments for liquidity needs rather than reinvesting such funds into the related portfolios. At September 30, 2018, the Bank had $670.8 million of securities that were eligible but unused as collateral for borrowing or other liquidity needs.
The Bank has access to other sources of funds for liquidity purposes, such as brokered and public unit deposits. As of September 30, 2018, the Bank's policy allowed for combined brokered and public unit deposits up to 15% of total deposits. At September 30, 2018, the Bank did not have any brokered deposits and public units deposits were approximately 8% of total deposits. Management continuously monitors the wholesale deposit market for opportunities to obtain funds at attractive rates. The Bank had pledged securities with an estimated fair value of $506.1 million as collateral for public unit deposits at September 30, 2018. The securities pledged as collateral for public unit deposits are held under joint custody with FHLB and generally will be released upon deposit maturity.
At September 30, 2018, $1.23 billion of the Bank's certificate of deposit portfolio was scheduled to mature within one year, including $328.4 million of public unit certificates of deposit. Based on our deposit retention experience and our current pricing strategy, we anticipate the majority of the maturing retail certificates of deposit will renew or transfer to other deposit products at the prevailing rate, although no assurance can be given in this regard. We also anticipate the majority of the maturing public unit certificates of deposit will be replaced with similar wholesale funding products.
While scheduled payments from the amortization of loans and MBS and payments on short-term investments are relatively predictable sources of funds, deposit flows, prepayments on loans and MBS, and calls of investment securities are greatly influenced by general interest rates, economic conditions, and competition, and are less predictable sources of funds. To the extent possible, the Bank manages the cash flows of its loan and deposit portfolios by the rates it offers customers.
73
The following table presents the contractual maturities of our loan, MBS, and investment securities portfolios at September 30, 2018, along with associated weighted average yields. Loans and securities which have adjustable interest rates are shown as maturing in the period during which the contract is due. The table does not reflect the effects of possible prepayments or enforcement of due on sale clauses. As of September 30, 2018, the amortized cost of investment securities in our portfolio which are callable or have pre-refunding dates within one year was $194.6 million.
Loans(1) | MBS | Investment Securities | Total | ||||||||||||||||||||||||
Amount | Yield | Amount | Yield | Amount | Yield | Amount | Yield | ||||||||||||||||||||
(Dollars in thousands) | |||||||||||||||||||||||||||
Amounts due: | |||||||||||||||||||||||||||
Within one year | $ | 186,000 | 5.10 | % | $ | 1,368 | 3.84 | % | $ | 58,637 | 1.32 | % | $ | 246,005 | 4.19 | % | |||||||||||
After one year: | |||||||||||||||||||||||||||
Over one to two years | 28,268 | 4.72 | 1,192 | 4.54 | 56,976 | 1.52 | 86,436 | 2.61 | |||||||||||||||||||
Over two to three years | 132,593 | 4.13 | 27,927 | 2.71 | 78,795 | 2.12 | 239,315 | 3.30 | |||||||||||||||||||
Over three to five years | 87,943 | 4.68 | 93,598 | 1.71 | 95,534 | 2.75 | 277,075 | 3.01 | |||||||||||||||||||
Over five to ten years | 728,424 | 3.71 | 387,086 | 2.30 | — | — | 1,115,510 | 3.22 | |||||||||||||||||||
Over ten to fifteen years | 1,249,780 | 3.48 | 211,747 | 2.97 | — | — | 1,461,527 | 3.41 | |||||||||||||||||||
After fifteen years | 5,094,637 | 3.72 | 314,072 | 2.85 | — | — | 5,408,709 | 3.67 | |||||||||||||||||||
Total due after one year | 7,321,645 | 3.70 | 1,035,622 | 2.56 | 231,305 | 2.23 | 8,588,572 | 3.52 | |||||||||||||||||||
$ | 7,507,645 | 3.74 | $ | 1,036,990 | 2.57 | $ | 289,942 | 2.05 | $ | 8,834,577 | 3.54 | ||||||||||||||||
(1) | Demand loans, loans having no stated maturity, and overdraft loans are included in the amounts due within one year. Construction loans are presented based on the estimated term to complete construction. The maturity date for home equity loans that were not acquired from CCB assumes the customer always makes the required minimum payment. For home equity loans acquired from CCB, the maturity date is based on the contractual maturity date. |
74
Limitations on Dividends and Other Capital Distributions
OCC regulations impose restrictions on savings institutions with respect to their ability to make distributions of capital, which include dividends, stock redemptions or repurchases, cash-out mergers and other transactions charged to the capital account. Under FRB and OCC safe harbor regulations, savings institutions generally may make capital distributions during any calendar year equal to earnings of the previous two calendar years and current year-to-date earnings. Savings institutions must also maintain an applicable capital conservation buffer above minimum risk-based capital requirements in order to avoid restrictions on capital distributions, including dividends. A savings institution that is a subsidiary of a savings and loan holding company, such as the Company, that proposes to make a capital distribution must submit written notice to the OCC and FRB 30 days prior to such distribution. The OCC and FRB may object to the distribution during that 30-day period based on safety and soundness or other concerns. Savings institutions that desire to make a larger capital distribution, are under special restrictions, or are not, or would not be, sufficiently capitalized following a proposed capital distribution must obtain regulatory non-objection prior to making such a distribution.
The long-term ability of the Company to pay dividends to its stockholders is based primarily upon the ability of the Bank to make capital distributions to the Company. So long as the Bank remains well capitalized after each capital distribution, operates in a safe and sound manner, and maintains an applicable capital conservation buffer above its minimum risk-based capital requirements, it is management's belief that the OCC and FRB will continue to allow the Bank to distribute its earnings to the Company, although no assurance can be given in this regard.
Capital
Consistent with our goal to operate a sound and profitable financial organization, we actively seek to maintain a well-capitalized status for the Bank per the regulatory framework for prompt corrective action. As of September 30, 2018, the Bank and Company exceeded all regulatory capital requirements. See "Part II, Item 8. Financial Statements and Supplementary Data – Notes to Consolidated Financial Statements – Note 14. Regulatory Capital Requirements" for additional information related to regulatory capital.
The following table presents a reconciliation of equity under GAAP to regulatory capital amounts, as of September 30, 2018, for the Bank and the Company (dollars in thousands):
Bank | Company | ||||||
Total equity as reported under GAAP | $ | 1,221,706 | $ | 1,391,622 | |||
AOCI | (4,340 | ) | (4,340 | ) | |||
Goodwill and other intangibles, net of deferred tax liabilities | (15,240 | ) | (15,240 | ) | |||
Additional tier 1 capital - trust preferred securities | — | 9,750 | |||||
Total tier 1 capital | 1,202,126 | 1,381,792 | |||||
ACL | 8,463 | 8,463 | |||||
Total capital | $ | 1,210,589 | $ | 1,390,255 | |||
75
Off-Balance Sheet Arrangements, Commitments and Contractual Obligations
The following table summarizes our contractual obligations, along with associated weighted average contractual rates as of September 30, 2018.
Maturity Range | |||||||||||||||||||
Less than | 1 to 3 | 3 to 5 | More than | ||||||||||||||||
Total | 1 year | years | years | 5 years | |||||||||||||||
(Dollars in thousands) | |||||||||||||||||||
Operating leases | $ | 6,462 | $ | 1,364 | $ | 2,008 | $ | 1,517 | $ | 1,573 | |||||||||
Certificates of deposit | $ | 2,937,057 | $ | 1,229,859 | $ | 1,185,216 | $ | 520,840 | $ | 1,142 | |||||||||
Rate | 1.80 | % | 1.55 | % | 1.91 | % | 2.13 | % | 2.05 | % | |||||||||
FHLB advances | $ | 2,075,000 | $ | 875,000 | $ | 900,000 | $ | 300,000 | $ | — | |||||||||
Rate | 2.07 | % | 1.96 | % | 2.16 | % | 2.09 | % | — | % | |||||||||
Repurchase agreements | $ | 100,000 | $ | — | $ | 100,000 | $ | — | $ | — | |||||||||
Rate | 2.53 | % | — | % | 2.53 | % | — | % | — | % | |||||||||
As part of the acquisition of CCB, the Company acquired $10.1 million of junior subordinated debentures. Of the $10.1 million, $6.2 million bear interest at 10.6% with a maturity date of September 7, 2030 and $3.9 million bear interest at three-month LIBOR plus 3.45% (5.82% at September 30, 2018) with a maturity date of June 26, 2032. The Company intends to redeem the junior subordinated debentures during fiscal year 2019.
The Company is a party to financial instruments with off-balance-sheet risk in the normal course of business to meet the financing needs of customers. These financial instruments consist primarily of commitments to originate, purchase, participate in, or fund loans and lines of credit, along with standby letters of credit. Standby letters of credit generally are contingent upon the failure of the customer to perform according to the terms of an underlying contract with a third party. The credit risks associated with these off-balance-sheet commitments are essentially the same as that involved with extending loans to customers and are subject to normal credit policies. The contractual amounts of these off-balance sheet financial instruments as of September 30, 2018 were as follows (dollars in thousands):
Commitments to originate and purchase/participate in loans | $ | 204,376 | |
Commitments to fund undisbursed portions of loans | 237,464 | ||
Commitments to fund unused lines of credit | 246,102 | ||
Standby letters of credit | 1,153 | ||
Total | $ | 689,095 | |
It is expected that some of the commitments will expire unfunded; therefore, the amounts reflected in the table above are not necessarily indicative of future liquidity requirements. Additionally, the Bank is not obligated to honor commitments to fund unused lines of credit if a customer is delinquent or otherwise in violation of the loan agreement.
The Company has investments in several low income housing partnerships. These partnerships supply funds for the construction and operation of apartment complexes that provide affordable housing to that segment of the population with lower family income. If these developments successfully attract a specified percentage of residents falling in that lower income range, federal income tax credits are made available to the partners. The tax credits are normally recognized over ten years, and they play an important part in the anticipated yield from these investments. In order to continue receiving the tax credits each year over the life of the partnership, the low-income residency targets must be maintained. Under the terms of the partnership agreements, the Company has a commitment to fund a specified amount that will be due in installments over the life of the agreements. The
76
majority of the commitments at September 30, 2018 are projected to be funded through the end of calendar year 2021. At September 30, 2018, the investments totaled $74.5 million and are included in other assets in the consolidated balance sheet. Unfunded commitments, which are recorded as liabilities, totaled $34.0 million at September 30, 2018.
We anticipate we will continue to have sufficient funds, through repayments and maturities of loans and securities, deposits and borrowings, to meet our current commitments.
Contingencies
In the normal course of business, the Company and its subsidiary are named defendants in various lawsuits and counter claims. In the opinion of management, after consultation with legal counsel, none of the currently pending suits are expected to have a materially adverse effect on the Company's consolidated financial statements for the year ended September 30, 2018, or future periods.
Item 7A. Quantitative and Qualitative Disclosures About Market Risk
Asset and Liability Management and Market Risk
The rates of interest the Bank earns on its assets and pays on its liabilities are generally established contractually for a period of time. Fluctuations in interest rates have a significant impact not only upon our net income, but also upon the cash flows and market values of our assets and liabilities. Our results of operations, like those of other financial institutions, are impacted by changes in interest rates and the interest rate sensitivity of our interest-earning assets and interest-bearing liabilities. Risk associated with changes in interest rates on the earnings of the Bank and the market value of its financial assets and liabilities is known as interest rate risk. Interest rate risk is our most significant market risk, and our ability to adapt to changes in interest rates is known as interest rate risk management.
The general objective of our interest rate risk management program is to determine and manage an appropriate level of interest rate risk while maximizing net interest income in a manner consistent with our policy to manage, to the extent practicable, the exposure of net interest income to changes in market interest rates. The Board of Directors and ALCO regularly review the Bank's interest rate risk exposure by forecasting the impact of hypothetical, alternative interest rate environments on net interest income and the market value of portfolio equity ("MVPE") at various dates. The MVPE is defined as the net of the present value of cash flows from existing assets, liabilities, and off-balance sheet instruments. The present values are determined based upon market conditions as of the date of the analysis, as well as in alternative interest rate environments, providing potential changes in the MVPE under those alternative interest rate environments. Net interest income is projected in the same alternative interest rate environments with both a static balance sheet and management strategies considered. The MVPE and net interest income analyses are also conducted to estimate our sensitivity to rates for future time horizons based upon market conditions as of the date of the analysis. In addition to the interest rate environments presented below, management also reviews the impact of non-parallel rate shock scenarios on a quarterly basis. These scenarios consist of flattening and steepening the yield curve by changing short-term and long-term interest rates independent of each other, and simulating cash flows and determining valuations as a result of these hypothetical changes in interest rates to identify rate environments that pose the greatest risk to the Bank. This analysis helps management quantify the Bank's exposure to changes in the shape of the yield curve.
The ability to maximize net interest income is dependent largely upon the achievement of a positive interest rate spread that can be sustained despite fluctuations in prevailing interest rates. The asset and liability repricing gap is a measure of the difference between the amount of interest-earning assets and interest-bearing liabilities which either reprice or mature within a given period of time. The difference provides an indication of the extent to which an institution's interest rate spread will be affected by changes in interest rates. A gap is considered positive when the amount of interest-earning assets exceeds the amount of interest-bearing liabilities maturing or repricing during the same period. A gap is considered negative when the amount of interest-bearing liabilities exceeds the amount of interest-earning assets maturing or repricing during the same period. Generally, during a period of rising interest rates, a negative gap within shorter repricing periods adversely affects net interest income, while a positive gap within shorter repricing periods positively affects net interest income. During a period of falling interest rates, the opposite would generally be true.
77
The shape of the yield curve also has an impact on our net interest income and, therefore, the Bank's net interest margin. Historically, the Bank has benefited from a steeper yield curve as the Bank's mortgage loans are generally priced off of long-term rates while deposits are priced off of short-term rates. A steeper yield curve (one with a greater difference between short-term rates and long-term rates) allows the Bank to receive a higher rate of interest on its new mortgage-related assets relative to the rate paid for the funding of those assets, which generally results in a higher net interest margin. As the yield curve flattens, the spread between rates received on assets and paid on liabilities becomes compressed, which generally leads to a decrease in net interest margin.
General assumptions used by management to evaluate the sensitivity of our financial performance to changes in interest rates presented in the tables below are utilized in, and set forth under, the gap table and related notes. Although management finds these assumptions reasonable, the interest rate sensitivity of our assets and liabilities and the estimated effects of changes in interest rates on our net interest income and MVPE indicated in the below tables could vary substantially if different assumptions were used or actual experience differs from these assumptions. To illustrate this point, the projected cumulative excess (deficiency) of interest-earning assets over interest-bearing liabilities within the next 12 months as a percent of total assets ("one-year gap") is also provided for an up 200 basis point scenario, as of September 30, 2018.
Qualitative Disclosure about Market Risk
At September 30, 2018, the Bank's gap between the amount of interest-earning assets and interest-bearing liabilities projected to reprice within one year was $(14.9) million, or (0.16)% of total assets, compared to $641.6 million, or 6.98% of total assets, at September 30, 2017. The decrease in the one-year gap amount was due primarily to a decrease in cash flows from mortgage-related assets, compared to September 30, 2017 as a result of higher interest rates. As interest rates rise, borrowers have less economic incentive to refinance their mortgages and agency debt issuers have less economic incentive or opportunity to exercise their call options in order to issue new debt at lower interest rates, resulting in lower projected cash flows on these assets. In addition, the gap analysis at September 30, 2018 accounted for the adjustable-rate FHLB advances with interest rate swaps differently than at September 30, 2017. The interest rate swaps effectively remove the repricing associated with the adjustable-rate FHLB advances underlying the swaps during the life of the interest rate swaps. In the September 30, 2018 gap analysis, the repricing for these liabilities was projected to occur at the maturity of each interest rate swap, which is consistent with the behavior of a fixed-rate borrowing. In the September 30, 2017 gap analysis, the adjustable-rate FHLB advances tied to interest rate swaps were repricing based on the term of the underlying advance, not the maturity date of the related interest rate swap.
The majority of interest-earning assets anticipated to reprice in the coming year are repayments and prepayments on one- to four-family loans and MBS, both of which include the option to prepay without a fee being paid by the contract holder. The amount of interest-bearing liabilities expected to reprice in a given period is not typically impacted significantly by changes in interest rates because the Bank's borrowings and certificate of deposit portfolios have contractual maturities and generally cannot be terminated early without a prepayment penalty. If interest rates were to increase 200 basis points, as of September 30, 2018, the Bank's one-year gap is projected to be $(394.8) million, or (4.18)% of total assets. This compares to a one-year gap of $81.3 million, or 0.88% of total assets, if interest rates were to have increased 200 basis points as of September 30, 2017. The decrease in the gap compared to no change in rates is due to lower anticipated cash flows in the higher rate environment.
During the current fiscal year, loan repayments totaled $1.10 billion and cash flows from the securities portfolio totaled $407.3 million. The asset cash flows of $1.51 billion were reinvested into new assets at current market interest rates. Total cash flows from fixed-rate liabilities that matured and repriced into current market interest rates during the current fiscal year were approximately $1.88 billion, including $575.0 million of term borrowings. These offsetting cash flows allow the Bank to manage its interest rate risk and gap position more precisely than if the Bank did not have offsetting cash flows due to its mix of assets or maturity structure of liabilities.
Other strategies include managing the Bank's wholesale assets and liabilities. The Bank primarily uses long-term fixed-rate borrowings with no embedded options to lengthen the average life of the Bank's liabilities. The fixed-rate characteristics of these borrowings lock-in the cost until maturity and thus decrease the amount of liabilities repricing as interest rates move higher compared to funding with lower-cost short-term borrowings. These borrowings are laddered in order to prevent large amounts of liabilities repricing in any one period. The WAL of the Bank's term borrowings as of September 30, 2018 was 1.7 years. However, including the impact of interest rate swaps related to $475.0 million of adjustable-rate FHLB advances, the
78
WAL of the Bank's term borrowings as of September 30, 2018 was 2.8 years. The interest rate swaps effectively convert the adjustable-rate borrowings into long-term, fixed-rate liabilities.
The Bank uses the securities portfolio to shorten the average life of the Bank's assets. Purchases in the securities portfolio over the past few years have primarily been focused on callable agency debentures with maturities no longer than five years, shorter duration MBS, and adjustable-rate MBS. These securities have a shorter average life and provide a steady source of cash flow that can be reinvested as interest rates rise into higher-yielding assets. The WAL of the Bank's securities portfolio as of September 30, 2018 was 2.9 years.
In addition to the wholesale strategies, the Bank has sought to increase non-maturity deposits and long-term certificates of deposit. Non-maturity deposits are expected to reduce the risk of higher interest rates because their interest rates are not expected to increase significantly as market interest rates rise. Specifically, checking accounts and savings accounts have had minimal interest rate fluctuations throughout historical interest rate cycles, though no assurance can be given that this will be the case in future interest rate cycles. The balances and rates of these accounts have historically tended to remain very stable over time, giving them the characteristic of long-term liabilities. The Bank uses historical data pertaining to these accounts to estimate their future balances. At September 30, 2018 the WAL of the Bank's non-maturity deposits was 12.2 years.
Over the last few years, the Bank has priced long-term certificates of deposit more aggressively than short-term certificates of deposit with the goal of giving customers incentive to move funds into longer-term certificates of deposit when interest rates were lower. Long-term certificates of deposit reduce the amount of liabilities repricing as interest rates rise in a given time period.
Gap Table. The following gap table summarizes the anticipated maturities or repricing periods of the Bank's interest-earning assets and interest-bearing liabilities based on the information and assumptions set forth in the notes below. Cash flow projections for mortgage-related assets are calculated based in part on prepayment assumptions at current and projected interest rates. Prepayment projections are subjective in nature, involve uncertainties and assumptions and, therefore, cannot be determined with a high degree of accuracy. Although certain assets and liabilities may have similar maturities or periods to repricing, they may react differently to changes in market interest rates. Assumptions may not reflect how actual yields and costs respond to market interest rate changes. The interest rates on certain types of assets and liabilities may fluctuate in advance of changes in market interest rates, while interest rates on other types of assets and liabilities may lag behind changes in market interest rates. Certain assets, such as adjustable-rate loans, have features that restrict changes in interest rates on a short-term basis and over the life of the asset. In the event of a change in interest rates, prepayment and early withdrawal levels would likely deviate significantly from those assumed in calculating the gap table below. A positive gap indicates more cash flows from assets are expected to reprice than cash flows from liabilities and would indicate, in a rising rate environment, that earnings should increase. A negative gap indicates more cash flows from liabilities are expected to reprice than cash flows from assets and would indicate, in a rising rate environment, that earnings should decrease. For additional information regarding the impact of changes in interest rates, see the following Change in Net Interest Income and Change in MVPE discussions and tables.
79
More Than | More Than | ||||||||||||||||||
Within | One Year to | Three Years | Over | ||||||||||||||||
One Year | Three Years | to Five Years | Five Years | Total | |||||||||||||||
Interest-earning assets: | (Dollars in thousands) | ||||||||||||||||||
Loans receivable(1) | $ | 1,554,585 | $ | 1,867,969 | $ | 1,175,476 | $ | 2,900,512 | $ | 7,498,542 | |||||||||
Securities(2) | 458,837 | 430,978 | 273,023 | 168,044 | 1,330,882 | ||||||||||||||
Other interest-earning assets | 119,580 | — | — | — | 119,580 | ||||||||||||||
Total interest-earning assets | 2,133,002 | 2,298,947 | 1,448,499 | 3,068,556 | 8,949,004 | ||||||||||||||
Interest-bearing liabilities: | |||||||||||||||||||
Non-maturity deposits(3) | 307,342 | 409,124 | 297,968 | 1,789,547 | 2,803,981 | ||||||||||||||
Certificates of deposit | 1,340,388 | 1,076,136 | 519,495 | 1,038 | 2,937,057 | ||||||||||||||
Borrowings(4) | 500,000 | 1,075,000 | 400,000 | 341,285 | 2,316,285 | ||||||||||||||
Total interest-bearing liabilities | 2,147,730 | 2,560,260 | 1,217,463 | 2,131,870 | 8,057,323 | ||||||||||||||
Excess (deficiency) of interest-earning assets over | |||||||||||||||||||
interest-bearing liabilities | $ | (14,728 | ) | $ | (261,313 | ) | $ | 231,036 | $ | 936,686 | $ | 891,681 | |||||||
Cumulative (deficiency) excess of interest-earning assets over | |||||||||||||||||||
interest-bearing liabilities | $ | (14,728 | ) | $ | (276,041 | ) | $ | (45,005 | ) | $ | 891,681 | ||||||||
Cumulative (deficiency) excess of interest-earning assets over interest-bearing | |||||||||||||||||||
liabilities as a percent of total Bank assets at: | |||||||||||||||||||
September 30, 2018 | (0.16 | )% | (2.91 | )% | (0.48 | )% | 9.41 | % | |||||||||||
September 30, 2017 | 6.98 | ||||||||||||||||||
Cumulative one-year gap - interest rates +200 bps at: | |||||||||||||||||||
September 30, 2018 | (4.18 | ) | |||||||||||||||||
September 30, 2017 | 0.88 | ||||||||||||||||||
(1) | Adjustable-rate loans are included in the period in which the rate is next scheduled to adjust or in the period in which repayments are expected to occur, or prepayments are expected to be received, prior to their next rate adjustment, rather than in the period in which the loans are due. Fixed-rate loans are included in the periods in which they are scheduled to be repaid, based on scheduled amortization and prepayment assumptions. Balances are net of undisbursed amounts and deferred fees and exclude loans 90 or more days delinquent or in foreclosure. |
(2) | MBS reflect projected prepayments at amortized cost. Investment securities are presented based on contractual maturities, term to call dates or pre-refunding dates as of September 30, 2018, at amortized cost. |
(3) | Although the Bank's checking, savings, and money market accounts are subject to immediate withdrawal, management considers a substantial amount of these accounts to be core deposits having significantly longer effective maturities. The decay rates (the assumed rates at which the balances of existing accounts decline) used on these accounts is based on assumptions developed from our actual experiences with these accounts. If all of the Bank's checking, savings, and money market accounts had been assumed to be subject to repricing within one year, interest-bearing liabilities which were estimated to mature or reprice within one year would have exceeded interest-earning assets with comparable characteristics by $2.51 billion, for a cumulative one-year gap of (26.6)% of total assets. |
(4) | Borrowings exclude deferred prepayment penalty costs. Included in this line are $475.0 million of FHLB adjustable-rate advances with interest rate swaps. The repricing for these liabilities is projected to occur at the maturity date of each interest rate swap. |
80
Change in Net Interest Income. The Bank's net interest income projections are a reflection of the response to interest rates of the assets and liabilities that are expected to mature or reprice over the next year. Repricing occurs as a result of cash flows that are received or paid on assets or due on liabilities which would be replaced at then current market interest rates or on adjustable-rate products that reset during the next year. The Bank's borrowings and certificate of deposit portfolios have stated maturities and the cash flows related to the Bank's liabilities do not generally fluctuate as a result of changes in interest rates. Cash flows from mortgage-related assets and callable agency debentures can vary significantly as a result of changes in interest rates. As interest rates decrease, borrowers have an economic incentive to lower their cost of debt by refinancing or endorsing their mortgage to a lower interest rate. Similarly, agency debt issuers are more likely to exercise embedded call options for agency securities and issue new securities at a lower interest rate.
For each date presented in the following table, the estimated change in the Bank's net interest income is based on the indicated instantaneous, parallel and permanent change in interest rates is presented. The change in each interest rate environment represents the difference between estimated net interest income in the 0 basis point interest rate environment ("base case," assumes the forward market and product interest rates implied by the yield curve are realized) and the estimated net interest income in each alternative interest rate environment (assumes market and product interest rates have a parallel shift in rates across all maturities by the indicated change in rates). Projected cash flows for each scenario are based upon varying prepayment assumptions to model likely customer behavior changes as market rates change. Estimations of net interest income used in preparing the table below were based upon the assumptions that the total composition of interest-earning assets and interest-bearing liabilities does not change materially and that any repricing of assets or liabilities occurs at anticipated product and market rates for the alternative rate environments as of the dates presented. The estimation of net interest income does not include any projected gains or losses related to the sale of loans or securities, or income derived from non-interest income sources, but does include the use of different prepayment assumptions in the alternative interest rate environments. It is important to consider that estimated changes in net interest income are for a cumulative four-quarter period. These do not reflect the earnings expectations of management.
Change | Net Interest Income At September 30, | |||||||||||||||||||||
(in Basis Points) | 2018 | 2017 | ||||||||||||||||||||
in Interest Rates(1) | Amount ($) | Change ($) | Change (%) | Amount ($) | Change ($) | Change (%) | ||||||||||||||||
(Dollars in thousands) | ||||||||||||||||||||||
-100 bp | $ | 201,434 | $ | 1,221 | 0.61 | % | $ | 181,200 | $ | (6,623 | ) | (3.53 | )% | |||||||||
000 bp | 200,213 | — | — | 187,823 | — | — | ||||||||||||||||
+100 bp | 196,272 | (3,941 | ) | (1.97 | ) | 189,259 | 1,436 | 0.76 | ||||||||||||||
+200 bp | 190,872 | (9,341 | ) | (4.67 | ) | 188,508 | 685 | 0.36 | ||||||||||||||
+300 bp | 184,603 | (15,610 | ) | (7.80 | ) | 186,299 | (1,524 | ) | (0.81 | ) | ||||||||||||
(1) | Assumes an instantaneous, parallel, and permanent change in interest rates at all maturities. |
The net interest income projection was higher in the base case scenario at September 30, 2018 compared to September 30, 2017 due mainly to an increase in earning assets in connection with the acquisition of CCB. The net interest income projections decreased from the base case in all rising rate scenarios at September 30, 2018, while at September 30, 2017 the net interest income projection improved in the +100 and +200 basis point scenarios before decreasing in the +300 basis point scenario. This change is consistent with the decrease in the one-year gap at September 30, 2018 compared to September 30, 2017. The projected decreases in the up rate scenarios was due to a reduction in cash flows from the Bank's mortgage-related assets and callable agency debentures as a result of higher interest rates. At September 30, 2018, as interest rates move higher, liabilities reprice to higher interest rates at a faster pace than assets and have a negative impact on the Bank's net interest income projection. At September 30, 2017, modeled in the +300 basis point scenario, liabilities would reprice to higher interest rates at a faster pace than assets and have a negative impact on the Bank's net interest income projection.
81
Change in MVPE. Changes in the estimated market values of our financial assets and liabilities drive changes in estimates of MVPE. The market value of an asset or liability reflects the present value of all the projected cash flows over its remaining life, discounted at market interest rates. As interest rates rise, generally the market value for both financial assets and liabilities decrease. The opposite is generally true as interest rates fall. The MVPE represents the theoretical market value of capital that is calculated by netting the market value of assets, liabilities, and off-balance sheet instruments. If the market values of financial assets increase at a faster pace than the market values of financial liabilities, or if the market values of financial liabilities decrease at a faster pace than the market values of financial assets, the MVPE will increase. The market value of shorter term-to-maturity financial instruments is less sensitive to changes in interest rates than are longer term-to-maturity financial instruments. Because of this, the market values of our certificates of deposit (which generally have relatively shorter average lives) tend to display less sensitivity to changes in interest rates than do our mortgage-related assets (which generally have relatively longer average lives). The average life expected on our mortgage-related assets varies under different interest rate environments because borrowers have the ability to prepay their mortgage loans. Therefore, as interest rates decrease, the WAL of mortgage-related assets decrease as well. As interest rates increase, the WAL would be expected to increase, as well as increasing the sensitivity of these assets in higher rate environments.
The following table sets forth the estimated change in the MVPE for each date presented based on the indicated instantaneous, parallel, and permanent change in interest rates. The change in each interest rate environment represents the difference between the MVPE in the base case (assumes the forward market interest rates implied by the yield curve are realized) and the MVPE in each alternative interest rate environment (assumes market interest rates have a parallel shift in rates). Projected cash flows for each scenario are based upon varying prepayment assumptions to model likely customer behavior as market rates change. The estimations of the MVPE used in preparing the table below were based upon the assumptions that the total composition of interest-earning assets and interest-bearing liabilities does not change, that any repricing of assets or liabilities occurs at current product or market rates for the alternative rate environments as of the dates presented, and that different prepayment rates were used in each alternative interest rate environment. The estimated MVPE results from the valuation of cash flows from financial assets and liabilities over the anticipated lives of each for each interest rate environment. The table below presents the effects of the changes in interest rates on our assets and liabilities as they mature, repay, or reprice, as shown by the change in the MVPE for alternative interest rates.
Change | Market Value of Portfolio Equity At September 30, | |||||||||||||||||||||
(in Basis Points) | 2018 | 2017 | ||||||||||||||||||||
in Interest Rates(1) | Amount ($) | Change ($) | Change (%) | Amount ($) | Change ($) | Change (%) | ||||||||||||||||
(Dollars in thousands) | ||||||||||||||||||||||
-100 bp | $ | 1,498,631 | $ | 53,683 | 3.72 | % | $ | 1,446,537 | $ | (13,891 | ) | (0.95 | )% | |||||||||
000 bp | 1,444,948 | — | — | 1,460,428 | — | — | ||||||||||||||||
+100 bp | 1,281,910 | (163,038 | ) | (11.28 | ) | 1,352,558 | (107,870 | ) | (7.39 | ) | ||||||||||||
+200 bp | 1,087,644 | (357,304 | ) | (24.73 | ) | 1,173,891 | (286,537 | ) | (19.62 | ) | ||||||||||||
+300 bp | 888,611 | (556,337 | ) | (38.50 | ) | 969,747 | (490,681 | ) | (33.60 | ) | ||||||||||||
(1) | Assumes an instantaneous, parallel, and permanent change in interest rates at all maturities. |
The percentage change in the Bank's MVPE at September 30, 2018 was more adversely impacted in the increasing interest rate scenarios than at September 30, 2017. This was due primarily to an increase in interest rates between the two periods. As long-term interest rates increase, repayments on mortgage-related assets are more likely to decrease and only be realized through significant changes in borrowers' lives such as divorce, death, job-related relocations, or other events as there is less economic incentive for borrowers to prepay their debt, resulting in an increase in the average life of mortgage-related assets. Similarly, call projections for the Bank's callable agency debentures decrease as interest rates rise, which results in cash flows related to these assets moving closer to the contractual maturity dates. The higher expected average lives of these assets, relative to the assumptions in the base case interest rate environment, increases the sensitivity of their market value to changes in interest rates. In addition, the WAL of the Bank's non-maturity deposits has decreased since September 30, 2017 due to an increase in interest rates. When the difference between deposit account interest rates and market interest rates increases, the Bank's deposit model assumes a higher level of deposit balance runoff as depositors are more likely to move funds from deposit accounts into higher yielding assets. The shorter expected average lives of these liabilities compared to the prior year reduces the sensitivity of their market value to changes in interest rates.
82
The following table presents the weighted average yields/rates and WALs (in years), after applying prepayment, call assumptions, and decay rates for our interest-earning assets and interest-bearing liabilities as of September 30, 2018. Yields presented for interest-earning assets include the amortization of fees, costs, premiums and discounts, which are considered adjustments to the yield. The interest rate presented for term borrowings is the effective rate, which includes the impact of interest rate swaps and the amortization of deferred prepayment penalties resulting from FHLB advances previously prepaid. The WAL presented for term borrowings includes the effect of interest rate swaps. The maturity and repricing terms presented for one- to four-family loans represent the contractual terms of the loan.
Amount | Yield/Rate | WAL | % of Category | % of Total | |||||||||||
(Dollars in thousands) | |||||||||||||||
Investment securities | $ | 289,942 | 2.05 | % | 1.6 | 21.9 | % | 3.2 | % | ||||||
MBS - fixed | 729,808 | 2.43 | 3.4 | 55.0 | 8.0 | ||||||||||
MBS - adjustable | 307,182 | 2.89 | 2.9 | 23.1 | 3.4 | ||||||||||
Total securities | 1,326,932 | 2.45 | 2.9 | 100.0 | % | 14.6 | |||||||||
Loans receivable: | |||||||||||||||
Fixed-rate one- to four-family: | |||||||||||||||
<= 15 years | 1,153,971 | 3.14 | 4.2 | 15.4 | % | 12.7 | |||||||||
> 15 years | 4,495,405 | 3.86 | 6.8 | 59.9 | 49.5 | ||||||||||
Fixed-rate commercial | 356,295 | 4.45 | 3.6 | 4.7 | 4.0 | ||||||||||
All other fixed-rate loans | 45,700 | 5.43 | 3.7 | 0.6 | 0.5 | ||||||||||
Total fixed-rate loans | 6,051,371 | 3.77 | 6.1 | 80.6 | 66.7 | ||||||||||
Adjustable-rate one- to four-family: | |||||||||||||||
<= 36 months | 249,331 | 2.15 | 3.2 | 3.3 | 2.7 | ||||||||||
> 36 months | 866,579 | 3.29 | 2.8 | 11.6 | 9.6 | ||||||||||
Adjustable-rate commercial | 213,315 | 5.18 | 7.7 | 2.8 | 2.4 | ||||||||||
All other adjustable-rate loans | 127,049 | 5.65 | 1.5 | 1.7 | 1.4 | ||||||||||
Total adjustable-rate loans | 1,456,274 | 3.58 | 3.5 | 19.4 | 16.1 | ||||||||||
Total loans receivable | 7,507,645 | 3.74 | 5.6 | 100.0 | % | 82.8 | |||||||||
FHLB stock | 99,726 | 7.22 | 1.7 | 1.1 | |||||||||||
Cash and cash equivalents | 139,055 | 2.19 | — | 1.5 | |||||||||||
Total interest-earning assets | $ | 9,073,358 | 3.57 | 5.1 | 100.0 | % | |||||||||
Non-maturity deposits | $ | 2,666,297 | 0.25 | 12.2 | 47.6 | % | 33.8 | % | |||||||
Retail/business certificates of deposit | 2,529,368 | 1.79 | 1.7 | 45.1 | 32.0 | ||||||||||
Public unit certificates of deposit | 407,689 | 1.89 | 0.7 | 7.3 | 5.2 | ||||||||||
Total deposits | 5,603,354 | 1.06 | 6.7 | 100.0 | % | 71.0 | |||||||||
Term borrowings | 2,185,052 | 2.17 | 2.9 | 95.6 | % | 27.7 | |||||||||
FHLB line of credit | 100,000 | 2.35 | — | 4.4 | 1.3 | ||||||||||
Total borrowings | 2,285,052 | 2.18 | 2.7 | 100.0 | % | 29.0 | |||||||||
Total interest-bearing liabilities | $ | 7,888,406 | 1.39 | 5.5 | 100.0 | % | |||||||||
83
Item 8. Financial Statements and Supplementary Data
REPORT OF INDEPENDENT REGISTERED PUBLIC ACCOUNTING FIRM
To the stockholders and the Board of Directors of Capitol Federal Financial, Inc. and subsidiary
Opinion on Internal Control over Financial Reporting
We have audited the internal control over financial reporting of Capitol Federal Financial, Inc. and subsidiary (the "Company") as of September 30, 2018, based on criteria established in Internal Control - Integrated Framework (2013) issued by the Committee of Sponsoring Organizations of the Treadway Commission (COSO). In our opinion, the Company maintained, in all material respects, effective internal control over financial reporting as of September 30, 2018, based on criteria established in Internal Control - Integrated Framework (2013) issued by COSO.
We have also audited, in accordance with the standards of the Public Company Accounting Oversight Board (United States) (PCAOB), the consolidated financial statements as of and for the year ended September 30, 2018, of the Company and our report dated November 29, 2018, expressed an unqualified opinion on those consolidated financial statements.
As described in Management's Report on Internal Control Over Financial Reporting, management excluded from its assessment the internal control over financial reporting at Capital City Bancshares, Inc., which was acquired on August 31, 2018 and whose financial statements constitute approximately 4% of loans receivable, net, 6% of deposits, 5% of total assets, 1% of net interest income and 0% of net income of the consolidated financial statement amounts as of and for the year ended September 30, 2018. Accordingly, our audit did not include the internal control over financial reporting at Capital City Bancshares, Inc.
Basis for Opinion
The Company's management is responsible for maintaining effective internal control over financial reporting and for its assessment of the effectiveness of internal control over financial reporting, included in the accompanying Management's Report on Internal Control Over Financial Reporting. Our responsibility is to express an opinion on the Company's internal control over financial reporting based on our audit. We are a public accounting firm registered with the PCAOB and are required to be independent with respect to the Company in accordance with the U.S. federal securities laws and the applicable rules and regulations of the Securities and Exchange Commission and the PCAOB.
We conducted our audit in accordance with the standards of the PCAOB. Those standards require that we plan and perform the audit to obtain reasonable assurance about whether effective internal control over financial reporting was maintained in all material respects. Our audit included obtaining an understanding of internal control over financial reporting, assessing the risk that a material weakness exists, testing and evaluating the design and operating effectiveness of internal control based on the assessed risk, and performing such other procedures as we considered necessary in the circumstances. We believe that our audit provides a reasonable basis for our opinion.
Definition and Limitations of Internal Control over Financial Reporting
A company's internal control over financial reporting is a process designed to provide reasonable assurance regarding the reliability of financial reporting and the preparation of financial statements for external purposes in accordance with generally accepted accounting principles. A company's internal control over financial reporting includes those policies and procedures that (1) pertain to the maintenance of records that, in reasonable detail, accurately and fairly reflect the transactions and dispositions of the assets of the company; (2) provide reasonable assurance that transactions are recorded as necessary to permit preparation of financial statements in accordance with generally accepted accounting principles, and that receipts and expenditures of the company are being made only in accordance with authorizations of management and directors of the company; and (3) provide reasonable assurance regarding prevention or timely detection of unauthorized acquisition, use, or disposition of the company's assets that could have a material effect on the financial statements.
Because of its inherent limitations, internal control over financial reporting may not prevent or detect misstatements. Also, projections of any evaluation of effectiveness to future periods are subject to the risk that controls may become inadequate because of changes in conditions, or that the degree of compliance with the policies or procedures may deteriorate.

Kansas City, Missouri
November 29, 2018
84
REPORT OF INDEPENDENT REGISTERED PUBLIC ACCOUNTING FIRM
To the stockholders and the Board of Directors of Capitol Federal Financial, Inc. and subsidiary
Opinion on the Financial Statements
We have audited the accompanying consolidated balance sheets of Capitol Federal Financial, Inc. and subsidiary (the "Company") as of September 30, 2018 and 2017, the related consolidated statements of income, comprehensive income, stockholders' equity, and cash flows, for each of the three years in the period ended September 30, 2018, and the related notes (collectively referred to as the "financial statements"). In our opinion, the financial statements present fairly, in all material respects, the financial position of the Company as of September 30, 2018 and 2017, and the results of its operations and its cash flows for each of the three years in the period ended September 30, 2018 in conformity with accounting principles generally accepted in the United States of America.
We have also audited, in accordance with the standards of the Public Company Accounting Oversight Board (United States) (PCAOB), the Company's internal control over financial reporting as of September 30, 2018, based on criteria established in Internal Control - Integrated Framework (2013) issued by the Committee of Sponsoring Organizations of the Treadway Commission and our report dated November 29, 2018, expressed an unqualified opinion on the Company's internal control over financial reporting.
Basis for Opinion
These financial statements are the responsibility of the Company's management. Our responsibility is to express an opinion on the Company's financial statements based on our audits. We are a public accounting firm registered with the PCAOB and are required to be independent with respect to the Company in accordance with the U.S. federal securities laws and the applicable rules and regulations of the Securities and Exchange Commission and the PCAOB.
We conducted our audits in accordance with the standards of the PCAOB. Those standards require that we plan and perform the audit to obtain reasonable assurance about whether the financial statements are free of material misstatement, whether due to error or fraud. Our audits included performing procedures to assess the risks of material misstatement of the financial statements, whether due to error or fraud, and performing procedures that respond to those risks. Such procedures included examining, on a test basis, evidence regarding the amounts and disclosures in the financial statements. Our audits also included evaluating the accounting principles used and significant estimates made by management, as well as evaluating the overall presentation of the financial statements. We believe that our audits provide a reasonable basis for our opinion.
Kansas City, Missouri
November 29, 2018
We have served as the Company's auditor since 1974.
85
CAPITOL FEDERAL FINANCIAL, INC. AND SUBSIDIARY | |||||||
CONSOLIDATED BALANCE SHEETS | |||||||
SEPTEMBER 30, 2018 and 2017 (Dollars in thousands, except per share amounts) | |||||||
2018 | 2017 | ||||||
ASSETS: | |||||||
Cash and cash equivalents (includes interest-earning deposits of $122,733 and $340,748) | $ | 139,055 | $ | 351,659 | |||
Securities: | |||||||
Available-for-sale ("AFS"), at estimated fair value (amortized cost of $718,564 and $410,541) | 714,614 | 415,831 | |||||
Held-to-maturity ("HTM"), at amortized cost (estimated fair value of $601,071 and $833,009) | 612,318 | 827,738 | |||||
Loans receivable, net (allowance for credit losses ("ACL") of $8,463 and $8,398) | 7,514,485 | 7,195,071 | |||||
Federal Home Loan Bank Topeka ("FHLB") stock, at cost | 99,726 | 100,954 | |||||
Premises and equipment, net | 96,005 | 84,818 | |||||
Income taxes receivable, net | 2,177 | — | |||||
Other assets | 271,167 | 216,845 | |||||
TOTAL ASSETS | $ | 9,449,547 | $ | 9,192,916 | |||
LIABILITIES: | |||||||
Deposits | $ | 5,603,354 | $ | 5,309,868 | |||
FHLB borrowings | 2,174,981 | 2,173,808 | |||||
Other borrowings | 110,052 | 200,000 | |||||
Advance payments by borrowers for taxes and insurance | 65,264 | 63,749 | |||||
Income taxes payable, net | — | 530 | |||||
Deferred income tax liabilities, net | 21,253 | 24,458 | |||||
Accounts payable and accrued expenses | 83,021 | 52,190 | |||||
Total liabilities | 8,057,925 | 7,824,603 | |||||
STOCKHOLDERS' EQUITY: | |||||||
Preferred stock, $.01 par value; 100,000,000 shares authorized, no shares issued or outstanding | — | — | |||||
Common stock, $.01 par value; 1,400,000,000 shares authorized, 141,225,516 and 138,223,835 | |||||||
shares issued and outstanding as of September 30, 2018 and 2017, respectively | 1,412 | 1,382 | |||||
Additional paid-in capital | 1,207,644 | 1,167,368 | |||||
Unearned compensation, Employee Stock Ownership Plan ("ESOP") | (36,343 | ) | (37,995 | ) | |||
Retained earnings | 214,569 | 234,640 | |||||
Accumulated other comprehensive income ("AOCI"), net of tax | 4,340 | 2,918 | |||||
Total stockholders' equity | 1,391,622 | 1,368,313 | |||||
TOTAL LIABILITIES AND STOCKHOLDERS' EQUITY | $ | 9,449,547 | $ | 9,192,916 | |||
See accompanying notes to consolidated financial statements. | |||||||
86
CAPITOL FEDERAL FINANCIAL, INC. AND SUBSIDIARY | |||||||||||
CONSOLIDATED STATEMENTS OF INCOME | |||||||||||
YEARS ENDED SEPTEMBER 30, 2018, 2017, and 2016 (Dollars in thousands, except per share amounts) | |||||||||||
2018 | 2017 | 2016 | |||||||||
INTEREST AND DIVIDEND INCOME: | |||||||||||
Loans receivable | $ | 260,198 | $ | 253,393 | $ | 243,311 | |||||
Cash and cash equivalents | 23,443 | 19,389 | 9,831 | ||||||||
Mortgage-backed securities ("MBS") | 22,619 | 23,809 | 29,794 | ||||||||
FHLB stock | 10,962 | 12,233 | 12,252 | ||||||||
Investment securities | 4,670 | 4,362 | 5,925 | ||||||||
Total interest and dividend income | 321,892 | 313,186 | 301,113 | ||||||||
INTEREST EXPENSE: | |||||||||||
FHLB borrowings | 67,120 | 68,871 | 65,091 | ||||||||
Deposits | 52,625 | 42,968 | 37,859 | ||||||||
Other borrowings | 3,374 | 5,965 | 5,981 | ||||||||
Total interest expense | 123,119 | 117,804 | 108,931 | ||||||||
NET INTEREST INCOME | 198,773 | 195,382 | 192,182 | ||||||||
PROVISION FOR CREDIT LOSSES | — | — | (750 | ) | |||||||
NET INTEREST INCOME AFTER PROVISION FOR CREDIT LOSSES | 198,773 | 195,382 | 192,932 | ||||||||
NON-INTEREST INCOME: | |||||||||||
Deposit service fees | 15,636 | 15,053 | 14,835 | ||||||||
Income from bank-owned life insurance ("BOLI") | 1,875 | 2,233 | 3,420 | ||||||||
Other non-interest income | 4,524 | 4,910 | 5,057 | ||||||||
Total non-interest income | 22,035 | 22,196 | 23,312 | ||||||||
NON-INTEREST EXPENSE: | |||||||||||
Salaries and employee benefits | 46,563 | 43,437 | 42,378 | ||||||||
Information technology and related expense | 13,999 | 11,282 | 10,540 | ||||||||
Occupancy, net | 11,455 | 10,814 | 10,576 | ||||||||
Regulatory and outside services | 5,709 | 5,821 | 5,645 | ||||||||
Deposit and loan transaction costs | 5,621 | 5,284 | 5,585 | ||||||||
Advertising and promotional | 5,034 | 4,673 | 4,609 | ||||||||
Federal insurance premium | 3,277 | 3,539 | 5,076 | ||||||||
Office supplies and related expense | 1,888 | 1,981 | 2,640 | ||||||||
Low income housing partnerships | — | — | 3,872 | ||||||||
Other non-interest expense | 3,356 | 2,827 | 3,384 | ||||||||
Total non-interest expense | 96,902 | 89,658 | 94,305 | ||||||||
INCOME BEFORE INCOME TAX EXPENSE | 123,906 | 127,920 | 121,939 | ||||||||
INCOME TAX EXPENSE | 24,979 | 43,783 | 38,445 | ||||||||
NET INCOME | $ | 98,927 | $ | 84,137 | $ | 83,494 | |||||
Basic earnings per share ("EPS") | $ | 0.73 | $ | 0.63 | $ | 0.63 | |||||
Diluted EPS | $ | 0.73 | $ | 0.63 | $ | 0.63 | |||||
Dividends declared per share | $ | 0.88 | $ | 0.88 | $ | 0.84 | |||||
See accompanying notes to consolidated financial statements. | |||||||||||
87
CAPITOL FEDERAL FINANCIAL, INC. AND SUBSIDIARY | |||||||||||
CONSOLIDATED STATEMENTS OF COMPREHENSIVE INCOME | |||||||||||
YEARS ENDED SEPTEMBER 30, 2018, 2017, and 2016 (Dollars in thousands) | |||||||||||
2018 | 2017 | 2016 | |||||||||
Net income | $ | 98,927 | $ | 84,137 | $ | 83,494 | |||||
Other comprehensive income (loss), net of tax: | |||||||||||
Changes in unrealized gains (losses) on AFS securities, | |||||||||||
net of taxes of $2,499, $1,595, and $1,494 | (6,741 | ) | (2,625 | ) | (2,459 | ) | |||||
Changes in unrealized gains (losses) on cash flow hedges, | |||||||||||
net of taxes of $(2,785), $226, and $0 | 7,496 | (372 | ) | — | |||||||
Comprehensive income | $ | 99,682 | $ | 81,140 | $ | 81,035 | |||||
See accompanying notes to consolidated financial statements. | |||||||||||
88
CAPITOL FEDERAL FINANCIAL, INC. AND SUBSIDIARY | |||||||||||||||||||||||
CONSOLIDATED STATEMENTS OF STOCKHOLDERS' EQUITY | |||||||||||||||||||||||
YEARS ENDED SEPTEMBER 30, 2018, 2017, and 2016 (Dollars in thousands, except per share amounts) | |||||||||||||||||||||||
Additional | Unearned | Total | |||||||||||||||||||||
Common | Paid-In | Compensation | Retained | Stockholders' | |||||||||||||||||||
Stock | Capital | ESOP | Earnings | AOCI | Equity | ||||||||||||||||||
Balance at October 1, 2015 | $ | 1,371 | $ | 1,151,041 | $ | (41,299 | ) | $ | 296,739 | $ | 8,374 | $ | 1,416,226 | ||||||||||
Net income, fiscal year 2016 | 83,494 | 83,494 | |||||||||||||||||||||
Other comprehensive loss, net of tax | (2,459 | ) | (2,459 | ) | |||||||||||||||||||
ESOP activity | 522 | 1,652 | 2,174 | ||||||||||||||||||||
Restricted stock activity, net | 1 | 48 | 49 | ||||||||||||||||||||
Stock-based compensation | 1,121 | 1,121 | |||||||||||||||||||||
Stock options exercised | 3 | 4,123 | 4,126 | ||||||||||||||||||||
Cash dividends to stockholders ($0.84 per share) | (111,767 | ) | (111,767 | ) | |||||||||||||||||||
Balance at September 30, 2016 | 1,375 | 1,156,855 | (39,647 | ) | 268,466 | 5,915 | 1,392,964 | ||||||||||||||||
Net income, fiscal year 2017 | 84,137 | 84,137 | |||||||||||||||||||||
Other comprehensive loss, net of tax | (2,997 | ) | (2,997 | ) | |||||||||||||||||||
ESOP activity | 784 | 1,652 | 2,436 | ||||||||||||||||||||
Restricted stock activity, net | 57 | 57 | |||||||||||||||||||||
Stock-based compensation | 506 | 506 | |||||||||||||||||||||
Stock options exercised | 7 | 9,166 | 9,173 | ||||||||||||||||||||
Cash dividends to stockholders ($0.88 per share) | (117,963 | ) | (117,963 | ) | |||||||||||||||||||
Balance at September 30, 2017 | 1,382 | 1,167,368 | (37,995 | ) | 234,640 | 2,918 | 1,368,313 | ||||||||||||||||
Net income, fiscal year 2018 | 98,927 | 98,927 | |||||||||||||||||||||
Other comprehensive income, net of tax | 755 | 755 | |||||||||||||||||||||
Reclassification of certain tax effects related to adopting Accounting Standards Update ("ASU") 2018-02 | (667 | ) | 667 | — | |||||||||||||||||||
Cumulative effect of adopting ASU 2016-09 | 19 | (19 | ) | — | |||||||||||||||||||
Capital City Bancshares, Inc. ("CCB") acquisition | 30 | 39,083 | 39,113 | ||||||||||||||||||||
ESOP activity | 541 | 1,652 | 2,193 | ||||||||||||||||||||
Stock-based compensation | 372 | 372 | |||||||||||||||||||||
Stock options exercised | 261 | 261 | |||||||||||||||||||||
Cash dividends to stockholders ($0.88 per share) | (118,312 | ) | (118,312 | ) | |||||||||||||||||||
Balance at September 30, 2018 | $ | 1,412 | $ | 1,207,644 | $ | (36,343 | ) | $ | 214,569 | $ | 4,340 | $ | 1,391,622 | ||||||||||
See accompanying notes to consolidated financial statements. | |||||||||||||||||||||||
89
CAPITOL FEDERAL FINANCIAL, INC. AND SUBSIDIARY | |||||||||||
CONSOLIDATED STATEMENTS OF CASH FLOWS | |||||||||||
YEARS ENDED SEPTEMBER 30, 2018, 2017, and 2016 (Dollars in thousands) | |||||||||||
2018 | 2017 | 2016 | |||||||||
CASH FLOWS FROM OPERATING ACTIVITIES: | |||||||||||
Net income | $ | 98,927 | $ | 84,137 | $ | 83,494 | |||||
Adjustments to reconcile net income to net cash provided by operating activities: | |||||||||||
FHLB stock dividends | (10,962 | ) | (12,233 | ) | (12,252 | ) | |||||
Provision for credit losses | — | — | (750 | ) | |||||||
Originations of loans receivable held-for-sale ("LHFS") | (777 | ) | — | — | |||||||
Proceeds from sales of LHFS | 16,423 | 6,816 | — | ||||||||
Amortization and accretion of premiums and discounts on securities | 3,150 | 4,479 | 5,342 | ||||||||
Depreciation and amortization of premises and equipment | 8,458 | 7,796 | 7,141 | ||||||||
Amortization of intangible assets | 234 | — | — | ||||||||
Amortization of deferred amounts related to FHLB advances, net | 1,173 | 1,419 | 1,868 | ||||||||
Common stock committed to be released for allocation - ESOP | 2,193 | 2,436 | 2,174 | ||||||||
Stock-based compensation | 372 | 506 | 1,121 | ||||||||
Provision for deferred income taxes | (4,540 | ) | 922 | 470 | |||||||
Changes in cash collateral received from derivative counterparty, net | 10,701 | (731 | ) | — | |||||||
Changes in: | |||||||||||
Other assets, net | 1,712 | 51 | 1,807 | ||||||||
Income taxes payable, net | (2,262 | ) | 590 | 1,381 | |||||||
Accounts payable and accrued expenses | (639 | ) | (10,743 | ) | (6,840 | ) | |||||
Net cash provided by operating activities | 124,163 | 85,445 | 84,956 | ||||||||
CASH FLOWS FROM INVESTING ACTIVITIES: | |||||||||||
Purchase of AFS securities | (411,459 | ) | (37,425 | ) | (99,927 | ) | |||||
Purchase of HTM securities | — | — | (144,392 | ) | |||||||
Proceeds from calls, maturities and principal reductions of AFS securities | 192,966 | 144,643 | 326,814 | ||||||||
Proceeds from calls, maturities and principal reductions of HTM securities | 212,267 | 268,689 | 309,328 | ||||||||
Proceeds from sale of AFS securities | 2,078 | — | — | ||||||||
Proceeds from the redemption of FHLB stock | 291,506 | 386,900 | 382,450 | ||||||||
Purchase of FHLB stock | (277,552 | ) | (365,651 | ) | (329,625 | ) | |||||
Net increase in loans receivable | (37,537 | ) | (246,882 | ) | (336,056 | ) | |||||
Purchase of premises and equipment | (11,761 | ) | (9,128 | ) | (14,854 | ) | |||||
Proceeds from sale of other real estate owned ("OREO") | 2,240 | 5,138 | 4,973 | ||||||||
Cash acquired from acquisition | 15,685 | — | — | ||||||||
Proceeds from BOLI death benefit | — | — | 783 | ||||||||
Net cash (used in) provided by investing activities | (21,567 | ) | 146,284 | 99,494 | |||||||
(Continued) | |||||||||||
90
CAPITOL FEDERAL FINANCIAL, INC. AND SUBSIDIARY | |||||||||||
CONSOLIDATED STATEMENTS OF CASH FLOWS | |||||||||||
YEARS ENDED SEPTEMBER 30, 2018, 2017, and 2016 (Dollars in thousands) | |||||||||||
2018 | 2017 | 2016 | |||||||||
CASH FLOWS FROM FINANCING ACTIVITIES: | |||||||||||
Cash dividends paid | (118,312 | ) | (117,963 | ) | (111,767 | ) | |||||
Net change in deposits | (58,988 | ) | 145,850 | 331,498 | |||||||
Proceeds from borrowings | 17,275,100 | 2,700,100 | 8,000,100 | ||||||||
Repayments on borrowings | (17,414,200 | ) | (2,900,100 | ) | (8,900,100 | ) | |||||
Change in advance payments by borrowers for taxes and insurance | 939 | 1,106 | 825 | ||||||||
Stock options exercised | 261 | 8,843 | 4,070 | ||||||||
Excess tax benefits from stock options | — | 330 | 56 | ||||||||
Net cash used in financing activities | (315,200 | ) | (161,834 | ) | (675,318 | ) | |||||
NET (DECREASE) INCREASE IN CASH AND CASH EQUIVALENTS | (212,604 | ) | 69,895 | (490,868 | ) | ||||||
CASH AND CASH EQUIVALENTS: | |||||||||||
Beginning of year | 351,659 | 281,764 | 772,632 | ||||||||
End of year | $ | 139,055 | $ | 351,659 | $ | 281,764 | |||||
SUPPLEMENTAL DISCLOSURES OF CASH FLOW INFORMATION: | |||||||||||
Income tax payments | $ | 24,785 | $ | 37,875 | $ | 36,483 | |||||
Interest payments | $ | 119,699 | $ | 117,308 | $ | 106,182 | |||||
SUPPLEMENTAL DISCLOSURE OF NONCASH INVESTING AND | |||||||||||
FINANCING ACTIVITIES: | |||||||||||
Loans transferred to LHFS | $ | 15,814 | $ | 6,714 | $ | — | |||||
Acquisition: | |||||||||||
Common stock issued | $ | 39,113 | $ | — | $ | — | |||||
Fair value of assets acquired, excluding acquired cash and intangibles | $ | 418,062 | $ | — | $ | — | |||||
Fair value of liabilities assumed | $ | 412,675 | $ | — | $ | — | |||||
See accompanying notes to consolidated financial statements. | (Concluded) | ||||||||||
91
CAPITOL FEDERAL FINANCIAL, INC. AND SUBSIDIARY
NOTES TO CONSOLIDATED FINANCIAL STATEMENTS
YEARS ENDED SEPTEMBER 30, 2018, 2017, and 2016
1. SUMMARY OF SIGNIFICANT ACCOUNTING POLICIES
Description of Business - Capitol Federal Financial, Inc. (the "Company") provides a full range of retail banking services through its wholly-owned subsidiary, Capitol Federal Savings Bank (the "Bank"), a federal savings bank, which has 48 traditional and 10 in-store banking offices serving primarily the metropolitan areas of Topeka, Wichita, Lawrence, Manhattan, Emporia and Salina, Kansas and portions of the metropolitan area of greater Kansas City. The Bank emphasizes mortgage lending, primarily originating and purchasing one- to four-family loans, and providing personal retail financial services. The Bank is subject to competition from other financial institutions and other companies that provide financial services.
Basis of Presentation - The consolidated financial statements include the accounts of the Company and its wholly owned subsidiary, the Bank. The Bank has two wholly owned subsidiaries, Capitol Funds, Inc. and Capital City Investments, Inc. Capitol Funds, Inc. has a wholly-owned subsidiary, Capitol Federal Mortgage Reinsurance Company. Capital City Investments, Inc. is a real estate and investment holding company. All intercompany accounts and transactions have been eliminated in consolidation. The consolidated financial statements have been prepared in accordance with accounting principles generally accepted in the United States of America ("GAAP"), and require management to make estimates and assumptions that affect the reported amounts of assets and liabilities and disclosure of contingent assets and liabilities at the date of the financial statements and the reported amounts of revenues and expenses during the reporting periods. Actual results could differ from these estimates and assumptions.
The Company also owns 100 percent of Capital City Statutory Trust I ("CCST") and Capital City Statutory Trust II ("CCSTII") (collectively, the "Trusts"). The accounts of the Trusts do not qualify for consolidation accounting. The Company reports its subordinated debentures issued to the Trusts as other borrowings in the consolidated balance sheets and the common stock of the Trusts is reported as an equity method investment in other assets in the consolidated balance sheets.
Cash and Cash Equivalents - Cash and cash equivalents include cash on hand and amounts due from banks. Regulations of the Board of Governors of the Federal Reserve System ("FRB") require federally chartered savings banks to maintain cash reserves against their transaction accounts. Required reserves must be maintained in the form of vault cash, an account at a Federal Reserve Bank, or a pass-through account as defined by the FRB. The amount of interest-earning deposits held at the Federal Reserve Bank of Kansas City ("FRB of Kansas City") as of September 30, 2018 and 2017 was $120.8 million and $337.5 million, respectively. The Bank is in compliance with the FRB requirements. For the years ended September 30, 2018 and 2017, the average daily balance of required reserves at the FRB of Kansas City was $11.0 million and $9.1 million, respectively.
Net Presentation of Cash Flows Related to Borrowings - During the current fiscal year, the Bank entered into certain FHLB advances with contractual maturities of 90 days or less. Cash flows related to these advances are reported on a net basis in the consolidated statements of cash flows.
Securities - Securities include MBS and agency debentures issued primarily by United States Government-Sponsored Enterprises ("GSE"), including Federal National Mortgage Association, Federal Home Loan Mortgage Corporation and the Federal Home Loan Banks, United States Government agencies, including Government National Mortgage Association, and municipal bonds. Securities are classified as HTM, AFS, or trading based on management's intention for holding the securities on the date of purchase. Generally, classifications are made in response to liquidity needs, asset/liability management strategies, and the market interest rate environment at the time of purchase.
Securities that management has the intent and ability to hold to maturity are classified as HTM and reported at amortized cost. Such securities are adjusted for the amortization of premiums and discounts which are recognized as adjustments to interest income over the life of the securities using the level-yield method.
Securities that management may sell if necessary for liquidity or asset management purposes are classified as AFS and reported at fair value, with unrealized gains and losses reported as a component of AOCI within stockholders' equity, net of deferred income taxes. The amortization of premiums and discounts are recognized as adjustments to interest income over
92
the life of the securities using the level-yield method. Gains or losses on the disposition of AFS securities are recognized using the specific identification method. The Company primarily uses prices obtained from third party pricing services to determine the fair value of securities. See additional discussion of fair value of AFS securities in "Note 15. Fair Value of Financial Instruments."
Securities that are purchased and held principally for resale in the near future are classified as trading securities and are reported at fair value, with unrealized gains and losses included in non-interest income in the consolidated statements of income. During the fiscal years ended September 30, 2018 and 2017, neither the Company nor the Bank maintained a trading securities portfolio.
Management monitors securities in the investment portfolio for impairment on an ongoing basis and performs a formal review quarterly. The process involves monitoring market events and other items that could impact issuers. The evaluation includes, but is not limited to, such factors as: the nature of the investment, the length of time the security has had a fair value less than the amortized cost basis, the cause(s) and severity of the loss, expectation of an anticipated recovery period, recent events specific to the issuer or industry including the issuer's financial condition and current ability to make future payments in a timely manner, external credit ratings and recent downgrades in such ratings, management's intent to sell and whether it is more likely than not management would be required to sell prior to recovery for debt securities. Management determines whether other-than-temporary losses should be recognized for impaired securities by assessing all known facts and circumstances surrounding the securities. If management intends to sell an impaired security or if it is more likely than not that management will be required to sell an impaired security before recovery of its amortized cost basis, an other-than-temporary impairment has occurred and the difference between amortized cost and fair value will be recognized as a loss in earnings and the security will be written down to fair value.
Loans Receivable - Loans receivable that management has the intent and ability to hold for the foreseeable future are carried at the amount of unpaid principal, net of ACL, undisbursed loan funds, unamortized premiums and discounts, and deferred loan origination fees and costs. Net loan origination fees and costs, and premiums and discounts are amortized as yield adjustments to interest income using the level-yield method. Interest on loans is credited to income as earned and accrued only if deemed collectible.
Troubled debt restructurings ("TDRs") - For borrowers experiencing financial difficulties, the Bank may grant a concession to the borrower. Such concessions generally involve extensions of loan maturity dates, the granting of periods during which reduced payment amounts are required, and/or reductions in interest rates. If a concession requires assistance in the form of an interest rate reduction to less than the current market rate, or should the borrower have been discharged from Chapter 7 bankruptcy without reaffirming the debt, then the loan is classified as a TDR. The Bank does not forgive principal or interest nor does it commit to lend additional funds to these borrowers, except for situations generally involving the capitalization of delinquent interest and/or escrow not to exceed the original loan amount.
Delinquent loans - A loan is considered delinquent when payment has not been received within 30 days of its contractual due date. The number of days delinquent is determined by the number of scheduled payments that remain unpaid, assuming a period of 30 days between each scheduled payment.
Nonaccrual loans - The accrual of income on loans is generally discontinued when interest or principal payments are 90 days in arrears, unless, in the case of commercial loans, the loan is well secured and in the process of collection. We also report certain TDR loans as nonaccrual loans that are required to be reported as such pursuant to regulatory reporting requirements. Loans on which the accrual of income has been discontinued are designated as nonaccrual and outstanding interest previously credited beyond 90 days delinquent is reversed, except in the case of commercial loans in which all delinquent accrued interest is reversed. A nonaccrual loan is returned to accrual status once the contractual payments have been made to bring the loan less than 90 days past due or, in the case of a TDR loan, the borrower has made the required consecutive loan payments.
Impaired loans - A loan is considered impaired when, based on current information and events, it is probable that the Bank will be unable to collect all amounts due, including principal and interest, according to the original contractual terms of the loan agreement. Interest income on impaired loans is recognized in the period collected unless the ultimate collection of principal is considered doubtful, in which case interest income is no longer recognized. Loans reported as impaired loans include loans partially charged-off and TDRs.
93
Acquired Loans - Acquired loans are initially recorded at fair value based on a discounted cash flow valuation methodology that considers, among other things, interest rates, projected prepayments, projected default rates, loss given default and recovery rates, with no carryover of any existing ACL. Acquired loans with evidence of credit quality deterioration at acquisition are reviewed to determine if it is probable that the Company will not be able to collect all contractual amounts due, including both principal and interest. When both conditions exist, such loans are categorized and accounted for as purchased credit impaired ("PCI") loans. When these conditions do not exist, the loans are categorized as non-PCI loans.
The Company has determined that the amount and timing of cash flows to be collected from PCI loans cannot be reasonably estimated. As such, income related to PCI loans is recognized using the cost recovery method. Cash receipts are applied first as a reduction to the carrying amount of the loan. Once the entire carrying amount has been recovered, additional income is applied to any principal amounts previously written off, with any excess being recognized as interest income.
Allowance for Credit Losses - The ACL represents management's best estimate of the amount of inherent losses in the loan portfolio as of the balance sheet date. It involves a high degree of complexity and requires management to make difficult and subjective judgments and assumptions about highly uncertain matters. Management's methodology for assessing the appropriateness of the ACL consists of a formula analysis model, along with analyzing and considering several other relevant internal and external factors. The use of different judgments and assumptions could cause reported results to differ significantly. Management maintains the ACL through provisions for credit losses that are either charged or credited to income.
One- to four-family loans, including home equity loans, are individually evaluated for loss when the loan is generally 180 days delinquent and any losses are charged-off. Losses are based on new collateral values obtained through appraisals, less estimated costs to sell. Anticipated private mortgage insurance proceeds are taken into consideration when calculating the loss amount. An updated appraisal is requested, at a minimum, every 12 months thereafter if the loan is 180 days or more delinquent or in foreclosure. If the Bank holds the first and second mortgage, both loans are combined when evaluating whether there is a potential loss on the loan. When a non-real estate secured consumer loan is 120 days delinquent, any identified losses are charged-off. For commercial loans, generally losses are charged-off when the loan is more than 120 days delinquent and it is determined, through the analysis of any available current financial information with regards to the borrower, that the borrower is not able to service the debt and there is little or no prospect for near term improvement, or, in the case of secured loans, it is determined, through the analysis of current information with regards to the Bank's collateral position, that the amounts due from the borrower are in excess of the calculated current fair value of the collateral after consideration of estimated costs to sell. Charge-offs for any loan type may also occur at any time if the Bank has knowledge of the existence of a probable loss.
The primary risk characteristics inherent in the one- to four-family and consumer loan portfolios are a decline in economic conditions, elevated levels of unemployment or underemployment, and declines in residential real estate values. Any one or a combination of these events may adversely affect the ability of borrowers to repay their loans, resulting in increased delinquencies, non-performing assets, loan losses, and future loan loss provisions. Although the commercial loan portfolio is subject to the same risk of declines in economic conditions, the primary risk characteristics inherent in this portfolio include the ability of the borrower to sustain sufficient cash flows from leases and business operations and to control operational and/or business expenses to satisfy their contractual debt payments, and/or the ability to utilize personal and/or business resources to pay their contractual debt payments if the cash flows are not sufficient. Additionally, if the Bank were to repossess the secured collateral of a commercial real estate loan, the pool of potential buyers is more limited than that for a residential property. Therefore, the Bank could hold the property for an extended period of time and/or potentially be forced to sell at a discounted price, resulting in additional losses. Our commercial and industrial loans are primarily secured by accounts receivable, inventory and equipment, which may be difficult to appraise, may be illiquid and may fluctuate in value based on the success of the business.
Each quarter end, a formula analysis is prepared which segregates the loan portfolio into categories based on certain risk characteristics. The categories include the following: one- to four-family loans; commercial loans; consumer home equity loans; and other consumer loans. Home equity loans with the same underlying collateral as a one- to four-family loan are combined with the one- to four-family loan in the formula analysis model to calculate a combined loan-to-value ("LTV") ratio. The one- to four-family loan portfolio and related home equity loans are segregated into additional categories based on the following risk characteristics: loan source (originated, correspondent purchased, or bulk purchased), interest payments (fixed-rate and adjustable-rate), LTV ratios, borrower's credit scores, and geographic location. The categories were derived
94
by management based on reviewing the historical performance of the one- to four-family loan portfolio and taking into consideration current economic conditions, such as trends in residential real estate values in certain areas of the U.S. and unemployment rates. The commercial loan portfolio is segregated into additional categories based on loan source (originated or participation) and the type of loan (real estate loan, construction loan or commercial and industrial). Impaired loans are not included in the formula analysis as they are individually evaluated for loss.
Historical loss factors are applied to each loan category in the formula analysis model. Each quarter end, management reviews historical losses over a look-back time period and utilizes the historical loss time periods believed to be the most appropriate considering the current economic conditions. The historical loss time period is then adjusted for a loss emergence time period, which represents the estimated time period from the date of a loss event to the date we recognize a charge-off/loss. Qualitative loss factors are utilized in the formula analysis model to reflect risks inherent in each loan category that are not captured by the historical loss factors. The qualitative loss factors for one- to four-family and consumer loan portfolios take into consideration such items as: unemployment rate trends, residential real estate value trends, credit score trends, and delinquent loan trends. The qualitative loss factors for the commercial loan portfolio take into consideration the composition of the portfolio along with industry and peer charge-off information and certain ACL ratios. As loans are classified or become delinquent, the qualitative loss factors increase for each respective loan category. The qualitative loss factors were derived by management based on a review of the historical performance of the respective loan portfolios and industry and peer information for those loan portfolios with no or limited historical loss experience, along with consideration of current economic conditions and the likely impact such conditions might have to the performance of the loan portfolio.
For non-PCI loans, the Company estimates a hypothetical amount of ACL. The Company uses the acquired bank's past loss history adjusted for qualitative factors to establish the hypothetical amount of ACL. This amount is compared with the remaining net purchase discount for the non-PCI loans to test for credit quality deterioration and the possible need for an additional loan loss provision. To the extent the remaining net purchase discount of the pool is greater than the hypothetical ACL, no additional ACL is necessary. If the remaining net purchase discount of the pool is less than the hypothetical ACL, the difference results in an increase to the ACL recorded through a provision for credit losses.
Management utilizes the formula analysis model, along with analyzing and considering several other relevant internal and external factors when evaluating the adequacy of the ACL. Such factors include the trend and composition of delinquent loans and non-performing loans, trends in foreclosed property and short sale transactions and charge-off activity, the current status and trends of local and national employment levels, trends and current conditions in the housing markets, loan growth and concentrations, industry and peer charge-off and ACL information, and certain ACL ratios such as ACL to loans receivable, net and annualized historical losses. Since the Bank's loan portfolio is primarily concentrated in one- to four-family real estate, management monitors residential real estate market value trends in the Bank's local market areas and geographic sections of the U.S. by reference to various industry and market reports, economic releases and surveys, and management's general and specific knowledge of the real estate markets in which the Bank lends, in order to determine what impact, if any, such trends may have on the level of ACL. Reviewing these data elements assists management in evaluating the overall credit quality of the loan portfolio and the reasonableness of the ACL on an ongoing basis, and whether changes need to be made to the Bank's ACL methodology. Management seeks to apply the ACL methodology in a consistent manner; however, the methodology may be modified in response to changing conditions. Although management believes the ACL was at a level adequate to absorb inherent losses in the loan portfolio at September 30, 2018, the level of the ACL remains an estimate that is subject to significant judgment and short-term changes.
Federal Home Loan Bank Stock - As a member of FHLB Topeka, the Bank is required to acquire and hold shares of FHLB stock. The Bank's holding requirement varies based on the Bank's activities, primarily the Bank's outstanding borrowings, with FHLB. FHLB stock is carried at cost and is considered a restricted asset because it cannot be pledged as collateral or bought or sold on the open market and it also has certain redemption restrictions. Management conducts a quarterly evaluation to determine if any FHLB stock impairment exists. The quarterly impairment evaluation focuses primarily on the capital adequacy and liquidity of FHLB, while also considering the impact that legislative and regulatory developments may have on FHLB. Stock and cash dividends received on FHLB stock are reflected as dividend income in the consolidated statements of income.
Premises and Equipment - Land is carried at cost. Buildings, leasehold improvements, and furniture, fixtures and equipment are carried at cost less accumulated depreciation and leasehold amortization. Buildings, furniture, fixtures and equipment are depreciated over their estimated useful lives using the straight-line method. Leasehold improvements are amortized over the
95
shorter of their estimated useful lives or the term of the respective leases. The costs for major improvements and renovations are capitalized, while maintenance, repairs and minor improvements are charged to operating expenses as incurred. Gains and losses on dispositions are recorded as non-interest income or non-interest expense as incurred.
Other Assets - Included in other assets on the consolidated balance sheet are the Company's intangible assets, recognized as a result of the acquisition of CCB, which consist of goodwill, deposit intangibles and other intangibles.
Goodwill is assessed for impairment on an annual basis, or more frequently in certain circumstances. The test for impairment is performed by comparing the fair value of the reporting unit with its carrying amount. If the fair value is determined to be less than the carrying amount, an impairment is recorded.
The Company's intangible assets primarily relate to core deposits. These intangible assets are amortized based upon the expected economic benefit over an estimated life of approximately 8 years and are tested for impairment whenever events or circumstances change.
Income Taxes - The Company utilizes the asset and liability method of accounting for income taxes. Under this method, deferred income tax assets and liabilities are recognized for the tax consequences of temporary differences between the financial statement carrying amounts and the tax basis of existing assets and liabilities. Deferred income tax expense (benefit) represents the change in deferred income tax assets and liabilities excluding the tax effects of the change in net unrealized gain (loss) on AFS securities and interest rate swaps and changes in the market value of restricted stock between the grant date and vesting date. Income tax related penalties and interest, if any, are included in income tax expense in the consolidated statements of income.
Deferred tax assets and liabilities are measured using enacted tax rates expected to apply to taxable income in the years in which those temporary differences are expected to be recovered or settled. The effect on deferred tax assets and liabilities of a change in tax rates is recognized in income in the period that includes the enactment date. To the extent that management considers it more likely than not that a deferred tax asset will not be recovered, a valuation allowance is recorded. All positive and negative evidence is reviewed in determining how much of a valuation allowance is recognized on a quarterly basis.
Certain accounting literature prescribes a recognition threshold and measurement attribute for the financial statement recognition and measurement of an uncertain tax position taken, or expected to be taken, in a tax return. Interest and penalties related to unrecognized tax benefits are recognized in income tax expense in the consolidated statements of income. Accrued interest and penalties related to unrecognized tax benefits are included within the related tax liabilities line in the consolidated balance sheet.
Employee Stock Ownership Plan - The funds borrowed by the ESOP from the Company to purchase the Company's common stock are being repaid from dividends paid on unallocated ESOP shares and, if necessary, contributions by the Bank. The ESOP shares pledged as collateral are reported as a reduction of stockholders' equity at cost. As ESOP shares are committed to be released from collateral each quarter, the Company records compensation expense based on the average market price of the Company's stock during the quarter. Additionally, the ESOP shares become outstanding for EPS computations once they are committed to be released.
Stock-based Compensation - The Company has share-based plans under which stock options and restricted stock awards have been granted. Compensation expense is recognized over the service period of the share-based payment award. The Company utilizes a fair-value-based measurement method in accounting for the share-based payment transactions with employees, except for equity instruments held by the ESOP. The Company applies the modified prospective method in which compensation cost is recognized over the service period for all awards granted.
Borrowed Funds - The Bank has entered into repurchase agreements, which are sales of securities under agreements to repurchase, with approved counterparties. These agreements are recorded as financing transactions, and thereby reported as liabilities on the consolidated balance sheet, with the related expense reported as interest expense on the consolidated statements of income, as the Bank maintains effective control over the transferred securities and the securities continue to be carried in the Bank's securities portfolio.
96
The Bank has obtained borrowings from FHLB in the form of advances and a line of credit. Total FHLB borrowings are secured by certain qualifying loans pursuant to a blanket collateral agreement with FHLB and certain securities, as necessary. Additionally, the Bank is authorized to borrow from the Federal Reserve Bank's "discount window."
The Company uses interest rate swaps as part of its interest rate risk management strategy to hedge the variable cash outflows associated with certain borrowings. Interest rate swaps are carried at fair value in the Company's consolidated financial statements. For interest rate swaps that are designated and qualify as cash flow hedges, the effective portion of changes in the fair value of such agreements are recorded in AOCI and are subsequently reclassified into interest expense in the period that interest on the borrowings affects earnings. The ineffective portion of the change in fair value of the interest rate swap is recognized directly in earnings. Effectiveness is assessed using regression analysis. At the inception of a hedge, the Company documents certain items, including the relationship between the hedging instrument and the hedged item, the risk management objective and the nature of the risk being hedged, a description of how effectiveness will be measured and an evaluation of hedged transaction effectiveness.
Segment Information - As a community-oriented financial institution, substantially all of the Bank's operations involve the delivery of loan and deposit products to customers. Management makes operating decisions and assesses performance based on an ongoing review of these community banking operations, which constitute the Company's only operating segment for financial reporting purposes.
Low Income Housing Partnerships - As part of the Bank's community reinvestment initiatives, the Bank invests in affordable housing limited partnerships ("low income housing partnerships") that make equity investments in affordable housing properties. The Bank is a limited partner in each partnership in which it invests. A separate, unrelated third party is the general partner. The Bank receives affordable housing tax credits and other tax benefits for these investments. Previously, the Bank accounted for low income housing partnerships using the equity method of accounting as two of the Bank's officers were involved in the operational management of the low income housing partnership investment group. Effective September 30, 2016, those two Bank officers discontinued their involvement in the operational management of the investment group. The Bank started using the proportional method of accounting for its low income housing partnership investments on October 1, 2016. See "Note 7. Low Income Housing Partnerships" for additional information.
Earnings Per Share - Basic EPS is computed by dividing income available to common stockholders by the weighted average number of shares outstanding for the period. Diluted EPS reflects the potential dilution that could occur if securities or other contracts to issue common stock (such as stock options) were exercised or resulted in the issuance of common stock. These potentially dilutive shares would then be included in the weighted average number of shares outstanding for the period using the treasury stock method. Shares issued and shares reacquired during any period are weighted for the portion of the period that they were outstanding.
In computing both basic and diluted EPS, the weighted average number of common shares outstanding includes the ESOP shares previously allocated to participants and shares committed to be released for allocation to participants and restricted stock shares which have vested or have been allocated to participants. ESOP shares that have not been committed to be released are excluded from the computation of basic and diluted EPS. Unvested restricted stock awards contain nonforfeitable rights to dividends and are treated as participating securities in the computation of EPS pursuant to the two-class method.
Trust Asset Management - Assets (other than cash deposits with the Bank) held in fiduciary or agency capacities for customers are not included in the accompanying consolidated balance sheets, since such items are not assets of the Company or its subsidiaries.
Comprehensive Income - Comprehensive income consists of net income and other comprehensive income. Other comprehensive income includes unrealized gains and losses on AFS securities and changes in the accumulated gains/losses on effective cash flow hedging instruments, net of taxes.
Recent Accounting Pronouncements - In May 2014, the Financial Accounting Standards Board ("FASB") issued ASU 2014-09, Revenue from Contracts with Customers. The ASU, as amended, implements a common revenue standard that clarifies the principles for recognizing revenue. The core principle of the amended guidance is that an entity should recognize revenue to depict the transfer of goods or services to customers in an amount that reflects the consideration to
97
which the entity expects to be entitled in exchange for those goods or services. Additionally, the amended guidance identifies specific steps an entity should apply in order to achieve this principle. The amended guidance requires entities to disclose both quantitative and qualitative information regarding contracts with customers. ASU 2014-09 will become effective for the Company on October 1, 2018. The majority of the Company's revenue is composed of interest income from loans and securities which are explicitly excluded from the amended ASU. The Company completed its identification of revenue within the scope of the ASU and has concluded that the new guidance does not require any significant changes in the revenue recognition process. However, the Company believes it is appropriate to classify interchange network charges, currently reported as expense, as a reduction in revenue upon adoption of the ASU. The Company intends to elect to implement the ASU using the modified retrospective application, with the cumulative effect recorded as an adjustment to opening retained earnings at October 1, 2018. The cumulative effect adjustment is not expected to be material to the consolidated financial statements. Additionally, the expanded disclosures required by the ASU will be provided starting with the Company's first quarter of 2019 Form 10-Q.
In January 2016, the FASB issued ASU 2016-01, Financial Instruments - Overall: Recognition and Measurement of Financial Assets and Financial Liabilities. The ASU supersedes certain accounting guidance related to equity securities with readily determinable fair values and the related impairment assessment. An entity's equity investments that are accounted for under the equity method of accounting or result in consolidation of an investee are not included within the scope of this ASU. The Company does not currently hold any equity investments included within the scope of the ASU. The ASU requires public business entities to utilize the exit price notation in determining fair value for financial instruments measured at amortized cost on the balance sheet. The ASU requires additional reporting in other comprehensive income for financial liabilities measured at fair value in accordance with the fair value option. The ASU also requires separate presentation of financial assets and financial liabilities by measurement category and form of financial asset on the balance sheet or in the notes to the financial statements. ASU 2016-01 will become effective for the Company on October 1, 2018. The Company is currently evaluating the impact the ASU may have on the Company's consolidated financial condition, results of operations and disclosures. Based on the Company's preliminary analysis, the ASU it is not expected to have a material impact when adopted. Upon adoption, the exit price notion will be utilized when determining the fair value of financial instruments measured at amortized cost in the Company's fair value disclosures.
In February 2016, the FASB issued ASU 2016-02, Leases. The ASU amends lease accounting guidance by requiring that lessees recognize the assets and liabilities arising from leases on the balance sheet. Additionally, the ASU requires entities to disclose both quantitative and qualitative information regarding their leasing activities. The accounting applied by a lessor is largely unchanged from that applied under the previous guidance. ASU 2016-02 will become effective for the Company on October 1, 2019. In July 2018, the FASB issued ASU 2018-11, Leases, which provides entities with relief from the costs of implementation by allowing the option to not restate comparative periods as part of the transition. The Company expects to select the transition relief provisions. The Company has completed its development of a lease inventory and an internal lease data collection, organization, and computing platform for compliance with this ASU. The Company is continuing to evaluate the impact this ASU may have on the Company's consolidated financial condition and results of operations. The Company expects to recognize right-of-use assets and lease liabilities for substantially all of its operating lease commitments based on the present value of the minimum commitments under non-cancellable leases as of the date of adoption. The Company's current minimum commitments under non-cancellable operating leases are disclosed in Note 6, Premises and Equipment. The Company is continuing to evaluate the impact this ASU may have to the Company's disclosures.
In March 2016, the FASB issued ASU 2016-09, Compensation - Stock Compensation: Improvements to Employee Share-Based Payment Accounting. The ASU simplifies several aspects of the accounting for employee share-based payment transactions, including the accounting for income taxes, forfeitures, and statutory tax withholding requirements, along with simplifying the classification in the statement of cash flows. The Company adopted the ASU on October 1, 2017. Upon adoption, the Company elected to account for forfeitures of stock-based compensation awards when they occur. The Company will recognize excess tax benefits and tax deficiencies in income tax expense on the consolidated statements of income and present them within operating activities on the consolidated statements of cash flows. This ASU did not have a material impact on the Company's consolidated financial condition or results of operations at the time of adoption. However, the impact of tax benefits and the timing of their recognition within income tax expense is unpredictable, as these benefits are recognized primarily as a result of stock options being exercised.
In June 2016, the FASB issued ASU 2016-13, Financial Instruments - Credit Losses: Measurement of Credit Losses on Financial Instruments. The ASU replaces the incurred loss impairment methodology in current GAAP, which requires credit
98
losses to be recognized when it is probable that a loss has been incurred, with a new impairment methodology. The new impairment methodology requires an entity to measure, at each reporting date, the expected credit losses of financial assets not measured at fair value, such as loans, HTM debt securities, and loan commitments, over their contractual lives. Under the new impairment methodology, expected credit losses will be measured at each reporting date based on historical experience, current conditions, and reasonable and supportable forecasts. Additionally, the ASU amends the current credit loss measurements for AFS debt securities. Credit losses related to AFS debt securities will be recorded through the ACL rather than as a direct write-down as per current GAAP. The ASU also requires enhanced disclosures related to credit quality and significant estimates and judgments used by management when estimating credit losses. The ASU will become effective for the Company on October 1, 2020. The Company has selected a third-party vendor solution to assist in the application of this ASU and will begin implementation procedures in the first half of calendar year 2019. While we are currently unable to reasonably estimate the impact of adopting this ASU, we expect the impact of adoption will be influenced by the composition of our loan and securities portfolios as well as the economic conditions and forecasts at the time of adoption.
In January 2017, the FASB issued ASU 2017-04, Intangibles - Goodwill and Other: Simplifying the Test for Goodwill Impairment. The ASU simplifies the subsequent measurement of goodwill by eliminating the second step of the goodwill impairment test, which required computing the implied fair value of goodwill. Under the amendments in this update, an entity should perform its annual, or interim, goodwill impairment test by comparing the fair value of a reporting unit with its carrying amount. An impairment charge should be recognized for the amount by which the carrying amount exceeds the reporting unit's fair value; however, the loss recognized should not exceed the total amount of goodwill allocated to that reporting unit. The effective date of this ASU for the Company is October 1, 2020, with early adoption permitted. The Company elected to early-adopt this ASU during the current fiscal year.
In August 2017, the FASB issued ASU 2017-12, Derivatives and Hedging: Targeted Improvements to Accounting for Hedging Activities. The ASU amends the hedge accounting recognition and presentation requirements in current GAAP. The purpose of the ASU was to improve transparency of hedging relationships in the financial statements and to reduce the complexity of applying hedge accounting for preparers. The ASU will become effective for the Company on October 1, 2019. The Company is currently evaluating the effect of the ASU on the Company's consolidated financial condition, results of operations and disclosures.
In February 2018, the FASB issued ASU 2018-02, Income Statement - Reporting Comprehensive Income: Reclassification of Certain Tax Effects from Accumulated Other Comprehensive Income. The ASU helps organizations address certain stranded income tax effects in AOCI resulting from the tax legislation enacted by the U.S. government on December 22, 2017 commonly referred to as the Tax Cuts and Jobs Act (the "Tax Act") by allowing the reclassification of these amounts from AOCI to retained earnings. The effective date of this ASU for the Company is October 1, 2019, with early adoption permitted. The Company elected to early-adopt this ASU during the current fiscal year and reclassify the related tax effects from the enactment of the Tax Act, specifically those related to the change in the federal corporate tax rate, from AOCI to retained earnings. The reclassification was applied prospectively and is reflected in the Consolidated Statements of Stockholders' Equity. The Company releases the income tax effects of unrealized gains and losses related to AFS securities on a portfolio basis.
In August 2018, the FASB issued ASU 2018-13, Fair Value Measurement: Disclosure Framework - Changes to the Disclosures Requirements for Fair Value Measurement. This ASU eliminates, modifies and adds certain disclosure requirements for fair value measurements. The ASU adds disclosure requirements for the changes in unrealized gains and losses included in other comprehensive income for recurring Level 3 fair value measurements and the range and weighted average of significant unobservable inputs used to develop Level 3 fair value measurements. The effective date of this ASU for the Company is October 1, 2020, with early adoption permitted. Entities are allowed to elect early adoption of the eliminated or modified disclosure requirements and delay adoption of the new disclosure requirements until their effective date. Since this ASU only requires disclosure changes, it will not have a significant impact on the Company's consolidated financial condition and results of operations.
In August 2018, the FASB issued ASU 2018-15, Intangibles - Goodwill and Other - Internal-Use Software: Customer's Accounting for Implementation Costs Incurred in a Cloud Computing Arrangement That Is a Service Contract. The ASU aligns the requirements for capitalizing implementation costs incurred in a hosting arrangement that is a service contract with the requirements for capitalizing implementation costs incurred to develop or obtain internal-use software (and hosting arrangements that include internal-use software license). The effective date of this ASU for the Company is October 1, 2020,
99
with early adoption permitted. The Company is currently evaluating the effect of the ASU on the Company's consolidated financial condition, results of operations and disclosures.
2. ACQUISITION
On August 31, 2018, the Company completed the acquisition of CCB and its wholly-owned subsidiary Capital City Bank headquartered in Topeka, Kansas. Capital City Bank owned and leased banking locations in Topeka, Lawrence, and Overland Park, Kansas. The acquisition was not considered significant to the Company's financial statements; therefore, pro-forma financial data and related disclosures are not included.
The Company acquired loans and deposits with fair values of $299.7 million and $352.5 million, respectively, at the date of acquisition. Included in the loans acquired from CCB at August 31, 2018 were PCI loans with contractually required cash flows totaling $2.6 million. Of that amount, the Company expects to collect $1.9 million, which was also the fair value at the date of acquisition. Under the terms of the acquisition agreement, the Company issued 3.0 million shares of common stock for all outstanding shares of CCB capital stock, for a total merger consideration of $39.1 million, based on the Company's closing stock price of $13.21 on August 31, 2018. See "Note 8. Intangible Assets" for additional information regarding the acquisition of CCB.
During fiscal year 2018, the Company incurred $872 thousand of pre-tax merger-related expenses attributable to the CCB acquisition. The merger-related expenses are reflected on the Company's consolidated statement of income and are reported primarily in regulatory and outside services.
3. EARNINGS PER SHARE
Shares acquired by the ESOP are not considered in the basic average shares outstanding until the shares are committed for allocation or vested to an employee's individual account. Unvested shares awarded pursuant to the Company's restricted stock benefit plans are treated as participating securities in the computation of EPS pursuant to the two-class method as they contain nonforfeitable rights to dividends. The two-class method is an earnings allocation that determines EPS for each class of common stock and participating security.
For the Year Ended September 30, | |||||||||||
2018 | 2017 | 2016 | |||||||||
(Dollars in thousands, except per share amounts) | |||||||||||
Net income | $ | 98,927 | $ | 84,137 | $ | 83,494 | |||||
Income allocated to participating securities | (40 | ) | (44 | ) | (66 | ) | |||||
Net income available to common stockholders | $ | 98,887 | $ | 84,093 | $ | 83,428 | |||||
Average common shares outstanding | 134,635,886 | 134,019,962 | 132,982,815 | ||||||||
Average committed ESOP shares outstanding | 62,458 | 62,458 | 62,400 | ||||||||
Total basic average common shares outstanding | 134,698,344 | 134,082,420 | 133,045,215 | ||||||||
Effect of dilutive stock options | 60,647 | 161,442 | 131,161 | ||||||||
Total diluted average common shares outstanding | 134,758,991 | 134,243,862 | 133,176,376 | ||||||||
Net EPS: | |||||||||||
Basic | $ | 0.73 | $ | 0.63 | $ | 0.63 | |||||
Diluted | $ | 0.73 | $ | 0.63 | $ | 0.63 | |||||
Antidilutive stock options, excluded from the diluted average | |||||||||||
common shares outstanding calculation | 541,418 | 200,800 | 886,417 | ||||||||
100
4. SECURITIES
The following tables reflect the amortized cost, estimated fair value, and gross unrealized gains and losses of AFS and HTM securities at the dates presented. The majority of the MBS and investment securities portfolios are composed of securities issued by GSEs.
September 30, 2018 | |||||||||||||||
Gross | Gross | Estimated | |||||||||||||
Amortized | Unrealized | Unrealized | Fair | ||||||||||||
Cost | Gains | Losses | Value | ||||||||||||
(Dollars in thousands) | |||||||||||||||
AFS: | |||||||||||||||
MBS | $ | 445,883 | $ | 3,270 | $ | 4,063 | $ | 445,090 | |||||||
GSE debentures | 268,525 | 30 | 3,157 | 265,398 | |||||||||||
Municipal bonds | 4,156 | — | 30 | 4,126 | |||||||||||
$ | 718,564 | $ | 3,300 | $ | 7,250 | $ | 714,614 | ||||||||
HTM: | |||||||||||||||
MBS | $ | 591,900 | $ | 4,514 | $ | 15,589 | $ | 580,825 | |||||||
Municipal bonds | 20,418 | — | 172 | 20,246 | |||||||||||
$ | 612,318 | $ | 4,514 | $ | 15,761 | $ | 601,071 | ||||||||
September 30, 2017 | |||||||||||||||
Gross | Gross | Estimated | |||||||||||||
Amortized | Unrealized | Unrealized | Fair | ||||||||||||
Cost | Gains | Losses | Value | ||||||||||||
(Dollars in thousands) | |||||||||||||||
AFS: | |||||||||||||||
GSE debentures | $ | 271,300 | $ | 16 | $ | 587 | $ | 270,729 | |||||||
MBS | 135,644 | 5,923 | 51 | 141,516 | |||||||||||
Trust preferred securities | 2,067 | — | 16 | 2,051 | |||||||||||
Municipal bonds | 1,530 | 5 | — | 1,535 | |||||||||||
$ | 410,541 | $ | 5,944 | $ | 654 | $ | 415,831 | ||||||||
HTM: | |||||||||||||||
MBS | $ | 800,931 | $ | 10,460 | $ | 5,295 | $ | 806,096 | |||||||
Municipal bonds | 26,807 | 119 | 13 | 26,913 | |||||||||||
$ | 827,738 | $ | 10,579 | $ | 5,308 | $ | 833,009 | ||||||||
101
The following tables summarize the estimated fair value and gross unrealized losses of those securities on which an unrealized loss at the dates presented was reported and the continuous unrealized loss position for less than 12 months and equal to or greater than 12 months as of the dates presented.
September 30, 2018 | |||||||||||||||
Less Than 12 Months | Equal to or Greater Than 12 Months | ||||||||||||||
Estimated | Unrealized | Estimated | Unrealized | ||||||||||||
Fair Value | Losses | Fair Value | Losses | ||||||||||||
(Dollars in thousands) | |||||||||||||||
AFS: | |||||||||||||||
MBS | $ | 324,563 | $ | 3,797 | $ | 8,129 | $ | 266 | |||||||
GSE debentures | 101,735 | 1,231 | 148,049 | 1,926 | |||||||||||
Municipal bonds | 4,126 | 30 | — | — | |||||||||||
$ | 430,424 | $ | 5,058 | $ | 156,178 | $ | 2,192 | ||||||||
HTM: | |||||||||||||||
MBS | $ | 58,233 | $ | 904 | $ | 362,806 | $ | 14,685 | |||||||
Municipal bonds | 18,345 | 171 | 685 | 1 | |||||||||||
$ | 76,578 | $ | 1,075 | $ | 363,491 | $ | 14,686 | ||||||||
September 30, 2017 | |||||||||||||||
Less Than 12 Months | Equal to or Greater Than 12 Months | ||||||||||||||
Estimated | Unrealized | Estimated | Unrealized | ||||||||||||
Fair Value | Losses | Fair Value | Losses | ||||||||||||
(Dollars in thousands) | |||||||||||||||
AFS: | |||||||||||||||
GSE debentures | $ | 224,421 | $ | 539 | $ | 24,952 | $ | 48 | |||||||
MBS | 9,648 | 46 | 673 | 5 | |||||||||||
Trust preferred securities | — | — | 2,051 | 16 | |||||||||||
$ | 234,069 | $ | 585 | $ | 27,676 | $ | 69 | ||||||||
HTM: | |||||||||||||||
MBS | $ | 259,200 | $ | 1,582 | $ | 201,094 | $ | 3,713 | |||||||
Municipal bonds | 5,638 | 8 | 1,460 | 5 | |||||||||||
$ | 264,838 | $ | 1,590 | $ | 202,554 | $ | 3,718 | ||||||||
The unrealized losses at September 30, 2018 and 2017 were primarily a result of an increase in market yields from the time the securities were purchased. In general, as market yields rise, the fair value of securities will decrease; as market yields fall, the fair value of securities will increase. Management generally views changes in fair value caused by changes in interest rates as temporary. Therefore, these securities have not been classified as other-than-temporarily impaired. The impairment is also considered temporary because scheduled coupon payments have been made, it is anticipated that the entire principal balance will be collected as scheduled, and management neither intends to sell the securities, nor is it more likely than not that the Company will be required to sell the securities before the recovery of the remaining amortized cost amount, which could be at maturity. As a result of the analysis, management has concluded that no other-than-temporary impairments existed at September 30, 2018 or 2017. See "Note 1. Summary of Significant Accounting Policies - Securities" for additional information regarding our impairment review and classification process for securities.
102
The amortized cost and estimated fair value of debt securities as of September 30, 2018, by contractual maturity, are shown below. Actual principal repayments may differ from contractual maturities due to prepayment or early call privileges by the issuer. In the case of MBS, borrowers on the underlying loans generally have the right to prepay their loans without prepayment penalty. For this reason, MBS are not included in the maturity categories.
AFS | HTM | ||||||||||||||
Amortized | Estimated | Amortized | Estimated | ||||||||||||
Cost | Fair Value | Cost | Fair Value | ||||||||||||
(Dollars in thousands) | |||||||||||||||
One year or less | $ | 54,627 | $ | 54,476 | $ | 4,161 | $ | 4,152 | |||||||
One year through five years | 218,054 | 215,048 | 16,257 | 16,094 | |||||||||||
272,681 | 269,524 | 20,418 | 20,246 | ||||||||||||
MBS | 445,883 | 445,090 | 591,900 | 580,825 | |||||||||||
$ | 718,564 | $ | 714,614 | $ | 612,318 | $ | 601,071 | ||||||||
The following table presents the taxable and non-taxable components of interest income on investment securities for the periods presented.
For the Year Ended September 30, | |||||||||||
2018 | 2017 | 2016 | |||||||||
(Dollars in thousands) | |||||||||||
Taxable | $ | 4,275 | $ | 3,847 | $ | 5,255 | |||||
Non-taxable | 395 | 515 | 670 | ||||||||
$ | 4,670 | $ | 4,362 | $ | 5,925 | ||||||
The following table summarizes the carrying value of securities pledged as collateral for the obligations indicated below as of the dates presented.
September 30, | |||||||
2018 | 2017 | ||||||
(Dollars in thousands) | |||||||
Public unit deposits | $ | 515,553 | $ | 499,993 | |||
Repurchase agreements | 108,360 | 214,298 | |||||
FRB of Kansas City | 9,529 | 11,769 | |||||
$ | 633,442 | $ | 726,060 | ||||
During the current fiscal year, the Company sold trust preferred securities and received proceeds of $2.1 million. The Company recognized a gain of $9 thousand on the sale. All other dispositions of securities during fiscal years 2018, 2017, and 2016 were the result of principal repayments, calls, or maturities.
103
5. LOANS RECEIVABLE AND ALLOWANCE FOR CREDIT LOSSES
Loans receivable, net at September 30, 2018 and 2017 is summarized as follows:
2018 | 2017 | ||||||
(Dollars in thousands) | |||||||
One- to four-family: | |||||||
Originated | $ | 3,965,692 | $ | 3,959,232 | |||
Correspondent purchased | 2,505,987 | 2,445,311 | |||||
Bulk purchased | 293,607 | 351,705 | |||||
Construction | 33,149 | 30,647 | |||||
Total | 6,798,435 | 6,786,895 | |||||
Commercial: | |||||||
Commercial real estate | 426,243 | 183,030 | |||||
Commercial and industrial | 62,869 | — | |||||
Construction | 80,498 | 86,952 | |||||
Total | 569,610 | 269,982 | |||||
Consumer: | |||||||
Home equity | 129,588 | 122,066 | |||||
Other | 10,012 | 3,808 | |||||
Total | 139,600 | 125,874 | |||||
Total loans receivable | 7,507,645 | 7,182,751 | |||||
Less: | |||||||
ACL | 8,463 | 8,398 | |||||
Discounts/unearned loan fees | 33,933 | 24,962 | |||||
Premiums/deferred costs | (49,236 | ) | (45,680 | ) | |||
$ | 7,514,485 | $ | 7,195,071 | ||||
Included in the loan portfolio at September 30, 2018 were $296.5 million of non-PCI loans and $2.4 million of PCI loans associated with the acquisition of CCB during fiscal year 2018. At September 30, 2018, the Company had $5.5 million of net purchase discounts related to non-PCI loans and $516 thousand related to PCI loans.
As of September 30, 2018 and 2017, the Bank serviced loans for others aggregating $134.2 million and $101.2 million, respectively. Such loans are not included in the accompanying consolidated balance sheets. Servicing loans for others generally consists of collecting mortgage payments, maintaining escrow accounts, disbursing payments to investors and foreclosure processing. Loan servicing income includes servicing fees withheld from investors and certain charges collected from borrowers, such as late payment fees. The Bank held borrowers' escrow balances on loans serviced for others of $2.4 million and $2.1 million as of September 30, 2018 and 2017, respectively.
Lending Practices and Underwriting Standards - Originating and purchasing one- to four-family loans is the Bank's primary lending business. The Bank also originates consumer loans primarily secured by one- to four-family residential properties and originates and participates in commercial loans. The Bank has a loan concentration in one- to four-family loans and a geographic concentration of these loans in Kansas and Missouri.
One- to four-family loans - Full documentation to support an applicant's credit and income, and sufficient funds to cover all applicable fees and reserves at closing, are required on all loans. Generally, loans are underwritten according to the "ability to repay" and "qualified mortgage" standards, as issued by the Consumer Financial Protection Bureau. Properties securing one- to four-family loans are appraised by either staff appraisers or fee appraisers, both of which are independent of the loan origination function and approved by our Board of Directors.
104
The underwriting standards for loans purchased from correspondent lenders are generally similar to the Bank's internal underwriting standards. The underwriting of loans purchased from correspondent lenders on a loan-by-loan basis is performed by the Bank's underwriters.
The Bank also originates construction and owner-occupied construction-to-permanent loans secured by one- to four-family residential real estate. Construction draw requests and the supporting documentation are reviewed and approved by designated personnel. The Bank also performs regular documented inspections of the construction project to ensure the funds are being used for the intended purpose and the project is being completed according to the plans and specifications provided.
Commercial loans - The Bank's commercial real estate loans are originated by the Bank or are in participation with a lead bank. When underwriting a commercial real estate loan, several factors are considered, such as the income producing potential of the property, cash equity provided by the borrower, the financial strength of the borrower, managerial expertise of the borrower or tenant, feasibility studies, lending experience with the borrower and the marketability of the property. For commercial real estate participation loans, the Bank performs the same underwriting procedures as if the loan was being originated by the Bank. At the time of origination, LTV ratios on commercial real estate loans generally do not exceed 80% of the appraised value of the property securing the loans and the minimum debt service coverage ratio is generally 1.20. Appraisals on properties securing these loans are performed by independent state certified fee appraisers.
The Bank's commercial and industrial loans are generally made in the Bank's market areas and are underwritten on the basis of the borrower's ability to service the debt from income. Working capital loans are primarily collateralized by short-term assets whereas term loans are primarily collateralized by long-term assets. In general, commercial and industrial loans involve more credit risk than commercial real estate loans due to the type of collateral securing these loans, as well as the expectation that commercial and industrial loans generally will be serviced principally from the operations of the business, and those operations may not be successful. As a result of these additional complexities, variables and risks, these loans require more thorough underwriting and servicing than other types of loans.
Consumer loans - The Bank offers a variety of secured consumer loans, including home equity loans and lines of credit, home improvement loans, vehicle loans, and loans secured by deposits. The Bank also originates a very limited amount of unsecured loans. The majority of the consumer loan portfolio is comprised of home equity lines of credit for which the Bank also has the first mortgage or the home equity line of credit is in the first lien position.
The underwriting standards for consumer loans include a determination of an applicant's payment history on other debts and an assessment of an applicant's ability to meet existing obligations and payments on the proposed loan. Although creditworthiness of an applicant is a primary consideration, the underwriting process also includes a comparison of the value of the security in relation to the proposed loan amount.
Credit Quality Indicators - Based on the Bank's lending emphasis and underwriting standards, management has segmented the loan portfolio into three segments: (1) one- to four-family; (2) consumer; and (3) commercial. These segments are further divided into classes for purposes of providing disaggregated information about the credit quality of the loan portfolio. The classes are: one- to four-family - originated, one- to four-family - correspondent purchased, one- to four-family - bulk purchased, consumer - home equity, consumer - other, commercial - commercial real estate, and commercial - commercial and industrial.
The Bank's primary credit quality indicators for the one- to four-family and consumer - home equity loan portfolios are delinquency status, asset classifications, LTV ratios, and borrower credit scores. The Bank's primary credit quality indicators for the commercial and consumer - other loan portfolios are delinquency status and asset classifications.
105
The following tables present the recorded investment, by class, in loans 30 to 89 days delinquent, loans 90 or more days delinquent or in foreclosure, total delinquent loans, current loans, and total recorded investment at the dates presented. The recorded investment in loans is defined as the unpaid principal balance of a loan, less charge-offs and inclusive of unearned loan fees and deferred costs. At September 30, 2018 and 2017, all loans 90 or more days delinquent were on nonaccrual status.
September 30, 2018 | |||||||||||||||||||
90 or More Days | Total | Total | |||||||||||||||||
30 to 89 Days | Delinquent or | Delinquent | Current | Recorded | |||||||||||||||
Delinquent | in Foreclosure | Loans | Loans | Investment | |||||||||||||||
(Dollars in thousands) | |||||||||||||||||||
One- to four-family: | |||||||||||||||||||
Originated | $ | 10,613 | $ | 5,025 | $ | 15,638 | $ | 3,968,362 | $ | 3,984,000 | |||||||||
Correspondent purchased | 3,846 | 458 | 4,304 | 2,536,913 | 2,541,217 | ||||||||||||||
Bulk purchased | 3,521 | 3,063 | 6,584 | 288,386 | 294,970 | ||||||||||||||
Commercial: | |||||||||||||||||||
Commercial real estate | 76 | — | 76 | 501,932 | 502,008 | ||||||||||||||
Commercial and industrial | 250 | — | 250 | 61,255 | 61,505 | ||||||||||||||
Consumer: | |||||||||||||||||||
Home equity | 472 | 521 | 993 | 128,351 | 129,344 | ||||||||||||||
Other | 61 | 10 | 71 | 9,833 | 9,904 | ||||||||||||||
$ | 18,839 | $ | 9,077 | $ | 27,916 | $ | 7,495,032 | $ | 7,522,948 | ||||||||||
September 30, 2017 | |||||||||||||||||||
90 or More Days | Total | Total | |||||||||||||||||
30 to 89 Days | Delinquent or | Delinquent | Current | Recorded | |||||||||||||||
Delinquent | in Foreclosure | Loans | Loans | Investment | |||||||||||||||
(Dollars in thousands) | |||||||||||||||||||
One- to four-family: | |||||||||||||||||||
Originated | $ | 13,216 | $ | 5,500 | $ | 18,716 | $ | 3,956,598 | $ | 3,975,314 | |||||||||
Correspondent purchased | 1,855 | 92 | 1,947 | 2,477,916 | 2,479,863 | ||||||||||||||
Bulk purchased | 3,233 | 3,399 | 6,632 | 346,807 | 353,439 | ||||||||||||||
Commercial: | |||||||||||||||||||
Commercial real estate | — | — | — | 268,979 | 268,979 | ||||||||||||||
Commercial and industrial | — | — | — | — | — | ||||||||||||||
Consumer: | |||||||||||||||||||
Home equity | 467 | 406 | 873 | 121,193 | 122,066 | ||||||||||||||
Other | 33 | 4 | 37 | 3,771 | 3,808 | ||||||||||||||
$ | 18,804 | $ | 9,401 | $ | 28,205 | $ | 7,175,264 | $ | 7,203,469 | ||||||||||
The recorded investment in mortgage loans secured by residential real estate properties for which formal foreclosure proceedings were in process as of September 30, 2018 and 2017 was $2.9 million and $4.3 million, respectively, which is included in loans 90 or more days delinquent or in foreclosure in the table above. The carrying value of residential OREO held as a result of obtaining physical possession upon completion of a foreclosure or through completion of a deed in lieu of foreclosure was $1.3 million at September 30, 2018 and $1.4 million at September 30, 2017.
106
The following table presents the recorded investment, by class, in loans classified as nonaccrual at the dates presented.
September 30, | |||||||
2018 | 2017 | ||||||
(Dollars in thousands) | |||||||
One- to four-family: | |||||||
Originated | $ | 6,503 | $ | 10,054 | |||
Correspondent purchased | 863 | 1,804 | |||||
Bulk purchased | 3,063 | 4,264 | |||||
Commercial: | |||||||
Commercial real estate | — | — | |||||
Commercial and industrial | — | — | |||||
Consumer: | |||||||
Home equity | 530 | 519 | |||||
Other | 10 | 4 | |||||
$ | 10,969 | $ | 16,645 | ||||
In accordance with the Bank's asset classification policy, management regularly reviews the problem loans in the Bank's portfolio to determine whether any loans require classification. Loan classifications are defined as follows:
• | Special mention - These loans are performing loans on which known information about the collateral pledged or the possible credit problems of the borrower(s) have caused management to have doubts as to the ability of the borrower(s) to comply with present loan repayment terms and which may result in the future inclusion of such loans in the non-performing loan categories. |
• | Substandard - A loan is considered substandard if it is inadequately protected by the current net worth and paying capacity of the obligor or of the collateral pledged, if any. Substandard loans include those characterized by the distinct possibility the Bank will sustain some loss if the deficiencies are not corrected. |
• | Doubtful - Loans classified as doubtful have all the weaknesses inherent in those classified as substandard, with the added characteristic that the weaknesses present make collection or liquidation in full on the basis of currently existing facts and conditions and values highly questionable and improbable. |
• | Loss - Loans classified as loss are considered uncollectible and of such little value that their continuance as assets on the books is not warranted. |
The following table sets forth the recorded investment in loans classified as special mention or substandard, by class, at the dates presented. Special mention and substandard loans are included in the ACL formula analysis model if the loans are not individually evaluated for loss. Loans classified as doubtful or loss are individually evaluated for loss. At the dates presented, there were no loans classified as doubtful, and all loans classified as loss were fully charged-off.
September 30, | |||||||||||||||
2018 | 2017 | ||||||||||||||
Special Mention | Substandard | Special Mention | Substandard | ||||||||||||
(Dollars in thousands) | |||||||||||||||
One- to four-family: | |||||||||||||||
Originated | $ | 8,660 | $ | 22,409 | $ | 7,031 | $ | 30,059 | |||||||
Correspondent purchased | 997 | 3,126 | 261 | 3,800 | |||||||||||
Bulk purchased | — | 7,195 | — | 8,005 | |||||||||||
Commercial: | |||||||||||||||
Commercial real estate | 1,251 | 1,368 | — | — | |||||||||||
Commercial and industrial | 1,126 | — | — | — | |||||||||||
Consumer: | |||||||||||||||
Home equity | 298 | 894 | 9 | 1,032 | |||||||||||
Other | — | 10 | — | 4 | |||||||||||
$ | 12,332 | $ | 35,002 | $ | 7,301 | $ | 42,900 | ||||||||
107
The following table shows the weighted average credit score and weighted average LTV for one- to four-family loans and consumer home equity loans at the dates presented. Borrower credit scores are intended to provide an indication as to the likelihood that a borrower will repay their debts. Credit scores are updated at least semiannually, with the last update in September 2018, from a nationally recognized consumer rating agency. The LTV ratios provide an estimate of the extent to which the Bank may incur a loss on any given loan that may go into foreclosure. The consumer - home equity LTV does not take into account the first lien position, if applicable. The LTV ratios were based on the current loan balance and either the lesser of the purchase price or original appraisal, or the most recent Bank appraisal, if available. In most cases, the most recent appraisal was obtained at the time of origination.
September 30, | |||||||||
2018 | 2017 | ||||||||
Credit Score | LTV | Credit Score | LTV | ||||||
One- to four-family - originated | 767 | 63 | % | 767 | 63 | % | |||
One- to four-family - correspondent | 764 | 67 | 764 | 68 | |||||
One- to four-family - bulk purchased | 758 | 62 | 757 | 63 | |||||
Consumer - home equity | 750 | 22 | 755 | 19 | |||||
765 | 63 | 765 | 64 | ||||||
TDRs - The following tables present the recorded investment prior to restructuring and immediately after restructuring in all loans restructured during the periods presented. These tables do not reflect the recorded investment at the end of the periods indicated. Any increase in the recorded investment at the time of the restructuring was generally due to the capitalization of delinquent interest and/or escrow balances. During the fourth quarter of fiscal year 2017, management refined its methodology for assessing whether a loan modification qualifies as a TDR which, though not material, resulted in fewer loans being classified as TDRs in the current fiscal year.
For the Year Ended September 30, 2018 | ||||||||||
Number | Pre- | Post- | ||||||||
of | Restructured | Restructured | ||||||||
Contracts | Outstanding | Outstanding | ||||||||
(Dollars in thousands) | ||||||||||
One- to four-family: | ||||||||||
Originated | 5 | $ | 264 | $ | 281 | |||||
Correspondent purchased | 2 | 406 | 406 | |||||||
Bulk purchased | — | — | — | |||||||
Commercial: | ||||||||||
Commercial real estate | — | — | — | |||||||
Commercial and industrial | — | — | — | |||||||
Consumer: | ||||||||||
Home equity | — | — | — | |||||||
Other | — | — | — | |||||||
7 | $ | 670 | $ | 687 | ||||||
108
For the Year Ended September 30, 2017 | ||||||||||
Number | Pre- | Post- | ||||||||
of | Restructured | Restructured | ||||||||
Contracts | Outstanding | Outstanding | ||||||||
(Dollars in thousands) | ||||||||||
One- to four-family: | ||||||||||
Originated | 112 | $ | 11,940 | $ | 12,402 | |||||
Correspondent purchased | 12 | 2,443 | 2,459 | |||||||
Bulk purchased | 3 | 1,031 | 1,048 | |||||||
Commercial: | ||||||||||
Commercial real estate | — | — | — | |||||||
Commercial and industrial | — | — | — | |||||||
Consumer: | ||||||||||
Home equity | 17 | 368 | 380 | |||||||
Other | — | — | — | |||||||
144 | $ | 15,782 | $ | 16,289 | ||||||
For the Year Ended September 30, 2016 | ||||||||||
Number | Pre- | Post- | ||||||||
of | Restructured | Restructured | ||||||||
Contracts | Outstanding | Outstanding | ||||||||
(Dollars in thousands) | ||||||||||
One- to four-family: | ||||||||||
Originated | 122 | $ | 17,201 | $ | 17,557 | |||||
Correspondent purchased | 12 | 2,592 | 2,619 | |||||||
Bulk purchased | 3 | 596 | 594 | |||||||
Commercial: | ||||||||||
Commercial real estate | — | — | — | |||||||
Commercial and industrial | — | — | — | |||||||
Consumer: | ||||||||||
Home equity | 19 | 427 | 433 | |||||||
Other | 1 | 8 | 8 | |||||||
157 | $ | 20,824 | $ | 21,211 | ||||||
109
The following table provides information on TDRs that became delinquent during the periods presented within 12 months after being restructured.
For the Years Ended | ||||||||||||||||||||
September 30, 2018 | September 30, 2017 | September 30, 2016 | ||||||||||||||||||
Number of | Recorded | Number of | Recorded | Number of | Recorded | |||||||||||||||
Contracts | Investment | Contracts | Investment | Contracts | Investment | |||||||||||||||
(Dollars in thousands) | ||||||||||||||||||||
One- to four-family: | ||||||||||||||||||||
Originated | 22 | $ | 1,416 | 46 | $ | 4,561 | 48 | $ | 5,330 | |||||||||||
Correspondent purchased | 1 | 124 | 2 | 148 | 3 | 548 | ||||||||||||||
Bulk purchased | 3 | 1,040 | 2 | 698 | — | — | ||||||||||||||
Commercial: | ||||||||||||||||||||
Commercial real estate | — | — | — | — | — | — | ||||||||||||||
Commercial and industrial | — | — | — | — | — | — | ||||||||||||||
Consumer: | ||||||||||||||||||||
Home equity | 4 | 133 | 16 | 440 | 6 | 174 | ||||||||||||||
Other | — | — | — | — | — | — | ||||||||||||||
30 | $ | 2,713 | 66 | $ | 5,847 | 57 | $ | 6,052 | ||||||||||||
Impaired loans - The following information pertains to impaired loans, by class, as of the dates presented. During the fourth quarter of fiscal year 2017, management refined its methodology for classifying loans as impaired. The change resulting from this refinement was immaterial. All impaired loans were individually evaluated for loss and all losses were charged-off, resulting in no related ACL for these loans.
September 30, 2018 | September 30, 2017 | ||||||||||||||
Unpaid | Unpaid | ||||||||||||||
Recorded | Principal | Recorded | Principal | ||||||||||||
Investment | Balance | Investment | Balance | ||||||||||||
(Dollars in thousands) | |||||||||||||||
One- to four-family: | |||||||||||||||
Originated | $ | 18,857 | $ | 19,388 | $ | 30,251 | $ | 30,953 | |||||||
Correspondent purchased | 2,668 | 2,768 | 3,800 | 3,771 | |||||||||||
Bulk purchased | 6,011 | 6,976 | 7,403 | 8,606 | |||||||||||
Commercial: | |||||||||||||||
Commercial real estate | — | — | — | — | |||||||||||
Commercial and industrial | — | — | — | — | |||||||||||
Consumer: | |||||||||||||||
Home equity | 504 | 720 | 775 | 997 | |||||||||||
Other | — | 25 | — | 24 | |||||||||||
$ | 28,040 | $ | 29,877 | $ | 42,229 | $ | 44,351 | ||||||||
110
The following information pertains to impaired loans, by class, for the periods presented.
For the Years Ended | |||||||||||||||||||||||
September 30, 2018 | September 30, 2017 | September 30, 2016 | |||||||||||||||||||||
Average | Interest | Average | Interest | Average | Interest | ||||||||||||||||||
Recorded | Income | Recorded | Income | Recorded | Income | ||||||||||||||||||
Investment | Recognized | Investment | Recognized | Investment | Recognized | ||||||||||||||||||
(Dollars in thousands) | |||||||||||||||||||||||
With no related allowance recorded | |||||||||||||||||||||||
One- to four-family: | |||||||||||||||||||||||
Originated | $ | 23,847 | $ | 990 | $ | 24,122 | $ | 917 | $ | 12,063 | $ | 470 | |||||||||||
Correspondent purchased | 3,204 | 112 | 3,346 | 118 | 495 | 18 | |||||||||||||||||
Bulk purchased | 6,438 | 191 | 9,852 | 194 | 11,022 | 196 | |||||||||||||||||
Commercial: | |||||||||||||||||||||||
Commercial real estate | — | — | — | — | — | — | |||||||||||||||||
Commercial and industrial | — | — | — | — | — | — | |||||||||||||||||
Consumer: | |||||||||||||||||||||||
Home equity | 588 | 39 | 988 | 86 | 628 | 93 | |||||||||||||||||
Other | — | — | 7 | — | 13 | 1 | |||||||||||||||||
34,077 | 1,332 | 38,315 | 1,315 | 24,221 | 778 | ||||||||||||||||||
With an allowance recorded | |||||||||||||||||||||||
One- to four-family: | |||||||||||||||||||||||
Originated | — | — | 11,469 | 434 | 24,199 | 983 | |||||||||||||||||
Correspondent purchased | — | — | 2,018 | 65 | 2,669 | 50 | |||||||||||||||||
Bulk purchased | — | — | 1,160 | 20 | 2,219 | 27 | |||||||||||||||||
Commercial: | |||||||||||||||||||||||
Commercial real estate | — | — | — | — | — | — | |||||||||||||||||
Commercial and industrial | — | — | — | — | — | — | |||||||||||||||||
Consumer: | |||||||||||||||||||||||
Home equity | — | — | 457 | 36 | 895 | 64 | |||||||||||||||||
Other | — | — | 10 | 1 | 13 | 1 | |||||||||||||||||
— | — | 15,114 | 556 | 29,995 | 1,125 | ||||||||||||||||||
Total | |||||||||||||||||||||||
One- to four-family: | |||||||||||||||||||||||
Originated | 23,847 | 990 | 35,591 | 1,351 | 36,262 | 1,453 | |||||||||||||||||
Correspondent purchased | 3,204 | 112 | 5,364 | 183 | 3,164 | 68 | |||||||||||||||||
Bulk purchased | 6,438 | 191 | 11,012 | 214 | 13,241 | 223 | |||||||||||||||||
Commercial: | |||||||||||||||||||||||
Commercial real estate | — | — | — | — | — | — | |||||||||||||||||
Commercial and industrial | — | — | — | — | — | — | |||||||||||||||||
Consumer: | |||||||||||||||||||||||
Home equity | 588 | 39 | 1,445 | 122 | 1,523 | 157 | |||||||||||||||||
Other | — | — | 17 | 1 | 26 | 2 | |||||||||||||||||
$ | 34,077 | $ | 1,332 | $ | 53,429 | $ | 1,871 | $ | 54,216 | $ | 1,903 | ||||||||||||
111
Allowance for Credit Losses - The following is a summary of ACL activity, by loan portfolio segment, for the periods presented, and the ending balance of ACL based on the Company's impairment methodology.
For the Year Ended September 30, 2018 | |||||||||||||||||||||||||||
One- to Four-Family | |||||||||||||||||||||||||||
Correspondent | Bulk | ||||||||||||||||||||||||||
Originated | Purchased | Purchased | Total | Commercial | Consumer | Total | |||||||||||||||||||||
(Dollars in thousands) | |||||||||||||||||||||||||||
Beginning balance | $ | 3,173 | $ | 1,922 | $ | 1,000 | $ | 6,095 | $ | 2,112 | $ | 191 | $ | 8,398 | |||||||||||||
Charge-offs | (136 | ) | (128 | ) | — | (264 | ) | — | (38 | ) | (302 | ) | |||||||||||||||
Recoveries | 144 | — | 196 | 340 | — | 27 | 367 | ||||||||||||||||||||
Provision for credit losses | (228 | ) | 67 | (271 | ) | (432 | ) | 444 | (12 | ) | — | ||||||||||||||||
Ending balance | $ | 2,953 | $ | 1,861 | $ | 925 | $ | 5,739 | $ | 2,556 | $ | 168 | $ | 8,463 | |||||||||||||
For the Year Ended September 30, 2017 | |||||||||||||||||||||||||||
One- to Four-Family | |||||||||||||||||||||||||||
Correspondent | Bulk | ||||||||||||||||||||||||||
Originated | Purchased | Purchased | Total | Commercial | Consumer | Total | |||||||||||||||||||||
(Dollars in thousands) | |||||||||||||||||||||||||||
Beginning balance | $ | 3,928 | $ | 2,102 | $ | 1,065 | $ | 7,095 | $ | 1,208 | $ | 237 | $ | 8,540 | |||||||||||||
Charge-offs | (72 | ) | — | (216 | ) | (288 | ) | — | (60 | ) | (348 | ) | |||||||||||||||
Recoveries | 4 | — | 165 | 169 | — | 37 | 206 | ||||||||||||||||||||
Provision for credit losses | (687 | ) | (180 | ) | (14 | ) | (881 | ) | 904 | (23 | ) | — | |||||||||||||||
Ending balance | $ | 3,173 | $ | 1,922 | $ | 1,000 | $ | 6,095 | $ | 2,112 | $ | 191 | $ | 8,398 | |||||||||||||
For the Year Ended September 30, 2016 | |||||||||||||||||||||||||||
One- to Four-Family | |||||||||||||||||||||||||||
Correspondent | Bulk | ||||||||||||||||||||||||||
Originated | Purchased | Purchased | Total | Commercial | Consumer | Total | |||||||||||||||||||||
(Dollars in thousands) | |||||||||||||||||||||||||||
Beginning balance | $ | 4,865 | $ | 2,115 | $ | 1,434 | $ | 8,414 | $ | 742 | $ | 287 | $ | 9,443 | |||||||||||||
Charge-offs | (200 | ) | — | (342 | ) | (542 | ) | — | (88 | ) | (630 | ) | |||||||||||||||
Recoveries | 77 | — | 374 | 451 | — | 26 | 477 | ||||||||||||||||||||
Provision for credit losses | (814 | ) | (13 | ) | (401 | ) | (1,228 | ) | 466 | 12 | (750 | ) | |||||||||||||||
Ending balance | $ | 3,928 | $ | 2,102 | $ | 1,065 | $ | 7,095 | $ | 1,208 | $ | 237 | $ | 8,540 | |||||||||||||
112
The following is a summary of the loan portfolio and related ACL balances, at the dates presented, by loan portfolio segment disaggregated by the Company's impairment method. There was no ACL for loans individually evaluated for impairment at either date as all losses were charged-off.
September 30, 2018 | |||||||||||||||||||||||||||
One- to Four-Family | |||||||||||||||||||||||||||
Correspondent | Bulk | ||||||||||||||||||||||||||
Originated | Purchased | Purchased | Total | Commercial | Consumer | Total | |||||||||||||||||||||
(Dollars in thousands) | |||||||||||||||||||||||||||
Recorded investment in loans | |||||||||||||||||||||||||||
collectively evaluated for impairment | $ | 3,965,143 | $ | 2,538,549 | $ | 288,959 | $ | 6,792,651 | $ | 563,513 | $ | 138,744 | $ | 7,494,908 | |||||||||||||
Recorded investment in loans | |||||||||||||||||||||||||||
individually evaluated for impairment | 18,857 | 2,668 | 6,011 | 27,536 | — | 504 | 28,040 | ||||||||||||||||||||
$ | 3,984,000 | $ | 2,541,217 | $ | 294,970 | $ | 6,820,187 | $ | 563,513 | $ | 139,248 | $ | 7,522,948 | ||||||||||||||
ACL for loans collectively | |||||||||||||||||||||||||||
evaluated for impairment | $ | 2,953 | $ | 1,861 | $ | 925 | $ | 5,739 | $ | 2,556 | $ | 168 | $ | 8,463 | |||||||||||||
September 30, 2017 | |||||||||||||||||||||||||||
One- to Four-Family | |||||||||||||||||||||||||||
Correspondent | Bulk | ||||||||||||||||||||||||||
Originated | Purchased | Purchased | Total | Commercial | Consumer | Total | |||||||||||||||||||||
(Dollars in thousands) | |||||||||||||||||||||||||||
Recorded investment in loans | |||||||||||||||||||||||||||
collectively evaluated for impairment | $ | 3,945,063 | $ | 2,476,063 | $ | 346,035 | $ | 6,767,161 | $ | 268,979 | $ | 125,100 | $ | 7,161,240 | |||||||||||||
Recorded investment in loans | |||||||||||||||||||||||||||
individually evaluated for impairment | 30,251 | 3,800 | 7,404 | 41,455 | — | 774 | 42,229 | ||||||||||||||||||||
$ | 3,975,314 | $ | 2,479,863 | $ | 353,439 | $ | 6,808,616 | $ | 268,979 | $ | 125,874 | $ | 7,203,469 | ||||||||||||||
ACL for loans collectively | |||||||||||||||||||||||||||
evaluated for impairment | $ | 3,173 | $ | 1,922 | $ | 1,000 | $ | 6,095 | $ | 2,112 | $ | 191 | $ | 8,398 | |||||||||||||
113
6. PREMISES AND EQUIPMENT
A summary of the net carrying value of premises and equipment at September 30, 2018 and 2017 was as follows:
2018 | 2017 | ||||||
(Dollars in thousands) | |||||||
Land | $ | 13,536 | $ | 11,670 | |||
Building and improvements | 107,580 | 96,401 | |||||
Furniture, fixtures and equipment | 48,852 | 43,410 | |||||
169,968 | 151,481 | ||||||
Less accumulated depreciation | 73,963 | 66,663 | |||||
$ | 96,005 | $ | 84,818 | ||||
The Bank has entered into non-cancelable operating lease agreements with respect to banking premises and equipment. It is expected that many agreements will be renewed at expiration in the normal course of business. Rental expense was $1.2 million, $1.1 million, and $1.2 million for the years ended September 30, 2018, 2017, and 2016, respectively.
As of September 30, 2018, future minimum rental commitments, rounded to the nearest thousand, required under operating leases that have initial or remaining non-cancelable lease terms in excess of one year were as follows:
2019 | $ | 1,364 | |
2020 | 1,067 | ||
2021 | 941 | ||
2022 | 828 | ||
2023 | 689 | ||
Thereafter | 1,573 | ||
$ | 6,462 | ||
7. LOW INCOME HOUSING PARTNERSHIPS
The Bank's investment in low income housing partnerships, which is included in other assets in the consolidated balance sheets, was $74.5 million and $66.1 million at September 30, 2018 and 2017, respectively. The Bank's obligations related to unfunded commitments, which are included in accounts payable and accrued expenses in the consolidated balance sheets, were $34.0 million and $29.4 million at September 30, 2018 and 2017, respectively. The majority of the commitments at September 30, 2018 are projected to be funded through the end of calendar year 2021.
For fiscal year 2018, the net income tax benefit associated with these investments, which consists of proportional amortization expense and affordable housing tax credits and other related tax benefits, was reported in income tax expense in the consolidated statements of income. The amount of proportional amortization expense recognized during fiscal years 2018 and 2017 was $7.0 million and $4.4 million, respectively, and the amount of affordable housing tax credits and other related tax benefits was $7.5 million and $6.9 million, respectively, resulting in a net income tax benefit of $500 thousand and $2.5 million, respectively. The increase in proportional amortization expense was due primarily to a change in the tax rate resulting from the Tax Act, as well as to changes in the life cycle stage of the investments. For fiscal year 2016, the expenses were reported in the low income housing partnerships line of the consolidated statements of income, and the amount of affordable housing tax credits and other related tax benefits was $6.0 million. There were no impairment losses during fiscal years 2018, 2017, or 2016 resulting from the forfeiture or ineligibility of tax credits or other circumstances.
114
8. INTANGIBLE ASSETS
With the acquisition of CCB, the Company recognized goodwill of $8.0 million, which is calculated as the consideration exchanged in excess of the fair value of assets, net of the fair value of liabilities assumed. The Company also recognized $10.1 million of other intangible assets which is largely composed of core deposit intangibles. These assets will be amortized over their estimated lives, which management has determined to be 8 years.
Changes in the carrying amount of the Company's intangible assets, which are included in other assets on the consolidated balance sheet, for fiscal year 2018 are presented in the following table.
Goodwill | Core Deposit and Other Intangibles | ||||||
(Dollars in thousands) | |||||||
Balance as of September 30, 2017 | $ | — | $ | — | |||
Add: Acquisition of CCB | 7,989 | 10,052 | |||||
Less: Amortization | — | (234 | ) | ||||
Balance as of September 30, 2018 | $ | 7,989 | $ | 9,819 | |||
As of September 30, 2018, there was no impairment recorded on goodwill or other intangible assets.
The estimated amortization expense for the next five years related to the core deposit and other intangible assets as of September 30, 2018 is presented in the following table (dollars in thousands):
2019 | $ | 2,317 | |
2020 | 1,964 | ||
2021 | 1,659 | ||
2022 | 1,358 | ||
2023 | 1,056 | ||
9. DEPOSITS AND BORROWED FUNDS
Deposits - Non-interest-bearing deposits totaled $336.5 million and $243.7 million as of September 30, 2018 and 2017, respectively. Certificates of deposit with a minimum denomination of $250 thousand were $668.8 million and $676.1 million as of September 30, 2018 and 2017, respectively. Deposits in excess of $250 thousand may not be fully insured by the Federal Deposit Insurance Corporation.
FHLB Borrowings - FHLB borrowings at September 30, 2018 consisted of $2.07 billion in FHLB advances, of which $1.60 billion were fixed-rate advances and $475.0 million were variable-rate advances, and $100.0 million against the variable-rate FHLB line of credit. FHLB borrowings at September 30, 2017 consisted of $2.17 billion in FHLB advances, of which $1.98 billion were fixed-rate advances and $200.0 million were variable-rate advances. There were no borrowings against the variable-rate FHLB line of credit at September 30, 2017. The line of credit is set to expire on November 15, 2019, at which time it is expected to be renewed by FHLB for a one year period.
115
FHLB advances at September 30, 2018 and 2017 were comprised of the following:
2018 | 2017 | ||||||
(Dollars in thousands) | |||||||
FHLB advances | $ | 2,075,000 | $ | 2,175,000 | |||
Deferred prepayment penalty | (19 | ) | (1,192 | ) | |||
$ | 2,074,981 | $ | 2,173,808 | ||||
Weighted average contractual interest rate on FHLB advances | 2.07 | % | 1.96 | % | |||
Weighted average effective interest rate on FHLB advances(1) | 2.12 | 2.09 | |||||
(1) | The effective interest rate includes the net impact of deferred amounts and interest rate swaps related to the adjustable-rate FHLB advances. |
During fiscal years 2018, 2017 and 2016, the Bank utilized a leverage strategy (the "leverage strategy") to increase earnings. The leverage strategy involves borrowing up to $2.10 billion either on the Bank's FHLB line of credit or by entering into short-term FHLB advances, depending on the rates offered by FHLB, with all of the balance being paid down at each quarter end, or earlier if the strategy it is not profitable. The proceeds of the borrowings, net of the required FHLB stock holdings, are deposited at the FRB of Kansas City. Management can discontinue the use of the leverage strategy at any point in time.
At September 30, 2018 and 2017, the Bank had entered into interest rate swap agreements with a total notional amount of $475.0 million and $200.0 million, respectively, in order to hedge the variable cash flows associated with $475.0 million and $200.0 million, respectively, of adjustable-rate FHLB advances. At September 30, 2018 and 2017, the interest rate swap agreements had an average remaining term to maturity of 5.8 years and 5.9 years, respectively. The interest rate swaps were designated as cash flow hedges and involve the receipt of variable amounts from a counterparty in exchange for the Bank making fixed-rate payments over the life of the interest rate swap agreements. At September 30, 2018, the interest rate swaps were in a gain position with a total fair value of $9.7 million, which was reported in other assets on the consolidated balance sheet. At September 30, 2017, the interest rate swaps were in a loss position with a total fair value of $598 thousand, which was reported in accounts payable and accrued expenses on the consolidated balance sheet. During fiscal years 2018 and 2017, $515 thousand and $134 thousand, respectively, were reclassified from AOCI as an increase to interest expense and no hedge ineffectiveness was recognized in the consolidated statements of income during either period. At September 30, 2018, the Company estimates that $755 thousand will be reclassified as a decrease to interest expense during the next 12 months. The Bank has minimum collateral posting thresholds with its derivative counterparty and posts collateral on a daily basis. The Bank held cash collateral of $10.0 million at September 30, 2018 and posted cash collateral of $731 thousand at September 30, 2017.
FHLB borrowings are secured by certain qualifying loans pursuant to a blanket collateral agreement with FHLB and certain securities, when necessary. Per FHLB's lending guidelines, total FHLB borrowings cannot exceed 40% of a borrowing institution's regulatory total assets without the pre-approval of FHLB senior management. In July 2018, the president of FHLB approved an increase, through July 2019, in the Bank's borrowing limit to 55% of Bank Call Report total assets. At September 30, 2018, the ratio of the par value of the Bank's FHLB borrowings to the Bank's Call Report total assets was 23%. At times, the Bank's FHLB borrowings to the Bank's Call Report total assets may be in excess of 40% due to the leverage strategy.
Repurchase Agreements - At September 30, 2018 and 2017, the Company had repurchase agreements outstanding in the amount of $100.0 million and $200.0 million, respectively, with a weighted average contractual rate of 2.53% and 2.94% respectively. The repurchase agreements are included in other borrowings on the consolidated balance sheet. All of the Company's repurchase agreements at September 30, 2018 and 2017 were fixed-rate. See Note 4 for information regarding the amount of securities pledged as collateral in conjunction with repurchase agreements. Securities are delivered to the party with whom each transaction is executed and the party agrees to resell the same securities to the Bank at the maturity of the agreement. The Bank retains the right to substitute similar or like securities throughout the terms of the agreements. The repurchase agreements and collateral are subject to valuation at current market levels and the Bank may ask for the return of excess collateral or be required to post additional collateral due to changes in the market values of these items. The Bank may also be required to post additional collateral as a result of principal payments received on the securities pledged.
116
Maturity of Borrowed Funds and Certificates of Deposit - The following table presents the scheduled maturity of FHLB advances, at par, repurchase agreements, and certificates of deposit as of September 30, 2018:
FHLB | Repurchase | Certificates | |||||||||
Advances | Agreements | of Deposit | |||||||||
Amount | Amount | Amount | |||||||||
(Dollars in thousands) | |||||||||||
2019 | $ | 875,000 | $ | — | $ | 1,229,859 | |||||
2020 | 350,000 | 100,000 | 812,885 | ||||||||
2021 | 550,000 | — | 372,331 | ||||||||
2022 | 200,000 | — | 401,527 | ||||||||
2023 | 100,000 | — | 119,313 | ||||||||
Thereafter | — | — | 1,142 | ||||||||
$ | 2,075,000 | $ | 100,000 | $ | 2,937,057 | ||||||
Junior Subordinated Debentures and Trust-Preferred Securities - In conjunction with the CCB acquisition, the Company acquired $10.1 million of mandatorily redeemable capital trust-preferred securities that were previously issued by CCB-sponsored trusts (the "Trusts") to third-party investors. The Company also acquired $302 thousand of common equity securities that were issued by the Trusts which is included in other assets on the consolidated balance sheet. The proceeds from such securities were invested in junior subordinated debentures issued by CCB. The junior subordinated debentures are included in other borrowings on the consolidated balance sheet.
The terms of the trust-preferred securities are identical to those of the junior subordinated debentures. The trust-preferred securities are subject to mandatory redemption upon repayment of the junior subordinated debentures at their stated maturity dates or earlier redemption in an amount equal to their liquidation amount plus accumulated and unpaid distributions to the date of redemption. The Company guarantees the payment of distributions and payments for redemption or liquidation of the trust-preferred securities to the extent of funds held by the Trusts.
The junior subordinated debentures are unsecured with interest distributions payable quarterly. Of the $10.1 million, $6.2 million bear interest at 10.6% with a maturity date of September 7, 2030 and $3.9 million bear interest at three-month London Interbank Offered Rate ("LIBOR") plus 3.45% (5.82% at September 30, 2018) with a maturity date of June 26, 2032. The Company intends to redeem the trust-preferred securities and related junior subordinated debentures during fiscal year 2019.
10. INCOME TAXES
Income tax expense for the years ended September 30, 2018, 2017, and 2016 consisted of the following:
2018 | 2017 | 2016 | |||||||||
(Dollars in thousands) | |||||||||||
Current: | |||||||||||
Federal | $ | 26,007 | $ | 38,127 | $ | 33,298 | |||||
State | 3,512 | 4,734 | 4,677 | ||||||||
29,519 | 42,861 | 37,975 | |||||||||
Deferred: | |||||||||||
Federal | (5,956 | ) | 712 | 286 | |||||||
State | 1,416 | 210 | 184 | ||||||||
(4,540 | ) | 922 | 470 | ||||||||
$ | 24,979 | $ | 43,783 | $ | 38,445 | ||||||
117
The Tax Act made significant changes to the U.S. corporate income tax laws, such as a permanent reduction in the federal corporate income tax rate from 35% to 21% effective January 1, 2018, bonus depreciation that will allow full expensing of qualified property, and other changes to and/or limitations on certain corporate income tax deductions. As required by Section 15 of the Internal Revenue Code, the Company had a blended statutory federal income tax rate of 24.5% for the year ended September 30, 2018, which is based on the applicable income tax rates prior to and subsequent to January 1, 2018 and the number of days in the fiscal year. In accordance with GAAP, the Company revalued its deferred tax assets and liabilities as of December 22, 2017 to account for the future impact of a lower federal income tax rate. The revaluation of the Company's deferred tax assets and liabilities resulted in a $7.5 million reduction in income tax expense during the December 31, 2017 quarter and a corresponding reduction in the Company's net deferred tax liability. During the December 31, 2017 quarter, management reviewed the carrying value of the Bank's low income housing partnership investments in relation to the remaining tax benefits, considering the reduction in the corporate income tax rate, and determined there was no impairment present.
The Company's effective tax rates were 20.2%, 34.2%, and 31.5% for the years ended September 30, 2018, 2017, and 2016, respectively. The decrease in the effective tax rate for the year ended September 30, 2018 was due primarily to the revaluation of the Company's deferred tax assets and liabilities along with a lower blended statutory federal tax rate as a result of the enactment of the Tax Act. The differences between such effective rates and the statutory Federal income tax rate computed on income before income tax expense resulted from the following:
2018 | 2017 | 2016 | ||||||||||||||||||
Amount | % | Amount | % | Amount | % | |||||||||||||||
(Dollars in thousands) | ||||||||||||||||||||
Federal income tax expense | ||||||||||||||||||||
computed at statutory Federal rate | $ | 30,392 | 24.5 | % | $ | 44,772 | 35.0 | % | $ | 42,679 | 35.0 | % | ||||||||
Increases (decreases) in taxes resulting from: | ||||||||||||||||||||
State taxes, net of Federal tax effect | 3,986 | 3.2 | 3,452 | 2.7 | 3,308 | 2.7 | ||||||||||||||
Deferred tax liability remeasurement, net | (7,498 | ) | (6.0 | ) | — | — | — | — | ||||||||||||
Low income housing tax credits, presented net of proportional amortization in 2018 and 2017 | (500 | ) | (0.4 | ) | (2,468 | ) | (2.0 | ) | (4,815 | ) | (4.0 | ) | ||||||||
ESOP related expenses, net | (790 | ) | (0.6 | ) | (1,052 | ) | (0.8 | ) | (1,127 | ) | (0.9 | ) | ||||||||
Other | (611 | ) | (0.5 | ) | (921 | ) | (0.7 | ) | (1,600 | ) | (1.3 | ) | ||||||||
$ | 24,979 | 20.2 | % | $ | 43,783 | 34.2 | % | $ | 38,445 | 31.5 | % | |||||||||
Deferred income tax expense represents the change in deferred income tax assets and liabilities excluding the tax effects of the change in net unrealized gain (loss) on AFS securities and interest rate swaps and changes in the market value of restricted stock between the grant date and vesting date. The sources of these differences and the tax effect of each as of September 30, 2018, 2017, and 2016 were as follows:
2018 | 2017 | 2016 | |||||||||
(Dollars in thousands) | |||||||||||
ACL | $ | 1,827 | $ | 185 | $ | 480 | |||||
Salaries, deferred compensation and employee benefits | 897 | 437 | (143 | ) | |||||||
Low income housing partnerships | 604 | 285 | (318 | ) | |||||||
FHLB stock dividends | (7,692 | ) | 4 | (1,357 | ) | ||||||
Premises and equipment | (122 | ) | 14 | 1,593 | |||||||
Other, net | (54 | ) | (3 | ) | 215 | ||||||
$ | (4,540 | ) | $ | 922 | $ | 470 | |||||
118
The components of the net deferred income tax liabilities as of September 30, 2018 and 2017 were as follows:
2018 | 2017 | ||||||
(Dollars in thousands) | |||||||
Deferred income tax assets: | |||||||
Salaries, deferred compensation and employee benefits | $ | 1,686 | $ | 2,583 | |||
Net purchase discounts related to acquired loans | 1,456 | — | |||||
ESOP compensation | 1,206 | 1,724 | |||||
Unrealized loss on AFS securities | 960 | — | |||||
Low income housing partnerships | 874 | 1,478 | |||||
ACL | — | 711 | |||||
Other | 3,154 | 2,621 | |||||
Gross deferred income tax assets | 9,336 | 9,117 | |||||
Valuation allowance | (1,822 | ) | (1,795 | ) | |||
Gross deferred income tax asset, net of valuation allowance | 7,514 | 7,322 | |||||
Deferred income tax liabilities: | |||||||
FHLB stock dividends | 15,550 | 23,242 | |||||
Premises and equipment | 5,983 | 6,105 | |||||
Deposit intangible | 2,567 | — | |||||
Unrealized gain on interest rate swap | 2,353 | — | |||||
ACL | 1,116 | — | |||||
Unrealized gain on AFS securities | — | 2,000 | |||||
Other | 1,198 | 433 | |||||
Gross deferred income tax liabilities | 28,767 | 31,780 | |||||
Net deferred tax liabilities | $ | 21,253 | $ | 24,458 | |||
The State of Kansas allows for a bad debt deduction on savings and loan institutions' privilege tax returns of up to 5% of Kansas taxable income. Due to the low level of net loan charge-offs experienced by the Bank historically, the Bank's bad debt deduction on the Kansas privilege tax return has been in excess of actual net charge-offs for several years resulting in a state deferred tax liability. At September 30, 2018, the state deferred tax liability associated with ACL was in excess of the federal deferred tax asset.
The Company assesses the available positive and negative evidence surrounding the recoverability of its deferred tax assets and applies its judgment in estimating the amount of valuation allowance necessary under the circumstances. At both September 30, 2018 and 2017, the Company had a valuation allowance of $1.8 million related to the net operating losses generated by the Company's consolidated Kansas corporate income tax return. The companies included in the consolidated Kansas corporate income tax return are the holding company, Capitol Funds, Inc. and Capital City Investments, Inc., as the Bank files a Kansas privilege tax return. Based on the nature of the operations of the holding company, Capitol Funds, Inc. and Capital City Investments, Inc., management believes there will not be sufficient taxable income to fully utilize the deferred tax assets noted above; therefore, a valuation allowance has been recorded for the related amounts at September 30, 2018 and 2017.
Accounting Standards Codification ("ASC") 740 Income Taxes prescribes a process by which a tax position taken, or expected to be taken, on an income tax return is determined based upon the technical merits of the position, along with whether the tax position meets a more-likely-than-not-recognition threshold, to determine the amount, if any, of unrecognized tax benefits to recognize in the financial statements. Estimated penalties and interest related to unrecognized tax benefits are included in income tax expense in the consolidated statements of income. For the year ended September 30, 2018 and 2017,
119
the Company had no unrecognized tax benefits. For the year ended September 30, 2016, the Company's unrecognized tax benefits, estimated penalties and interest, and related activities were insignificant.
The Company files income tax returns in the U.S. federal jurisdiction and the state of Kansas, as well as other states where it has either established nexus under an economic nexus theory or has exceeded enumerated nexus thresholds based on the amount of interest income derived from sources within a given state. With few exceptions, the Company is no longer subject to U.S. federal and state examinations by tax authorities for fiscal years before 2015.
11. EMPLOYEE STOCK OWNERSHIP PLAN
The ESOP trust acquired 3,024,574 shares (6,846,728 shares post-corporate reorganization) of common stock in the Company's initial public offering and 4,726,000 shares of common stock in the Company's corporate reorganization in December of 2010. Both acquisitions of common stock were made with proceeds from loans from the Company, secured by shares of the Company's stock purchased in each offering. The Bank has agreed to make cash contributions to the ESOP trust on an annual basis sufficient to enable the ESOP trust to make the required annual loan payments to the Company on September 30 of each year. The loan for the shares acquired in the initial public offering matured on September 30, 2013. The loan for the shares acquired in the corporate reorganization matures on September 30, 2040.
As annual loan payments are made on September 30, shares are released from collateral and allocated to qualified employees based on the proportion of their qualifying compensation to total qualifying compensation. On September 30, 2018, 165,198 shares were released from collateral. On September 30, 2019, 165,198 shares will be released from collateral. As ESOP shares are committed to be released from collateral, the Company records compensation expense. Dividends on unallocated ESOP shares are applied to the debt service payments of the loan secured by the unallocated shares. Dividends on unallocated ESOP shares in excess of the debt service payment are recorded as compensation expense and distributed to participants or participants' ESOP accounts. Compensation expense related to the ESOP was $2.9 million for the year ended September 30, 2018, $3.3 million for the year ended September 30, 2017, and $3.0 million for the year ended September 30, 2016. Of these amounts, $541 thousand, $784 thousand, and $522 thousand related to the difference between the market price of the Company's stock when the shares were acquired by the ESOP trust and the average market price of the Company's stock during the years ended September 30, 2018, 2017, and 2016, respectively. The amount included in compensation expense for dividends on unallocated ESOP shares in excess of the debt service payments was $688 thousand, $833 thousand, and $813 thousand for the years ended September 30, 2018, 2017, and 2016, respectively.
Shares may be withdrawn from the ESOP trust due to diversification (a participant may begin to diversify at least 25% of their ESOP shares at age 50), retirement, termination, or death of the participant. The following is a summary of shares held in the ESOP trust as of September 30, 2018 and 2017:
2018 | 2017 | ||||||
(Dollars in thousands) | |||||||
Allocated ESOP shares | 4,339,002 | 4,369,840 | |||||
Unreleased ESOP shares | 3,634,356 | 3,799,554 | |||||
Total ESOP shares | 7,973,358 | 8,169,394 | |||||
Fair value of unreleased ESOP shares | $ | 46,302 | $ | 55,853 | |||
120
12. STOCK-BASED COMPENSATION
The Company has a Stock Option Plan, a Restricted Stock Plan, and an Equity Incentive Plan, all of which are considered share-based plans. The Stock Option Plan and Restricted Stock Plan expired in April 2015. No additional grants can be made from these two plans; however awards granted under these two plans remain outstanding until they are individually vested, forfeited or expire. The objectives of the Equity Incentive Plan are to provide additional compensation to certain officers, directors and key employees by facilitating their acquisition of stock interest in the Company and enable the Company to retain personnel of experience and ability in key positions of responsibility.
Stock Option Plans – There are currently 504,195 stock options outstanding as a result of grants awarded from the Stock Option Plan. The Equity Incentive Plan had 5,907,500 stock options originally eligible to be granted and, as of September 30, 2018, the Company had 4,184,316 stock options still available for future grants under this plan. This plan will expire in January 2027 and no additional grants may be made after expiration, but awards granted under this plan remain outstanding until they are individually vested, forfeited, or expire.
The Company may issue incentive and nonqualified stock options under the Equity Incentive Plan. The Company may also award stock appreciation rights, although no stock appreciation rights have been awarded to date. The incentive stock options expire no later than 10 years from the date of grant, and the nonqualified stock options expire no later than 15 years from the date of grant. The vesting period of the stock options under the Equity Incentive Plan generally has ranged from three to five years. The stock option exercise price cannot be less than the market value at the date of the grant as defined by each plan. The fair value of stock option grants is estimated on the date of the grant using the Black-Scholes option pricing model.
At September 30, 2018, the Company had 1,210,374 stock options outstanding with a weighted average exercise price of $13.33 per option and a weighted average contractual life of 4.3 years, and 1,161,374 options exercisable with a weighted average exercise price of $13.37 per option and a weighted average contractual life of 4.2 years. The exercise price may be paid in cash, shares of common stock, or a combination of both. New shares are issued by the Company upon the exercise of stock options.
Compensation expense attributable to stock option awards during the years ended September 30, 2018, 2017, and 2016 totaled $71 thousand, $118 thousand, and $335 thousand, respectively. The fair value of stock options vested during the years ended September 30, 2018, 2017, and 2016 was $77 thousand, $174 thousand, and $652 thousand, respectively. As of September 30, 2018, the total future compensation cost related to non-vested stock options not yet recognized in the consolidated statements of income was $61 thousand, and the weighted average period over which these awards are expected to be recognized was 1.2 years.
Restricted Stock Plans – The Equity Incentive Plan had 2,363,000 shares originally eligible to be granted as restricted stock and, as of September 30, 2018, the Company had 1,738,750 shares available for future grants of restricted stock under this plan. This plan will expire in January 2027 and no additional grants may be made after expiration, but awards granted under this plan remain outstanding until they are individually vested or forfeited. The vesting period of the restricted stock awards under the Equity Incentive Plan has generally ranged from three to five years. At September 30, 2018, the Company had 53,150 unvested restricted stock shares with a weighted average grant date fair value of $13.48 per share.
Compensation expense is calculated based on the fair market value of the common stock at the date of the grant, as defined by the plan, and is recognized over the vesting time period. Compensation expense attributable to restricted stock awards during the years ended September 30, 2018, 2017, and 2016 totaled $301 thousand, $388 thousand, and $787 thousand, respectively. The fair value of restricted stock that vested during the years ended September 30, 2018, 2017, and 2016 totaled $294 thousand, $563 thousand, and $1.6 million, respectively. As of September 30, 2018 there was $572 thousand of unrecognized compensation cost related to unvested restricted stock to be recognized over a weighted average period of 2.7 years.
121
13. COMMITMENTS AND CONTINGENCIES
The following table summarizes the Bank's loan commitments as of September 30, 2018 and 2017:
2018 | 2017 | ||||||
(Dollars in thousands) | |||||||
Originate fixed-rate | $ | 46,645 | $ | 33,528 | |||
Originate adjustable-rate | 25,228 | 9,861 | |||||
Purchase/participate fixed-rate | 122,418 | 74,104 | |||||
Purchase/participate adjustable-rate | 10,085 | 52,453 | |||||
$ | 204,376 | $ | 169,946 | ||||
Commitments to originate loans are commitments to lend to a customer. Commitments to purchase/participate in loans represent commitments to purchase loans from correspondent lenders on a loan-by-loan basis or participate in commercial real estate loans with a lead bank. The Bank evaluates each borrower's creditworthiness on a case-by-case basis. Commitments generally have expiration dates or other termination clauses and one-to four-family loan commitments may require the payment of a rate lock fee. Some of the commitments are expected to expire without being fully drawn upon; therefore, the amount of total commitments disclosed in the table above does not necessarily represent future cash requirements. As of September 30, 2018 and 2017, there were no significant loan-related commitments that met the definition of derivatives or commitments to sell mortgage loans. As of September 30, 2018 and 2017, the Bank had approved but unadvanced lines of credit of $246.1 million and $240.0 million, respectively.
Upon the acquisition of CCB, the Company assumed certain standby letters of credit, which are conditional commitments to guarantee the performance of a customer to a third party. Most guarantees have one-year terms. The credit risk involved in issuing letters of credit is essentially the same as that involved in extending loan facilities to customers. At September 30, 2018, the Company had approximately $1.2 million in outstanding standby letters of credit, and no amounts have been recorded as liabilities for the Company's potential obligations under these agreements.
In the normal course of business, the Company and its subsidiary are named defendants in various lawsuits and counterclaims. In the opinion of management, after consultation with legal counsel, none of the currently pending suits are expected to have a materially adverse effect on the Company's consolidated financial statements for the year ended September 30, 2018, or future periods.
14. REGULATORY CAPITAL REQUIREMENTS
The Bank and the Company are subject to various regulatory capital requirements administered by the federal banking agencies. Failure to meet minimum capital requirements can initiate certain mandatory and, possibly additional discretionary, actions by regulators that, if undertaken, could have a material adverse effect on the Company's financial statements. Under regulatory capital adequacy guidelines, the Company and Bank must meet specific capital guidelines that involve quantitative measures of the Company's and Bank's assets, liabilities, and certain off-balance sheet items as calculated under regulatory accounting practices. Additionally, the Bank must meet specific capital guidelines to be considered well capitalized per the regulatory framework for prompt corrective action. The Company's and Bank's capital amounts and classifications are also subject to qualitative judgments by regulators about components, risk weightings, and other factors.
Generally, savings institutions, such as the Bank, may make capital distributions during any calendar year equal to the earnings of the previous two calendar years and current year-to-date earnings. It is generally required that the Bank remain well capitalized before and after the proposed distribution. The Company's ability to pay dividends is dependent, in part, upon its ability to obtain capital distributions from the Bank. So long as the Bank continues to remain well capitalized after each capital distribution and operates in a safe and sound manner, it is management's belief that the regulators will continue to allow the Bank to distribute its net income to the Company, although no assurance can be given in this regard.
In conjunction with the Company's corporate reorganization in December 2010, a "liquidation account" was established for the benefit of certain depositors of the Bank in an amount equal to Capitol Federal Savings Bank MHC's ownership interest in the retained earnings of Capitol Federal Financial as of June 30, 2010. As of September 30, 2018, the balance of this
122
liquidation account was $145.4 million. Under applicable federal banking regulations, neither the Company nor the Bank is permitted to pay dividends on its capital stock to its stockholders if stockholders' equity would be reduced below the amount of the liquidation account at that time.
The Bank and the Company must maintain certain minimum capital ratios as set forth in the table below for capital adequacy purposes. Effective January 1, 2016, the Company and Bank were required to maintain a capital conservation buffer above certain minimum capital ratios for capital adequacy purposes in order to avoid certain restrictions on capital distributions and other payments including dividends, share repurchases, and certain compensation. The required capital conservation buffer is being phased in over a four year period by increasing the required buffer amount by 0.625% each year. The capital conservation buffer was 1.875% at September 30, 2018 and 1.25% at September 30, 2017. At September 30, 2018 and 2017, the Bank and Company exceeded the capital conservation buffer requirement. Once fully phased-in, which will be on January 1, 2019 for the Company and Bank, the organization must maintain a balance of capital that exceeds by more than 2.5% each of the minimum risk-based capital ratios in order to satisfy the requirement. Management believes, as of September 30, 2018, that the Bank and Company meet all capital adequacy requirements to which they are subject and there were no conditions or events subsequent to September 30, 2018 that would change the Bank's or Company's category.
To Be Well | ||||||||||||||||||||
Capitalized | ||||||||||||||||||||
Under Prompt | ||||||||||||||||||||
For Capital | Corrective Action | |||||||||||||||||||
Actual | Adequacy Purposes | Provisions | ||||||||||||||||||
Amount | Ratio | Amount | Ratio | Amount | Ratio | |||||||||||||||
(Dollars in thousands) | ||||||||||||||||||||
Bank | ||||||||||||||||||||
As of September 30, 2018 | ||||||||||||||||||||
Tier 1 leverage | $ | 1,202,125 | 13.0 | % | $ | 370,559 | 4.0 | % | $ | 463,199 | 5.0 | % | ||||||||
Common Equity Tier 1 ("CET1") capital | 1,202,125 | 25.1 | 215,764 | 4.5 | 311,659 | 6.5 | ||||||||||||||
Tier 1 capital | 1,202,125 | 25.1 | 287,685 | 6.0 | 383,580 | 8.0 | ||||||||||||||
Total capital | 1,210,589 | 25.2 | 383,580 | 8.0 | 479,475 | 10.0 | ||||||||||||||
As of September 30, 2017 | ||||||||||||||||||||
Tier 1 leverage | 1,201,863 | 10.8 | 444,877 | 4.0 | 556,097 | 5.0 | ||||||||||||||
CET1 capital | 1,201,863 | 27.2 | 199,181 | 4.5 | 287,706 | 6.5 | ||||||||||||||
Tier 1 capital | 1,201,863 | 27.2 | 265,575 | 6.0 | 354,100 | 8.0 | ||||||||||||||
Total capital | 1,210,261 | 27.3 | 354,100 | 8.0 | 442,625 | 10.0 | ||||||||||||||
Company | ||||||||||||||||||||
As of September 30, 2018 | ||||||||||||||||||||
Tier 1 leverage | 1,381,791 | 14.9 | 370,475 | 4.0 | N/A | N/A | ||||||||||||||
CET1 capital | 1,381,791 | 28.6 | 215,793 | 4.5 | N/A | N/A | ||||||||||||||
Tier 1 capital | 1,381,791 | 28.8 | 287,724 | 6.0 | N/A | N/A | ||||||||||||||
Total capital | 1,390,255 | 29.0 | 383,632 | 8.0 | N/A | N/A | ||||||||||||||
As of September 30, 2017 | ||||||||||||||||||||
Tier 1 leverage | 1,365,395 | 12.3 | 444,785 | 4.0 | N/A | N/A | ||||||||||||||
CET1 capital | 1,365,395 | 30.8 | 199,195 | 4.5 | N/A | N/A | ||||||||||||||
Tier 1 capital | 1,365,395 | 30.8 | 265,594 | 6.0 | N/A | N/A | ||||||||||||||
Total capital | 1,373,793 | 31.0 | 354,125 | 8.0 | N/A | N/A | ||||||||||||||
123
15. FAIR VALUE OF FINANCIAL INSTRUMENTS
Fair Value Measurements – The Company uses fair value measurements to record fair value adjustments to certain financial instruments and to determine fair value disclosures in accordance with ASC 820 and ASC 825. The Company's AFS securities and interest rate swaps are recorded at fair value on a recurring basis. Additionally, from time to time, the Company may be required to record at fair value other financial instruments on a non-recurring basis, such as OREO and loans individually evaluated for impairment. These non-recurring fair value adjustments involve the application of lower of cost or fair value accounting or write-downs of individual financial instruments.
The Company groups its financial instruments at fair value in three levels based on the markets in which the financial instruments are traded and the reliability of the assumptions used to determine fair value. These levels are:
• | Level 1 - Valuation is based upon quoted prices for identical instruments traded in active markets. |
• | Level 2 - Valuation is based upon quoted prices for similar instruments in active markets, quoted prices for identical or similar instruments in markets that are not active, and model-based valuation techniques for which all significant assumptions are observable in the market. |
• | Level 3 - Valuation is generated from model-based techniques that use significant assumptions not observable in the market. These unobservable assumptions reflect the Company's own estimates of assumptions that market participants would use in pricing the financial instrument. Valuation techniques include the use of option pricing models, discounted cash flow models, and similar techniques. The results cannot be determined with precision and may not be realized in an actual sale or immediate settlement of the financial instrument. |
The Company bases its fair values on the price that would be received from the sale of a financial instrument in an orderly transaction between market participants at the measurement date under current market conditions. The Company maximizes the use of observable inputs and minimizes the use of unobservable inputs when measuring fair value.
The following is a description of valuation methodologies used for financial instruments measured at fair value on a recurring basis.
AFS Securities - The Company's AFS securities portfolio is carried at estimated fair value. The majority of the securities within the AFS portfolio were issued by GSEs. The Company primarily uses prices obtained from third party pricing services to determine the fair value of its securities. On a quarterly basis, management corroborates a sample of prices obtained from the third party pricing service for Level 2 securities by comparing them to an independent source. If the price provided by the independent source varies by more than a predetermined percentage from the price received from the third party pricing service, then the variance is researched by management. The Company did not have to adjust prices obtained from the third party pricing service when determining the fair value of its securities during the years ended September 30, 2018 and 2017. The Company's major security types, based on the nature and risks of the securities, are:
• | GSE Debentures - Estimated fair values are based on a discounted cash flow method. Cash flows are determined by taking any embedded options into consideration and are discounted using current market yields for similar securities. (Level 2) |
• | MBS - Estimated fair values are based on a discounted cash flow method. Cash flows are determined based on prepayment projections of the underlying mortgages and are discounted using current market yields for benchmark securities. (Level 2) |
• | Municipal Bonds - Estimated fair values are based on a discounted cash flow method. Cash flows are determined by taking any embedded options into consideration and are discounted using current market yields for securities with similar credit profiles. (Level 2) |
• | Trust Preferred Securities - Estimated fair values are based on a discounted cash flow method. Cash flows are determined by taking prepayment and underlying credit considerations into account. The discount rates are derived from secondary trades and bid/offer prices. (Level 3) |
124
Interest Rate Swaps - The Company's interest rate swaps are designated as cash flow hedges and are reported at fair value in other assets on the consolidated balance sheet if in a gain position, and in accounts payable and accrued expenses if in a loss position, with any unrealized gains and losses, net of taxes, reported as AOCI in stockholders' equity. See "Note 9. Deposits and Borrowed Funds" for additional information. The estimated fair value of the interest rates swaps are obtained from the counterparty and are determined using a discounted cash flow analysis using observable market-based inputs. On a quarterly basis, management corroborates the estimated fair values by internally calculating the estimated fair value using a discounted cash flow analysis using independent observable market-based inputs from a third party. The Company did not make any adjustments to the estimated fair value during the years ended September 30, 2018 and 2017. (Level 2)
The following tables provide the level of valuation assumption used to determine the carrying value of the Company's financial instruments measured at fair value on a recurring basis at the dates presented. The Company did not have any liabilities that were measured at fair value at September 30, 2018.
September 30, 2018 | |||||||||||||||
Quoted Prices | Significant | Significant | |||||||||||||
in Active Markets | Other Observable | Unobservable | |||||||||||||
Carrying | for Identical Assets | Inputs | Inputs | ||||||||||||
Value | (Level 1) | (Level 2) | (Level 3) | ||||||||||||
(Dollars in thousands) | |||||||||||||||
Assets: | |||||||||||||||
AFS Securities: | |||||||||||||||
MBS | $ | 445,090 | $ | — | $ | 445,090 | $ | — | |||||||
GSE debentures | 265,398 | — | 265,398 | — | |||||||||||
Municipal bonds | 4,126 | — | 4,126 | — | |||||||||||
714,614 | — | 714,614 | — | ||||||||||||
Interest rate swaps | 9,685 | — | 9,685 | — | |||||||||||
$ | 724,299 | $ | — | $ | 724,299 | $ | — | ||||||||
September 30, 2017 | |||||||||||||||
Quoted Prices | Significant | Significant | |||||||||||||
in Active Markets | Other Observable | Unobservable | |||||||||||||
Carrying | for Identical Assets | Inputs | Inputs | ||||||||||||
Value | (Level 1) | (Level 2) | (Level 3) | ||||||||||||
(Dollars in thousands) | |||||||||||||||
Assets: | |||||||||||||||
AFS Securities: | |||||||||||||||
GSE debentures | $ | 270,729 | $ | — | $ | 270,729 | $ | — | |||||||
MBS | 141,516 | — | 141,516 | — | |||||||||||
Municipal bonds | 1,535 | — | 1,535 | — | |||||||||||
Trust preferred securities | 2,051 | — | — | 2,051 | |||||||||||
$ | 415,831 | $ | — | $ | 413,780 | $ | 2,051 | ||||||||
Liabilities: | |||||||||||||||
Interest rate swaps | $ | 598 | $ | — | $ | 598 | $ | — | |||||||
125
The Company sold its Level 3 AFS security during fiscal year 2018, received proceeds of $2.1 million, and recognized a gain on sale of $9 thousand, which is included in other non-interest income in the Company's consolidated statement of income. The Company's Level 3 AFS securities had no activity during fiscal years 2017 and 2016 except for principal repayments of $88 thousand and $97 thousand, respectively, and (decreases)/increases in net unrealized losses included in other comprehensive income of $(218) thousand and $61 thousand, respectively.
The following is a description of valuation methodologies used for significant financial instruments measured at fair value on a non-recurring basis.
Loans Receivable – The amount of loans individually evaluated for impairment on a non-recurring basis during fiscal years 2018 and 2017 that were still held in the portfolio as of September 30, 2018 and 2017 was $6.7 million and $18.4 million, respectively. All of these loans were secured by residential real estate and were individually evaluated to determine if the carrying value of the loan was in excess of the fair value of the collateral, less estimated selling costs of 10%. Fair values were estimated through current appraisals. Management does not adjust or apply a discount to the appraised value, except for the estimated sales cost noted above. The primary significant unobservable input for loans individually evaluated for impairment was the appraisal. Fair values of loans individually evaluated for impairment cannot be determined with precision and may not be realized in an actual sale or immediate settlement of the loan and, as such, are classified as Level 3. Based on this evaluation, the Bank charged-off all loss amounts as of September 30, 2018 and 2017; therefore, the fair value was equal to the carrying value and there was no ACL related to these loans.
OREO – OREO primarily represents real estate acquired as a result of foreclosure or by deed in lieu of foreclosure and is carried at lower of cost or fair value. Also included in OREO at September 30, 2018 was $889 thousand of OREO acquired from CCB. The fair value for the OREO not acquired from CCB is estimated through current appraisals or listing prices, less estimated selling costs of 10%. Management does not adjust or apply a discount to the appraised value or listing price, except for the estimated sales costs noted above. The primary significant unobservable input for OREO was the appraisal or listing price. Fair values of foreclosed property cannot be determined with precision and may not be realized in an actual sale of the property and, as such, are classified as Level 3. The fair value of OREO measured on a non-recurring basis during fiscal years 2018 and 2017 that was still held in the portfolio as of September 30, 2018 and 2017 was $1.9 million and $1.4 million, respectively. The carrying value of the properties equaled the fair value of the properties at September 30, 2018 and 2017.
Fair Value Disclosures – The Company determined estimated fair value amounts using available market information and a variety of valuation methodologies as of the dates presented. Considerable judgment is required to interpret market data to develop the estimates of fair value. The estimates presented are not necessarily indicative of amounts the Company would realize from a current market exchange at subsequent dates.
126
The carrying amounts and estimated fair values of the Company's financial instruments, at the dates presented, were as follows:
2018 | 2017 | ||||||||||||||
Estimated | Estimated | ||||||||||||||
Carrying | Fair | Carrying | Fair | ||||||||||||
Amount | Value | Amount | Value | ||||||||||||
(Dollars in thousands) | |||||||||||||||
Assets: | |||||||||||||||
Cash and cash equivalents | $ | 139,055 | $ | 139,055 | $ | 351,659 | $ | 351,659 | |||||||
AFS securities | 714,614 | 714,614 | 415,831 | 415,831 | |||||||||||
HTM securities | 612,318 | 601,071 | 827,738 | 833,009 | |||||||||||
Loans receivable | 7,514,485 | 7,418,026 | 7,195,071 | 7,354,100 | |||||||||||
FHLB stock | 99,726 | 99,726 | 100,954 | 100,954 | |||||||||||
Interest rate swaps | 9,685 | 9,685 | — | — | |||||||||||
Liabilities: | |||||||||||||||
Deposits | 5,603,354 | 5,569,591 | 5,309,868 | 5,318,249 | |||||||||||
FHLB borrowings | 2,174,981 | 2,145,477 | 2,173,808 | 2,182,841 | |||||||||||
Other borrowings | 110,052 | 109,465 | 200,000 | 202,004 | |||||||||||
Interest rate swaps | — | — | 598 | 598 | |||||||||||
The following methods and assumptions were used to estimate the fair value of the financial instruments:
Cash and cash equivalents - The carrying amounts of cash and cash equivalents are considered to approximate their fair value due to the nature of the financial assets. (Level 1)
HTM securities - Estimated fair values of securities are based on one of three methods: (1) quoted market prices where available; (2) quoted market prices for similar instruments if quoted market prices are not available; (3) unobservable data that represents the Bank's assumptions about items that market participants would consider in determining fair value where no market data is available. HTM securities are carried at amortized cost. (Level 2)
Loans receivable - The fair value of one- to four-family loans and home equity loans are generally estimated using the present value of expected future cash flows, assuming future prepayments and using discount factors determined by prices obtained from securitization markets, less a discount for the cost of servicing and lack of liquidity. The estimated fair value of the Bank's commercial and consumer loans are based on the expected future cash flows assuming future prepayments and discount factors based on current offering rates. (Level 3)
FHLB stock - The carrying value and estimated fair value of FHLB stock equals cost, which is based on redemption at par value. (Level 1)
Interest rate swaps - The fair value of the interest rate swaps was determined using discounted cash flow analysis using observable market-based inputs. (Level 2)
Deposits - The estimated fair value of demand deposits, savings, and money market accounts is the amount payable on demand at the reporting date. The estimated fair value of these deposits at September 30, 2018 and 2017 was $2.67 billion and $2.40 billion, respectively. (Level 1) The fair value of certificates of deposit is estimated by discounting future cash flows using current LIBOR. The estimated fair value of certificates of deposit at September 30, 2018 and 2017 was $2.90 billion and $2.92 billion, respectively. (Level 2)
127
FHLB borrowings and other borrowings - The fair value of fixed-maturity borrowed funds is estimated by discounting estimated future cash flows using current offer rates. (Level 2) The carrying value of FHLB line of credit is considered to approximate its fair value due to the nature of the financial liability. (Level 1) The fair value of the junior subordinated debentures is estimated as the payoff value, as management intends to redeem these borrowings during fiscal year 2019. (Level 1)
16. OTHER COMPREHENSIVE INCOME
The following tables present the changes in the components of AOCI, net of tax, for the years ended September 30, 2018 and 2017. During the year ended September 30, 2016, the only changes in AOCI, net of tax, were related to unrealized gains (losses) on AFS securities and there were no amounts reclassified from AOCI.
For the Year Ended September 30, 2018 | |||||||||||
Unrealized | Unrealized | ||||||||||
Gains (Losses) | Gains (Losses) | ||||||||||
on AFS | on Cash Flow | Total | |||||||||
Securities | Hedges | AOCI | |||||||||
(dollars in thousands) | |||||||||||
Beginning balance | $ | 3,290 | $ | (372 | ) | $ | 2,918 | ||||
Other comprehensive income (loss), before reclassifications | (6,741 | ) | 6,981 | 240 | |||||||
Amount reclassified from AOCI | — | 515 | 515 | ||||||||
Other comprehensive income (loss) | (6,741 | ) | 7,496 | 755 | |||||||
Reclassification of certain income tax effects related to adoption of ASU 2018-02 | 461 | 206 | 667 | ||||||||
Ending balance | $ | (2,990 | ) | $ | 7,330 | $ | 4,340 | ||||
For the Year Ended September 30, 2017 | |||||||||||
Unrealized | Unrealized | ||||||||||
Gains (Losses) | Gains (Losses) | ||||||||||
on AFS | on Cash Flow | Total | |||||||||
Securities | Hedges | AOCI | |||||||||
(dollars in thousands) | |||||||||||
Beginning balance | $ | 5,915 | $ | — | $ | 5,915 | |||||
Other comprehensive income (loss), before reclassifications | (2,625 | ) | (506 | ) | (3,131 | ) | |||||
Amount reclassified from AOCI | — | 134 | 134 | ||||||||
Other comprehensive income (loss) | (2,625 | ) | (372 | ) | (2,997 | ) | |||||
Ending balance | $ | 3,290 | $ | (372 | ) | $ | 2,918 | ||||
128
17. SELECTED QUARTERLY FINANCIAL DATA (UNAUDITED)
The following table presents summarized quarterly data for each of the years indicated for the Company.
First | Second | Third | Fourth | ||||||||||||||||
Quarter | Quarter | Quarter | Quarter | Total | |||||||||||||||
(Dollars and counts in thousands, except per share amounts) | |||||||||||||||||||
2018 | |||||||||||||||||||
Total interest and dividend income | $ | 80,644 | $ | 81,774 | $ | 82,161 | $ | 77,313 | $ | 321,892 | |||||||||
Net interest and dividend income | 49,374 | 49,889 | 49,433 | 50,077 | 198,773 | ||||||||||||||
Provision for credit losses | — | — | — | — | — | ||||||||||||||
Net income | 31,836 | 23,330 | 22,372 | 21,389 | 98,927 | ||||||||||||||
Basic EPS | 0.24 | 0.17 | 0.17 | 0.16 | 0.73 | ||||||||||||||
Diluted EPS | 0.24 | 0.17 | 0.17 | 0.16 | 0.73 | ||||||||||||||
Dividends declared per share | 0.375 | 0.085 | 0.335 | 0.085 | 0.88 | ||||||||||||||
Average number of basic shares outstanding | 134,373 | 134,428 | 134,484 | 135,500 | 134,698 | ||||||||||||||
Average number of diluted shares outstanding | 134,467 | 134,475 | 134,530 | 135,556 | 134,759 | ||||||||||||||
2017 | |||||||||||||||||||
Total interest and dividend income | $ | 75,322 | $ | 77,660 | $ | 79,630 | $ | 80,574 | $ | 313,186 | |||||||||
Net interest and dividend income | 47,306 | 49,054 | 49,364 | 49,658 | 195,382 | ||||||||||||||
Provision for credit losses | — | — | — | — | — | ||||||||||||||
Net income | 20,578 | 21,587 | 21,370 | 20,602 | 84,137 | ||||||||||||||
Basic EPS | 0.15 | 0.16 | 0.16 | 0.15 | 0.63 | ||||||||||||||
Diluted EPS | 0.15 | 0.16 | 0.16 | 0.15 | 0.63 | ||||||||||||||
Dividends declared per share | 0.375 | 0.085 | 0.335 | 0.085 | 0.88 | ||||||||||||||
Average number of basic shares outstanding | 133,697 | 134,066 | 134,254 | 134,314 | 134,082 | ||||||||||||||
Average number of diluted shares outstanding | 133,950 | 134,259 | 134,360 | 134,404 | 134,244 | ||||||||||||||
129
18. PARENT COMPANY FINANCIAL INFORMATION (PARENT COMPANY ONLY)
The Company serves as the holding company for the Bank (see "Note 1. Summary of Significant Accounting Policies"). The Company's (parent company only) balance sheets at the dates presented, and the related statements of income and cash flows for each of the years presented are as follows:
BALANCE SHEETS | |||||||
SEPTEMBER 30, 2018 and 2017 | |||||||
(Dollars in thousands, except per share amounts) | |||||||
2018 | 2017 | ||||||
ASSETS: | |||||||
Cash and cash equivalents | $ | 137,684 | $ | 120,785 | |||
Investment in the Bank | 1,221,706 | 1,204,781 | |||||
Note receivable - ESOP | 41,285 | 42,557 | |||||
Other assets | 690 | 365 | |||||
Income taxes receivable, net | 486 | — | |||||
TOTAL ASSETS | $ | 1,401,851 | $ | 1,368,488 | |||
LIABILITIES: | |||||||
Income taxes payable, net | $ | — | $ | 88 | |||
Junior subordinated debentures | 10,052 | — | |||||
Accounts payable and accrued expenses | 177 | 52 | |||||
Deferred income tax liabilities, net | — | 35 | |||||
Total liabilities | 10,229 | 175 | |||||
STOCKHOLDERS' EQUITY: | |||||||
Preferred stock, $.01 par value; 100,000,000 shares authorized, no shares issued or outstanding | — | — | |||||
Common stock, $.01 par value; 1,400,000,000 shares authorized, 141,225,516 and 138,223,835 | |||||||
shares issued and outstanding as of September 30, 2018 and 2017, respectively | 1,412 | 1,382 | |||||
Additional paid-in capital | 1,207,644 | 1,167,368 | |||||
Unearned compensation - ESOP | (36,343 | ) | (37,995 | ) | |||
Retained earnings | 214,569 | 234,640 | |||||
AOCI, net of tax | 4,340 | 2,918 | |||||
Total stockholders' equity | 1,391,622 | 1,368,313 | |||||
TOTAL LIABILITIES AND STOCKHOLDERS' EQUITY | $ | 1,401,851 | $ | 1,368,488 | |||
130
STATEMENTS OF INCOME | |||||||||||
YEARS ENDED SEPTEMBER 30, 2018, 2017, and 2016 | |||||||||||
(Dollars in thousands) | |||||||||||
2018 | 2017 | 2016 | |||||||||
INTEREST AND DIVIDEND INCOME: | |||||||||||
Dividend income from the Bank | $ | 134,540 | $ | 120,215 | $ | 117,513 | |||||
Interest income from other investments | 1,951 | 1,715 | 1,725 | ||||||||
Total interest and dividend income | 136,491 | 121,930 | 119,238 | ||||||||
INTEREST EXPENSE | 62 | — | — | ||||||||
NET INTEREST INCOME | 136,429 | 121,930 | 119,238 | ||||||||
NON-INTEREST EXPENSE: | |||||||||||
Salaries and employee benefits | 1,031 | 896 | 827 | ||||||||
Regulatory and outside services | 1,129 | 247 | 261 | ||||||||
Other non-interest expense | 581 | 561 | 558 | ||||||||
Total non-interest expense | 2,741 | 1,704 | 1,646 | ||||||||
INCOME BEFORE INCOME TAX EXPENSE AND EQUITY IN | |||||||||||
EXCESS OF DISTRIBUTION OVER EARNINGS OF SUBSIDIARY | 133,688 | 120,226 | 117,592 | ||||||||
INCOME TAX (BENEFIT) EXPENSE | (179 | ) | 4 | 28 | |||||||
INCOME BEFORE EQUITY IN EXCESS OF | |||||||||||
DISTRIBUTION OVER EARNINGS OF SUBSIDIARY | 133,867 | 120,222 | 117,564 | ||||||||
EQUITY IN EXCESS OF DISTRIBUTION OVER EARNINGS OF SUBSIDIARY | (34,940 | ) | (36,085 | ) | (34,070 | ) | |||||
NET INCOME | $ | 98,927 | $ | 84,137 | $ | 83,494 | |||||
131
STATEMENTS OF CASH FLOWS | |||||||||||
YEARS ENDED SEPTEMBER 30, 2018, 2017, and 2016 | |||||||||||
(Dollars in thousands) | |||||||||||
2018 | 2017 | 2016 | |||||||||
CASH FLOWS FROM OPERATING ACTIVITIES: | |||||||||||
Net income | $ | 98,927 | $ | 84,137 | $ | 83,494 | |||||
Adjustments to reconcile net income to net cash provided by | |||||||||||
operating activities: | |||||||||||
Equity in excess of distribution over earnings of subsidiary | 34,940 | 36,085 | 34,070 | ||||||||
Depreciation of equipment | 30 | 29 | 30 | ||||||||
Provision for deferred income taxes | (35 | ) | (2 | ) | 2 | ||||||
Changes in: | |||||||||||
Other assets | (53 | ) | (5 | ) | 1 | ||||||
Income taxes receivable/payable | (145 | ) | (40 | ) | 445 | ||||||
Accounts payable and accrued expenses | (257 | ) | (22 | ) | 14 | ||||||
Net cash provided by operating activities | 133,407 | 120,182 | 118,056 | ||||||||
CASH FLOWS FROM INVESTING ACTIVITIES: | |||||||||||
Principal collected on notes receivable from ESOP | 1,272 | 1,233 | 1,194 | ||||||||
Cash acquired from acquisition | 18 | — | — | ||||||||
Net cash provided by investing activities | 1,290 | 1,233 | 1,194 | ||||||||
CASH FLOWS FROM FINANCING ACTIVITIES: | |||||||||||
Net payment from subsidiary related to restricted stock awards | 253 | 293 | 473 | ||||||||
Cash dividends paid | (118,312 | ) | (117,963 | ) | (111,767 | ) | |||||
Stock options exercised | 261 | 8,843 | 4,070 | ||||||||
Net cash used in financing activities | (117,798 | ) | (108,827 | ) | (107,224 | ) | |||||
NET INCREASE IN CASH AND CASH EQUIVALENTS | 16,899 | 12,588 | 12,026 | ||||||||
CASH AND CASH EQUIVALENTS: | |||||||||||
Beginning of year | 120,785 | 108,197 | 96,171 | ||||||||
End of year | $ | 137,684 | $ | 120,785 | $ | 108,197 | |||||
SUPPLEMENTAL DISCLOSURE OF NONCASH INVESTING AND FINANCING ACTIVITIES: | |||||||||||
Common stock issued for acquisition | $ | 39,113 | $ | — | $ | — | |||||
Capital contribution to subsidiary in conjunction with acquisition of CCB | $ | 48,798 | $ | — | $ | — | |||||
132
Item 9. Changes in and Disagreements With Accountants on Accounting and Financial Disclosure
None.
Item 9A. Controls and Procedures
Evaluation of Disclosure Controls and Procedures
Our management, with the participation of our Chief Executive Officer and our Chief Financial Officer, evaluated the Company's disclosure controls and procedures (as defined in Rule 13a-15(e) and 15d-15(e) under the Securities Exchange Act of 1934, as amended, the "Act") as of September 30, 2018. Based upon this evaluation, our Chief Executive Officer and our Chief Financial Officer have concluded that, as of September 30, 2018, such disclosure controls and procedures were effective to ensure that information required to be disclosed by the Company in the reports it files or submits under the Act is accumulated and communicated to the Company's management (including the Chief Executive Officer and Chief Financial Officer) to allow timely decisions regarding required disclosure, and is recorded, processed, summarized, and reported within the time periods specified in the SEC's rules and forms.
Internal Control Over Financial Reporting
Management of the Company is responsible for establishing and maintaining adequate internal control over financial reporting (as defined in Rule 13a-15(f) and 15d-15(f) under the Act). The Company's internal control system is a process designed to provide reasonable assurance to the Company's management and Board of Directors regarding the preparation and fair presentation of published financial statements.
The Company's internal control over financial reporting includes policies and procedures that pertain to the maintenance of records that, in reasonable detail, accurately and fairly reflect transactions and dispositions of assets; provide reasonable assurances that transactions are recorded as necessary to permit preparation of financial statements in accordance with GAAP, and that receipts and expenditures are being made only in accordance with authorizations of management and the directors of the Company; and provide reasonable assurance regarding prevention or untimely detection of unauthorized acquisition, use, or disposition of the Company's assets that could have a material effect on the Company's financial statements.
All internal control systems, no matter how well designed, have inherent limitations. Therefore, even those systems determined to be effective can provide only reasonable assurance with respect to financial reporting. Further, because of changes in conditions, the effectiveness of any system of internal control may vary over time. The design of any internal control system also factors in resource constraints and consideration for the benefit of the control relative to the cost of implementing the control. Because of these inherent limitations in any system of internal control, management cannot provide absolute assurance that all control issues and instances of fraud within the Company have been detected.
Management assessed the effectiveness of the Company's internal control over financial reporting as of September 30, 2018. In making this assessment, management used the criteria set forth by the Committee of Sponsoring Organizations of the Treadway Commission in Internal Control - Integrated Framework (2013). Management has concluded that the Company maintained an effective system of internal control over financial reporting based on these criteria as of September 30, 2018. SEC guidance permits companies to exclude certain acquisitions from the assessment of internal control over financial reporting during the first year following the acquisition. Accordingly, management excluded from its assessment the internal control over financial reporting at CCB, which was acquired on August 31, 2018 and whose financial statements constitute approximately 4% of loans receivable, net, 6% of deposits, 5% of total assets, 1% of net interest income and 0% of net income of the consolidated financial statement amounts as of and for the fiscal year ended September 30, 2018.
The Company's independent registered public accounting firm, Deloitte & Touche LLP, who audited the consolidated financial statements included in the Company's annual report, has issued an audit report on the Company's internal control over financial reporting as of September 30, 2018 and it is included in Item 8.
Changes in Internal Control Over Financial Reporting
There have been no changes in the Company's internal control over financial reporting (as defined in Rule 13a-15(f) and 15d-15(f) under the Act) that occurred during the Company's quarter ended September 30, 2018 that have materially affected, or are reasonably likely to materially affect, the Company's internal control over financial reporting.
Item 9B. Other Information
None.
133
PART III
Item 10. Directors, Executive Officers and Corporate Governance
Information required by this item concerning the Company's directors and compliance with Section 16(a) of the Act is incorporated herein by reference from the definitive proxy statement for the Annual Meeting of Stockholders to be held in January 2019, a copy of which will be filed not later than 120 days after the close of the fiscal year. Pursuant to General Instruction G(3), information concerning executive officers of the Company is included in Part I, under the caption "Executive Officers of the Registrant" of this Form 10-K.
Information required by this item regarding the audit committee of the Company's Board of Directors, including information regarding the audit committee financial experts serving on the committee, is incorporated herein by reference from the definitive proxy statement for the Annual Meeting of Stockholders to be held in January 2019, a copy of which will be filed not later than 120 days after the close of the fiscal year.
Code of Ethics
We have adopted a written code of ethics within the meaning of Item 406 of SEC Regulation S-K that applies to our principal executive officer and senior financial officers, and to all of our other employees and our directors, a copy of which is available free of charge in the Investor Relations section of our website, www.capfed.com.
Item 11. Executive Compensation
Information required by this item concerning compensation is incorporated herein by reference from the definitive proxy statement for the Annual Meeting of Stockholders to be held in January 2019, a copy of which will be filed not later than 120 days after the close of the fiscal year.
Item 12. Security Ownership of Certain Beneficial Owners and Management and Related Stockholder Matters
Information required by this item concerning security ownership of certain beneficial owners and management is incorporated herein by reference from the definitive proxy statement for the Annual Meeting of Stockholders to be held in January 2019, a copy of which will be filed not later than 120 days after the close of the fiscal year.
The following table sets forth information as of September 30, 2018 with respect to compensation plans under which shares of our common stock may be issued.
Equity Compensation Plan Information | |||||||||||
Number of Shares | |||||||||||
Remaining Available | |||||||||||
for Future Issuance | |||||||||||
Number of Shares | Under Equity | ||||||||||
to be issued upon | Weighted Average | Compensation Plans | |||||||||
Exercise of | Exercise Price of | (Excluding Shares | |||||||||
Outstanding Options, | Outstanding Options, | Reflected in the | |||||||||
Plan Category | Warrants and Rights | Warrants and Rights | First Column) | ||||||||
Equity compensation plans | |||||||||||
approved by stockholders | 1,210,374 | $ | 13.33 | 5,923,066 | (1) | ||||||
Equity compensation plans not | |||||||||||
approved by stockholders | N/A | N/A | N/A | ||||||||
1,210,374 | $ | 13.33 | 5,923,066 | ||||||||
(1) | This amount includes 1,738,750 shares available for future grants of restricted stock under the Equity Incentive Plan. |
134
Item 13. Certain Relationships and Related Transactions, and Director Independence
Information required by this item concerning certain relationships, related transactions and director independence is incorporated herein by reference from the definitive proxy statement for the Annual Meeting of Stockholders to be held in January 2019, a copy of which will be filed not later than 120 days after the close of the fiscal year.
Item 14. Principal Accounting Fees and Services
Information required by this item concerning principal accounting fees and services is incorporated herein by reference from the definitive proxy statement for the Annual Meeting of Stockholders to be held in January 2019, a copy of which will be filed not later than 120 days after the close of the fiscal year.
PART IV
Item 15. Exhibits, Financial Statement Schedules
(a) The following is a list of documents filed as part of this report:
(1) Financial Statements:
The following financial statements are included under Part II, Item 8 of this Form 10-K:
1. | Reports of Independent Registered Public Accounting Firm. |
2. | Consolidated Balance Sheets as of September 30, 2018 and 2017. |
3. | Consolidated Statements of Income for the Years Ended September 30, 2018, 2017, and 2016. |
4. | Consolidated Statements of Comprehensive Income for the Years Ended September 30, 2018, 2017, and 2016. |
5. | Consolidated Statements of Stockholders' Equity for the Years Ended September 30, 2018, 2017, and 2016. |
6. | Consolidated Statements of Cash Flows for the Years Ended September 30, 2018, 2017, and 2016. |
7. | Notes to Consolidated Financial Statements for the Years Ended September 30, 2018, 2017, and 2016. |
(2) Financial Statement Schedules:
All financial statement schedules have been omitted as the information is not required under the related instructions or is not applicable.
(3) Exhibits:
See "Index to Exhibits."
135
INDEX TO EXHIBITS
Exhibit Number | Document | |
Charter of Capitol Federal Financial, Inc., as filed on May 6, 2010, as Exhibit 3(i) to Capitol Federal Financial, Inc.'s Registration Statement on Form S-1 (File No. 333-166578) and incorporated herein by reference | ||
Bylaws of Capitol Federal Financial, Inc., as amended, filed on September 30, 2016, as Exhibit 3.2 to Form 8-K for Capitol Federal Financial Inc. and incorporated herein by reference | ||
Form of Change of Control Agreement with each of John B. Dicus, Kent G. Townsend, and Rick C. Jackson filed on January 20, 2011 as Exhibit 10.1 to the Registrant's Current Report on Form 8-K and incorporated herein by reference | ||
Form of Change of Control Agreement with each of Natalie G. Haag and Carlton A. Ricketts filed on November 29, 2012 as Exhibit 10.1(iv) to the Registrant's Annual Report on Form 10-K and incorporated herein by reference | ||
Form of Change of Control Agreement with Daniel L. Lehman filed on November 29, 2016 as Exhibit 10.1(v) to the Registrant's Annual Report on Form 10-K and incorporated herein by reference | ||
Form of Change of Control Agreement with Robert D. Kobbeman | ||
Employment Agreement with Robert D. Kobbeman | ||
Capitol Federal Financial's 2000 Stock Option and Incentive Plan (the "Stock Option Plan") filed on April 13, 2000 as Appendix A to Capitol Federal Financial's Revised Proxy Statement (File No. 000-25391) and incorporated herein by reference | ||
Capitol Federal Financial Deferred Incentive Bonus Plan, as amended | ||
Form of Incentive Stock Option Agreement under the Stock Option Plan filed on February 4, 2005 as Exhibit 10.5 to the December 31, 2004 Form 10-Q for Capitol Federal Financial and incorporated herein by reference | ||
Form of Non-Qualified Stock Option Agreement under the Stock Option Plan filed on February 4, 2005 as Exhibit 10.6 to the December 31, 2004 Form 10-Q for Capitol Federal Financial and incorporated herein by reference | ||
Description of Director Fee Arrangements | ||
Short-term Performance Plan filed on August 4, 2015 as Exhibit 10.10 to the Registrant's June 30, 2015 Form 10-Q and incorporated herein by reference | ||
Capitol Federal Financial, Inc. 2012 Equity Incentive Plan (the "Equity Incentive Plan") filed on December 22, 2011 as Appendix A to Capitol Federal Financial, Inc.'s Proxy Statement (File No. 001-34814) and incorporated herein by reference | ||
Form of Incentive Stock Option Agreement under the Equity Incentive Plan filed on February 6, 2012 as Exhibit 10.12 to the Registrant's December 31, 2011 Form 10-Q and incorporated herein by reference | ||
Form of Non-Qualified Stock Option Agreement under the Equity Incentive Plan filed on February 6, 2012 as Exhibit 10.13 to the Registrant's December 31, 2011 Form 10-Q and incorporated herein by reference | ||
Form of Stock Appreciation Right Agreement under the Equity Incentive Plan filed on February 6, 2012 as Exhibit 10.14 to the Registrant's December 31, 2011 Form 10-Q and incorporated herein by reference | ||
Form of Restricted Stock Agreement under the Equity Incentive Plan filed on February 6, 2012 as Exhibit 10.15 to the Registrant's December 31, 2011 Form 10-Q and incorporated herein by reference | ||
Calculations of Basic and Diluted Earnings Per Share (See "Part II, Item 8. Financial Statements and Supplementary Data – Notes to Consolidated Financial Statements – Note 3. Earnings Per Share") | ||
14 | Code of Ethics* | |
Subsidiaries of the Registrant | ||
Consent of Independent Registered Public Accounting Firm | ||
Certification pursuant to section 302 of the Sarbanes-Oxley Act of 2002 made by John B. Dicus, Chairman, President and Chief Executive Officer | ||
Certification pursuant to section 302 of the Sarbanes-Oxley Act of 2002 made by Kent G. Townsend, Executive Vice President, Chief Financial Officer and Treasurer | ||
Certification pursuant to 18 U.S.C. Section 1350, as adopted pursuant to Section 906 of the Sarbanes-Oxley Act of 2002 made by John B. Dicus, Chairman, President and Chief Executive Officer, and Kent G. Townsend, Executive Vice President, Chief Financial Officer and Treasurer | ||
101 | The following information from the Company's Annual Report on Form 10-K for the fiscal year ended September 30, 2018, filed with the SEC on November 29, 2018, has been formatted in eXtensible Business Reporting Language: (i) Consolidated Balance Sheets at September 30, 2018 and 2017, (ii) Consolidated Statements of Income for the fiscal years ended September 30, 2018, 2017, and 2016, (iii) Consolidated Statements of Comprehensive Income for the fiscal years ended September 30, 2018, 2017, and 2016, (iv) Consolidated Statement of Stockholders' Equity for the fiscal years ended September 30, 2018, 2017, and 2016, (v) Consolidated Statements of Cash Flows for the fiscal years ended September 30, 2018, 2017, and 2016, and (vi) Notes to the Consolidated Financial Statements | |
*May be obtained free of charge in the Investor Relations section of our website, www.capfed.com.
SIGNATURES
Pursuant to the requirements of Section 13 or 15(d) of the Securities Exchange Act of 1934, the Registrant has duly caused this report to be signed on its behalf by the undersigned, thereunto duly authorized.
CAPITOL FEDERAL FINANCIAL, INC. | |||
Date: November 29, 2018 | By: | /s/ John B. Dicus | |
John B. Dicus, Chairman, President and | |||
Chief Executive Officer | |||
(Principal Executive Officer) | |||
Pursuant to the requirements of the Securities Exchange Act of 1934, this report has been signed below by the following persons on behalf of the Registrant and in the capacities and on the date indicated. | |||
By: | /s/ John B. Dicus | By: | /s/ Reginald L. Robinson |
John B. Dicus, Chairman, President | Reginald L. Robinson, Director | ||
and Chief Executive Officer | Date: November 29, 2018 | ||
(Principal Executive Officer) | |||
Date: November 29, 2018 | By: | /s/ Michael T. McCoy, M.D. | |
Michael T. McCoy, M.D., Director | |||
By: | /s/ Kent G. Townsend | Date: November 29, 2018 | |
Kent G. Townsend, Executive Vice President, | |||
Chief Financial Officer and Treasurer | By: | /s/ James G. Morris | |
(Principal Financial Officer) | James G. Morris, Director | ||
Date: November 29, 2018 | Date: November 29, 2018 | ||
By: | /s/ Jeffrey R. Thompson | By: | /s/ Michel' P. Cole |
Jeffrey R. Thompson, Director | Michel' P. Cole, Director | ||
Date: November 29, 2018 | Date: November 29, 2018 | ||
By: | /s/ Jeffrey M. Johnson | By: | /s/ Tara D. Van Houweling |
Jeffrey M. Johnson, Director | Tara D. Van Houweling, First Vice President | ||
Date: November 29, 2018 | and Reporting Director | ||
(Principal Accounting Officer) | |||
By: | /s/ Morris J. Huey II | Date: November 29, 2018 | |
Morris J. Huey II, Director | |||
Date: November 29, 2018 | |||