Attached files
| file | filename |
|---|---|
| EX-32.1 - EXHIBIT 32.1 - Versum Materials, Inc. | vsmexhibit3219302018.htm |
| EX-31.2 - EXHIBIT 31.2 - Versum Materials, Inc. | vsmexhibit3129302018.htm |
| EX-31.1 - EXHIBIT 31.1 - Versum Materials, Inc. | vsmexhibit3119302018.htm |
| EX-23 - EXHIBIT 23 - Versum Materials, Inc. | vsmexhibit239302018.htm |
| EX-21 - EXHIBIT 21 - Versum Materials, Inc. | vsmexhibit219302018.htm |
| EX-18.1 - EXHIBIT 18.1 - Versum Materials, Inc. | vsmexhibit1819302018.htm |
| EX-10.19 - EXHIBIT 10.19 - Versum Materials, Inc. | vsmexhibit10199302018.htm |
UNITED STATES
SECURITIES AND EXCHANGE COMMISSION
WASHINGTON, D.C. 20549
FORM 10-K
(Mark One) | |
x | ANNUAL REPORT PURSUANT TO SECTION 13 OR 15(d) OF THE SECURITIES EXCHANGE ACT OF 1934 |
For the fiscal year ended September 30, 2018
or
¨ | TRANSITION REPORT PURSUANT TO SECTION 13 OR 15(d) OF THE SECURITIES EXCHANGE ACT OF 1934 |
For the transition period from __________ to __________
Commission file number 1-37644
VERSUM MATERIALS, INC.
(Exact name of registrant as specified in its charter)
Delaware | 47-5632014 | |
(State or other jurisdiction of incorporation or organization) | (I.R.S. Employer Identification No.) | |
8555 South River Parkway, Tempe, Arizona 85284
(Address of principal executive offices) (Zip code)
(602) 282-1000
(Registrant’s telephone number, including area code)
Securities registered pursuant to Section 12(b) of the Act:
Title of each class | Name of each exchange on which registered | |
Common Stock, par value $1.00 per share | New York Stock Exchange | |
Securities registered pursuant to Section 12(g) of the Act: None
Indicate by check mark if the registrant is a well-known seasoned issuer, as defined in Rule 405 of the Securities Act. | Yes | x | No | o |
Indicate by check mark if the registrant is not required to file reports pursuant to Section 13 or Section 15(d) of the Act. | Yes | ¨ | No | x |
Indicate by check mark whether the registrant (1) has filed all reports required to be filed by Section 13 or 15(d) of the Securities Exchange Act of 1934 during the preceding 12 months (or for such shorter period that the registrant was required to file such reports), and (2) has been subject to such filing requirements for the past 90 days. | Yes | x | No | ¨ |
Indicate by check mark whether the registrant has submitted electronically every Interactive Data File required to be submitted pursuant to Rule 405 of Regulation S-T (§232.405 of this chapter) during the preceding 12 months (or for such shorter period that the registrant was required to submit such files). | Yes | x | No | ¨ |
Indicate by check mark if disclosure of delinquent filers pursuant to Item 405 of Regulation S-K (§ 229.405) is not contained herein, and will not be contained, to the best of registrant’s knowledge, in definitive proxy or information statements incorporated by reference in Part III of this Form 10-K or any amendment to this Form 10-K. | x | |||
Indicate by check mark whether the registrant is a large accelerated filer, an accelerated filer, a non-accelerated filer, a smaller reporting company, or an emerging growth company. See the definitions of “large accelerated filer,” “accelerated filer,” “smaller reporting company,” and “emerging growth company” in Rule 12b-2 of the Exchange Act. | ||||||
Large accelerated filer | x | Accelerated filer | ¨ | |||
Non-accelerated filer | o | Smaller reporting company | ¨ | |||
Emerging Growth Company | o | |||||
If an emerging growth company, indicate by check mark if the registrant has elected not to use the extended transition period for complying with any new or revised financial accounting standards provided pursuant to Section 13(a) of the Exchange Act. o | ||||
Indicate by check mark whether the registrant is a shell company (as defined in Rule 12b-2 of the Act). | Yes | ¨ | No | x |
Based on the closing sale price as reported on the New York Stock Exchange, the aggregate market value of the voting common stock held by non-affiliates of the registrant as of the last business day of the registrant’s most recently completed second fiscal quarter, March 31, 2018, was approximately $2.9 billion. The registrant has no non-voting common stock.
At November 9, 2018, 109,033,906 shares of common stock, par value $1.00 per share, were outstanding.
DOCUMENTS INCORPORATED BY REFERENCE
Portions of the registrant’s definitive proxy statement relating to its 2019 Annual Meeting of Stockholders are incorporated by reference into Part III of this Annual Report on Form 10-K.
VERSUM MATERIALS, INC.
ANNUAL REPORT ON FORM 10-K
For the fiscal year ended September 30, 2018
TABLE OF CONTENTS
ITEM 16. | ||
1
All references in this Annual Report on Form 10-K, unless the context otherwise requires:
• | “Versum,” “Versum Materials,” “we,” “our,” “us” and “the company” refer to Versum Materials, Inc. and its consolidated subsidiaries for periods subsequent to the Separation and Distribution completed on October 1, 2016; |
• | “Air Products” refers to Air Products and Chemicals, Inc. and its consolidated subsidiaries, not including, for all periods following the Separation and Distribution, Versum. |
• | References to the “Separation” refer to the October 1, 2016 legal separation resulting in the allocation, transfer and assignment to Versum of the assets, liabilities and operations of Air Products’ Electronic Materials business and the creation, as a result of the Distribution, of a separate, publicly traded company, Versum. |
• | References to the “Distribution” refer to the distribution by Air Products to its stockholders completed on October 1, 2016, of 100% of the outstanding shares of Versum. |
CAUTIONARY STATEMENT CONCERNING FORWARD-LOOKING STATEMENTS
This Annual Report on Form 10-K contains certain “forward-looking statements” within the meaning of the safe harbor provisions of the U.S. Private Securities Litigation Reform Act of 1995, Section 27A of the Securities Act of 1933 and Section 21E of the Securities Exchange Act of 1934. Forward-looking statements may be identified by references to future periods, and include statements about our financial outlook or guidance; our business strategies, operating plans, anticipated growth rates and prospects, anticipated profitability and margins, sales expectations, future operating income and Adjusted EBITDA; our ability to continue successfully providing innovative solutions to customers through technology; estimates regarding future capital requirements; estimates of expenses and cost reduction efforts; estimates of future tax liability and effective tax rates; our ability to execute on our strategy, including our ability to enhance our portfolio positions through future organic and inorganic investments; our ability to meet customer demand; estimates of the size of the market for our products; forecasted industry capital spending and anticipated demand for our products and services; our ability to compete successfully as a leading materials supplier to the semiconductor industry and obtain next generation node opportunities; our successful and timely completion of various capital projects; and other matters. The words “believe,” “expect,” “anticipate,” “project,” “estimate,” “budget,” “continue,” “could,” “intend,” “may,” “plan,” “potential,” “predict,” “seek,” “should,” “will,” “would,” “objective,” “forecast,” “goal,” “guidance,” “outlook,” “target,” “opportunity” and similar expressions, among others, generally identify forward-looking statements, which are based on management’s reasonable expectations and assumptions as of the date the statements were made. In particular, information included in “Risk Factors,” “Business” and “Management’s Discussion and Analysis of Financial Condition and Results of Operations,” contain forward-looking statements. Actual results and the outcomes of future events may differ materially from those expressed or implied in the forward-looking statements because of a number of risks and uncertainties, including, without limitation, product supply versus demand imbalances in the semiconductor industry or in certain geographic markets may decrease the demand for our goods and services; our concentrated customer base; the dependence of our DS&S segment upon the capital expenditure cycles of our customers; our ability to continue technological innovation and successfully introduce new products to meet the evolving needs of our customers; our ability to protect and enforce our intellectual property rights and to avoid violating any third party intellectual property or technology rights; unexpected interruption of or shortages in our raw material supply; inability of sole source, limited source or qualified suppliers to deliver to us in a timely manner or at all; hazards associated with specialty chemical manufacturing, such as fires, explosions and accidents, could disrupt our operations or the operations of our suppliers or customers; increased competition and new product development by our competitors, changing customer needs and price changes in materials and components could result in declining demand for our products; operational, political and legal risks of our international operations; increased costs due to trade wars and the implementation of tariffs; the impact of recent changes in U.S. tax laws; the impact of changes in environmental and health and safety regulations, anticorruption enforcement, sanctions, import/export controls, tax and other legislation and regulations in the U.S. and other jurisdictions in which Versum Materials and its affiliates operate; our available cash and access to additional capital may be limited by substantial leverage and debt service obligations; uncertainty regarding the availability of financing to us in the future and the terms of such financing; agreements governing our indebtedness may restrict our current and future operations, and hamper our ability to respond to changes or to take certain actions; government regulation of raw materials, products and facilities may impact our product manufacturing processes, handling, storage, transportation, uses and applications; possible liability for contamination, personal injury or third party impacts if hazardous materials are released into the environment; cyber security threats may compromise our data or disrupt our information technology applications or services; fluctuation of currency exchange rates; costs and outcomes of litigation or regulatory investigations; the timing, impact, and other uncertainties of future acquisitions or divestitures; restrictions in our governing documents and of Delaware law may prevent or delay an acquisition of us; tax and other potential liabilities to Air Products
2
assumed in connection with the separation and spin-off; potential conflicts of interest between us and Air Products by our directors and officers; potential liabilities arising out of state and federal fraudulent conveyance laws and legal dividend requirements with respect to the Separation and Distribution and related internal reorganization transactions; and other risk factors described in “Business,” “Risk Factors,” and “Management’s Discussion and Analysis of Financial Condition and Results of Operations,” and in any of our subsequently filed Quarterly Reports on Form 10-Q, each as filed with the Securities and Exchange Commission (“SEC”) and available on the Internet at www.sec.gov. Versum Materials disclaims any obligation or undertaking to disseminate any updates or revisions to any forward-looking statements contained in this Annual Report on Form 10-K to reflect any change in assumptions, beliefs or expectations or any change in circumstances upon which any such forward-looking statements are based.
3
Part 1
Item 1. Business
OUR COMPANY
Versum is an independent public company listed under the symbol “VSM” on the New York Stock Exchange. We are a global provider of innovative solutions to the semiconductor and display industries with expertise in the development, manufacturing, transportation and handling of specialty materials. We employ expertise in molecular design and synthesis, purification, advanced analytics, formulation development and containers and delivery systems for the handling of high purity materials to deliver leading-edge solutions and critical process support to our customers. Versum’s business consists of two operating segments, Materials and Delivery Systems and Services (“DS&S”), under which we manage our operations and assess performance, and a Corporate segment. Our two operating segments are not aggregated, and are reported separately.
We are a leading global supplier of critical materials through our Materials segment, including organosilanes and organometallics deposition films, high purity specialty process gases, cleaners and etchants, and planarization slurries, and through equipment and services in our DS&S segment. Our technical capabilities enable us to foster strong customer relationships which are critical to collaborative development. Unique product positioning and a strong global infrastructure including flexible manufacturing and supply chain capabilities are fundamental to our businesses. Our Corporate segment includes certain administrative costs associated with operating a public company, non-core operating activities, foreign exchange gains and losses, and other income and expense that cannot be directly associated with the operating segments.
Throughout its history, the business has been known for innovative product development and as a safe, reliable and sustainable supplier of materials needed to fabricate semiconductors and displays. Our business is supported by an in-depth knowledge of the chemistries and technologies which underlie the manufacturing process for these electronic devices. We first invested in the electronic materials business to provide specialty gas supply to the semiconductor industry in the 1980s to address the emerging need for higher purity materials. Over the years, we have grown our business both organically and through acquisitions into a highly diversified supplier of materials for the industry.
We believe Versum is well positioned to benefit from secular growth trends and a leading position in the semiconductor materials market, supported by its broad product portfolio, global manufacturing and research infrastructure, product innovation capabilities, a strong new product pipeline and relatively low capital intensity. Our competitive strengths have enabled us to achieve strong earnings and cash flow. For the fiscal year ended September 30, 2018, our net sales were $1,372.3 million; operating income was $374.0 million, or 27.3% of sales; net income was $197.5 million; and Adjusted EBITDA was $445.4 million, or 32.5% of sales. For an explanation of Adjusted EBITDA and a reconciliation to generally accepted accounting principles in the United States of America ("GAAP") net income, see “Management’s Discussion and Analysis of Financial Condition and Results of Operations - Reconciliation of Non-GAAP Financial Measures” in Part II, Item 7 of this Annual Report on Form 10-K.
4
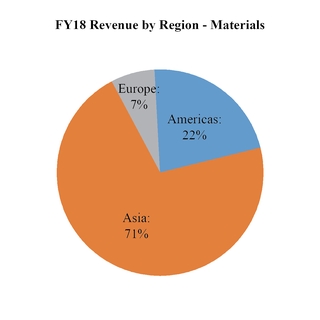
Our revenues by segment and destination region are as follows:
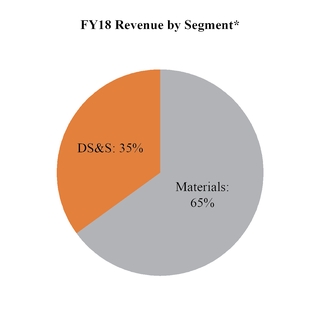
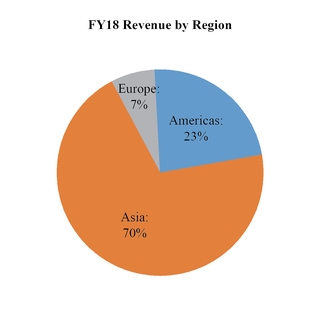
* Operating segments only, excludes corporate segment which is 0.2% of total revenue
Total Revenue $1,372.3 million
Our Competitive Strengths
Innovative Product Development
Collaborative product development, a high level of technical innovation, products vetted through customers’ rigorous qualification processes and safe, consistent and reliable supply and distribution have enabled the business to establish strong positions in key product areas. Using Versum products, semiconductor manufacturers create faster, smaller and more efficient devices for both the logic and memory market segments. Our innovative products deliver differentiated performance to our customers’ fabrication processes by enhancing their productivity, quality, and yield; yet they constitute in relative terms a small fraction of the overall costs to develop and manufacture their end product.
Longstanding Relationships with Key Industry Leaders
Versum has maintained long-term relationships, often spanning decades, with Integrated Device Manufacturers (“IDMs”), foundries and Original Equipment Manufacturers (“OEMs”). These collaborative relationships position us to understand the future requirements of our customers and to jointly develop innovative solutions that enable the development and manufacture of new products including next generation nodes. These relationships also position us to supply product delivery systems and on-site services to our customers.
Technology Leadership
To be an innovative supplier to the semiconductor industry requires a substantial long-term commitment to investing in technology. Our customers continually seek to introduce new generations of semiconductors and we collaborate with them to develop new molecules, formulations and technological improvements to satisfy their needs. Historically, over the past four years, approximately 27% of annual revenues in our Advanced Materials product lines of our Materials segment were based on new products or applications introduced within the last five years. Versum currently has approximately 1,700 patents worldwide and has a highly qualified workforce comprising approximately 470 research scientists, lab technicians and engineers that allow us to sustain our competitive advantage. We are also constructing a state-of-the-art laboratory in Korea to support our planarization business and enable us to better collaborate with our customers in Korea.
5
Positioned to Take Advantage of Secular Growth Trends
Our business supplies materials used in the manufacture of semiconductors and displays, supporting a wide range of electronic consumer products, providing us with a diversified portfolio of growth opportunities into the future. We believe we will continue to witness the proliferation of semiconductors and displays into durable goods and other devices and growth will be further enhanced by the following secular trends:
• | The continued drive for chip productivity through improved scaling, which we expect to drive the shift to new nodes, the need for new enabling materials and the use of more materials; |
• | Strong bit demand growth, which we expect will continue to fuel underlying growth in the memory market, first increasing the demand for legacy materials and then driving the need for new materials as structural complexity increases; |
• | The “Internet of Things”, cloud computing, 5G, and artificial intelligence need for data monitoring and storage which we expect will continue to drive the demand for semiconductors impacting both legacy and new materials demand; and |
• | Semiconductor growth in China and ultimately in other parts of the world, which we expect will drive increased demand for future innovation and materials. |
Strategically Located Global Manufacturing Footprint and Infrastructure
Versum has a well-established global infrastructure with fifteen strategically located manufacturing and seven research and development facilities in Asia and North America. We believe Versum’s global network of production and research facilities are geographically positioned to serve high growth areas and enable us to collaborate with our customers. Our manufacturing facilities include locations in the United States, South Korea, China and Taiwan.
Strong Financial Performance and Cash Flow Generation
Versum has a strong financial profile with net income of $197.5 million, operating margin of 27.3% and Adjusted EBITDA margin of 32.5% for the fiscal year ended September 30, 2018. We expect these strong margins to enable the business to service its debt obligations and generate significant cash flow to drive both future organic and inorganic growth. For an explanation of Adjusted EBITDA and Adjusted EBITDA Margin and a reconciliation to GAAP net income, see “Management’s Discussion and Analysis of Financial Condition and Results of Operations-Reconciliation of Non-GAAP Financial Measures” in Part II, Item 7 of this Annual Report on Form 10-K.
6
Net income attributable to Versum was $197.5 million in 2018, $193.3 million in 2017, and $209.3 million in 2016. Our Adjusted EBITDA and EBITDA margins are as follows:
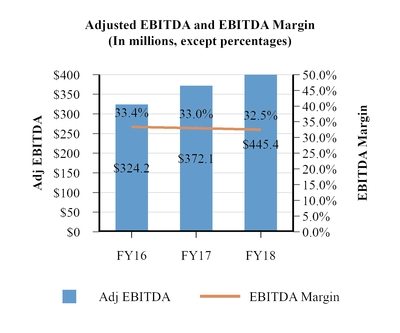
Capital expenditures for the business have averaged approximately $72 million per year over the last three years including maintenance capital to support the business of about 2.0% of sales. Given the anticipated increasing market demand for new products combined with our own increased opportunities to enhance our geographic, productivity and capacity positions, we increased our level of growth capital in fiscal year 2018 and expect to again spend more than historical levels in fiscal year 2019. The combination of strong operating margins and low maintenance capital needs should allow us to generate substantial cash flow to fund the increased level of expected growth capital opportunities.
Experienced Management Team
We have a strong management team which combines individuals with long-standing industry experience and leadership in specialty chemicals, materials and the semiconductor industry with key outside hires who bring a diverse perspective to the business from various other companies. Of our top seven senior leaders, four spent the majority of their careers with these businesses while three joined our team from other specialty chemicals companies. Guillermo Novo, our Chief Executive Officer, has 30 years of materials industry operating and executive experience at Rohm & Haas Company, Dow Chemical Company and Air Products.
Business Strategies
Drive Operational Excellence and Asset Efficiency
Driving operational excellence, including a commitment to safety, environmental stewardship and supply chain reliability, are critical to the success of our business. We maintain rigorous environmental, health and safety processes and believe excellence in safety performance translates to excellence in operational and financial performance. We also expect to continue to implement various initiatives to improve the efficiency, effectiveness and reliability of our operations including investing in state of the art manufacturing facilities, locating capacity and research capability close to our customers and continually globalizing our supply chain.
Maintain Strong Customer Focus
A key element of our success has been our ability to establish long-standing working relationships with most of the key semiconductor manufacturers as well as with OEMs. Our understanding and anticipation of our customer’s needs and our ability to develop innovative product solutions in a timely manner, together with providing safe and reliable supply, high
7
quality products and analytical capabilities, have been critical in developing these long-term relationships.
Leverage our Leadership to Drive Growth
We have invested approximately 4% of total sales in new technology, primarily for our Advanced Materials products, over the last three years and expect to increase this level of spending to deliver innovative solutions for our customers. We expect our leadership position, together with the strength of our product portfolio, to drive growth in the markets we compete in. We also believe there are significant opportunities for us to invest capital in strategic acquisitions to strengthen our businesses, broaden our product offerings and geographic positioning, and expand our technology portfolio. We continue to expand our technical presence to locations in closer proximity to our customers to enable us to increase collaboration.
Focus on Cash-Flow Generation
Versum has a successful track record of delivering strong financial results. Given the low capital intensity of our business, this results in significant cash flow generation. We believe our anticipated strong future cash flow will enable us to service our debt obligations, fund organic and inorganic growth opportunities, return capital to stockholders or reduce leverage.
Operating Segments
Materials Segment
The Materials segment provides leading edge specialty materials focusing on integrated circuit and flat-panel display customers. The products include specialty chemicals and materials utilized in the production of semiconductors, as well as high-purity specialty gases used in the semiconductor manufacturing process. These products include organosilanes, organometallics and other specialty precursors for thin film deposition, CMP slurries and post CMP cleans, formulated products for post etch and advanced packaging cleaning, process gases for deposition and metallization, chamber cleaning and etching, as well as high purity gases that are used in ion implantation to alter the electrical properties of thin films. The semiconductor industry accounts for more than 80% of segment sales. Materials operates in two product categories: Advanced Materials and Process Materials. The segment benefits from synergies across the business units, including serving the same customer base, developing joint market strategies, sharing common supply chain processes and infrastructure, and utilizing common commercial resources.
Through our global network, our Materials segment positions its research, manufacturing and technical support close to customer facilities, enabling supply chain optimization and rapid response times to product and service needs. Many of our products have undergone rigorous product performance and quality reviews by our customers, to be qualified for use in their products or manufacturing processes. Once these qualification processes are completed and our products are designated by our customers for use in their processes or products, it is often time consuming and costly for our customers to change suppliers. Our products perform critical tasks in customers’ products or manufacturing processes, yet typically represent a very small portion of the cost to manufacture the end products. Over nearly three decades, our Materials segment has developed strong customer relationships with the majority of the industry-leading IDMs, foundries and OEMs through joint product development and providing on-site service and technical personnel at our customers’ facilities.
8
Materials products are sold on a global basis, with revenue by business unit (Process Materials “PM” and Advanced Materials “AM”) and destination region as follows:
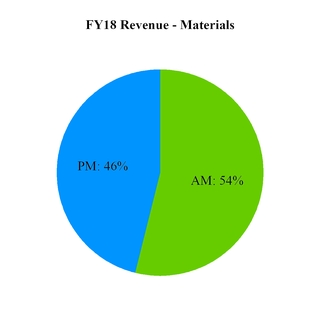
The Materials segment has approximately 830 employees, operates 12 production and 7 research and development facilities and serves more than 200 customers.
Materials Product Categories
Advanced Materials. Advanced Materials supplies products and services through three key product platforms that are employed in the fabrication of ICs:
• | Advanced deposition materials (“ADM”) products include high purity specialty gases and chemicals, such as organosilane and organometallic precursors that are used to deposit thin films which comprise an IC; |
• | Planarization (“PLA”) products include CMP slurries and post CMP cleans that are used to prepare chips with deposited thin films for the next stage of fabrication; and |
• | Surface prep and clean (“SP&C”) formulated products are designed to selectively etch and remove debris and contamination during multiple stages of the wafer fabrication process including advanced packaging. |
For fiscal year 2018, approximately 87% of our Advanced Materials sales are based on proprietary or patent-protected positions. Product innovation is a key differentiator for Advanced Materials. For example, an organosilane precursor, which we developed in collaboration with a leading OEM, is an enabler for self-aligned double patterning, a process that has allowed device size to decrease far beyond expectations using present day lithography. We believe the move to more advanced transistors continues to create the need for innovation in new deposition and polishing materials. Our shallow trench isolation CMP slurries are exceeding the requirements for dishing control, selectivity, removal rate, and most importantly a reduction in defects.
Advanced Materials has seven technology centers strategically located near our customers, with five in the United States and two in Asia. Our focused research and development efforts offer customers the opportunity to collaborate on the joint development of new materials, align new materials requirements with their product technology cycles and enhance the quality and scale of their specialty material needs.
In fiscal year 2019 we expect to continue to invest in enhancing our innovation capabilities including completing additional research and manufacturing capabilities in Korea.
9
Process Materials. Process Materials supplies products such as high-purity gases and chemicals utilized in the processes of cleaning, etching, doping, and film deposition for our semiconductor, displays and light emitting diode (“LED”) customers. Our cleaning and etchant gases, like nitrogen trifluoride (NF3) and hexafluorobutadiene (C4F6), are used for chamber cleaning and high aspect etching applications in the production of semiconductors. Our process gases for deposition and metallization, such as tungsten hexafluoride (WF6) are used in the process of depositing film layers to enable the continued advancement of the semiconductor industry. Our dopants such as arsine (AsH3) are used for ion implantation for semiconductors and our hydride gases such as ammonia (NH3) support applications in display and LEDs. Our Process Materials’ products are used in a wide variety of LCD and LED-based displays, and in logic and memory semiconductor production. We supply these products to our customers throughout the U.S., Asia and Europe.
Process materials leverages its global asset footprint and strong safety performance to be a reliable and sustainable supplier of high purity specialty gases and chemicals. In fiscal year 2019 we expect to invest to continue to improve our cost position and increase capacity in certain key products.
Delivery Systems & Services Segment
Our DS&S segment designs, manufactures, installs, operates, and maintains state-of-the-art chemical, gas and slurry delivery and distribution systems enabling the safe and cost efficient use of specialty gases and chemicals delivered directly to our customers’ manufacturing tools. Product development in this business is enhanced through close collaboration with our OEM customers as well as with the Advanced Materials and Process Materials businesses of our Materials segment.
In addition to the safe distribution of specialty gases and chemicals by our employees and equipment located at customer facilities, we monitor the purity of the materials from the source container through the point of use as well as build and maintain monitoring and control systems that facilitate real-time metrics management of critical customer process conditions.
The business provides turnkey installation during facility construction and startup as well as onsite operating services. We supply trained and dedicated technical experts to manage all aspects of the customer’s gas and chemical distribution and handling needs through our MEGASYS branded services group. The scope of services offered includes inventory management, material handling, gas and chemical container change-out, equipment operation, maintenance, repair, engineering and safety management.
DS&S Product Categories
Our DS&S segment consists of the following product categories:
Equipment (Gas, chemical and slurry delivery systems): We develop, design, manufacture and sell bulk gas, specialty gas and specialty chemical cabinets and systems that are critical to managing the delivery of key materials into the semiconductor manufacturing process. Our systems help our customers improve their productivity, manage the application and use of our products and other materials, and enable our customers to handle materials in a safe manner. We also provide flow and temperature control systems and analytical systems to capture key data for our customers.
Installation Services: We offer resources to assist both new and refurbished semiconductor fabs in the design, installation, startup, and commissioning of the gases and specialty materials delivery systems and quality assurance. Our scope includes project management for installation and startup of the gas and chemical delivery systems, and inventory management. In addition, we sell spare parts, equipment upgrades, equipment maintenance and provide training.
10
On-Site Services (MEGASYS): We offer on-site services to assist our customers in managing their inventory of gases and chemicals, including ordering, product changes and monitoring, quality assurance, operating our delivery systems, and managing the bulk gas and specialty gas operations. Our employees are physically located at our customers’ fabs and are critical to the safe and efficient operation of such facilities. MEGASYS employs more than 400 employees servicing more than 30 customer locations and has approximately 120 engineers to assist our customers with their delivery system and service needs.
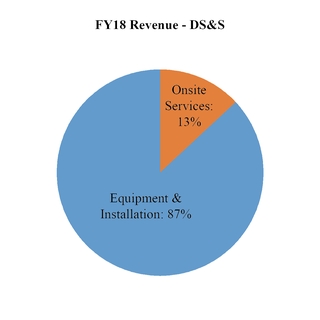
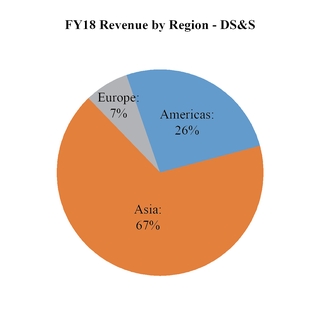
Our products are sold on a global basis, with revenue by product category and destination region as follows:
The DS&S segment has approximately 900 employees and operates three production facilities with one in the U.S. and two in Asia. In fiscal year 2018 we commenced production of certain delivery systems at our new facility in China.
Corporate Segment
Our Corporate segment includes certain administrative costs associated with operating a public company, non-core operating activities, foreign exchange gains and losses, and other income and expense that cannot be directly associated with our operating segments. Assets in the Corporate segment include cash and deferred tax assets.
11
Products and End Uses
Segment | Key Products | Applications | End Uses | ||||||
Materials | Ÿ | CMP Slurries | Ÿ | PLA via polishing | Ÿ | Semiconductors | |||
Ÿ | Post-CMP Cleans | Ÿ | Cleaning after polishing | Ÿ | Semiconductors | ||||
Ÿ | Organosilanes | Ÿ | Thin film deposition | Ÿ | Semiconductors | ||||
Ÿ | Organometallics | Ÿ | Thin film deposition | Ÿ | Semiconductors | ||||
Ÿ | Formulated Cleans | Ÿ | Post-etch cleaning, advanced packaging | Ÿ | Semiconductors | ||||
Ÿ | High-Purity Gases for Deposition & Metallization | Ÿ | Thin film deposition | Ÿ | Semiconductors | ||||
Ÿ | Chamber Cleaning & Etching Gases | Ÿ | Residue removal from deposition chambers and etching high aspect ratio features | Ÿ | Semiconductors and Displays | ||||
Ÿ | Ion Implantation Gases | Ÿ | Doping thin films to alter electrical properties | Ÿ | Semiconductors and LED | ||||
Delivery Systems | Ÿ | Ultra-High Purity Gases and Chemical Supply Systems | Ÿ | Safe storage and delivery of gases, liquids and solids | Ÿ | Semiconductors, Displays and LEDs | |||
Ÿ | Slurry Delivery Systems | Ÿ | Mixing and delivery of CMP slurries | Ÿ | Semiconductors | ||||
Competition. The semiconductor market is global in scope with nearly all major semiconductor manufacturers having operations in multiple countries. We serve our customers across four continents and participate in the specialty gases and materials space, spanning six of the seven critical processes steps required for semiconductor manufacturing.
The competitive landscape is varied, from multinational chemical companies to small regional, narrow-portfolio focused companies. Overall, competitive trends are supporting the need for localized, cost competitive supply chains, which is especially critical for larger volume customers.
Because of our breadth, we do not believe there are any global competitors that compete with us across the full range of our product offerings. Many of our competitors are local companies that participate in only a few products or in specific geographies. While there are other broad-based materials suppliers, many are concentrated in specific product areas, such as CMP pads, photoresists or liquid crystals. Key competitors include Adeka, Air Liquide, Cabot Microelectronics, Dow/DuPont, Entegris, FujiFilm, Hyosung, Avantor, Merck EM, and SK Materials.
Customers
We primarily serve the semiconductor industry for both memory and logic. The semiconductor industry is characterized by large-scale global players and, while we serve a variety of customers from smaller technology firms to OEMs to multinational semiconductor companies, the majority of our sales are concentrated to these large scale global players. In fiscal 2018, the top 20 customers accounted for 81% of our total sales with the top four, Intel, Samsung, SK Hynix and Taiwan Semiconductor Manufacturing Company accounting for 53% of sales.
Sales, Marketing & Distribution
We sell our products and services globally through our direct sales force primarily focused on end use customers but also to OEMs. The direct sales force is organized based on geographic region and business units with coordinated teams for key industry players. As of September 30, 2018, total in-house sales forces consisted of approximately 200 personnel worldwide.
12
Raw Materials
We purchase raw materials and chemical intermediates from a large number of third parties. Major requirements for our key raw materials and energy are typically satisfied pursuant to contractual agreements ranging from purchase orders to long-term relationships with suppliers. We are generally not dependent on any one supplier for a significant portion of our raw material requirements, but due to the specialty nature of our products there are a limited or a sole number of suppliers that are qualified to supply raw materials for use in our customers’ products. Where we have limited sources of supply, or a sole supplier, we generally have developed contingency plans to minimize the effect of interruption or reduction in supply, such as developing alternative or back-up suppliers, sourcing from suppliers with multiple facilities or utilizing alternative formulations.
Temporary shortages of raw materials may occasionally occur due to several factors such as supply-demand imbalances, supplier outages or regional market shifts. In recent years, these shortages have not resulted in long-term unavailability of raw materials. However, the continuing availability and price of raw materials are affected by other factors such as unscheduled plant interruptions occurring during periods of high demand, domestic and world market and political conditions, as well as the direct or indirect effect of governmental regulations. During periods of high demand, some raw materials may be subject to significant price fluctuations, and such fluctuations may have an adverse impact on the results of operations of our business. The impact of any future raw material shortages or price fluctuations on our business as a whole or in specific geographic regions or in specific business lines cannot be accurately predicted.
We have a broad raw material base with the cost of no single raw material representing more than 3% of our cost of goods sold in 2018. Raw material costs in total constituted 25% of our sales in our Materials segment in 2018. The table below lists the key raw materials and the principal product category for which the materials were used.
Raw Material | Segment | Principal Product Category | ||
Specialty Silanes | Materials | Advanced Materials | ||
Tungsten Powder | Materials | Process Materials | ||
Metallic Oxide Abrasives | Materials | Advanced Materials | ||
Controllers | DS&S | Equipment | ||
Hydrogen Chloride | Materials | Process Materials | ||
Hydrogen Fluoride | Materials | Process Materials | ||
Etchant Gases | Materials | Process Materials | ||
Nitrous Oxide | Materials | Process Materials | ||
Phosphine | Materials | Process Materials | ||
Ammonia | Materials | Process Materials | ||
Specialty silanes are sourced from multiple sources under multi-year contracts. We source several types of silanes depending upon the application and prices are generally fixed for the term of the contract.
Tungsten powder is supplied from multiple sources under multi-year contracts. Prices are generally subject to periodic adjustments based upon pricing for a derivative of tungsten ore. A majority of tungsten resources are located in China, and supply and pricing is subject to fluctuation. There have been significant fluctuations in pricing in recent years.
Metallic oxide abrasives are sourced under multi-year contracts. We source different types of abrasives each from a single source. Pricing is generally subject to market conditions.
Controllers are critical to the operation of our delivery systems units. We source different types of controller units from a single source under a multi-year contract. These control units are built by the supplier to our design specifications. We believe there are other sources of supply for these controllers.
Hydrogen chloride is sourced in the U.S. through a production joint venture and in Asia through a sole supplier. Our sole supply in the U.S. is a by-product of another chemical production process and sold through our joint venture. Our hydrogen chloride in Asia is produced as a by-product of another chemical process of a major chemical company. Both supply arrangements are under multi-year contracts.
13
Hydrogen fluoride is sourced in two countries from multiple suppliers under multi-year contracts. Prices under these contracts vary from fixed to market-based pricing.
Etchant gases are sourced from multiple suppliers under multi-year contracts. We have previously experienced some supply tightness for certain etchant gases and prices are generally subject to annual adjustment.
We source different grades of nitrous oxide in multiple countries from multiple sources under multi-year contracts. However, a customer may choose to qualify only one of those sources for its use. Our pricing is generally fixed for the term of such arrangements.
Phosphine is sourced from a single source under a multi-year contract. Our pricing is subject to periodic adjustment.
Ammonia is sourced from multiple sources under multi-year contracts. We believe there are a number of available sources. Pricing is generally tied to market conditions.
Key materials in our Delivery Systems & Services operating segment include valves, fittings and other components necessary to design and build our delivery systems and devices. We also purchase returnable containers that are a critical part of the quality and safe transportation, handling and use of our materials. We believe most of these materials are readily available from numerous sources.
Working Capital
Versum maintains inventory where required to facilitate the supply of products to customers on a specified delivery schedule. In some cases, higher inventory levels of certain products are maintained to manage specific supply chain risks and to meet customer requirements for responsiveness. For example, for some of the products, a higher level of inventory is maintained to mitigate the risk associated with a single manufacturing plant or single source of a critical raw material. A majority of our product inventory is maintained at warehouses in close proximity to our customers’ manufacturing locations to provide the responsiveness expected by our semiconductor customers.
Seasonality
Versum’s businesses are typically slightly stronger in fiscal third and fourth quarters due to the industry ramp up in advance of the holiday season. However, semiconductor industry technology ramps and materials market supply and demand dynamics can alter these seasonal trends. A portion of our DS&S segment is susceptible to the cyclical nature of capital investment in the semiconductor industry.
Employees
As of September 30, 2018, Versum and its subsidiaries had approximately 2,300 employees. Of our employees, approximately 200 are subject to collective bargaining agreements or other similar arrangements.
We observe local customs, legislation and practice in labor relations. Management believes that its relations with employees and their representatives are good. We have not suffered any material work stoppages or strikes in our worldwide operations in the last five years.
14
Environmental and Regulatory Matters
Versum is subject to various environmental laws and regulations in the countries in which it has operations. Some of our operations are within jurisdictions that have or are developing regulations governing emissions of greenhouse gases (“GHG”). The U.S. Environmental Protection Agency is regulating GHG emissions for new construction and major modifications to existing facilities. The Korean Ministry of the Environments is regulating GHG emissions through the establishment of greenhouse gas reduction and energy savings goals. Increased public awareness and concern may result in more international, U.S. federal, and regional requirements to reduce or mitigate the effects of GHG. Although uncertain, these developments could increase our costs related to consumption of electric power and the production of certain products, such as fluorinated gases. We believe we may be able to mitigate some of the potential costs through our contractual terms; however, we are unable to predict the impact of any potential changes in regulation or future regulation of GHG. Any legislation that limits or taxes GHG emissions from our facilities could impact our results of operations by increasing our operating costs or reducing demand for certain of our products.
The company is also subject to the Homeland Security Agency’s regulations, which address chemical plant safety and vulnerability. Similarly, the Frank R. Lautenberg Chemical Safety for the 21st Century Act reformed the Toxic Control Substances Act (“TSCA”) by requiring the United States Environmental Protection Agency (“EPA”) to prioritize and evaluate the environmental and health risks of existing chemicals and providing EPA with greater authority to regulate chemicals posing unreasonable risks. The law also requires that EPA make an affirmative finding that a new chemical will not pose an unreasonable risk before such chemical can be manufactured or imported. These reforms update TSCA so that it operates in a similar fashion to the Registration, Evaluation, and Authorization of Chemicals (“REACH”) legislation in Europe. Regulations similar to REACH have been enacted in South Korea and Taiwan. Based upon currently available information, the company does not believe that these regulations will have a material impact on its financial condition, results of operations or cash flows.
Research & Development
Versum is committed to further investing in its businesses through research and development. The objective of our research and development effort is to develop innovative chemistries and technologies with applications relevant within targeted key markets. Our technology spending, comprising research and development and technical services costs, was approximately 4% of our total sales in fiscal 2018. The majority of our technology spending is directed toward our innovation based Advanced Materials products where spending has been 10-15% of sales over the last several years. We staff our research and development resources based on the needs and requirements of each business line to develop innovative products. Research and development costs are charged to expense, as incurred. Such costs were $49.1 million, $45.1 million and $43.9 million for the years ended September 30, 2018, 2017 and 2016, respectively.
Research and development efforts are generally focused on both product and process development, which is the stage at which products move from development to manufacturing, and new product development.
Each of our segments manages its own research and development effort and has separate research and development facilities dedicated to its specific area. However, where technologically feasible, advances and findings are shared between business lines to foster greater cross-fertilization of ideas and applications. In certain cases, we conduct research and development efforts with third parties, including universities, customers and other entities. We endeavor to obtain ownership of or license to intellectual property developed with a third party on terms favorable to us.
Versum owns approximately 400 United States patents and 1,300 foreign patents, 900 pending patent applications globally and is a licensee under certain patents owned by others. While the patents and licenses are considered important, the company does not consider its business as a whole to be materially dependent upon any particular patent, patent license, or group of related patents or licenses.
15
Where You Can Find More Information
Our Internet address is www.versummaterials.com. On this website, under the “Investors” section, we post the following filings as soon as reasonably practicable after they are electronically filed with, or furnished to, the U.S. Securities and Exchange Commission (“SEC”): our annual, quarterly, and current reports on Forms 10-K, 10-Q, and 8-K; our proxy statements; any amendments to those reports or statements, and Form SD. All such filings are available on our website free of charge. The SEC also maintains a website (www.sec.gov) that contains reports, proxy and information statements, and other information regarding issuers that file electronically with the SEC. The content on our website, and any other website, as referred to in this Form 10-K is not incorporated by reference into this Form 10-K unless expressly noted.
Item 1A. Risk Factors
You should carefully consider the following risks and other information in this Annual Report on Form 10-K in evaluating us and our common stock. Any of the following risks could materially and adversely affect our financial condition, results of operations or cash flows. Our operations could be affected by various risks, many of which are beyond our control. Based on current information, we believe that the following list identifies the most significant risk factors that could affect our financial condition, results of operations or cash flows. There may be additional risks and uncertainties that adversely affect our financial condition, results of operations or cash flows in the future that are not presently known, are not currently believed to be material, or are not identified below because they are common to all businesses. Past financial performance may not be a reliable indicator of future performance and historical trends should not be used to anticipate results or trends in future periods. For more information, see “Cautionary Statement Concerning Forward-Looking Statements.”
Risks Related to Our Business
Overall Economic and Supply/Demand Conditions - Economic conditions or product supply versus demand imbalance in the semiconductor industry or in certain geographic markets in which we do business may decrease the demand for our goods and services and adversely impact our financial condition, results of operations and cash flows.
Demand for our products and services depends in part on global and regional economic conditions affecting the countries in which we do business and the semiconductor industry. Our revenue is primarily dependent on semiconductor demand. Semiconductor demand, in turn, is impacted by changes in consumer demand, since in recent years the industry has seen a significant shift in demand from semiconductor devices for personal computers, which now are largely enterprise-related, to those for mobile devices, which are more consumer-oriented. Historically, semiconductor demand has fluctuated due to economic and industry cycles and seasonal shifts in demand, which can affect our business, causing demand for our products to fluctuate. Furthermore, competitive dynamics within the semiconductor industry may impact our business. If the global economy or the semiconductor industry weakens, whether in general or as a result of specific factors, such as macroeconomic conditions, trade disputes, political instability or unpredictable events such as natural disasters, we could experience material adverse impacts on our results of operations and financial condition. In the past few years, uncertain or adverse economic conditions in certain geographies and changing supply and demand balances in areas served by us have impacted and may in the future impact demand for our products and services, in turn negatively impacting our results of operations. Any changes in capital spending by our customers or demand in the semiconductor industry may negatively impact our cash flow, our ability to service our debt and our results of operations.
Unfavorable global or regional economic conditions could have other negative impacts to our business or our results of operations, including depressing demand in a given region or industry, affecting our margins, constraining our operating flexibility and impacting our customers. Any excess capacity in our or our competitors’ manufacturing facilities, or due to new entrants into the industry, could decrease our ability to maintain pricing and margins and generate profits. Adverse global economic, political and industry conditions could have other negative effects on our company. For instance, we could experience negative impacts on cash flows due to the inability of our customers to pay their obligations to us or our production process could be harmed if our suppliers cannot fulfill their obligations to us. In such circumstances, we may also have to reduce the carrying value of goodwill and other intangible assets, which could harm our financial position and results of operations.
16
Some additional factors that affect demand for our products include: the types of electronic devices that are in demand; products that our customers may produce, such as logic IC devices versus memory devices; the various technology nodes at which those products are manufactured and whether our products are part of the production process; customers’ specific manufacturing process integration schemes; the short order to delivery time for our products; quarter-to-quarter changes in customer order patterns; market share gains and losses; and pricing changes by us and our competitors.
Concentrated Customer Base - We are exposed to risks associated with a concentrated customer base.
Our customer base historically has been, and is becoming even more, concentrated as a result of economic and industry conditions. In fiscal 2018, four customers accounted for approximately 53% percent of Versum’s global sales. In fiscal 2018, our top twenty customers accounted for approximately 81% of our global sales. Certain customers have experienced significant ownership or management changes, consolidated with other manufacturers, outsourced manufacturing activities, or engaged in collaboration arrangements with other manufacturers. Customers have entered into strategic alliances or industry consortia that have increased the influence of key industry participants in technology decisions made by their partners. Certain semiconductor and display customers are making an increasingly greater percentage of their respective industry’s capital equipment investments.
In this environment, contracts or orders from a relatively limited number of semiconductor and display manufacturers have accounted for, and are expected to continue to account for, a substantial portion of our business, which may result in added complexities in managing customer relationships and transactions. The mix and sales to any single customer may vary significantly from quarter to quarter and from year to year. If customers do not place orders, or they substantially reduce, delay or cancel orders, or if our products are not specified for our customers’ products or production processes we may not be able to replace the business. Because our products are configured to customer specifications, the changing, rescheduling or canceling of orders may result in significant, non-recoverable costs. Changes in customer qualification requirements could result in significant delays in the sale of our products. Major customers may also seek and on occasion receive, pricing, payment, intellectual property-related, or other commercial terms that are less favorable to Versum. These factors could have a material adverse effect on our financial condition, results of operations and cash flows.
Consolidation between customers, changes in technologies or solutions used by customers, changes in products manufactured by customers or in end-user demand for those products, selection of suppliers other than us, customer bankruptcies or customer departures from the industry may result in even fewer customers accounting for a high percentage of our revenue and reduced demand from any single major customer. The cancellation, reduction or deferral of purchases of our products by even a single customer could significantly reduce our revenues in any particular quarter. If we were to lose any of our significant customers, if our products are not specified for these customers’ products or production processes, or if we suffer a material reduction in their purchase orders, revenue could decline and our business, financial condition and results of operations could be materially and adversely affected. Furthermore, due to continued industry consolidation, the loss of any one customer or significant order may have a greater impact than we anticipate. We cannot guarantee that we will be able to continue to secure contracts with our more substantial customers in the future.
Capital Expenditure Cycle - Our DS&S segment is dependent upon the capital expenditure cycles of our customers.
Our DS&S operating segment is dependent upon the capital expenditures of manufacturers of microelectronics, semiconductors, computers, wireless communications and other electronic products. DS&S depends upon the sale of its gas and chemical delivery systems and bulk special gas projects which are tied to the capital expenditures of our customers. The capital equipment market for microelectronics, semiconductor, and consumer electronics manufacturers has historically been characterized by sudden and severe cyclical variations in product supply and demand due to a number of factors including capacity utilization, timing of customers’ new product introductions and demand for their products, inventory levels relative to demand and access to affordable capital. The timing, severity and duration of these market cycles are difficult or impossible to predict. As a result, business levels can vary significantly from quarter to quarter or year to year. Significant volatility in investment cycles in the market for microelectronics, and semiconductors used in electronic devices or in demand for consumer electronics may reduce demand for our products and may materially and adversely affect the DS&S operating segment. The degree of the impact of any downturn depends on a number of factors, including: the strength of the global economies, particularly those of Asia and the United States; the overall level of demand for consumer electronics products; the stability of global financial systems; and the overall health of the microelectronics, semiconductor, and consumer electronics industries.
17
Product Innovation - If we are not able to continue our technological innovation and successful commercial introduction of new products, our financial condition, results of operations and cash flow could be adversely affected.
The electronics and semiconductor industries into which we sell our products experience periodic technological change and product improvement. Our customers continually introduce new generations of products or require new technological capacity to further develop their products. Our customers rely on us to develop new materials to support their new product development. Our future growth will depend on our ability to gauge the direction of the commercial and technological progress in all key end-use markets and upon our ability to fund and successfully develop, manufacture and market products in such changing end-use markets. We will have to continue to identify, develop and market innovative products on a timely basis to replace or enhance existing products in order to maintain our profit margins and our competitive position. We may not be successful in developing new products and technology, either alone or with third parties, or licensing intellectual property rights from third parties on a commercially competitive basis. Our new products may not be accepted by our customers or may take us years to commercialize. If we fail to keep pace with the evolving technological innovations in our end-use markets on a competitive basis, our financial condition, results of operations and cash flows could be adversely affected.
Intellectual Property Rights - If our intellectual property is compromised or copied by competitors or customers, if our competitors were to develop similar or superior intellectual property or technology, or, if our intellectual property or technology violate third-party rights, our financial condition, results of operations and cash flow could be negatively affected.
Intellectual property rights, including patents, trade secrets, confidential information, trademarks, and trade names, are important to our business. Our success depends to a significant degree upon our ability to protect and preserve our intellectual property rights. We endeavor to protect our material intellectual property rights in the jurisdictions in which our products are produced and used, and also in the jurisdictions into which our products are imported and used. Although we seek to enforce our intellectual property, because of the limitations of the legal systems in many countries, the effectiveness of patents obtained or that may in the future be obtained, if any, is uncertain. While we own and have applied for numerous patents and trademarks throughout the world covering aspects and improvements for many of our technologies, we may be unable to obtain protection for our intellectual property in key jurisdictions where we rely on local judicial enforcement of our patents and other proprietary rights. For example, although patents were granted in several countries related to a key technology in our advanced deposition product portfolio, the relevant patent was invalidated in South Korea in 2015 and was challenged in Taiwan and China. Patent protection for individual products extends for varying periods in accordance with the legal life of patents in the various countries. The protection afforded, which may also vary from country to country, depends upon the type of patent and its scope of coverage. Our patents and other intellectual property rights may expire, be challenged, invalidated, circumvented, and rendered unenforceable or otherwise compromised. For example, a patent related to a key technology in our advanced deposition product portfolio expired in 2018. An inability to protect, defend or enforce our intellectual property could have an adverse effect on our financial condition, results of operations and cash flows.
Similarly, third parties may assert claims against us and our customers and distributors alleging our products infringe upon or otherwise violate third party intellectual property rights. If we were to discover that our products infringe or otherwise violate the valid intellectual property rights of others, we might need to obtain licenses or substantially re-engineer our products to avoid infringement. We may not be able to obtain licenses on acceptable terms, or at all, or be able to re-engineer our products successfully.
We also rely materially upon unpatented proprietary technology, know-how and other trade secrets to maintain our competitive position. While we enter into confidentiality agreements with our employees and third parties to protect our proprietary expertise and other trade secrets, these agreements may not be enforceable in every jurisdiction or, even if legally enforceable, we may not have adequate remedies for breaches of such agreements. We also may not be able to readily detect breaches of such agreements. The failure of our patents or confidentiality agreements to protect our proprietary technology, know-how or trade secrets could negatively impact our financial condition, results of operations and cash flows.
If we must take legal action to protect, defend or enforce our intellectual property rights, any suits or proceedings could result in significant costs and diversion of our resources and our management’s attention, and we may not prevail in any such suits or proceedings. Any failure to protect, defend or enforce our intellectual property rights could have an adverse
18
effect on our financial condition, results of operations and cash flows.
Raw Material Cost and Availability - Interruption in ordinary sources of supply or an inability to recover increases in raw material costs from customers could adversely impact our financial condition, results of operations and cash flows.
We use a wide variety of raw materials, including tungsten powder, hydrogen fluoride, specialty silanes, specialty abrasives, ammonia, and nitrous oxide. Shortages or price escalation in these materials could negatively impact our financial results. For example, from late 2016 into 2018 we experienced a nitrous oxide supply disruption resulting from reduced production by a key supplier. We may not be able to find alternative sources of supply in sufficient quantities to meet the needs of our customers, and may not be able to raise prices to recover any increases in raw material costs due to competitive pressures. Increases in raw material costs that cannot be passed on to customers for competitive or other reasons could negatively impact our financial condition, results of operations and cash flows. Even where costs are successfully passed through, price increases may result in lower sales volume.
Suppliers - If any of our sole source or limited source suppliers, or suppliers that were required to satisfy our customers’ rigorous qualification requirements, were unable to deliver to us in a timely manner or at all, our financial condition, results of operations and cash flows could be adversely affected.
Our operations depend on obtaining sufficient supplies of raw materials and components used in our manufacturing processes. In certain cases, qualification requirements in customers’ manufacturing processes limit us to certain qualified suppliers. In the event that it becomes necessary for us to find another supplier, we would first be required to ensure such new supplier could be qualified through our customers’ rigorous qualification processes for suppliers. Additionally, certain of our businesses rely on limited source suppliers to provide raw materials, such as hydrogen chloride and nitrous oxide, which are critical materials for certain of our customers. Although we have business continuity plans in place, our customers may be unwilling to qualify a new supplier, such suppliers may experience financial difficulties, be unable to deliver products to us in a timely manner, have insufficient capacity to meet our requirements, or suffer business disruption resulting from damage to or destruction of their facilities due to accidents, natural disasters or other events, and we might not be able to secure an alternative source of supply in a timely manner or at all. These events could have a material adverse impact on our business, financial condition, results of operations and cash flows.
Nature of Chemical Manufacturing Business - Hazards associated with specialty chemical manufacturing could disrupt our operations or the operations of our suppliers or customers, having a negative impact on our financial condition, results of operations, and cash flows.
Due to the nature of our business and those of some of our key suppliers, we are exposed to the hazards associated with specialty chemical manufacturing and the related storage and transportation of raw materials, products and waste in our manufacturing facilities or distribution centers and those of our suppliers, such as fires, explosions and accidents. Our operations could be impacted by catastrophic events outside our control, including natural disasters and severe weather conditions such as hurricanes, floods, earthquakes, and storms, epidemics, or acts of war and terrorism. Any such event could cause a material business disruption that could affect our ability to produce and distribute our products and have an adverse effect on the productivity and profitability of our company.
Our operations by their nature involve the use and manufacture of hazardous materials. Other hazards include piping and storage tank leaks and ruptures, mechanical failure, employee or third-party exposure to hazardous substances, lack of process safety, chemical spills and other discharges or releases of toxic or hazardous substances or gases. These hazards may cause personal injury and loss of life, damage to property and contamination of the environment, which could lead to government fines or work stoppage injunctions and lawsuits by injured persons. Such events could impact our suppliers or customers, in which case raw materials may be unavailable to us, or our customers may be unable to purchase or accept our products and services. Any such occurrence could have a negative impact on our financial condition, results of operations and cash flows.
19
Competition - The markets in which we compete are highly competitive. Our inability to compete effectively could adversely impact our financial condition, results of operations and cash flows.
We face significant competition from major international producers as well as smaller regional competitors. Our most significant competitors include major chemicals and materials manufacturers and diversified companies, a number of which have revenues and capital resources exceeding ours. In addition, our products are facing increasing competition from market participants in Asia. We expect to see more competition as China continues to invest in semiconductor manufacturing.
We face risk that certain events, such as new product development by our competitors, changing customer needs, production advances for competing products, price changes in raw materials and product components, our failure to secure or protect patents or the expiration of patents, could result in declining demand for our products as our customers switch to substitute products or undertake manufacturing of such products on their own. If we are unable to develop, produce or market our products to effectively compete against our competitors, our financial condition, results of operations and cash flows may materially suffer.
We believe that our customers are increasingly looking for strong, long-term relationships with a few key suppliers that help them improve product performance, reduce costs, or support new product development. As a result, we may need to invest and spend more on research and development and marketing costs to strengthen existing customer relationships, as well as attract new customers. Our indebtedness could limit our flexibility to react to these industry trends and our ability to remain competitive.
Operational, Political, and Legal Risks of International Operations - Our international operations may be adversely impacted by political or economic instability, nationalization or expropriation of property, or undeveloped property rights and legal systems.
The majority of our revenue is derived from international operations. For the period ended September 30, 2018, 77% of our revenue was generated by sales to customers outside of the United States, including in South Korea, Taiwan, China and the European Union. Our operations in certain foreign jurisdictions, including manufacturing, research and development, sales and customer support, may be affected directly and indirectly by global and local regulation, and economic and political conditions and may be subject to disruption due to:
• | the United Kingdom’s formal trigger of the process for its exit from the European Union, and related negotiations, may cause instability in European economies and may negatively impact the outlook for the global economy; |
• | political, economic and social instability, including hyperinflationary conditions, regional and international hostilities and regional and international responses to these hostilities; |
• | unanticipated government actions, such as export or import bans, trade wars, tariffs, nationalization of private enterprises and expropriation risk; |
• | failure to maintain compliance with multiple legal and regulatory systems and increased difficulty in ensuring compliance by employees, agents, and contractors with the laws of multiple jurisdictions; |
• | potential difficulties in protecting intellectual property; |
• | controls on the investment, repatriation and exchange rates of capital; |
• | potentially adverse tax consequences, including the possible imposition of new taxes, a new corporate tax regime, increased taxes on repatriation or other payments, or challenges to the taxation of the Separation from Air Products in connection with the spin-off in such countries; and |
• | cancellation of contractual relationships within these jurisdictions without full compensation for loss. |
In addition, economic and political conditions within foreign jurisdictions, trade wars, social unrest, or strained relations between countries can cause fluctuations in demand, price volatility, supply disruptions, or loss of property. Our developing
20
market operations may be subject to greater risks than those faced by our operations in mature economies, including geopolitical, legal, economic and talent risks. For example, effective October 30, 2018, the U.S. Department of Commerce banned exports to a Chinese semiconductor manufacturing company and may in the future impose further restrictions on this or other Chinese semiconductor manufacturers. Such actions may impact our ability to participate in the growth of semiconductor manufacturing in China and in other countries. The occurrence of any of these risks could have a material adverse impact on our financial condition, results of operations and cash flows.
Trade Disputes - Our business may be impacted by an ongoing trade war and implementation of tariffs on our raw materials and products.
Recent world events have increased the risks posed by international trade wars, tariffs, and sanctions. The United States has announced tariffs on a list of products imported from China and other countries. While there is uncertainty as to the duration of the proposed tariffs and the products and materials that ultimately will be covered by future tariffs, the tariffs may increase the costs of certain raw materials that we import into the United States and may negatively impact our margins as we may not be able to pass on the additional cost through increasing the prices of our products. This, in turn, may lead to retaliatory tariffs on U.S. goods that could potentially make our products sold from the U.S. more expensive to non-U.S. customers. Tariffs implemented by China and other countries could impact the sale of our products or our ability to do business in such countries. Accordingly, the ongoing trade disputes could negatively impact our business, financial condition, results of operations and cash flow.
Recent changes in U.S. tax laws may have a material effect on our results of operations and financial condition.
On December 22, 2017, the Tax Cuts and Jobs Act (the “Tax Act”) was signed into law. The changes included in the Tax Act are broad and complex. Although the Tax Act contains a reduction to the United States corporate income tax rate, it may accelerate the recognition of US tax on subsidiary earned income and negatively impact our ability to deduct interest expense, executive compensation, and other expenses, as well as our ability to utilize certain tax credits, among other things. The determination of our income tax provision requires complex estimations, significant judgments and significant knowledge and experience concerning the applicable tax laws, including the Tax Act. As new legislation is enacted to interpret the Tax Act, these changes may require us to adjust our provisional charge and other tax estimates. Subsequent guidance, regulations or audits that differ from our prior interpretations and assumptions, or factors which were not anticipated at the time we estimated our tax provision, all could have a material adverse effect on our cash taxes, results of operations, and financial condition.
Regulatory Compliance - We are subject to extensive government regulation in jurisdictions around the globe. Any changes in regulations addressing, among other things, environmental compliance, anticorruption, sanctions, import/export controls, and taxes, may negatively impact our financial condition, results of operations and cash flows.
We are subject to extensive government regulation in the United States and in the foreign jurisdictions in which we conduct our business, on matters as diverse as anticorruption, import/export controls, trade restrictions, tariffs, taxation, sanctions, anti-money-laundering, environmental and health and safety, and employment and labor relations. Compliance with laws and regulations, including as a result of changes in those laws and regulations from time to time, may involve significant costs or require changes in business practice that could materially impact our financial condition, results of operations and cash flow. For example, our subsidiaries are subject to rules and regulations related to anti-bribery prohibitions of the U.S. and other countries, including the U.S. Foreign Corrupt Practices Act (the “FCPA”), the United Kingdom Bribery Act, the Improper Solicitation and Graft Act of Korea (commonly known as the “Kim Young-ran Act”), and the China Anti-Unfair Competition Law. Moreover, export control and economic embargo regulations limit the ability to market, sell, distribute or otherwise transfer products or technology to prohibited countries or persons. In addition, we are subject to the extensive import, export, storage and transportation regulations of each of the countries where we operate due to the hazardous classification of our products. The international nature of our operations, where legal systems outside of the United States may be less understood by us, further increases the difficulty of compliance. Compliance with diverse legal requirements is costly, time-consuming and requires significant resources. The FCPA, the United Kingdom Bribery Act, Korea’s Kim Young-ran Act, the China Anti-Unfair Competition Law, and similar anti-bribery laws in other jurisdictions generally prohibit companies and their intermediaries from making improper payments to government officials or other persons. There has been an increase in anti-bribery law enforcement activity in recent years, with more frequent and aggressive investigations and enforcement proceedings by both the U.S. Department of Justice and the SEC, increased enforcement activity by non-
21
U.S. regulators, and increases in criminal and civil proceedings brought against companies and individuals. We operate in parts of the world that are recognized as having government and commercial corruption and in certain circumstances, strict compliance with anti-bribery laws may conflict with local customs and practices. We cannot assure you that our internal control policies and procedures will always protect us from improper conduct of our employees or business partners. Actual or alleged violations can be expensive and require significant time and attention from senior management.
Our failure to comply with U.S. federal or state or non-U.S. laws, regulations or policies, many of which are aggressively enforced, could subject us to substantial fines, sanctions, civil and/or criminal penalties, and curtailment of operations in the U.S. or other applicable jurisdictions. Moreover, any violation of applicable laws or regulations by our suppliers could interrupt or otherwise disrupt our sourcing or adversely affect our reputation. While we do not control these suppliers or their labor practices, negative publicity regarding the management of facilities by, production methods of, or materials used by any of our suppliers could adversely affect our reputation and sales, and force us to locate alternative suppliers, which could materially adversely affect our business, financial conditions, and results of operations. Likewise, any public investigation or inquiry into alleged violations of these regulations could have an adverse effect on our reputation and the value of our common stock. Any of the foregoing could materially adversely affect our business, financial condition and results of operations.
Leverage - Our available cash and access to additional capital may be limited by our leverage and debt service obligations.
We maintain leverage and have material debt service obligations. This level of indebtedness could have important negative consequences, including:
• | We will need to use a portion of our available cash flow to pay interest and principal on our debt, which will reduce the amount of money available to finance our operations and other business activities. |
• | We may have difficulty obtaining financing in the future for working capital, capital expenditures, research and development, acquisitions or other purposes. |
• | Our debt level increases our vulnerability to general economic downturns and adverse industry conditions. |
• | Our debt level could limit our flexibility in planning for, or reacting to, changes in our business and in our industry in general. |
• | If our foreign cash is needed to pay interest or principal on our U.S. debt, we may be required to accrue and pay material amounts of tax on repatriation of that cash. |
• | A portion of our debt has a variable interest rate, and if interest rates increase, our interest expense could increase significantly, affecting earnings and reducing cash flow available for dividends, working capital, expenditures, acquisitions, and other purposes. |
• | Our debt and the amount we need to pay to service our debt obligations could place us at a competitive disadvantage compared to any competitors that have less debt. |
• | Our failure to comply with the financial and other restrictive covenants in our debt instruments which, among other things, may require us to maintain specified financial ratios, limit our ability to increase dividends or repurchase stock and limit our ability to incur debt and sell assets, could result in an event of default that, if not cured or waived, could cause our lenders to terminate commitments under our debt agreements, declare all amounts, including accrued interest, due and payable, and enforce their rights in respect of collateral. |
22
Additional Capital Needs - We may need additional capital in the future and may not be able to obtain it on favorable terms.
We may require additional capital in the future to finance our growth and development, implement further marketing and sales activities, fund ongoing research and development activities, fund mergers or acquisitions and meet general working capital needs. Our capital requirements will depend on many factors, including acceptance of and demand for our products, the extent to which we invest in new technology and research and development projects, and the status and timing of these developments, as well as general availability of capital from debt and equity markets.
However, debt or equity financing may not be available to us on terms we find acceptable. If we incur additional debt or raise equity through the issuance of preferred stock, the terms of the debt or the preferred stock issued may give the holders rights, preferences and privileges senior to those of holders of our common stock, particularly in the event of liquidation. If we raise funds through the issuance of additional equity, your ownership in us would be diluted. If we are unable to raise additional capital when needed, it may impact our financial condition, results of operations and cash flows.
Additionally, our failure to maintain expected credit ratings on our debt securities could negatively affect our ability to access capital and could increase our interest expense on certain existing and future indebtedness. We expect the credit rating agencies to periodically review our capital structure and the quality and stability of our earnings. Deterioration in our capital structure or the quality and stability of our earnings could result in a downgrade of the credit ratings on our debt securities. Any negative ratings actions could constrain the capital available to us and could limit our access to funding for our operations and increase the cost of such capital. If, as a result, our ability to access capital when needed becomes constrained, our interest costs could increase, which may impact our financial condition, results of operations and cash flows.
Restrictions Under Debt Agreements - The agreements governing our indebtedness may restrict our current and future operations, and hamper our ability to respond to changes or to take certain actions.
The agreements governing our indebtedness (including our senior credit facilities and senior notes) contain, and the agreements governing future indebtedness and future debt securities may contain, restrictive covenants, such as financial maintenance covenants and other covenants restricting our ability to sell assets; pay dividends and make other distributions; redeem or repurchase our capital stock; incur additional debt and issue capital stock; create liens; consolidate, merge or sell substantially all of our assets; enter into certain transactions with our affiliates; make loans, investments or advances; repay subordinated indebtedness; undergo a change in control; and enter into sale and leaseback transactions, that may limit our operations, including our ability to engage in certain activities that may be in our long-term best interests. These restrictive covenants may limit us and our restricted subsidiaries from taking certain corporate actions, or may give rights to the holders of our indebtedness under the agreements governing our indebtedness if we or our restricted subsidiaries take such actions.
Our failure to comply with those covenants could result in an event of default that, if not cured or waived, could result in the acceleration of some or all of our indebtedness, which could lead to bankruptcy, reorganization or insolvency.
Government Regulation of Raw Materials, Products and Facilities - Our financial condition, results of operations and cash flow could be adversely affected by regulation to which our raw materials, products and facilities are subject.
Some of the raw materials we handle, and our products and facilities, are subject to government regulation. These regulations affect the manufacturing processes, handling, storage, transportation, uses and applications of our products. In addition, some of our products contain raw materials, such as hydrogen chloride, that are deemed hazardous materials. The use and handling of these materials is regulated and some of these regulations require product registrations, which also are subject to renewal and potential revocation. These regulations and changes to the current regulatory framework under which we operate may affect our ability to market certain materials we produce. In addition, some of these products, such as certain process gases and hydrides, are subject to significant restrictions on storage and transportation via certain types of carriers.
There is also a risk that key raw materials or one or more of our products may be found to have, or be recharacterized as having, a toxicological or health-related impact on the environment or on our customers or employees. If such a finding or recharacterization occurs, the relevant raw materials or products, including products of customers incorporating our products, may be recalled or banned or we may incur increased costs in order to comply with new regulatory requirements. Changes
23
in regulations, or their interpretation, may also affect the marketability of certain of our products. We cannot predict how these and other findings from regulatory agencies may affect our financial condition, results of operations and cash flows.
Environmental, Health and Safety Compliance - Costs and expenses resulting from compliance with environmental, health and safety regulations may negatively impact our financial condition, results of operations and cash flows.
We are subject to extensive federal, state, local, and foreign environmental, health and safety laws and regulations concerning, among other things, emissions in the air; discharges to land and water; transportation safety; safety of employees and end product consumers; and the generation, handling, treatment, and disposal of hazardous waste and other materials. Compliance with laws and regulations and any failure to comply with such laws and regulations may involve significant costs or require changes in our business practices that could materially impact our financial condition, results of operations and cash flows. In addition, our production facilities require numerous operating permits that are subject to renewal requirements. Due to the nature of these requirements and ongoing changes in our operations, our operations may exceed limits under permits or we may not have proper permits. We may incur substantial costs, including fines, damages, criminal or civil sanctions and remediation costs, or experience interruptions in our operations, for violations arising under these laws or permit requirements.
The nature of our operations also exposes us to risk of liability for contamination, personal injury or third party impacts if hazardous materials are released into the environment, which could result in substantial losses, reputational harm, increase in our insurance cost or otherwise adversely impact our results of operations or our common stock.
Environmental, health and safety laws are subject to change and have tended to become more strict over time. Such changes in environmental, health and safety laws or their interpretation, or the enactment of new laws, could result in materially increased capital expenditures and compliance costs. For example, U.S., Korean and international commitments to reduce world-wide emissions of greenhouse gases, including carbon dioxide, could result in legal requirements that materially and adversely impact our financial condition, results of operations and cash flow. The Frank R. Lautenberg Chemical Safety for the 21st Century Act required the U.S. Environmental Protection Agency to make an affirmative finding that a new chemical will not pose an unreasonable risk before such chemical can be manufactured or imported. Regulations similar to the Registration, Evaluation, and Authorization of Chemicals legislation in Europe have been enacted in South Korea and Taiwan. These and other regulatory changes could increase our cost of doing business and have a negative impact on our financial condition, results of operations and cash flows.
Cyber Security - The protection of the confidentiality, integrity and availability of our business applications, infrastructure services and data is important to our business. A compromise of our data or a disruption of our information technology applications or services could damage our reputation and adversely affect our financial condition, results of operations and cash flows.
We depend on information technology to protect the business applications and infrastructure services that enable our business to operate efficiently, interface with customers and maintain financial accuracy and efficiency. Our information technology capabilities are currently delivered through a combination of external service providers. As we separated our business applications and infrastructure services from Air Products, we adopted a “cloud-first”, “software-as-a-service-preferred” enterprise IT strategy that increased our dependency on the security controls of our external service providers. If we, together with our service providers, do not allocate and effectively manage the resources necessary to build and sustain the proper technology infrastructure, we could be subject to transaction errors, processing inefficiencies, the loss of customers, business disruptions, or the loss of or damage to our confidential business information through a security breach. As with all large systems, our information systems could be penetrated by outside parties’ intent on extracting information, corrupting information, or disrupting business processes. The business applications and infrastructure services we depend on may be subject to sophisticated cyber security threats. We rely on operations technology to protect the industrial controls systems at our manufacturing sites. A cyber breach that disrupts our process safety controls could cause the disruption of our operations and even cause a significant safety incident that threatens life or property. Unauthorized access could disrupt our business operations, result in the loss of assets, intellectual property, employee or customer data, and have a material adverse effect on our financial condition, results of operations and cash flows.
We rely on information security measures to protect our company information, including our intellectual property and technical data, and our employee, customer and vendor information. Our business involves the use, storage, and transmission
24
of this information. The protection of such information, as well as our information, is critical to us. The regulatory environment surrounding information security and privacy is increasingly demanding, with the frequent imposition of new, differing and constantly changing requirements such as the General Data Protection Regulation in the European Union. We also, from time to time, export sensitive customer data and technical information to recipients outside the United States. Breaches of our security measures or the accidental loss, inadvertent disclosure, or unapproved dissemination of proprietary information or sensitive or confidential data about us or our customers, including the potential loss or disclosure of such information or data as a result of fraud, trickery, or other forms of deception, could expose us, our customers, or the individuals affected to a risk of loss or misuse of this information, result in litigation and potential liability for us, result in fines and penalties, damage our reputation, or otherwise harm our business.
Foreign Currency Impacts - Our reported results could be adversely affected by currency exchange rates and currency devaluation could impair our competitiveness.
Due to our international operations, we transact in many foreign currencies, including but not limited to the South Korean Won, New Taiwan Dollar, Japanese Yen, Chinese Renminbi and the Euro. As a result, we are subject to the effects of changes in foreign currency exchange rates. During times of a strengthening U.S. dollar, our reported net revenues and operating income will be reduced because the local currency will be translated into fewer U.S. dollars. During periods of economic crisis, local currencies may be devalued significantly against the U.S. dollar, potentially reducing our margin.
We also incur currency transaction risk whenever we enter into a transaction using a currency other than the local currency of the transacting entity. We may not be able to effectively manage our currency translation and transaction risk, and, as a result, volatility of currency exchange rates may have a material adverse effect on our financial condition, results of operations and cash flow. We may enter into forward exchange contracts and other financial contracts in an attempt to mitigate the impact of transactional currency rate fluctuations. However, there can be no assurance that such actions will eliminate any adverse impact from variation in currency rates, and in some cases such actions may exacerbate the impact on our financial condition, results of operations and cash flows.
Litigation and Regulatory Proceedings - Our financial condition, results of operations and cash flows may be affected by various legal and regulatory proceedings, including those involving customer claims, antitrust, tax, environmental, or other matters.
We are subject to litigation and regulatory proceedings in the normal course of business and could become subject to additional claims in the future, some of which could be material. We face risks arising from various unasserted and asserted litigation matters, including, but not limited to, employee matters, product liability, patent infringement, regulatory claims, and claims for third party property damage or personal injury stemming from alleged environmental or other torts. In addition, we may have obligations to indemnify Air Products under the terms of the Separation Agreement we entered into with Air Products on September 29, 2016 (the “Separation Agreement”) for certain product liability, environmental, personal injury, tax or other claims. Due to the nature of our products and services and how they are used by our customers, we may be subject to claims by our customers alleging our products or services, or our failure or inability to deliver products and services, impacted their production yield. While we seek to limit our liability in our commercial contractual arrangements, there are no guarantees that each contract will contain suitable limitations of liability or that limitations of liability will be enforceable at law or that we will be able to obtain insurance for any losses we incur. Also, the outcome of existing legal proceedings may differ from our expectations because the outcomes of litigation, including regulatory matters, are often difficult to predict reliably. Various factors or developments can lead us to change current estimates of liabilities and related insurance receivables, where applicable, or make such estimates for matters previously not susceptible to reasonable estimates, such as a judicial ruling or judgment, a settlement, regulatory developments, or changes in applicable law. While we believe our existing legal proceedings and claims will not, individually or in the aggregate, have a material adverse effect on our financial condition, results of operations and cash flows, a future adverse ruling, settlement, claim or unfavorable development could result in charges that could have such a material adverse effect.
25
Risks Associated with Acquisitions - We may not be able to complete acquisitions, or successfully integrate acquisitions we may undertake in the future.
Our strategy includes acquiring other businesses. The process of combining or acquiring businesses involves risks. We may face difficulty integrating the new operations, technologies, products and services of future acquisitions or combinations, and may incur unanticipated expenses related to such transactions. The difficulties of combining operations may be magnified by integrating personnel with differing business backgrounds and corporate cultures. Failure to successfully manage and integrate acquisitions with our existing operations could lead to the potential loss of customers of the acquired business, the potential loss of employees who may be vital to the new operations, the potential loss of business opportunities or other adverse consequences that could affect our financial condition and results of operations. Even if integration occurs successfully, failure of any future acquisition or combination to achieve levels of anticipated sales growth, and profitability, productivity comparable with our existing operations, or expected synergies related to such transaction, or to otherwise perform as expected, may adversely impact our financial condition, results of operations and cash flow. In addition, certain acquisitions may trigger regulations designed to monitor competition and would therefore require regulatory approval. We cannot predict whether such authorities will approve or whether we would be able to complete any acquisitions we seek to accomplish in the future.
Certain provisions of our amended and restated certificate of incorporation and amended and restated bylaws, and of Delaware law, may prevent or delay an acquisition of us, which could decrease the trading price of our common stock.
Versum’s amended and restated certificate of incorporation and amended and restated by-laws contain, and Delaware law contains, provisions that are intended to deter coercive takeover practices and inadequate takeover bids by making such practices or bids unacceptably expensive to the bidder and to encourage prospective acquirers to negotiate with Versum’s board of directors rather than to attempt a hostile takeover. These provisions include, among others:
• | the inability of our stockholders to act by written consent; |
• | the inability of our stockholders to call special meetings; |
• | rules regarding how stockholders may present proposals or nominate directors for election at stockholder meetings; |
• | the right of our board of directors to issue preferred stock without stockholder approval; and |
• | the ability of our directors, and not stockholders, to fill vacancies (including those resulting from an enlargement of our board of directors) on our board of directors. |
In addition, we are subject to Section 203 of the DGCL. Section 203 provides that, subject to limited exceptions, persons that (without prior board approval) acquire, or are affiliated with a person that acquires, more than 15 percent of the outstanding voting stock of a Delaware corporation shall not engage in any business combination with that corporation, including by merger, consolidation or acquisitions of additional shares, for a three-year period following the date on which that person or its affiliate becomes the holder of more than 15 percent of the corporation’s outstanding voting stock.
We believe these provisions protect our stockholders from coercive or otherwise unfair takeover tactics by requiring potential acquirers to negotiate with our board of directors and by providing our board of directors with more time to assess any acquisition proposal. These provisions are not intended to make us immune from takeovers. However, these provisions could have the effect of delaying, deferring or preventing a change in control or the removal of existing management, of deterring potential acquirers from making an offer to our stockholders and of limiting any opportunity to realize premiums over prevailing market prices for our common stock in connection therewith. This could be the case notwithstanding that a majority of our stockholders might benefit from such a change in control or offer.
26
Risks Related to the Separation
In connection with our Separation we assumed certain liabilities. If we are required to make payments pursuant to our indemnification obligations to Air Products, we may need to divert cash to meet those obligations and our financial condition, results of operations and cash flows could be negatively impacted. In addition, Air Products may indemnify us for certain liabilities. Air Products’ indemnity may not be sufficient to insure us against the full amount of liabilities for which it will be allocated responsibility, and Air Products may not be able to satisfy its indemnification obligations in the future.
Pursuant to the Separation Agreement, the Employee Matters Agreement and the Tax Matters Agreement, each of which we entered into with Air Products on September 29, 2016, we agreed to assume, and indemnify Air Products for, certain liabilities for uncapped amounts, which may include, among other items, associated defense costs, settlement amounts and judgments. Payments pursuant to these indemnities may be significant and could negatively impact our financial condition, results of operations and cash flows, particularly indemnities relating to our actions that could impact the tax-free nature of the Distribution and certain related transactions. Third parties could also seek to hold us responsible for liabilities of Air Products’ business. Air Products agreed to indemnify us for such liabilities, but such indemnity from Air Products may not be sufficient to protect us against the full amount of such liabilities, and Air Products may not be able to fully satisfy its indemnification obligations. Moreover, even if we ultimately succeed in recovering from Air Products any amounts for which we are held liable, we may be temporarily required to bear these losses ourselves. Each of these risks could negatively affect our financial condition, results of operations and cash flows.
If the Distribution of Versum common stock from Air Products or certain related transactions were to fail to qualify as tax-free to Air Products stockholders, then Versum could be subject to significant tax liability or tax indemnity obligations.
Air Products received an opinion of Skadden, Arps, Slate, Meagher & Flom LLP, tax counsel to Air Products, on the basis of certain facts, representations, covenants and assumptions set forth in such opinion, substantially to the effect that, for U.S. federal income tax purposes, the Distribution of Versum common stock from Air Products and certain related transactions should qualify as a transaction that generally is tax-free to Air Products and Air Products’ stockholders, for U.S. federal income tax purposes, under Sections 355 and 368(a)(1)(D) of the Code.
Notwithstanding the tax opinion, the IRS could determine on audit that the Distribution should be treated as a taxable transaction if it determines that any of the facts, assumptions, representations or covenants set forth in the tax opinion are not correct or have been violated, or that the Distribution should be taxable for other reasons, including as a result of a significant change in stock or asset ownership after the Distribution, or if the IRS were to disagree with the conclusions of the tax opinion. If the Distribution were determined to be taxable for U.S. federal income tax purposes, Air Products and its stockholders that are subject to U.S. federal income tax could incur significant U.S. federal income tax liabilities.
Under the Tax Matters Agreement, Versum is generally required to indemnify Air Products against taxes incurred by Air Products that arise as a result of Versum taking or failing to take, as the case may be, certain actions that may result in the Distribution of Versum common stock from Air Products or certain related transactions failing to qualify as tax-free for U.S. federal income tax purposes. Under the Tax Matters Agreement, Versum may also be required to indemnify Air Products for other tax liabilities, which could materially adversely affect Versum’s financial condition, results of operations and cash flows.
Certain of our directors and officers may have actual or potential conflicts of interest because of their equity ownership in Air Products, and one of our directors may have actual or potential conflicts of interest because he also serves as an officer and on the board of directors of Air Products.
Certain of our directors and executive officers may own shares of Air Products’ common stock, and the individual holdings may be significant for some of these individuals compared to their total assets. In addition, Seifi Ghasemi, who serves as Chairman, President and Chief Executive Officer of Air Products, also serves as a director of Versum and our non-executive Chairman. This ownership or service to both companies may create, or may create the appearance of, conflicts of interest when these directors and officers are faced with decisions that could have different implications for Air Products and us. For example, potential conflicts of interest could arise in connection with the resolution of any dispute that may arise between
27
Air Products and us regarding the terms of the agreements governing the internal reorganization, the Distribution and the relationship thereafter between the companies, including with respect to the indemnification of certain matters. We have agreed with Air Products that officers and directors who serve at both companies will recuse themselves from decisions where conflicts arise due to their positions at both companies.
The Separation and Distribution and related internal reorganization transactions may expose Versum to potential liabilities arising out of state and federal fraudulent conveyance laws and legal dividend requirements.
If Versum files for bankruptcy or is otherwise determined or deemed to be insolvent under federal bankruptcy laws, a court could deem the Separation and Distribution or certain internal reorganization transactions undertaken by Air Products in connection with the Separation to be a fraudulent conveyance or transfer. Fraudulent conveyances or transfers are defined to include transfers made or obligations incurred with the actual intent to hinder, delay or defraud current or future creditors or transfers made or obligations incurred for less than reasonably equivalent value when the debtor was insolvent, or that rendered the debtor insolvent, inadequately capitalized or unable to pay its debts as they become due. A court could void the transactions or impose substantial liabilities upon Versum, which could adversely affect Versum’s financial condition and its results of operations. Among other things, the court could require Versum stockholders to return to Air Products some or all of the shares of Versum common stock issued in the Separation and Distribution, or require Versum to fund liabilities of other companies involved in the reorganization transactions for the benefit of creditors.
The Distribution of Versum common stock is also subject to review under state corporate distribution statutes. Under the Delaware General Corporation Law (the “DGCL”), a corporation may only pay dividends to its stockholders either (i) out of its surplus (net assets minus capital) or (ii) if there is no such surplus, out of its net profits for the fiscal year in which the dividend is declared or the preceding fiscal year. Although Air Products intended to make the Distribution of Versum common stock entirely out of surplus, Versum cannot assure you that a court will not later determine that some or all of the Distribution to Air Products stockholders was unlawful.
28
Item 1B. Unresolved Staff Comments
None.
Item 2. Properties
Our corporate headquarters is located in Tempe, Arizona. We also maintain a global network of production facilities and technical centers in cost effective and strategic locations.
Production Facilities
Region | Segment | Location | Owned/Leased | |||
Americas | Materials | Tempe, AZ | Lease | |||
Carlsbad, CA | Own | |||||
Catoosa, OK | Lease | |||||
Allentown, PA | Lease | |||||
Dallas, TX | Own | |||||
Tamaqua, PA | Own | |||||
Indianapolis, IN | Lease | |||||
DS&S | Allentown, PA | Own | ||||
Asia | Materials | Banwol, South Korea | Own | |||
Siheung, South Korea | Own | |||||
Pyeongtaek, South Korea | Own | |||||
Ulsan, South Korea | Own | |||||
Nanke, Taiwan | Own | |||||
DS&S | Ansan, South Korea | Own | ||||
Shanghai, China | Own | |||||
Technical Centers
Americas | Materials | Tempe, AZ | Lease | |||
Carlsbad, CA | Own | |||||
Tamaqua, PA | Own | |||||
Allentown, PA | Lease | |||||
Indianapolis, IN | Lease | |||||
Asia | Materials | Hsinchu, Taiwan | Lease | |||
Banwol, South Korea | Lease | |||||
29
Item 3. Legal Proceedings
Refer to Note 21, “Commitments and Contingencies”, to our Annual Consolidated Financial Statements in Part II, Item 8 of this Annual Report on Form 10-K.
Item 4. Mine Safety Disclosures
Not applicable.
Part II
Item 5. Market for Registrants Common Equity, Related Stockholders Matters and Issuer Purchases of Equity Securities
Our common stock is listed on the New York Stock Exchange (“NYSE”) under the ticker symbol “VSM”. Versum Materials, Inc. did not begin “regular way” trading on the NYSE until October 3, 2016. On November 9, 2018, we had 6,583 stockholders of record of our common stock.
Recent Sales of Unregistered Equity Securities
None.
Issuer Purchases of Equity Securities
None.
30
Performance Graph
The graph below shows the cumulative total stockholder return, assuming the investment of $100 on October 3, 2016 (and the reinvestment of dividends thereafter), in each of Versum’s common stock, the Standard & Poor's (S&P) 1500 Specialty Chemicals Index, S&P 400 Midcap Index and the Philadelphia Semiconductor Index. The comparisons in the graph below are based on historical data and are not indicative of, or intended to forecast, future performance of our common stock.
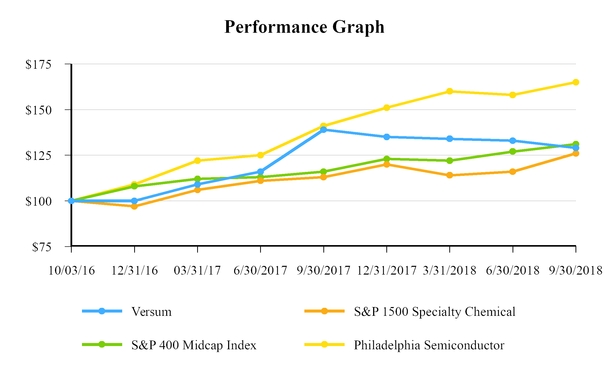
October 3, 2016 | September 30, 2017 | September 30, 2018 | |||||||||
Versum Materials, Inc. | $ | 100 | $ | 139 | $ | 129 | |||||
S&P 1500 Specialty Chemicals | 100 | 113 | 126 | ||||||||
S&P 400 Midcap Index | 100 | 116 | 131 | ||||||||
Philadelphia Semiconductor Index | 100 | 141 | 165 | ||||||||
31
Item 6. Selected Financial Data
The following table presents Versum’s selected historical condensed consolidated financial data. We derived the selected historical condensed consolidated financial data as of September 30, 2018 and 2017 and for the years ended September 30, 2018, 2017 and 2016 from the Annual Consolidated Financial Statements in Part II, Item 8 of this Annual Report on Form 10-K. The selected historical condensed consolidated financial data as of September 30, 2016 and for the year ended September 30, 2015 are derived from our 2017 Annual Report on Form 10-K. The selected historical condensed consolidated financial data as of September 30, 2015 and as of and for the year ended September 30, 2014 are derived from our 2016 Annual Report on Form 10-K. The selected historical condensed consolidated financial data as of September 30, 2014 are derived from the unaudited Annual Combined Financial Statements that are not included in this Annual Report on Form 10-K.
Prior to the Separation, the selected historical condensed consolidated financial data included certain expenses of Air Products that were allocated to Versum for certain functions, including general corporate expenses related to finance, legal, information technology, insurance, compliance and human resources activities, employee benefits and incentives and stock-based compensation. These past costs included in our historical information prior to the Separation may not be representative of the costs incurred after the Separation as an independent, publicly traded company.
In addition, our historical financial information prior to the Separation did not reflect changes as a result of our Separation from Air Products, including changes in Versum’s cost structure, personnel needs, tax structure, capital structure, financing and business operations. Prior to the Separation, Versum’s Annual Consolidated Financial Statements also did not reflect the assignment of certain assets and liabilities between Air Products and Versum. Consequently, the historical financial information prior to the Separation included here may not necessarily reflect what Versum’s financial position, results of operations, and cash flows would have been had it been an independent, publicly traded company during the periods presented prior to the Separation. Accordingly, these historical results prior to the Separation should not be relied upon as an indicator of Versum’s future performance.
For a better understanding of our business and results, this section should be read in conjunction with “Management’s Discussion and Analysis of Financial Condition and Results of Operations” and our Annual Consolidated Financial Statements and accompanying notes in Part II, Item 7 and Item 8, respectively, of this Annual Report on Form 10-K.
Amounts disclosed in the table below have been adjusted for the company's conversion effective the fourth quarter of 2018 from the last in, first out (“LIFO”) cost method to the first in, first out (“FIFO”) cost method for determining the cost of inventories in the United States, which were our only operations that were using the LIFO cost method. The company applied this change retrospectively to all prior periods presented. For a detailed description on impacts see Note 2, “Summary of Significant Accounting Policies”, to our Annual Consolidated Financial Statements in Part II, Item 8 of this Annual Report on Form 10-K.
32
As of and for the year ended September 30, | |||||||||||||||||||
2018 | 2017 | 2016 | 2015 | 2014 | |||||||||||||||
(In millions, except for per share data) | |||||||||||||||||||
Operating Results (A) | |||||||||||||||||||
Sales | $ | 1,372.3 | $ | 1,126.9 | $ | 970.1 | $ | 1,009.3 | $ | 942.5 | |||||||||
Operating income | 374.0 | 300.6 | 276.2 | 225.0 | 164.6 | ||||||||||||||
Net income attributable to Versum | 197.5 | 193.3 | 209.3 | 187.1 | 127.0 | ||||||||||||||
Non-GAAP Measure (B) | |||||||||||||||||||
Adjusted EBITDA | 445.4 | 372.1 | 324.2 | 304.5 | 227.1 | ||||||||||||||
Basic Earnings Per Share (C) | |||||||||||||||||||
Net income attributable to Versum | 1.81 | 1.78 | 1.93 | 1.72 | 1.17 | ||||||||||||||
Basic shares | 108.9 | 108.7 | 108.7 | 108.7 | 108.7 | ||||||||||||||
Diluted Earnings Per Share (C) | |||||||||||||||||||
Net income attributable to Versum | 1.80 | 1.77 | 1.93 | 1.72 | 1.17 | ||||||||||||||
Diluted shares | 109.8 | 109.4 | 108.7 | 108.7 | 108.7 | ||||||||||||||
Year-End Financial Position | |||||||||||||||||||
Total assets (D) | 1,505.3 | 1,255.6 | 1,052.1 | 898.4 | 1,042.0 | ||||||||||||||
Total debt (E) | 980.0 | 982.8 | 986.1 | — | 5.1 | ||||||||||||||
Other Financial Data | |||||||||||||||||||
Business separation, restructuring and cost reduction actions | 20.6 | 25.5 | 0.9 | 21.6 | 1.3 | ||||||||||||||
Research and development | 49.1 | 45.1 | 43.9 | 40.7 | 38.4 | ||||||||||||||
Depreciation and amortization | 50.8 | 46.0 | 46.9 | 56.9 | 59.5 | ||||||||||||||
(A) | Unless otherwise stated, selected financial data is presented on a GAAP basis. Our operating results were impacted by certain items which management does not believe to be indicative of ongoing business trends and are excluded from the non-GAAP measure. |
For 2018, these items include a charge to operating income of $20.6 million related to stand up company costs.
For 2017, these items include a charge to operating income of $25.5 million related to stand up company costs.
For 2016, these items include: (i) a benefit of $0.7 million related to business reorganization and cost reduction actions, and (ii) a charge related to Separation costs of $1.6 million.
For 2015, these items include a charge to operating income of $21.6 million related to business reorganization and cost reduction actions.
For 2014, these items include a charge to operating income of $1.3 million related to business reorganization and cost reduction actions.
(B) | Refer to the reconciliation of net income to Adjusted EBITDA in “Management’s Discussion and Analysis of Financial Condition and Results of Operations” in Part II, Item 7, of this Annual Report on Form 10-K. |
(C) | Versum earnings per share for 2016, 2015 and 2014 were calculated using the shares that were distributed to Air Products stockholders immediately following the Separation. For periods prior to the Separation it is assumed that there are no dilutive equity instruments as there were no Versum equity awards outstanding prior to the Separation. |
(D) | Reflects adoption of guidance on the presentation of deferred income taxes on a retrospective basis as of September 30, 2016. |
(E) | Total debt includes long-term debt, current portion of long-term debt, and short-term borrowings as of the end of the period shown above. |
33
Item 7. Management’s Discussion and Analysis of Financial Condition and Results of Operations
The following discussion and analysis of the company’s consolidated financial condition and results of operations should be read along, and is qualified in its entirety by reference to, the consolidated financial statements and the accompanying notes to the consolidated financial information included elsewhere in this Annual Report on Form 10-K. This discussion and analysis contains forward-looking statements that involve risks, uncertainties and assumptions. Actual results may differ materially from those anticipated in these forward-looking statements as a result of many factors, including but not limited to those provided in Item 1A. Risk Factors and under the heading “Cautionary Statement Concerning Forward-Looking Statements” above.
OVERVIEW
Description of the Company
Versum is a global business that provides innovative solutions for specific customer applications based on our expertise in specialty materials for the semiconductor industry. Versum is comprised of two operating segments, Materials and DS&S, under which we manage our operations and assess performance, and a Corporate segment. Strong customer relationships, collaborative development, technology leadership, unique product positioning and a strong global infrastructure with in-region flexible manufacturing capabilities are fundamental to our business.
Versum is a leading global producer of critical materials, including high purity process materials, cleaners and etchants, slurries, organosilanes and organometallics, and equipment which we sell to the semiconductor and display industries. Through our global network, our business positions its research, manufacturing and technical support close to its customer facilities, enabling supply chain optimization and rapid response times to the product and service needs of our customers. Many of our products have undergone rigorous product performance and quality reviews by our customers to be qualified for use in their products or manufacturing processes. Once these qualification processes are completed and our products are designated by our customers for use in their processes or products, it is often time consuming and costly for our customers to change suppliers. Our products perform critical tasks in customers’ products or manufacturing processes, yet typically represent a very small portion of the cost of the end product. Over the last 20 plus years, we have developed strong relationships with the majority of the industry-leading IDMs, Foundries and OEMs through on-site service and technical personnel at these customers’ facilities.
In addition to our two operating segments, our Corporate segment includes certain administrative costs associated with operating a public company, foreign exchange gains and losses and other income and expense that cannot be directly associated with operating segments. Assets in the Corporate segment include cash and deferred tax assets.
Basis of Presentation
Prior to the Separation, the Annual Consolidated Financial Statements of Versum had been derived from the consolidated financial statements and accounting records of Air Products as if we operated on a stand-alone basis during the periods presented prior to the Separation. Subsequent to the Separation, the accompanying Annual Consolidated Financial Statements are presented on a consolidated basis and include all of the accounts and operations of Versum and its majority-owned subsidiaries. The financial statements reflect the financial position, results of operations and cash flows of Versum in accordance with GAAP.
Prior to the Separation, the Annual Consolidated Income Statements of Versum reflected allocations of general corporate expenses from Air Products including, but not limited to, information technology, general services, human resources, legal, accounting and other services.
These expenses had been allocated to us on the basis of direct usage when identifiable, with the remainder allocated on the basis of fixed costs, revenue, operating income or headcount. We consider the expense allocation methodology and results to be reasonable and consistently applied for all periods presented prior to the Separation.
After the Separation, Versum has performed most of these functions using its own resources or purchased services. However, the remainder of these functions continued to be provided by Air Products under various agreements through a portion of
34
2018. During 2018 we finalized the administrative separation from Air Products including the transition to our own IT infrastructure.
Included within our Annual Consolidated Financial Statements prior to the Separation were the results of certain businesses which had historically been managed by us, but were retained by Air Products after the Separation.
Certain amounts in the discussion below have been adjusted for the company's conversion effective the fourth quarter of 2018 from the last in, first out (“LIFO”) cost method to the first in, first out (“FIFO”) cost method for determining the cost of inventories in the United States, which were our only operations that were using the LIFO cost method. The company applied this change retrospectively to all prior periods presented. For a detailed description on impacts see Note 2, “Summary of Significant Accounting Policies”, to our Annual Consolidated Financial Statements in Part II, Item 8 of this Annual Report on Form 10-K.
Our Markets
Our business is driven primarily by the demand for semiconductors for both logic and memory and to a lesser extent, displays. Growth in mobile devices, cloud computing, connectivity and data monitoring and storage are driving increasing demand for semiconductors and displays into durable goods and other devices. This has resulted in increased correlation between semiconductor demand and global gross domestic product. In our Materials segment, demand for our products is correlated to the level of semiconductor production volume which in turn is correlated to general GDP. Demand for our products is further enhanced by participation in the advanced technologies and changing architecture of semiconductor devices. In our DS&S segment, product demand more closely follows the amount of capital investment for equipment and manufacturing capacity in the semiconductor industry and sales are impacted by our customers’ investment in new fabrication facilities or in refurbishing existing fabrication facilities.
In fiscal 2018, we experienced growth in our business due to favorable trends in the underlying semiconductor market. This included strong VNAND memory demand fueled by the industry’s move to more vertical layers and the transition to 10 NM and below production in advanced logic devices. Capital spending by the semiconductor industry was at historically high levels, driving demand for equipment in our DS&S segment. In addition, increasing semiconductor output levels fueled demand for our products in the materials segment.
Longer term semiconductor industry growth is expected to remain attractive, growing at a multiple of GDP driven by the broadening use of technology into many market segments including automotive, industrial, medical, data analytic and consumer applications.
For 2019, we expect semiconductor volume growth to remain in the 5 to 7% range as measured by MSI (millions of square inches of silicon produced) and semiconductor capital spending, measured by WFE (wafer fab equipment spending) to be down single digits but to remain at historically high levels.
We believe semiconductor volume growth will continue to translate into strong demand for both new and legacy material products in our Materials segment. To take advantage of the strong market we expect to continue to innovate and increase manufacturing capability for our new products in our Advanced Materials product line. We expect to increase our investment to support organic growth to enhance our positions in key geographies such as Korea and China and improve our cost and capacity positions for key products in our Materials segment. We expect lessening headwinds from pricing and continued capacity constraints for certain products in our Process Materials product line.
We expect our Delivery System and Services segment to continue to benefit from the continued high level of industry capital spending, our position with key customers and the further development of the semiconductor market in China.
35
Performance Summary
September 30, 2018 vs. September 30, 2017
• | Sales of $1,372.3 million increased $245.4 million, or 21.8%. Sales increased 24% due to higher volumes partially offset by unfavorable price/mix of 3%. Strong volumes across all businesses due primarily to the robust memory market was the major driver of the increase. Currency changes had a favorable impact on sales of 1%. |
• | Operating income of $374 million increased $73.4 million, or 24.4%, due to higher volumes of $106 million in both DS&S and Materials and lower business separation, restructuring and cost reduction actions of $5 million partially offset by higher Selling & Administrative and Research & Development (“SARD”) and other costs of $25 million to support growth and unfavorable gross profit impacts of $13 million primarily due to unfavorable impacts in Process Materials, including price/mix and increased depreciation. Operating income margin was 27.3%, up 60 basis points (“bp”). |
• | Adjusted EBITDA of $445.4 million increased $73.3 million, or 19.7%, primarily due to higher volumes of $106 million partially offset by higher SARD and other costs of $23 million and unfavorable gross profit impacts of $10 million. The major drivers of the improved performance were the strong volumes in both DS&S and Materials. These were partially offset by unfavorable gross profit impacts in Process Materials, including price/mix, and higher SARD and other costs to support future growth. Adjusted EBITDA margin was 32.5%, down 50 bp. |
• | Cash flows from operations was $278.3 million, with cash used for capital spending of $115.4 million, including $28.7 million of capital spending related to one-time restructuring activities. |
RESULTS OF OPERATIONS
Discussion of Consolidated Results - September 30, 2018 vs. September 30, 2017 vs. September 30, 2016
Year Ended September 30, | |||||||||||
2018 | 2017 | 2016 | |||||||||
(In millions) | |||||||||||
Sales | $ | 1,372.3 | $ | 1,126.9 | $ | 970.1 | |||||
Cost of sales | 788.1 | 636.4 | 542.2 | ||||||||
Selling and administrative | 143.1 | 125.7 | 109.8 | ||||||||
Research and development | 49.1 | 45.1 | 43.9 | ||||||||
Business separation, restructuring and cost reduction actions | 20.6 | 25.5 | 0.9 | ||||||||
Other (income) expense, net | (2.6 | ) | (6.4 | ) | (2.9 | ) | |||||
Operating Income | 374.0 | 300.6 | 276.2 | ||||||||
Equity affiliates’ income | — | — | 0.2 | ||||||||
Interest expense | 48.3 | 47.4 | 0.4 | ||||||||
Write-off of financing costs | 2.1 | — | — | ||||||||
Income Before Taxes | 323.6 | 253.2 | 276.0 | ||||||||
Income tax provision | 118.9 | 53.0 | 58.8 | ||||||||
Net Income | 204.7 | 200.2 | 217.2 | ||||||||
Less: Net Income Attributable to Non-controlling Interests | 7.2 | 6.9 | 7.9 | ||||||||
Net Income Attributable to Versum | $ | 197.5 | $ | 193.3 | $ | 209.3 | |||||
Non-GAAP Basis | |||||||||||
Adjusted EBITDA | $ | 445.4 | $ | 372.1 | $ | 324.2 | |||||
36
Year ended September 30, 2018 vs. September 30, 2017
% Change from Prior Year | ||
Sales | ||
Volume | 24 | % |
Price/mix | (3 | )% |
Currency | 1 | % |
Total Versum Change | 22 | % |
Sales of $1,372.3 million increased $245.4 million, or 21.8%. Sales increased due to higher volumes of 24% partially offset by unfavorable price/mix of 3%. Currency changes had a favorable impact on sales of 1%. The Materials segment’s sales increased 7% led by strong volume growth across the segment offset by unfavorable price/mix primarily in Process Materials. The DS&S segment’s sales increased 65% primarily due to higher volumes driven by the strong equipment and installation project growth, especially in Korea and China.
Operating Income and Margin
Operating income of $374.0 million increased $73.4 million, or 24.4%, due to higher volumes of $106 million and lower business separation, restructuring and cost reduction actions of $5 million partially offset by higher SARD and other costs of $25 million and unfavorable gross profit impacts of $13 million primarily due to unfavorable price/mix and higher depreciation. Operating margin increased 60 bp.
Cost of Sales and Gross Profit Margin
Cost of sales of $788.1 million increased $151.7 million, or 23.8%, as a result of higher delivery systems activity of $122 million, higher raw material costs of $27 million and higher operating costs of $3 million. Gross profit margin of 42.6% decreased by 90 bp primarily as a result of unfavorable segment mix due to robust DS&S growth.
Selling and Administrative Expense
Selling and administrative expense of $143.1 million increased by $17.4 million. The increase was primarily due to increased staffing to support business future growth and infrastructure costs attributed to becoming an independent company. Selling and administrative expense as a percent of sales decreased to 10.4% from 11.2%.
Research and Development
Research and development expense of $49.1 million increased $4.0 million, or 8.9% primarily due to increased staffing following our prior year restructuring. Research and development expense as a percent of sales decreased to 3.6% from 4.0%.
Business Separation, Restructuring and Cost Reduction Actions
During fiscal year 2018, we recognized a net charge of $20.6 million. The net charge primarily consisted of additional costs as a result of the relocation of certain research and development activities and our headquarters and set up of the stand-alone organization and infrastructure.
Other Income (Expense), Net
Items recorded to other income (expense), net arise from transactions and events not directly related to our principal income earning activities.
Other income (expense), net was $2.6 million in 2018 compared to $6.4 million in 2017. This change is primarily due to changes in foreign exchange on overseas cash holdings.
37
Interest Expense
Interest expense increased $0.9 million due to interest rate fluctuations offset by the favorable debt repricing.
Effective Tax Rate
The effective tax rate equals the income tax provision divided by income before taxes. The effective tax rate was 36.7% and 20.9% in 2018 and 2017, respectively. The effective tax rate increased in 2018 primarily due to (1) a one-time U.S. tax charge on the deemed mandatory repatriation of certain accumulated foreign earnings as a result of the newly enacted Tax Act; (2) a tax charge related to non-deductible foreign exchange loss in a foreign jurisdiction; (3) a decrease in benefits associated with foreign tax holidays; offset by (4) a benefit related to the release of uncertain tax positions in foreign jurisdictions as a result of statute expirations and audit settlements; and (5) a benefit for a one-time revaluation of deferred tax assets and liabilities as a result of the tax rate and compensation deductibility provisions in the Tax Act. For more information, see Note 19, “Income Taxes”, to our Annual Consolidated Financial Statements in Part II, Item 8 of this Annual Report on Form 10-K.
Year ended September 30, 2017 vs. September 30, 2016
% Change from Prior Year | ||
Sales | ||
Volume | 18 | % |
Price/mix | (3 | )% |
Currency | 1 | % |
Total Versum Change | 16 | % |
Sales of $1,126.9 million increased $156.8 million, or 16.2%. Underlying sales, which excludes currency, increased by 15% due to higher volumes of 18% partially offset by unfavorable price/mix of 3%. Favorable currency impacts increased sales by 1%. The Materials segment’s sales increased 10% from strong memory market demand and advanced logic new node ramps partially offset by unfavorable price/mix. The DS&S segment’s sales increased 38% primarily due to higher volumes from equipment sales driven by the continued high level of semiconductor industry capital spending.
Operating Income and Margin
Operating income of $300.6 million increased $24.4 million, or 8.8%, due to higher volumes of $88 million partially offset by unfavorable gross profit impacts of $25 million primarily due to price/mix, higher business separation, restructuring and cost reduction actions of $25 million and higher SARD and other costs of $14 million in part due to the increased cost of being a separate company. Operating margin decreased 180 bp, primarily due to the increased cost of being a separate company and higher business separation, restructuring and cost reduction actions.
Cost of Sales and Gross Profit Margin
Cost of sales of $636.4 million increased $94.2 million, or 17.4%, as a result of higher delivery systems activity of $58 million, higher materials operating costs of $22 million and higher raw materials cost of $14 million due to higher volumes. Gross profit margin of 43.5% decreased by 60 bp primarily as a result of unfavorable price/mix of 200 bp partially offset by favorable volumes of 100 bp.
Selling and Administrative Expense
Selling and administrative expense of $125.7 million increased by $15.9 million. The increase was primarily due to increased staffing and costs associated with becoming an independent company. Selling and administrative expense as a percent of sales decreased to 11.2% from 11.3%.
38
Research and Development
Research and development expense of $45.1 million increased $1.2 million, or 2.7%, primarily due to spending in key product areas. Research and development expense as a percent of sales decreased to 4.0% from 4.5%.
Business Separation, Restructuring and Cost Reduction Actions
During fiscal year 2017, we recognized a net charge of $25.5 million. The net charge primarily consisted of additional costs as a result of the relocation of certain research and development activities and our headquarters and set up of the stand-alone organization and IT infrastructure.
During fiscal year 2016, we recognized a net charge of $0.9 million. The charge included incurred costs of $1.6 million related to the Separation partially offset by a net gain of $0.7 million. The 2016 net gain of $0.7 million included a charge of $2.5 million for severance and other benefits related to the elimination of approximately 90 positions as part of cost reduction actions. In addition, we recognized a gain of $3.2 million on assets that were previously written down to a carrying value of $17.9 million. The gain included $1.4 million related to the final sale of the onsite ammonia assets.
Other Income (Expense), Net
Items recorded to other income (expense), net arise from transactions and events not directly related to our principal income earning activities.
Other income (expense), net was $6.4 million in 2017 compared to $2.9 million in 2016. No individual items were significant in comparison to the prior year.
Interest Expense
Interest incurred increased $47.0 million in 2017 compared to 2016. The increase was driven by interest expense on the debt incurred in September 2016 in connection with the Separation.
Effective Tax Rate
The effective tax rate equals the income tax provision divided by income before taxes. The effective tax rate was 20.9% and 21.3% in 2017 and 2016, respectively. The effective tax rate decreased in 2017 primarily due to (1) a shift in the geographic mix of pretax earnings; (2) an increase in benefits associated with tax holidays; and (3) a decrease in cost of repatriating foreign earnings. For more information, see Note 19, “Income Taxes”, to our Annual Consolidated Financial Statements in Part II, Item 8 of this Annual Report on Form 10-K.
39
RECONCILIATION OF NON-GAAP FINANCIAL MEASURES
The discussion of our annual results includes comparisons to non-GAAP financial measures, including Adjusted EBITDA and Adjusted EBITDA Margin. The presentation of non-GAAP measures is intended to enhance the usefulness of financial information by providing measures which management uses internally to evaluate our operating performance.
We use non-GAAP measures to assess our operating performance by excluding certain disclosed items that we believe are not representative of our underlying business. Management may use these non-GAAP measures to evaluate our performance period over period and relative to competitors in our industry, to analyze underlying trends in our business, to establish operational budgets and forecasts or for incentive compensation purposes. We use Adjusted EBITDA to calculate performance-based cash bonuses and determine whether certain performance-based options and restricted stock units vest (as such cash bonuses, options and restricted stock units are tied to Adjusted EBITDA). We use Segment Adjusted EBITDA as the primary measure to evaluate the ongoing performance of our business segments. We believe non-GAAP financial measures provide security analysts, investors and other interested parties with meaningful information to understand our underlying operating results and to analyze financial and business trends. Non-GAAP financial measures, including Adjusted EBITDA, should not be viewed in isolation, are not a substitute for GAAP measures, and have limitations which include but are not limited to:
• | Our measures exclude (1) expenses related to business separation, restructuring and cost reduction actions, as detailed in Note 5, “Business Separation, Restructuring and Cost Reduction Actions”, to our Annual Consolidated Financial Statements included in Part II, Item 8 of this Annual Report on Form 10-K, and (2) the write-off of financing costs, each of which we do not consider to be representative of our underlying business operations. However, these disclosed items represent costs to Versum. |
• | Though not business operating costs, interest expense and income tax provision represent ongoing costs of Versum. |
• | Depreciation and amortization charges represent the wear and tear or reduction in value of the plant, equipment, and intangible assets which permit us to manufacture and market our products. |
• | Other companies may define non-GAAP measures differently than we do, limiting their usefulness as comparative measures. |
A reader may find any one or all of these items important in evaluating our performance. Management compensates for the limitations of using non-GAAP financial measures by using them only to supplement our GAAP results to provide a more complete understanding of the factors and trends affecting our business. In evaluating these non-GAAP financial measures, the reader should be aware that we may incur expenses similar to those eliminated in this presentation in the future.
Presented below is a reconciliation of the reported GAAP results to the non-GAAP measure:
Adjusted EBITDA and EBITDA Margin
We define Adjusted EBITDA as net income excluding certain disclosed items, which we do not believe to be indicative of underlying business trends, before interest expense, write-off of financing costs, income tax provision, depreciation and amortization expense, non-controlling interest and business separation, restructuring, and cost reduction actions. Adjusted EBITDA provides a useful metric for management to assess operating performance. Adjusted EBITDA margin is calculated by dividing Adjusted EBITDA by sales.
40
Below is a reconciliation of net income to Adjusted EBITDA:
Year Ended September 30, | |||||||||||
2018 | 2017 | 2016 | |||||||||
(In millions, except percentages) | |||||||||||
Net Income Attributable to Versum | $ | 197.5 | $ | 193.3 | $ | 209.3 | |||||
Add: Interest expense | 48.3 | 47.4 | 0.4 | ||||||||
Add: Write-off of financing costs | 2.1 | — | — | ||||||||
Add: Income tax provision | 118.9 | 53.0 | 58.8 | ||||||||
Add: Depreciation and amortization | 50.8 | 46.0 | 46.9 | ||||||||
Add: Non-controlling interests | 7.2 | 6.9 | 7.9 | ||||||||
Add: Business separation, restructuring and cost reduction actions | 20.6 | 25.5 | 0.9 | ||||||||
Adjusted EBITDA | $ | 445.4 | $ | 372.1 | $ | 324.2 | |||||
Adjusted EBITDA Margin | 32.5 | % | 33.0 | % | 33.4 | % | |||||
Change from prior year | $ | 73.3 | $ | 47.9 | $ | 19.7 | |||||
% change from prior year | 19.7 | % | 14.8 | % | 6.5 | % | |||||
Year ended September 30, 2018 vs. September 30, 2017
Adjusted EBITDA of $445.4 million increased $73.3 million, or 19.7%, primarily due to higher volumes of $106 million partially offset by higher SARD and other costs of $23 million and unfavorable gross profit impacts of $10 million.
Year ended September 30, 2017 vs. September 30, 2016
Adjusted EBITDA of $372.1 million increased $47.9 million, or 14.8%, primarily due to higher volumes of $88 million partially offset by unfavorable gross margin impacts of $25 million and higher SARD and other costs of $15 million.
SEGMENT LEVEL FINANCIAL RESULTS
Sales | |||||||||||
Year Ended September 30, | |||||||||||
2018 | 2017 | 2016 | |||||||||
(In millions) | |||||||||||
Materials | $ | 885.6 | $ | 829.7 | $ | 756.7 | |||||
DS&S | 483.7 | 293.6 | 213.4 | ||||||||
Corporate | 3.0 | 3.6 | — | ||||||||
Total Company Sales | $ | 1,372.3 | $ | 1,126.9 | $ | 970.1 | |||||
41
Below is a reconciliation of segment operating income to segment adjusted EBITDA:
Year Ended September 30, | |||||||||||
2018 | 2017 | 2016 | |||||||||
(In millions, except percentages) | |||||||||||
Materials | |||||||||||
Operating income | $ | 286.5 | $ | 274.9 | $ | 249.6 | |||||
Add: Depreciation and amortization | 47.7 | 43.1 | 44.4 | ||||||||
Add: Equity affiliates’ income | — | — | 0.2 | ||||||||
Segment Adjusted EBITDA | $ | 334.2 | $ | 318.0 | $ | 294.2 | |||||
Segment Adjusted EBITDA margin(A) | 37.7 | % | 38.3 | % | 38.9 | % | |||||
DS&S | |||||||||||
Operating income | $ | 135.5 | $ | 71.7 | $ | 50.8 | |||||
Add: Depreciation and amortization | 2.1 | 1.4 | 2.1 | ||||||||
Segment Adjusted EBITDA | $ | 137.6 | $ | 73.1 | $ | 52.9 | |||||
Segment Adjusted EBITDA margin(A) | 28.4 | % | 24.9 | % | 24.8 | % | |||||
Corporate | |||||||||||
Operating loss | $ | (27.4 | ) | $ | (20.5 | ) | $ | (23.3 | ) | ||
Add: Depreciation and amortization | 1.0 | 1.5 | 0.4 | ||||||||
Segment Adjusted EBITDA | $ | (26.4 | ) | $ | (19.0 | ) | $ | (22.9 | ) | ||
Total Versum Adjusted EBITDA | $ | 445.4 | $ | 372.1 | $ | 324.2 | |||||
(A) | Segment adjusted EBITDA margin is calculated by dividing segment Adjusted EBITDA by segment sales. |
Below is a reconciliation of segment total operating income to consolidated operating income:
Year Ended September 30, | |||||||||||
(In millions) | 2018 | 2017 | 2016 | ||||||||
Operating Income | |||||||||||
Segment total | $ | 394.6 | $ | 326.1 | $ | 277.1 | |||||
Business separation, restructuring and cost reduction actions | (20.6 | ) | (25.5 | ) | (0.9 | ) | |||||
Consolidated Total | $ | 374.0 | $ | 300.6 | $ | 276.2 | |||||
Materials
% Change from Prior Year | |||||
2018 | 2017 | ||||
Sales | |||||
Volume | 10 | % | 12 | % | |
Price/mix | (4 | )% | (3 | )% | |
Currency | 1 | % | 1 | % | |
Total Materials Sales Change | 7 | % | 10 | % | |
42
Year ended September 30, 2018 vs. September 30, 2017
Sales of $885.6 million increased $55.9 million, or 6.7%, primarily due to higher volumes of 10% and favorable currency impacts of 1%. The higher volumes of 10% were driven by double-digit volume growth in Advanced Materials and high single digit volume growth in Process Materials. These increases were partially offset by unfavorable price/mix of 4%. Growth was broad based from new and legacy products in both memory and logic.
Operating income of $286.5 million increased $11.6 million, or 4.2%, due to higher volumes of $37 million partially offset by higher SARD costs of $15 million in support of growth investments and expansion initiatives and gross profit impacts of $10 million primarily from depreciation and Process Materials carryover price/mix and higher costs to support our strategic initiatives.
Adjusted EBITDA of $334.2 million increased $16.2 million, or 5.1%, due to higher volumes of $37 million partially offset by higher SARD costs of $13 million in support of growth investments and expansion initiatives and gross profit impacts of $8 million primarily from Process Materials carryover pricing impacts, mix and higher costs to support our strategic initiatives. Adjusted EBITDA margin of 37.7% decreased 60 bp, primarily due to higher SARD costs in part to support our growth investments and expansion initiatives.
Year ended September 30, 2017 vs. September 30, 2016
Sales of $829.7 million increased $73.0 million, or 9.6%, primarily due to higher volumes of 12% and favorable currency impacts of 1%. The higher volumes of 12% were driven by strong memory market growth and advanced logic new node ramps. These increases were partially offset by unfavorable price/mix of 3%.
Operating income of $274.9 million increased $25.3 million, or 10.1%, due to higher volumes of $60 million and favorable partially offset by unfavorable gross profit impacts of $22 million and unfavorable SARD and other costs of $13 million.
Adjusted EBITDA of $318.0 million increased $23.8 million, or 8.1%, due to higher volumes of $60 million partially offset by unfavorable gross profit impacts of $22 million and unfavorable SARD and other costs of $14 million. Adjusted EBITDA margin of 38.3% decreased 60 bp, primarily due to higher costs and unfavorable price/mix.
Delivery Systems and Services
% Change from Prior Year | |||||
2018 | 2017 | ||||
Sales | |||||
Volume | 63 | % | 38 | % | |
Price/mix | — | % | — | % | |
Currency | 2 | % | — | % | |
Total DS&S Sales Change | 65 | % | 38 | % | |
Year ended September 30, 2018 vs. September 30, 2017
Sales of $483.7 million increased $190.1 million, or 64.7%, due to increased equipment and installation demand across all products and regions, especially in Korea and China.
Operating income of $135.5 million increased $63.8 million, or 89.0%, due to higher volumes of $69 million partially offset by higher SARD and other costs of $4 million and gross profit impacts of $1 million.
Adjusted EBITDA of $137.6 million increased $64.5 million, or 88.2%, due to higher volumes of $69 million partially offset by higher SARD and other costs of $4 million and gross profit impacts of $1 million. Adjusted EBITDA margin of 28.4% increased 350 bp.
43
Year ended September 30, 2017 vs. September 30, 2016
Sales of $293.6 million increased $80.2 million, or 37.6%, due to increased equipment sales driven by the continued high level of semiconductor industry capital spending.
Operating income of $71.7 million increased $20.9 million, or 41.1%, due to higher volumes of $28 million partially offset by unfavorable gross profit impacts of $5 million and higher SARD and other costs of $2 million.
Adjusted EBITDA of $73.1 million increased $20.2 million, or 38.2%, due to higher volumes of $28 million partially offset by unfavorable gross profit impacts of $6 million and higher SARD and other costs of $2 million. Adjusted EBITDA margin of 24.9% increased 10 bp.
Corporate
Year ended September 30, 2018 vs. September 30, 2017
Operating loss of $27.4 million increased by $6.9 million, or 33.7%, primarily due to unfavorable foreign exchange impacts on overseas cash holdings and unfavorable audit and tax fees.
Adjusted EBITDA loss of $26.4 million increased by $7.4 million, or 38.9%, primarily due to unfavorable foreign exchange impacts on overseas cash holdings and unfavorable audit and tax fees.
Year ended September 30, 2017 vs. September 30, 2016
Operating loss of $20.5 million decreased by $2.8 million or 12.0%, primarily due to lower incentive compensation costs recorded in the corporate segment partially offset by the higher costs of becoming a stand-alone company.
Adjusted EBITDA loss of $19.0 million decreased by $3.9 million or 17.0%, primarily due to lower incentive compensation costs recorded in the corporate segment partially offset by higher cost of becoming a stand-alone company.
44
LIQUIDITY AND CAPITAL RESOURCES
Historically, a significant portion of our cash balances are generated by operating activities. Our primary sources of liquidity are cash on hand, which was $399.8 million at September 30, 2018, our cash flows from operations, our senior secured first lien revolving credit facility (the “Revolving Facility”) and various non-U.S. credit facilities. We anticipate that our primary uses of cash will be for working capital, debt service, capital expenditures for expansion, productivity and maintenance, potential dividends, acquisitions and general corporate purposes. Our ability to fund these uses of liquidity also will often depend upon where we generate cash, our ability to reinvest in such countries and our ability to repatriate cash into the U.S. Our ability to fund operations and capital needs will depend upon our ongoing ability to generate cash from operations and access the capital markets. We believe that future cash from operations, our Revolving Facility, and access to capital markets will provide adequate resources to meet working capital needs, potential dividends, capital expenditures and strategic investments.
As of September 30, 2018, the majority of our cash and cash items of $399.8 million were held outside the U.S. If we elect to repatriate the foreign cash, we may be required to accrue and pay withholding taxes on a portion of these amounts.
As of September 30, 2018, we had availability of $200 million under our Revolving Facility and approximately $20.3 million under our various non-U.S. credit facilities.
As of September 30, 2018, we had $988.5 million of total debt. Our scheduled principal repayments on debt for our fiscal years include $5.8 million due in 2019, $5.8 million due in 2020, $5.8 million due in 2021, $5.8 million due in 2022, $540.3 million due in 2023 and $425.0 million due thereafter. We were in compliance with all of our debt covenants at September 30, 2018, and we expect to remain in compliance with these covenants for at least the next twelve months.
On October 10, 2017, Versum amended its credit agreement. The amendment decreased the interest rate on borrowings under the Term Facility to LIBOR plus a margin of 2.00%, or an alternate base rate plus a margin of 1.00%. The amendment removed the minimum floor on LIBOR and the alternate base rate. If our total leverage ratio is equal to or less than 2.00:1.00 (calculated without any netting of cash on hand) the interest rate on the term loan facility will decrease further to LIBOR plus a margin of 1.75%, or an alternate base rate plus a margin of 0.75%.
For a summary of our Senior Credit Facilities and the Notes, see Note 11, “Debt”, to our Annual Consolidated Financial Statements included in Part II, Item 8 of this Annual Report on Form 10-K.
To take advantage of the continued strong market demand and the opportunity to drive organic growth, we anticipate increasing our capital expenditures in fiscal year 2019. This includes enhancing our research and manufacturing capabilities in key geographies such as Korea and China and improving our cost and capacity positions in certain Materials products.
Additionally, in support of finalizing our transition to an independent company, we expect to spend an additional $3-5 million of additional capital for establishing our own IT systems during fiscal year 2019.
In connection with the Tax Act, we recorded a provisional liability of $53.8 million for the Federal and State taxes on the mandatory deemed repatriation of certain foreign accumulated earnings. Due to taxes on the mandatory deemed repatriation, less certain tax credits, we expect our Federal and State cash taxes for our fiscal years to increase $3.2 million for 2019, $3.2 million for 2020, $3.2 million for 2021, $3.2 million for 2022, $3.2 million for 2023 and $24.5 million thereafter.
45
CASH FLOWS
For the years ended September 30, 2018, September 30, 2017 and September 30, 2016
Our cash flows provided by (used in) operating, investing, and financing activities as reflected in the consolidated statements of cash flows, are summarized in the following table:
Year Ended September 30, | |||||||||||
2018 | 2017 | 2016 | |||||||||
(In millions) | |||||||||||
Operating activities | $ | 278.3 | $ | 262.5 | $ | 253.4 | |||||
Investing activities | (114.0 | ) | (73.6 | ) | (61.9 | ) | |||||
Financing activities | (37.1 | ) | (24.7 | ) | (105.5 | ) | |||||
Operating Activities
For the year ended September 30, 2018, cash provided by operating activities was $278.3 million. Net income attributable to Versum of $197.5 million is adjusted for reconciling items that include depreciation and amortization, share-based compensation expense, deferred income taxes and gain on sale of assets. Working capital was a use of cash of $2.4 million. The change in working capital was primarily a result of increases in trade receivables, inventory and contracts in progress less progress billings due to increased sales activity and period over period timing differences related to collections. This was partially offset by an increase in accrued income taxes of $50.9 million largely attributable to a charge as a result of the Tax Act.
For the year ended September 30, 2017, cash provided by operating activities was $262.5 million. Net income attributable to Versum of $193.3 million is adjusted for reconciling items that include depreciation and amortization, share-based compensation expense, deferred income taxes and gain on sale of assets. Working capital provided cash of $8.0 million. The change in working capital was primarily a result of an increase in payables and accruals partially offset by increases in trade receivables and inventory. The increase in payables and accruals was primarily the result of period to period timing differences related to payments including those associated with the Separation. The increases in trade receivables and inventory was primarily the result of increased sales activity and period over period timing differences related to collections.
For the year ended September 30, 2016, cash provided by operating activities was $253.4 million. Net income attributable to Versum of $209.3 million is adjusted for reconciling items that include depreciation and amortization, share-based compensation expense, write-down of long-lived assets associated with restructuring, gain on sale of assets, undistributed earnings of equity affiliates and deferred income taxes. We used cash of $3.9 million for working capital purposes. The increase in contracts in progress, less progress billings of $9.2 million primarily relates to spending on large projects.
Investing Activities
For the year ended September 30, 2018, cash used by investing activities was $114.0 million, primarily due to spending for plant and equipment. For the year ended September 30, 2017, cash used for investing activities was $73.6 million, primarily due to spending for plant and equipment and an acquisition. For the year ended September 30, 2016, cash used for investing activities was $61.9 million, as spending for plant and equipment and transfers to restricted cash were partially offset by proceeds from the sale of assets.
Capital expenditures in the year ended September 30, 2018 totaled $115.4 million, including $28.7 million of capital spending related to one-time restructuring activities, compared to $64.0 million, including $25.2 million of capital spending related to one-time restructuring activities in the year ended September 30, 2017. The increase in capital expenditures of $51.4 million for the period was primarily due to higher organic capital spending for plant and equipment and research facilities to support future growth in our business.
Capital expenditures in the year ended September 30, 2017 totaled $64.0 million, including $25.2 million of capital spending related to one-time restructuring activities, compared to $35.8 million in the year ended September 30, 2016. The increase
46
in capital expenditures of $28.2 million for the period was primarily due to restructuring capital expenditures associated with the relocation of our research and development activities and ERP project spending.
Cash flow from operations is expected to primarily fund capital spending to fuel organic growth.
Financing Activities
For the year ended September 30, 2018, cash used for financing activities was $37.1 million primarily due to the payment of long-term debt, dividends paid to shareholders and dividends paid to non-controlling interests. For the year ended September 30, 2017, cash used for financing activities was $24.7 million primarily due to dividends paid to shareholders, distributions to non-controlling interests and payments on long-term debt. For the year ended September 30, 2016, cash used for financing activities was $105.5 million primarily due to net transfers to Air Products partially offset by proceeds from issuance of long-term debt.
CONTRACTUAL OBLIGATIONS
The following table summarizes our contractual obligations at September 30, 2018:
Payments Due for Year Ending September 30, | |||||||||||||||||||||||||||
Total | 2019 | 2020 | 2021 | 2022 | 2023 | Thereafter | |||||||||||||||||||||
(In millions) | |||||||||||||||||||||||||||
Operating leases | $ | 22.1 | $ | 5.7 | $ | 4.5 | $ | 4.0 | $ | 3.5 | $ | 2.4 | $ | 2.0 | |||||||||||||
Unconditional purchase obligations | 44.5 | 44.5 | — | — | — | — | — | ||||||||||||||||||||
Long-term debt obligations | |||||||||||||||||||||||||||
Debt | 988.5 | 5.8 | 5.8 | 5.8 | 5.8 | 540.3 | 425.0 | ||||||||||||||||||||
Expected interest payments on debt | 260.8 | 48.2 | 47.7 | 47.4 | 47.2 | 46.9 | 23.4 | ||||||||||||||||||||
Total Contractual Obligations | $ | 1,315.9 | $ | 104.2 | $ | 58.0 | $ | 57.2 | $ | 56.5 | $ | 589.6 | $ | 450.4 | |||||||||||||
Leases
For more information on operating leases, see Note 12, “Leases”, to our Annual Consolidated Financial Statements included in Part II, Item 8 of this Annual Report on Form 10-K.
Unconditional Purchase Obligations
The unconditional purchase obligations are primarily related to plant and equipment as well as R&D facility enhancements in 2018. Otherwise there are no material obligations.
Long-term Debt Obligations
The long-term debt obligations include the maturity payments of long-term debt, including current portion, and the related contractual interest obligations. Refer to Note 11, “Debt”, to our Annual Consolidated Financial Statements included in Part II, Item 8 of this Annual Report on Form 10-K for additional information on long-term debt.
Contractual interest is the interest we are contracted to pay on the long-term debt obligations. We had $563.5 million of long-term debt subject to variable interest rates at September 30, 2018. The rate assumed for the variable interest component of the contractual interest obligation was the rate in effect at September 30, 2018. In addition, we had $425.0 million of Senior Notes subject to a 5.5% interest rate at September 30, 2018.
Income Tax Liabilities
Non-current deferred income tax liabilities as of September 30, 2018 were $41.3 million. Liabilities related to unrecognized tax benefits, including interest and penalties, as of September 30, 2018 were $14.8 million. These tax liabilities were excluded
47
from the Contractual Obligations table, as it is impractical to determine a cash impact by year given that payments will vary according to changes in tax laws, tax rates, and our operating results. In addition, there are uncertainties in timing of the effective settlement of our uncertain tax positions with respective taxing authorities. For more information, see Note 19, “Income Taxes”, to our Annual Consolidated Financial Statements included in Part II, Item 8 of this Annual Report on Form 10-K.
LONG-TERM EMPLOYEE BENEFITS
Air Products sponsors defined benefit pension plans and defined contribution plans that are shared amongst its businesses. Prior to the Separation participation of our employees in these plans is reflected in the annual consolidated financial statements as though we participated in a multi-employer plan with Air Products.
Refer to Note 15, “Retirement Benefits”, to our Annual Consolidated Financial Statements included in Part II, Item 8 of this Annual Report on Form 10-K.
OFF-BALANCE SHEET ARRANGEMENTS
As of September 30, 2018, we did not have any off-balance sheet arrangements.
RELATED PARTY TRANSACTIONS
See Note 4, “Related Party Transactions”, to our Annual Consolidated Financial Statements in Part II, Item 8 on this Annual Report on Form 10-K for details.
INFLATION
We operate in many countries that experience volatility in inflation and foreign exchange rates. The ability to pass on inflationary cost increases is an uncertainty due to general economic conditions and competitive situations. It is estimated that the cost of replacing our plant and equipment today is greater than its historical cost. Accordingly, depreciation expense would be greater if the expense were stated on a current cost basis.
CRITICAL ACCOUNTING POLICIES AND ESTIMATES
Note 2, “Summary of Significant Accounting Policies”, to our Annual Consolidated Financial Statements included in Part II, Item 8 of this Annual Report on Form 10-K describes our major accounting policies. Judgments and estimates of uncertainties are required in applying our accounting policies in many areas. However, application of the critical accounting policies discussed below requires management’s significant judgments, often as the result of the need to make estimates of matters that are inherently uncertain. If actual results were to differ materially from the estimates made, the reported results could be materially affected. Our management has reviewed these critical accounting policies and estimates and related disclosures with our audit committee.
Principles of Consolidation
Prior to the Separation, the Annual Consolidated Financial Statements were derived from Air Products’ consolidated financial statements and accounting records where Versum was a division of Air Products. Subsequent to the Separation, the accompanying Annual Consolidated Financial Statements are presented on a consolidated basis and include all of the accounts and operations of Versum and its majority-owned subsidiaries as a stand alone company. The financial statements reflect the financial position, results of operations and cash flows of Versum in accordance with GAAP. Transactions between Versum and Air Products prior to the Separation were reflected in the consolidated balance sheets as “Air Products’ net investment” and in the consolidated statements of cash flows as a financing activity in “Net transfers to Air Products.”
Prior to the Separation, Air Products provided us with centrally managed services and corporate functions. Accordingly, certain shared costs including but not limited to administrative expenses for information technology, general services, human resources, legal, accounting and other services, had been allocated to us and were reflected as expenses in the Annual Consolidated Financial Statements. Expenses had been allocated on the basis of direct usage when identifiable, with the
48
remainder allocated on the basis of fixed costs, revenue, operating income or headcount. We consider the expense allocation methodology and results to be reasonable and consistently applied for all periods presented prior to the Separation. However, these allocations may not be indicative of the actual expenses we would have incurred as an independent public company or of the costs we will incur in the future. For the periods prior to October 1, 2016, the Annual Consolidated Balance Sheets of Versum included Air Products’ assets and liabilities that were specifically identifiable or otherwise were transferred to us, including subsidiaries and affiliates in which Air Products had a controlling financial interest. Also included within our Annual Consolidated Financial Statements were the results of certain businesses which had historically been managed by us but were retained by Air Products after the Separation.
Impairment of Assets
Plant and Equipment
Plant and equipment held for use is grouped for impairment testing at the lowest level for which there is identifiable cash flows. Impairment testing of the asset group occurs whenever events or changes in circumstances indicate that the carrying amount of the assets may not be recoverable. Such circumstances would include a significant decrease in the market value of a long-lived asset grouping, a significant adverse change in the manner in which the asset grouping is being used or in its physical condition, a history of operating or cash flow losses associated with the use of the asset grouping, or changes in the expected useful life of the long-lived assets.
If such circumstances are determined to exist, an estimate of undiscounted future cash flows produced by that asset group is compared to the carrying value to determine whether impairment exists. If an asset group is determined to be impaired, the loss is measured based on the difference between the asset group’s fair value and its carrying value. An estimate of the asset group’s fair value is based on the discounted value of its estimated cash flows. Assets to be disposed of by sale are reported at the lower of carrying amount or fair value less cost to sell.
The assumptions underlying cash flow projections represent management’s best estimates at the time of the impairment review. Factors that management must estimate include industry and market conditions, sales volumes and prices, costs to produce, inflation, etc. Changes in key assumptions or actual conditions that differ from estimates could result in an impairment charge. We use reasonable and supportable assumptions when performing impairment reviews and cannot predict the occurrence of future events and circumstances that could result in impairment charges.
Intangible Assets
Intangible assets with determinable lives at September 30, 2018 totaled $63.5 million and consisted primarily of customer relationships, patents and technology. These intangible assets are tested for impairment as part of the long-lived asset grouping impairment tests. Impairment testing of the asset group occurs whenever events or changes in circumstances indicate that the carrying amount of the assets may not be recoverable. See the impairment discussion above under Plant and Equipment for a description of how impairment losses are determined. Disclosures related to intangible assets are included in Note 10 to our Annual Consolidated Financial Statements included in Part II, Item 8 of this Annual Report on form 10-K.
Goodwill
The acquisition method of accounting for business combinations currently requires us to make use of estimates and judgments to allocate the purchase price paid for acquisitions to the fair value of the net tangible and identifiable intangible assets. Goodwill represents the excess of the purchase price over the estimated fair value of net assets acquired, including identified intangibles. Goodwill was $183.0 million as of September 30, 2018. Disclosures related to goodwill are included in Note 9 to our Annual Consolidated Financial Statements included in Part II, Item 8 of this Annual Report on form 10-K.
We perform an impairment test annually in the fourth quarter of the fiscal year and whenever events or changes in circumstances indicate that the carrying value of goodwill may not be recoverable. The tests are done at the reporting unit level which is defined as equal to or one level below the operating segment. As part of the goodwill impairment testing, we have the option to first assess qualitative factors to determine whether it is more likely than not that the fair value of a reporting unit is less than its carrying value. Under the first option to assess qualitative factors, the factors may include, but
49
are not limited to, economic, market and industry conditions, cost factors and overall financial performance of the reporting unit. If we choose not to complete a qualitative assessment for a given reporting unit, or if the initial assessment indicates that it is more likely than not that the carrying value of a reporting unit exceeds its estimated fair value, a quantitative test is required.
To determine the fair value of a reporting unit, we primarily use either an income approach representing the present value of future cash flows or a market approach valuation model. Our valuation model uses a five-year growth period for the business and an estimated exit trading multiple. The principal assumptions utilized in our income approach valuation model include revenue growth rate, operating profit margins, discount rate, and exit multiple. Revenue growth rate and operating profit assumptions are consistent with those utilized in our operating plan and long-term financial planning process. The discount rate assumption is calculated based upon an estimated weighted-average cost of capital, which includes factors such as the risk-free rate of return, cost of debt, and expected equity premiums. The exit multiple is determined from comparable industry transactions. When the market approach is utilized, fair value is estimated based on market multiples of revenue and earnings derived from comparable publicly-traded companies engaged in the same or similar lines of business as the reporting unit, adjusted to reflect differences in size and growth prospects. When both the income and market approach are utilized, we review relevant facts and circumstances and make a qualitative assessment to determine the proper weighting. Management judgment is required in the determination of each assumption utilized in the valuation model, and actual results could differ from the estimates.
We have a total of three reporting units. There are two reporting units based on product lines within the Materials segment. The DS&S segment is also a reporting unit. We conducted impairment tests during the fourth quarter of 2018 and determined that there was no goodwill impairment. As of the fourth quarter of 2018, we performed our annual impairment assessment of goodwill using the qualitative assessment and determined that it is more likely than not that the fair values of the reporting units exceed their carrying amount. We will continue to monitor and evaluate the carrying value of goodwill. If market and economic conditions or business performance deteriorate, this could increase the likelihood of us recording an impairment charge. However, we believe it is not reasonably likely that an impairment will occur at any of its reporting units over the next twelve months.
As described in Note 2, New Accounting Guidance, to the consolidated financial statements, we elected to early adopt the new accounting guidance which simplified the test for goodwill impairment by eliminating the second step in the impairment model, which measured the impairment loss based on the fair value of goodwill. Under the new guidance, an impairment loss will be recognized for the amount by which the carrying amount of the reporting unit exceeds its fair value, not to exceed the total amount of goodwill allocated to that reporting unit.
Income Taxes
We account for income taxes under the liability method. Under this method, deferred tax assets and liabilities are recognized for the tax effects of temporary differences between the financial reporting and tax bases of assets and liabilities measured using the enacted tax rate. At September 30, 2018, accrued income tax payable, non-current tax payable, and net deferred tax liabilities amounted to $43.3 million, $37.3 million and $23.0 million, respectively. Tax liabilities related to uncertain tax positions as of September 30, 2018 were $14.8 million, including interest and penalties. Income tax expense for the year ended September 30, 2018 was $118.9 million. Disclosures related to income taxes are included in Note 19, “Income Taxes”, to our Annual Consolidated Financial Statements included in Part II, Item 8 of this Annual Report on Form 10-K.
For purposes of the Consolidated Financial Statements, our income tax expense and deferred tax balances for the fiscal year ended September 30, 2016 has been estimated as if we filed income tax returns on a stand-alone basis separate from Air Products.
Management judgment may be required concerning the ultimate outcome of tax contingencies and the realization of deferred tax assets.
Actual income taxes paid may vary from estimates, depending upon changes in income tax laws, actual results of operations, and the final audit of tax returns by taxing authorities. Tax assessments may arise several years after tax returns have been filed. We believe that our recorded tax liabilities adequately provide for these assessments.
50
Deferred tax assets are recorded for operating losses and tax credit carryforwards. However, when we do not expect sufficient sources of future taxable income to realize the benefit of the operating losses or tax credit carryforwards, these deferred tax assets are reduced by a valuation allowance. Further, in situations where a cumulative loss for recent years exists, it may be difficult to support a conclusion that expected taxable income from future operations (excluding reversal of existing temporary differences) justifies recognition of deferred tax assets. A valuation allowance is recognized if, based on the weight of available evidence, it is considered more likely than not that some portion or all of the deferred tax asset will not be realized. The factors used to assess the likelihood of realization include forecasted future taxable income, existing deferred tax liabilities that will reverse in future periods, available tax planning strategies that could be implemented to realize or renew net deferred tax assets in order to avoid the potential loss of future tax benefits, and the existence of a cumulative loss for recent years. The effect of a change in the valuation allowance is reported in income tax expense.
A tax benefit for an uncertain tax position is recognized when it is more likely than not that the position will be sustained upon examination based on its technical merits. This position is measured as the largest amount of tax benefit that is greater than 50% likely of being realized. Interest and penalties related to unrecognized tax benefits are recognized as a component of income tax expense.
NEW ACCOUNTING GUIDANCE
See Note 3, “New Accounting Guidance”, to our Annual Consolidated Financial Statements included in Part II, Item 8 of this Annual Report on Form 10-K for information concerning the implementation and impact of new accounting guidance.
Item 7A. Quantitative and Qualitative Disclosures about Market Risk
Our earnings, cash flows, and financial position are exposed to market risks relating to fluctuations in interest rates and foreign currency exchange rates. It is our policy to minimize our cash flow exposure to adverse changes in currency exchange rates and to manage the financial risks inherent in funding with debt capital.
We address these financial exposures through a controlled program of risk management that includes the use of derivative financial instruments. Counterparties to all derivative contracts are major financial institutions, thereby minimizing the risk of credit loss. All instruments are entered into for other than trading purposes. For details on the types and use of these derivative instruments, see Note 14, Financial Instruments, to our Annual Consolidated Financial Statements included in Part II, Item 8 of this Annual Report on Form 10-K, for additional information.
Our derivative and other financial instruments consist of foreign exchange-forward contracts and long-term debt (including current portion). The net market value of these financial instruments combined is referred to below as the net financial instrument position and is disclosed in Note 13, Fair Value, to our Annual Consolidated Financial Statements included in Part II, Item 8 of this Annual Report on Form 10-K.
At September 30, 2018, the net financial instrument position was a liability of approximately $1.0 billion.
Interest Rate Risk
We have interest rate risk with respect to our long-term debt. Our fixed rate debt consists of senior notes and our variable rate debt consists of term loans under our Term Facility. Changes in interest rates have different impacts on the fixed and variable rate portions of our debt portfolio. A change in interest rates on the fixed portion of the debt portfolio impacts the fair value of the debt instrument but has no impact on interest expense or cash flows. A change in interest rates on the variable portion of the debt portfolio impacts the interest incurred but not the fair value of the instrument.
The sensitivity analysis related to the interest rate risk on the fixed portion of our debt assumes an instantaneous 100 bp move in interest rates from the level at September 30, 2018, with all other variables held constant. A 100 bp increase in market interest rates would result in a decrease of $22.0 million in the fair value of our fixed rate debt at September 30, 2018.
Based on the variable-rate debt balance at September 30, 2018, a 100 bp increase in interest rates would result in an additional $5.6 million of interest incurred per year at the end of September 30, 2018.
51
Foreign Currency Exchange Rate Risk
Our earnings, cash flows, and financial position are exposed to market risks relating to foreign currency exchange rates. It is our policy to minimize our cash flow exposure to adverse changes in currency exchange rates and to manage the financial risks inherent in funding with debt capital.
We enter into forward exchange contracts to hedge the cash flow exposure on inter-company loans. The primary currency pairs for which we have exchange rate exposure related to these forward contracts are Japanese Yen and U.S. dollars as well as Euros and U.S. dollars. There is fair value exposure related to all of the financial instruments in the below sensitivity analysis for which the impact of a movement in exchange rates would be in the opposite direction and materially equal to the impact on the instruments in the analysis.
The sensitivity analysis related to foreign currency exchange rates as they relate to the forward contracts assumes an instantaneous 10% change in the foreign currency exchange rates from their levels at September 30, 2018, with all other variables held constant. A 10% strengthening or weakening of the functional currency of an entity versus all other currencies would result in a decrease or increase, respectively, of $2.5 million in the net asset position of financial instruments at September 30, 2018.
We also have sales denominated in the South Korean Won, New Taiwan Dollar, Chinese Renmibi, Euro and the Japanese Yen. Approximately 55% of Versum’s sales are denominated in these currencies. Financial results therefore will be affected by changes in currency exchange rates. If all foreign currencies were to see a 10% reduction versus the U.S. dollar during the year ended September 30, 2018 the operating income would be negatively impacted by approximately $20.5 million.
52
Item 8. Financial Statements and Supplementary Data
INDEX TO FINANCIAL STATEMENTS AND SUPPLEMENTARY DATA
Page No. | |
53
Report of Independent Registered Public Accounting Firm
To the Stockholders and Board of Directors
Versum Materials, Inc.:
Opinion on the Consolidated Financial Statements
We have audited the accompanying consolidated balance sheets of Versum Materials, Inc. and subsidiaries (the Company) as of September 30, 2018 and 2017, the related consolidated statements of income, comprehensive income, stockholders’ equity, and cash flows for each of the years in the three‑year period ended September 30, 2018, and the related notes and financial statement schedule II (collectively, the consolidated financial statements). In our opinion, the consolidated financial statements present fairly, in all material respects, the financial position of the Company as of September 30, 2018 and 2017, and the results of its operations and its cash flows for each of the years in the three‑year period ended September 30, 2018, in conformity with U.S. generally accepted accounting principles.
We also have audited, in accordance with the standards of the Public Company Accounting Oversight Board (United States) (PCAOB), the Company’s internal control over financial reporting as of September 30, 2018, based on criteria established in Internal Control - Integrated Framework (2013) issued by the Committee of Sponsoring Organizations of the Treadway Commission, and our report dated November 21, 2018 expressed an unqualified opinion on the effectiveness of the Company’s internal control over financial reporting.
Change in Accounting Principle
As discussed in Note 2 to the consolidated financial statements, the Company has elected to change its method of accounting for certain inventories.
Basis for Opinion
These consolidated financial statements are the responsibility of the Company’s management. Our responsibility is to express an opinion on these consolidated financial statements based on our audits. We are a public accounting firm registered with the PCAOB and are required to be independent with respect to the Company in accordance with the U.S. federal securities laws and the applicable rules and regulations of the Securities and Exchange Commission and the PCAOB.
We conducted our audits in accordance with the standards of the PCAOB. Those standards require that we plan and perform the audit to obtain reasonable assurance about whether the consolidated financial statements are free of material misstatement, whether due to error or fraud. Our audits included performing procedures to assess the risks of material misstatement of the consolidated financial statements, whether due to error or fraud, and performing procedures that respond to those risks. Such procedures included examining, on a test basis, evidence regarding the amounts and disclosures in the consolidated financial statements. Our audits also included evaluating the accounting principles used and significant estimates made by management, as well as evaluating the overall presentation of the consolidated financial statements. We believe that our audits provide a reasonable basis for our opinion.
/s/ KPMG LLP
We have served as the Company’s auditor since 2016.
Philadelphia, Pennsylvania
November 21, 2018
54
Versum Materials, Inc.
ANNUAL CONSOLIDATED INCOME STATEMENTS
Year Ended September 30, | |||||||||||
2018 | 2017 | 2016 | |||||||||
(In millions, except per share data) | |||||||||||
Sales | $ | 1,372.3 | $ | 1,126.9 | $ | 970.1 | |||||
Cost of sales | 788.1 | 636.4 | 542.2 | ||||||||
Selling and administrative | 143.1 | 125.7 | 109.8 | ||||||||
Research and development | 49.1 | 45.1 | 43.9 | ||||||||
Business separation, restructuring and cost reduction actions | 20.6 | 25.5 | 0.9 | ||||||||
Other (income) expense, net | (2.6 | ) | (6.4 | ) | (2.9 | ) | |||||
Operating Income | 374.0 | 300.6 | 276.2 | ||||||||
Equity affiliates’ income | — | — | 0.2 | ||||||||
Interest expense | 48.3 | 47.4 | 0.4 | ||||||||
Write-off of financing costs | 2.1 | — | — | ||||||||
Income Before Taxes | 323.6 | 253.2 | 276.0 | ||||||||
Income tax provision | 118.9 | 53.0 | 58.8 | ||||||||
Net Income | 204.7 | 200.2 | 217.2 | ||||||||
Less: Net Income Attributable to Non-controlling Interests | 7.2 | 6.9 | 7.9 | ||||||||
Net Income Attributable to Versum | $ | 197.5 | $ | 193.3 | $ | 209.3 | |||||
Net income attributable to Versum per common share: | |||||||||||
Basic | $ | 1.81 | $ | 1.78 | $ | 1.93 | |||||
Diluted | $ | 1.80 | $ | 1.77 | $ | 1.93 | |||||
Shares used in computing per common share amounts: | |||||||||||
Basic | 108.9 | 108.7 | 108.7 | ||||||||
Diluted | 109.8 | 109.4 | 108.7 | ||||||||
The accompanying notes are an integral part of these statements.
55
Versum Materials, Inc.
ANNUAL CONSOLIDATED COMPREHENSIVE INCOME STATEMENTS
Year Ended September 30, | |||||||||||
2018 | 2017 | 2016 | |||||||||
(In millions) | |||||||||||
Net Income | $ | 204.7 | $ | 200.2 | $ | 217.2 | |||||
Other Comprehensive Income (Loss), net of tax | |||||||||||
Translation adjustments | 1.1 | (4.9 | ) | 22.8 | |||||||
Gain from hedging activities | 0.2 | — | — | ||||||||
Pension activity, net of tax of $0.3, $0.5, and $0 | (1.3 | ) | (2.2 | ) | — | ||||||
Total Other Comprehensive Income (Loss) | — | (7.1 | ) | 22.8 | |||||||
Comprehensive Income | 204.7 | 193.1 | 240.0 | ||||||||
Net Income Attributable to Non-controlling Interests | 7.2 | 6.9 | 7.9 | ||||||||
Other Comprehensive Income (Loss) Attributable to Non-controlling Interests | (0.2 | ) | 1.3 | — | |||||||
Comprehensive Income Attributable to Versum | $ | 197.7 | $ | 184.9 | $ | 232.1 | |||||
The accompanying notes are an integral part of these statements.
56
Versum Materials, Inc.
ANNUAL CONSOLIDATED BALANCE SHEETS
September 30, | |||||||
2018 | 2017 | ||||||
(In millions, except share data) | |||||||
Assets | |||||||
Current Assets | |||||||
Cash and cash items | $ | 399.8 | $ | 271.4 | |||
Trade receivables, net | 184.4 | 145.3 | |||||
Inventories | 177.1 | 160.4 | |||||
Contracts in progress, less progress billings | 20.3 | 15.6 | |||||
Prepaid expenses | 13.6 | 12.2 | |||||
Other current assets | 17.9 | 10.8 | |||||
Total Current Assets | 813.1 | 615.7 | |||||
Plant and equipment, net | 405.1 | 330.3 | |||||
Goodwill | 183.0 | 182.6 | |||||
Intangible assets, net | 63.5 | 70.8 | |||||
Other noncurrent assets | 40.6 | 56.2 | |||||
Total Non-current Assets | 692.2 | 639.9 | |||||
Total Assets | $ | 1,505.3 | $ | 1,255.6 | |||
Liabilities and Stockholders’ Equity | |||||||
Current Liabilities | |||||||
Payables and accrued liabilities | $ | 138.6 | $ | 120.8 | |||
Accrued income taxes | 43.3 | 31.4 | |||||
Current portion of long-term debt | 5.8 | 5.8 | |||||
Total Current Liabilities | 187.7 | 158.0 | |||||
Long-term debt | 974.2 | 977.0 | |||||
Noncurrent income tax payable | 37.3 | — | |||||
Deferred tax liabilities | 41.3 | 40.5 | |||||
Other noncurrent liabilities | 52.4 | 49.9 | |||||
Total Non-current Liabilities | 1,105.2 | 1,067.4 | |||||
Total Liabilities | 1,292.9 | 1,225.4 | |||||
Commitments and Contingencies - See Note 21 | |||||||
Stockholders’ Equity (Deficit) | |||||||
Common stock (par value $1 per share; 250,000,000 shares; outstanding 108,951,596 and 108,815,330 at September 30, 2018 and 2017, respectively) | 109.0 | 108.8 | |||||
Capital in excess of par | 6.1 | 4.8 | |||||
Retained earnings (accumulated deficit) | 81.6 | (99.6 | ) | ||||
Accumulated other comprehensive loss | (18.2 | ) | (18.4 | ) | |||
Total Versum’s Stockholders’ Equity (Deficit) | 178.5 | (4.4 | ) | ||||
Non-controlling Interests | 33.9 | 34.6 | |||||
Total Stockholders’ Equity | 212.4 | 30.2 | |||||
Total Liabilities and Stockholders’ Equity | $ | 1,505.3 | $ | 1,255.6 | |||
The accompanying notes are an integral part of these statements.
57
Versum Materials, Inc.
ANNUAL CONSOLIDATED STATEMENTS OF CASH FLOWS
September 30, | |||||||||||
2018 | 2017 | 2016 | |||||||||
(In millions) | |||||||||||
Operating Activities | |||||||||||
Net income | $ | 204.7 | $ | 200.2 | $ | 217.2 | |||||
Less: Net income attributable to non-controlling interests | 7.2 | 6.9 | 7.9 | ||||||||
Net income attributable to Versum | 197.5 | 193.3 | 209.3 | ||||||||
Adjustments to reconcile income to cash provided by operating activities: | |||||||||||
Depreciation and amortization | 50.8 | 46.0 | 46.9 | ||||||||
Deferred income taxes | 1.5 | 3.0 | (0.1 | ) | |||||||
Undistributed earnings of unconsolidated affiliates | — | — | (0.2 | ) | |||||||
Gain on sale of assets | (0.3 | ) | (2.0 | ) | (1.0 | ) | |||||
Share-based compensation | 10.1 | 8.3 | 5.0 | ||||||||
Gain on sale of long-lived assets associated with restructuring | — | — | (3.2 | ) | |||||||
Other adjustments | 21.1 | 5.9 | 0.6 | ||||||||
Working capital changes that provided (used) cash: | |||||||||||
Trade receivables | (42.2 | ) | (16.3 | ) | (2.1 | ) | |||||
Inventories | (15.3 | ) | (23.1 | ) | 3.0 | ||||||
Contracts in progress, less progress billings | (5.6 | ) | 4.4 | (9.2 | ) | ||||||
Payables and accrued liabilities | 14.8 | 16.5 | (5.1 | ) | |||||||
Accrued income taxes | 50.9 | 5.9 | 11.0 | ||||||||
Other working capital | (5.0 | ) | 20.6 | (1.5 | ) | ||||||
Cash Provided by Operating Activities | 278.3 | 262.5 | 253.4 | ||||||||
Investing Activities | |||||||||||
Additions to plant and equipment | (115.4 | ) | (64.0 | ) | (35.8 | ) | |||||
Proceeds from sale of assets and investments | 1.4 | 3.6 | 43.4 | ||||||||
Acquisition of business | — | (13.2 | ) | — | |||||||
Transfer to restricted cash | — | — | (69.5 | ) | |||||||
Cash Used for Investing Activities | (114.0 | ) | (73.6 | ) | (61.9 | ) | |||||
Financing Activities | |||||||||||
Proceeds from issuance of long-term debt | — | — | 572.1 | ||||||||
Payments on long-term debt | (5.8 | ) | (5.8 | ) | — | ||||||
Debt issuance costs | — | (1.7 | ) | (9.3 | ) | ||||||
Net transfers to Air Products | — | — | (660.7 | ) | |||||||
Dividends paid to shareholders | (24.0 | ) | (10.9 | ) | — | ||||||
Dividends paid to non-controlling interests | (7.7 | ) | (7.6 | ) | (7.6 | ) | |||||
Other financing activities | 0.4 | 1.3 | — | ||||||||
Cash Used for Financing Activities | (37.1 | ) | (24.7 | ) | (105.5 | ) | |||||
Effect of Exchange Rate Changes on Cash | 1.2 | 1.6 | 1.8 | ||||||||
Increase in Cash and Cash Items | 128.4 | 165.8 | 87.8 | ||||||||
Cash and Cash items-Beginning of Year | 271.4 | 105.6 | 17.8 | ||||||||
Cash and Cash items-End of Period | $ | 399.8 | $ | 271.4 | $ | 105.6 | |||||
Supplemental Disclosure of Cash Flow Information: | |||||||||||
Cash paid for interest on debt | $ | 45.9 | $ | 43.1 | $ | — | |||||
Cash paid for taxes | $ | 68.3 | $ | 42.9 | $ | — | |||||
The accompanying notes are an integral part of these statements.
58
Versum Materials, Inc.
ANNUAL CONSOLIDATED STATEMENTS OF STOCKHOLDERS’ EQUITY
Common Stock | Capital in Excess of Par | Retained Earnings (Accumulated Deficit) | Air Products’ Net Investment | Accumulated Other Comprehensive Income (Loss) | Total Versum’s Stockholders’ Equity (Deficit) | Non-controlling Interests | Total | ||||||||||||||||||||||||
(In millions) | |||||||||||||||||||||||||||||||
Balance, September 30, 2015 | $ | — | $ | — | $ | — | $ | 752.5 | $ | (32.8 | ) | $ | 719.7 | $ | 32.0 | $ | 751.7 | ||||||||||||||
Net income | — | — | — | 209.3 | — | 209.3 | 7.9 | 217.2 | |||||||||||||||||||||||
Other comprehensive income | — | — | — | — | 22.8 | 22.8 | — | 22.8 | |||||||||||||||||||||||
Share-based compensation | — | — | — | 5.0 | — | 5.0 | — | 5.0 | |||||||||||||||||||||||
Dividends to non-controlling interests | — | — | — | — | — | — | (7.6 | ) | (7.6 | ) | |||||||||||||||||||||
Net transfers to Air Products | — | — | — | (1,085.8 | ) | — | (1,085.8 | ) | 1.6 | (1,084.2 | ) | ||||||||||||||||||||
Balance, September 30, 2016 | $ | — | $ | — | $ | — | $ | (119.0 | ) | $ | (10.0 | ) | $ | (129.0 | ) | $ | 33.9 | $ | (95.1 | ) | |||||||||||
Net income | — | — | 193.3 | — | — | 193.3 | 6.9 | 200.2 | |||||||||||||||||||||||
Net transfers to Air Products | — | — | (292.9 | ) | 127.1 | (2.4 | ) | (168.2 | ) | 0.1 | (168.1 | ) | |||||||||||||||||||
Reclassification of Air Products' net investment to additional paid in capital | — | 8.1 | — | (8.1 | ) | — | — | — | — | ||||||||||||||||||||||
Cash dividend paid | — | (10.9 | ) | — | — | — | (10.9 | ) | — | (10.9 | ) | ||||||||||||||||||||
Issuance of common stock at separation | 108.7 | — | — | — | — | 108.7 | — | 108.7 | |||||||||||||||||||||||
Issuance of common stock through shared based compensation plans | 0.1 | — | — | — | — | 0.1 | — | 0.1 | |||||||||||||||||||||||
Other comprehensive income (loss) | — | — | — | — | (6.0 | ) | (6.0 | ) | 1.3 | (4.7 | ) | ||||||||||||||||||||
Share-based compensation | — | 7.6 | — | — | — | 7.6 | — | 7.6 | |||||||||||||||||||||||
Dividends to non-controlling interests | — | — | — | — | — | — | (7.6 | ) | (7.6 | ) | |||||||||||||||||||||
Balance, September 30, 2017 | $ | 108.8 | $ | 4.8 | $ | (99.6 | ) | $ | — | $ | (18.4 | ) | $ | (4.4 | ) | $ | 34.6 | $ | 30.2 | ||||||||||||
Net income | — | — | 197.5 | — | — | 197.5 | 7.2 | 204.7 | |||||||||||||||||||||||
Cash dividend paid | — | (7.7 | ) | (16.3 | ) | — | — | (24.0 | ) | — | (24.0 | ) | |||||||||||||||||||
Issuance of common stock through shared based compensation plans | 0.2 | — | — | — | — | 0.2 | — | 0.2 | |||||||||||||||||||||||
Other comprehensive income (loss) | — | — | — | — | 0.2 | 0.2 | (0.2 | ) | — | ||||||||||||||||||||||
Share-based compensation | — | 9.0 | — | — | — | 9.0 | — | 9.0 | |||||||||||||||||||||||
Dividends to non-controlling interests | — | — | — | — | — | — | (7.7 | ) | (7.7 | ) | |||||||||||||||||||||
Balance, September 30, 2018 | $ | 109.0 | $ | 6.1 | $ | 81.6 | $ | — | $ | (18.2 | ) | $ | 178.5 | $ | 33.9 | $ | 212.4 | ||||||||||||||
The accompanying notes are an integral part of these statements.
59
Versum Materials, Inc.
NOTES TO ANNUAL CONSOLIDATED FINANCIAL STATEMENTS
1.BASIS OF PRESENTATION
In September 2016, Versum Materials, Inc. was formed and after its Separation from Air Products on October 1, 2016, Versum began operating as an independent public company and its common stock is listed under the symbol “VSM” on the New York Stock Exchange.
We are a global business that provides innovative solutions for specific customer applications within niche markets based upon expertise in specialty materials. Our business employs applications technology to provide solutions to the semiconductor industry through chemical synthesis, analytical technology, process engineering, and surface science. We are comprised of two primary operating segments, Materials and Delivery Systems and Services, under which we manage our operations and assess performance, and a Corporate segment.
Prior to the Separation, the accompanying Annual Consolidated Financial Statements of Versum, were prepared on a stand-alone basis and were derived from Air Products’ consolidated financial statements and accounting records where Versum was a division of Air Products. For all periods presented, the Annual Consolidated Financial Statements were prepared in accordance with accounting principles generally accepted in the United States of America (“GAAP”) and include the accounts of Versum. All significant intercompany transactions and balances have been eliminated in the preparation of the accompanying Annual Consolidated Financial Statements. Prior to the Separation, transactions between Versum and Air Products were reflected in the annual consolidated statements of cash flows as a financing activity in “Net transfers to Air Products.”
Prior to the Separation, Air Products provided us with centrally managed services and corporate functions. Accordingly, certain shared costs including but not limited to administrative expenses for information technology, general services, human resources, legal, accounting and other services, had been allocated to us and were reflected as expenses in the Annual Consolidated Financial Statements. Expenses had been allocated on the basis of direct usage when identifiable, with the remainder allocated on the basis of fixed costs, revenue, operating income or headcount. We consider the expense allocation methodology and results to be reasonable and consistently applied for all periods presented prior to the Separation.
After the Separation, Versum has performed most of these functions using its own resources or purchased services. However, the remainder of these functions continued to be provided by Air Products under various agreements. See Note 4, Related Party Transactions, for a description of the agreements between Versum and Air Products.
For periods prior to October 1, 2016, included within our Annual Consolidated Financial Statements were the results of certain product lines which had historically been managed by us but were retained by Air Products after the Separation. These product lines represented approximately 1% and 1% of annual combined sales and operating income, respectively, for fiscal year 2016.
For periods prior to the Separation, Versum’s income tax expense was calculated using the separate return method as if Versum was a separate taxpayer. The majority of the accrued U.S. federal, state, and foreign income tax balances were treated as settled with Air Products as of the end of each year. After the Separation, income tax expense and income tax balances represent Versum’s federal, state and foreign income taxes as an independent company.
2.SUMMARY OF SIGNIFICANT ACCOUNTING POLICIES
Estimates and Assumptions
The preparation of the Annual Consolidated Financial Statements in conformity with GAAP requires management to make estimates and assumptions that affect amounts reported in the Annual Consolidated Financial Statements and accompanying notes, including allocations of costs during the reporting period. Management’s estimates are based on historical experience, facts and circumstances available at the time, and various other assumptions that are believed to be reasonable. Actual results could differ from those estimates.
60
Revenue Recognition
Revenue from product sales is recognized as risk and title to the product transfer to the customer, the sales price is fixed or determinable, and collectability is reasonably assured. Sales returns and allowances are generally not a business practice in the industry.
We use both the completed contract and percentage-of-completion methods to record revenue from equipment sale contracts. The completed contract method is used in circumstances in which financial position and results of operations are not materially different from those resulting from use of the percentage-of-completion method, e.g., certain short-term contracts. We use the percentage-of-completion method when we can make reasonably dependable estimates of progress toward completion and performance is expected.
Under the percentage-of-completion method, revenue from the sale of major equipment is recognized primarily based on costs incurred to date compared with total estimated costs. Under the completed contract method, revenue and cost is recognized when the equipment is completed and transferred to the customer. Changes to estimated labor hours under the percentage-of-completion method or anticipated losses under either method, if any, are recognized in the period determined.
Revenue from on-site services are generally fixed monthly fee arrangements for which we recognize revenue as the services are performed.
Amounts billed for shipping and handling fees are classified as sales in the consolidated income statements.
Amounts billed for sales and use taxes, value-added taxes, and certain excise and other specific transactional taxes imposed on revenue-producing transactions are presented on a net basis and excluded from sales in the consolidated income statements. We record a liability until remitted to the respective taxing authority.
Cost of Sales
Cost of sales predominantly represents the cost of tangible products sold. These costs include labor, raw materials, depreciation, production supplies, and materials packaging costs. Costs incurred for shipping and handling are also included in cost of sales.
Depreciation
Depreciation is recorded using the straight-line method, which deducts equal amounts of the cost of each asset from earnings every year over its expected economic useful life. The principal lives for major classes of plant and equipment are summarized in Note 8, Plant and Equipment, Net.
Selling and Administrative
The principal components of selling and administrative expenses are compensation, advertising, and promotional costs.
Research and Development
Research and development costs are expensed as incurred. Research and development expenses include employee costs, materials, contract services, research agreements, and other external spending related to the discovery and development of new products, enhancement of existing products and regulatory approval of new and existing products.
Post-employment Benefits
We provide termination benefits to employees as part of ongoing benefit arrangements and record a liability for termination benefits when probable and estimable. These criteria are met when management, with the appropriate level of authority, approves and commits to its plan of action for termination; the plan identifies the employees to be terminated and their related benefits; and the plan is to be completed within one year. We typically do not provide one-time benefit arrangements of significance.
61
Fair Value Measurements
We are required to measure certain assets and liabilities at fair value, either upon initial measurement or for subsequent accounting or reporting. For example, fair value is used in the initial measurement of net assets acquired in a business combination; on a recurring basis in the measurement of derivative financial instruments; and on a nonrecurring basis when long-lived assets are written down to fair value when held for sale or determined to be impaired. Refer to Note 13, “Fair Value”, for information on the methods and assumptions used in our fair value measurements.
Financial Instruments
We address certain financial exposures through a controlled program of risk management that includes the use of derivative financial instruments. If the circumstances qualify and we designate hedge accounting, the hedging relationship between the underlying financial exposures and the related hedging instrument would be documented on the date the derivative is entered into with the counterparty. We have not designated hedge accounting for any of the forward exchange contracts. Our program currently includes the use of forward exchange contracts to hedge intercompany loans denominated in a foreign currency
Foreign Currency
Since we do business in many foreign countries, fluctuations in currency exchange rates affect our financial position and results of operations.
In certain of our foreign operations, the local currency is considered the functional currency. These foreign subsidiaries translate their assets and liabilities into U.S. dollars at current exchange rates in effect at the end of the fiscal period. The gains or losses that result from this process are shown as translation adjustments in accumulated other comprehensive income (loss) in the stockholders’ equity section of the annual consolidated balance sheets. The revenue and expense accounts of these foreign subsidiaries are translated into U.S. dollars at the average exchange rates that prevail during the period. Therefore, the U.S. dollar value of these items on the income statement fluctuates from period to period, depending on the value of the dollar against foreign currencies. Some transactions are made in currencies different from an entity’s functional currency. Gains and losses from these foreign currency transactions are generally included in other income (expense), net on our consolidated income statements as they occur.
Litigation
Accruals for litigation are made when the information available indicates that it is probable that a liability has been incurred and the amount can be reasonably estimated. When only a range of possible loss can be established, the most probable amount in the range is accrued. If no amount within this range is a better estimate than any other amount within the range, the minimum amount in the range is accrued. The accrual for a litigation loss contingency includes estimates of potential damages and other directly related costs expected to be incurred. Litigation liabilities and expenditures included in the Annual Consolidated Financial Statements were not material for the periods presented.
Share-Based Compensation
Prior to the Separation, our employees participated in Air Products’ share-based compensation plans, which included stock options, deferred stock units, and restricted stock. Prior to the Separation, the Annual Consolidated Financial Statements included share-based compensation expense associated with our employees and Air Products’ costs that had been allocated to us based on awards and terms previously granted. In accordance with the Employee Matters Agreement entered into between Versum and Air Products on September 29, 2016 in connection with the Separation, all share-based compensation awards previously granted to Versum employees under Air Products’ Long-Term Incentive Plan that were outstanding on October 1, 2016, other than restricted stock, were adjusted and converted into Versum equity with substantially the same terms and conditions as the original Air Products awards.
The grant-date fair value of awards is expensed over the vesting period during which employees perform related services. Expense recognition is accelerated for retirement-eligible individuals who would meet the requirements for vesting of awards upon their retirement. The Black Scholes model is utilized to value new stock option awards. The grant date fair
62
value of the deferred stock units tied to a market condition is estimated using a Monte Carlo simulation model for new awards.
Income Taxes
We account for income taxes under the liability method. Under this method, deferred tax assets and liabilities are recognized for the tax effects of temporary differences between the financial reporting and tax bases of assets and liabilities measured using enacted tax rates. The cumulative impact of a change in tax rates or regulations is included in income tax expense in the period that includes the enactment date.
For the fiscal year ended September 30, 2016, certain of our operations included in our Annual Consolidated Financial Statements were divisions of legal entities included in Air Products consolidated U.S. federal and state income tax returns, or tax returns of non-U.S. subsidiaries of Air Products. The provision for income taxes has been prepared and presented in the Annual Consolidated Financial Statements based on a stand-alone basis separate from Air Products. Differences between our separate return income tax provision and cash flows attributable to income taxes for operations that were divisions of legal entities have been recognized as capital contributions from, or dividends to, Air Products, within Air Products’ net investment.
For the fiscal year ended September 30, 2016, the majority of the accrued U.S. federal, state, and foreign income tax balances were treated as settled with Air Products as of the end of the year. Therefore, this is included in Air Products’ net investment in the Annual Consolidated Financial Statements, for such periods.
Non-controlling Interests
We consolidate investments that we control but do not wholly own. The Annual Consolidated Financial Statements include all assets, liabilities, revenues, and expenses of our joint venture in Taiwan for which we have a 74% ownership interest during the periods presented in the Annual Consolidated Financial Statements. The ownership interests held by third party non-controlling partners are presented as non-controlling interests in our annual consolidated balance sheets. Any net income or loss attributed to the non-controlling partners is presented as such in the consolidated income statements. The activity for non-controlling interests for the years ended September 30, 2018, 2017 and 2016 is presented in the annual consolidated statements of stockholders’ equity.
Cash and Cash Items
Cash and cash items generally include cash, time deposits, and certificates of deposit acquired with an original maturity of three months or less for our foreign entities.
Trade Receivables, net
Trade receivables comprise amounts owed to us through our operating activities and are presented net of allowances for doubtful accounts. The allowances for doubtful accounts represent estimated uncollectible receivables associated with potential customer defaults on contractual obligations. A provision for customer defaults is made on a general formula basis when it is determined that the risk of some default is probable and estimable but cannot yet be associated with specific customers. The assessment of the likelihood of customer defaults is based on various factors, including the length of time the receivables are past due, historical experience, and existing economic conditions. The allowance also includes amounts for certain customers where a risk of default has been specifically identified, considering factors such as the financial condition of the customer and customer disputes over contractual terms and conditions. Allowance for doubtful accounts were $1.1 million and $1.0 million as of fiscal year end September 30, 2018 and 2017, respectively. Provisions to the allowance for doubtful accounts charged against income were not material in fiscal 2018, 2017, and 2016.
63
Inventories
Inventories are stated at the lower of cost or net realizable value. We write down our inventories for estimated obsolescence or unmarketable inventory based upon assumptions about future demand and market conditions.
Effective the fourth quarter of 2018, the company changed its method for inventory costing from the last-in, first-out (“LIFO”) cost method to the first-in, first-out (“FIFO”) cost method for inventory in the United States, which were the only operations that were using the LIFO cost method. All inventories outside the United States were already accounted for on the FIFO method. This change in accounting method was deemed preferable because the FIFO basis improves the matching of cost of sales with the related sales, causes inventory to be valued on a consistent basis throughout the entire company and valuation is on a more comparable basis with industry peer companies.
This change in accounting method was completed in accordance with US GAAP and all periods presented have been retrospectively adjusted to reflect the period-specific effects of applying the new accounting principle. The cumulative effect of this change in accounting principle, on periods prior to those presented, resulted in an increase in Air Products’ Net Investment of $11.0 million as of September 30, 2015, as presented in this Form 10-K.
The following table summarizes the effect of this accounting change on the company’s consolidated statements of income for each of the years ended September 30, 2017 and 2016:
As Originally Reported under LIFO | As Adjusted under FIFO | Effect of Change | |||||||||
(In millions, except per share data) | |||||||||||
Year ended September 30, 2016 | |||||||||||
Cost of sales | $ | 539.5 | $ | 542.2 | $ | 2.7 | |||||
Net income | 219.9 | 217.2 | (2.7 | ) | |||||||
Net income attributable to Versum | 212.0 | 209.3 | (2.7 | ) | |||||||
Net income attributable to Versum per common share: | |||||||||||
Basic | $ | 1.95 | $ | 1.93 | $ | (0.02 | ) | ||||
Diluted | $ | 1.95 | $ | 1.93 | $ | (0.02 | ) | ||||
Year ended September 30, 2017 | |||||||||||
Cost of sales | $ | 636.9 | $ | 636.4 | $ | (0.5 | ) | ||||
Income tax provision | 52.8 | 53.0 | 0.2 | ||||||||
Net income | 199.9 | 200.2 | 0.3 | ||||||||
Net income attributable to Versum | 193.0 | 193.3 | 0.3 | ||||||||
Net income attributable to Versum per common share: | |||||||||||
Basic | $ | 1.78 | $ | 1.78 | $ | — | |||||
Diluted | $ | 1.76 | $ | 1.77 | $ | 0.01 | |||||
As of September 30, 2017, the cumulative effect of the change increased inventories and deferred tax liabilities by $8.8 million and $3.2 million, respectively. This resulted in a net change to total stockholders’ equity of $5.6 million.
For 2018 there was a reduction of $0.2 million to costs of sales and a $0.1 million increase in the income tax provision. The net impact to net income attributable to Versum was an increase of $0.1 million. There was no impact on basic or diluted net income attributable to Versum per common share for 2018.
There was no impact on the cash provided by operating activities on the statement of cash flows as a result of the above changes.
64
Equity Investments
The equity method of accounting is used when we exercise significant influence but do not have operating control, generally assumed to be 20% to 50% ownership. Under the equity method, original investments are recorded at cost and adjusted by our share of undistributed earnings or losses of these companies. Equity investments are reviewed for impairment whenever events or changes in circumstances indicate that the carrying amount of the investment may not be recoverable. The Annual Consolidated Financial Statements include our investment in and proportionate share of the income from our 20% owned equity affiliate, Daido Air Products Electronics, Inc. During the first quarter of 2016, we sold our investment in this affiliate. Refer to Note 6, “Sale of Equity Affiliate”, for additional information.
Plant and Equipment
Plant and equipment is stated at cost less accumulated depreciation. Construction costs, labor, and applicable overhead related to installations are capitalized. Expenditures for additions and improvements that extend the lives or increase the capacity of plant assets are capitalized. The costs of maintenance and repairs of plant and equipment are charged to expense as incurred.
Fully depreciated assets are retained in the gross plant and equipment and accumulated depreciation accounts until they are removed from service. In the case of disposals, assets and related depreciation are removed from the accounts, and the net amounts, less proceeds from disposal, are included in income.
Impairment of Long-Lived Assets
Long-lived assets are grouped for impairment testing at the lowest level for which there are identifiable cash flows that are largely independent of the cash flows of other assets and liabilities and are evaluated for impairment whenever events or changes in circumstances indicate that the carrying amount of an asset group may not be recoverable. We assess recoverability by comparing the carrying amount of the asset group to estimated undiscounted future cash flows expected to be generated by the asset group. If an asset group is considered impaired, the impairment loss to be recognized is measured as the amount by which the asset group’s carrying amount exceeds its fair value. Long-lived assets held for sale are reported at the lower of carrying amount or fair value less cost to sell.
Goodwill
The purchase price is allocated to the assets acquired and liabilities assumed based on their estimated fair market values. Any excess purchase price over the fair market value of the net assets acquired, including identified intangibles, is recorded as goodwill. Preliminary purchase price allocations are made at the date of acquisition and finalized when information needed to affirm underlying estimates is obtained, within a maximum allocation period of one year.
Goodwill is subject to impairment testing at least annually. In addition, goodwill is tested more frequently if a change in circumstances or the occurrence of events indicates that potential impairment exists.
We conducted impairment tests during the fourth quarter of 2018 and determined that there was no goodwill impairment.
Intangible Assets
Intangible assets with determinable lives primarily consist of customer relationships and purchased patents and technology. The cost of intangible assets with determinable lives is amortized on a straight-line basis over the estimated period of economic benefit. Amortizable lives are adjusted whenever there is a change in the estimated period of economic benefit. No residual value is estimated for intangible assets.
Retirement Benefits
For periods prior to October 1, 2016, Air Products sponsored defined benefit pension plans, defined contribution plans, and other post-employment benefit plans that are shared amongst its businesses. Prior to the Separation on October 1, 2016, participation of our employees in these plans was reflected in the Annual Consolidated Financial Statements as though
65
Versum participated in a multi-employer plan with Air Products. A proportionate share of cost was reflected in these Annual Consolidated Financial Statements, primarily within selling and administrative expenses.
In 2017, certain international pension plans were legally split from Air Products. Our plans provide certain international employees in Germany, Korea and Taiwan who previously participated in the Air Products plans the same defined benefit pension benefits that had previously been provided by Air Products. Versum assumed the defined benefit pension plan assets and liabilities of these plans.
Upon Separation from Air Products, our employees’ balances in the Air Products sponsored defined contribution plan was transferred to a Versum defined contribution plan.
Air Products’ Net Investment
Prior to the Separation, Air Products’ net investment in our business was presented as “Air Products’ net investment” in lieu of stockholders’ equity, as a stand-alone legal and capital structure did not exist for the historical periods presented.
Earnings Per Share
Prior to the Separation, Versum earnings per share for 2016 were calculated using the shares that were distributed to Air Products stockholders immediately following the Separation. For periods prior to the Separation it is assumed that there are no dilutive equity instruments as there were no equity awards in Versum outstanding prior to the Separation.
3.NEW ACCOUNTING GUIDANCE
Accounting Guidance Implemented
Income Taxes
In March 2018, the Financial Accounting Standards Board (“FASB”) issued guidance relative to Income Taxes (Topic 740) that adds various Securities and Exchange Commission (“SEC”) paragraphs pursuant to the issuance of the December 2017 SEC Staff Accounting Bulletin No. 118, Income Tax Accounting Implications of the Tax Cuts and Jobs Act (“SAB 118”), which was effective immediately. The SEC issued SAB 118 to address concerns about reporting entities’ ability to timely comply with the accounting requirements to recognize all of the effects of the Tax Cuts and Jobs Act (the “Tax Act”) in the period of enactment. SAB 118 allows disclosure that timely determination of some or all of the income tax effects from the Tax Cuts and Jobs Act are incomplete by the due date of the financial statements and if possible, to provide a reasonable estimate. We have accounted for the tax effects of the Tax Act under the guidance of SAB 118, on a provisional basis. Our accounting for certain income tax effects is incomplete, but we have determined reasonable estimates for those effects and have recorded provisional amounts in our Consolidated Financial Statements as of September 30, 2018.
Goodwill Impairment
In January 2017, the FASB issued guidance simplifying the test for goodwill impairment, which removes certain steps from the goodwill impairment test. The guidance is effective for annual periods beginning after December 15, 2019, including interim periods within those periods, with early adoption permitted for interim or annual goodwill impairment tests performed on testing dates after January 1, 2017. The company adopted the standard effective October 1, 2017. The adoption did not have a material impact on the Consolidated Financial Statements.
Measurement of Inventory
In July 2015, the FASB issued guidance to simplify the measurement of inventory recorded using either the first-in, first-out (“FIFO”) or average cost basis by changing the subsequent measurement guidance from lower of cost or market to the lower of cost or net realizable value. Inventory measured using last-in, first-out (“LIFO”) is not impacted. The company adopted the standard effective October 1, 2017. This guidance did not have a significant impact on our Consolidated Financial Statements.
66
New Accounting Guidance to be Implemented
Collaborative Arrangements
In November 2018, the FASB issued guidance on how to assess whether certain transactions between collaborative arrangement participants should be accounted for within the revenue recognition standard. The company is required to adopt this guidance beginning October 1, 2020. Early adoption is permitted. The company is currently assessing the impact of the guidance on its consolidated financial statements and related disclosures.
Internal Use Software
In August 2018, FASB issued guidance which requires a customer in a cloud computing arrangement that is a service contract to follow the internal-use software guidance in Accounting Standards Codification 350-40 to determine which implementation costs to defer and recognize as an asset. The new guidance generally aligns the guidance on recognizing implementation costs incurred in a cloud computing arrangement that is a service contract with that for implementation costs incurred to develop or obtain internal-use software, including hosting arrangements that include an internal-use software license. The company is required to adopt this guidance beginning October 1, 2020. Early adoption is permitted. The company is currently assessing the impact of the guidance on its consolidated financial statements and related disclosures.
Defined Benefit Plan Disclosures
In August 2018, the FASB issued guidance which eliminates requirements for certain disclosures that are not considered cost beneficial, clarifies certain required disclosures and adds additional disclosures under defined benefit pension plans and other post-retirement plans. The company is required to adopt this guidance beginning October 1, 2021. Early adoption is permitted. The amendments in the guidance would need to be applied on a retrospective basis. The company is currently evaluating the potential impact of the adoption of this guidance on our disclosures.
Net Periodic Pension Costs
In March 2017, the FASB issued guidance which requires an entity to report the service cost component of pension expense in the same line item as other compensation costs. The other components of net (benefit) cost will be required to be presented in the income statement separately from the service cost component and outside a subtotal of income from operations. This standard is effective for interim and annual reporting periods beginning after December 15, 2017. The components of the net (benefit) cost are shown in Note 15, “Retirement Benefits”. The company will adopt the standard effective October 1, 2018. The adoption is not expected to have a material impact on the Consolidated Financial Statements.
Business Combinations
In January 2017, the FASB issued guidance on the definition of a business in business combinations. The guidance clarifies the definition of a business with the objective of adding guidance to assist entities with evaluating whether transactions should be accounted for as acquisitions (or disposals) of assets or businesses. The definition of a business affects many areas of accounting including acquisitions, disposals, goodwill, and consolidation. The guidance is effective for annual periods beginning after December 15, 2017, including interim periods within those periods. The company will adopt the standard effective October 1, 2018. The adoption is not expected to have a material impact on the Annual Consolidated Financial Statements.
Revenue Recognition
In May 2014, the FASB issued guidance based on the principle that revenue is recognized in an amount expected to be collected and to which the entity expects to be entitled in exchange for the transfer of goods or services. In August 2015, the FASB deferred the effective date by one year, while providing the option to early adopt the standard on the original effective date. In December 2016 there were further updates to the original guidance that did not revise the effective date. The guidance can be adopted either retrospectively or as a cumulative-effect adjustment as of the date of adoption. The company will adopt the standard effective October 1, 2018. The company will adopt the standard using the modified retrospective method, with a cumulative-effect adjustment recorded in retained earnings as of the beginning
67
of the period of adoption. The company has determined that the adoption of this new standard will not have a material impact to our consolidated financial statements. In addition, we do not expect major changes to the company’s existing accounting systems or internal controls as a result of the adoption. The company is finalizing the disclosures which will be included in its consolidated financial statements upon adoption of the new standard.
Leases
In February 2016, the FASB issued guidance which requires lessees to recognize a right of use asset and lease liability on the balance sheet for all leases, including operating leases, with a term in excess of 12 months. The guidance also expands the quantitative and qualitative disclosure requirements. The guidance is effective in fiscal year 2020, with early adoption permitted, and must be applied using a modified retrospective approach. In July 2018, the FASB issued updates to the lease standard making transition requirements less burdensome. The update provides an option to apply the transition provisions of the new standard at its adoption date instead of at the earliest comparative period presented in the company’s financial statements. The company is currently the lessee under various agreements for distribution equipment and vehicles that are currently accounted for as operating leases as discussed in Note 12, “Leases”. The new guidance requires the lessee to record operating leases on the balance sheet with a right-of-use asset and corresponding liability for future payment obligations. The company will adopt the standard effective October 1, 2019. We are currently evaluating the impact of adopting this new guidance on our Consolidated Financial Statements.
Cash Flow Statement Classification
In August 2016, the FASB issued guidance to reduce diversity in practice on how certain cash receipts and cash payments are classified in the statement of cash flows. The guidance is effective beginning fiscal year 2019, with early adoption permitted, and should be applied retrospectively. The company will adopt the standard effective October 1, 2018. The adoption is not expected to have a material impact on the Consolidated Financial Statements.
4.RELATED PARTY TRANSACTIONS
Prior to the separation, Air Products provided us with centrally managed services and corporate functions. Accordingly, certain shared costs including but not limited to administrative expenses for information technology, general services, human resources, legal, accounting and other services, had been allocated to us and are primarily reflected as expenses in the Corporate segment in the Consolidated Financial Statements. Expenses had been allocated on the basis of direct usage when identifiable, with the remainder allocated on the basis of fixed costs, revenue, operating income, or headcount. We consider the expense allocation methodology and results to be reasonable and consistently applied for all periods presented.
Total costs allocated to us in the consolidated income statements are summarized below:
Year Ended | |||
September 30, 2016 | |||
(In millions) | |||
Cost of sales | $ | 2.8 | |
Selling and administrative | 16.8 | ||
Research and development | 1.0 | ||
Business restructuring and cost reduction actions | 0.7 | ||
Total Allocated Costs | $ | 21.3 | |
These allocated costs are reflected in “Air Products’ net investment” and in the consolidated statements of cash flows as a financing activity in “Net transfers (to) from Air Products.” It is not practicable to quantify the amount of expenses that Versum would have incurred on a stand-alone basis for periods prior to the Separation.
Prior to the Separation, certain of our employees participated in share-based compensation plans and retirement benefit plans sponsored and administered by Air Products or its affiliates. The costs of these plans associated with our employees
68
are included in the Annual Consolidated Financial Statements, but excluded from the table of allocated costs above. Our consolidated balance sheet at September 30, 2016 does not include the share-based compensation instrument.
Agreements with Air Products
In connection with the Separation and Distribution, Versum and its affiliates entered into various agreements with Air Products and its affiliates contemplated by the Separation Agreement, including the following agreements:
Transition Services Agreement. Under the Transition Services Agreement, Air Products provides certain transition services to us and we provide certain transition services to Air Products. Each party provides these services for a limited time, generally for no longer than 12 to 24 months following the October 1, 2016 Distribution date, for specified fees, which are at cost for services provided by third parties and at cost plus approximately 5% percent for services provided by either us or Air Products, as applicable.
Tax Matters Agreement. The Tax Matters Agreement generally governs Air Products’ and Versum’s respective rights, responsibilities and obligations with respect to taxes (including taxes arising in the ordinary course of business and taxes, if any, incurred as a result of any failure of the Distribution or certain related transactions to qualify as tax-free for U.S. federal income tax purposes), tax attributes, the preparation and filing of tax returns, the control of audits and other tax proceedings and other matters regarding taxes for any tax period ending on or before the Distribution date, as well as tax periods beginning before and ending after the Distribution date. In addition, for 24 months following the October 1, 2016 Distribution date, the Tax Matters Agreement imposed certain restrictions on us and our subsidiaries (including restrictions on share issuances, business combinations, sales of assets and similar transactions) designed to preserve the tax-free status of the Distribution and certain related transactions. The Tax Matters Agreement includes special rules that allocate tax liabilities in the event the Distribution, or certain related transactions fail to qualify as tax-free for U.S. federal income tax purposes. In general, Versum is liable for taxes incurred by Air Products that may arise if Versum takes, or fails to take, as the case may be, certain actions that may result in the Distribution or certain related transactions failing to qualify as tax-free for U.S. federal income tax purposes.
Employee Matters Agreement. The Employee Matters Agreement governs the compensation and employee benefit obligations with respect to our current and former employees and those of Air Products. The Employee Matters Agreement allocates liabilities and responsibilities relating to employee compensation and benefits plans and programs and other related matters in connection with the Distribution including, without limitation, the treatment of outstanding Air Products’ equity awards, other outstanding incentive compensation awards, deferred compensation obligations and retirement and welfare benefit obligations.
5.BUSINESS SEPARATION, RESTRUCTURING AND COST REDUCTION ACTIONS
The charges we record for business restructuring and cost reduction actions have been excluded from segment operating income.
During fiscal year 2018, we recognized a net charge of $20.6 million. The net charge primarily consisted of additional costs as a result of the relocation of certain research and development activities and our headquarters and set up of the stand-alone organization and infrastructure.
During fiscal year 2017, we recognized a net charge of $25.5 million. The net charge primarily consisted of additional costs as a result of the relocation of certain research and development activities and our headquarters and set up of the stand-alone organization and infrastructure.
During fiscal year 2016, we recognized a net gain of $0.7 million. The 2016 net gain included a charge of $2.5 million for severance and other benefits related to the elimination of approximately 90 positions as part of cost reduction actions. In addition, we recognized a gain of $3.2 million on assets that were previously written down to a carrying value of $17.9 million. The gain included $1.4 million related to the sale of the on-site ammonia assets. The majority of these actions pertain to the Materials segment.
During fiscal year 2016, we also incurred costs of $1.6 million related to the Separation.
69
The following table summarizes the carrying amount of the accrual for the business realignment and reorganization at September 30, 2018:
Severance and Other Benefits | Asset Actions/Other | Total | |||||||||
(In millions) | |||||||||||
September 30, 2015 | $ | 4.1 | $ | — | $ | 4.1 | |||||
2016 Charge | 2.5 | (3.2 | ) | (0.7 | ) | ||||||
Cash (payments) receipts(A) | (6.0 | ) | 4.2 | (1.8 | ) | ||||||
Non-cash expenses | — | (1.0 | ) | (1.0 | ) | ||||||
September 30, 2016 | $ | 0.6 | $ | — | $ | 0.6 | |||||
2017 Charge | 4.7 | — | 4.7 | ||||||||
Cash payments | (1.1 | ) | — | (1.1 | ) | ||||||
Non-cash expenses | — | — | — | ||||||||
September 30, 2017 | $ | 4.2 | $ | — | $ | 4.2 | |||||
2018 Charge | 2.0 | — | 2.0 | ||||||||
Cash payments | (3.0 | ) | — | (3.0 | ) | ||||||
Non-cash expenses | — | — | — | ||||||||
September 30, 2018 | $ | 3.2 | $ | — | $ | 3.2 | |||||
(A) | Cash payments include an allocation of severance and other benefits of Air Products’ employees within its Corporate and other segment which were paid by Air Products. |
6.SALE OF EQUITY AFFILIATE
In December 2015, we sold our investment in our equity affiliate, Daido Air Products Electronics, Inc., for $15.9 million, which resulted in a before-tax gain of $0.7 million for the year ended September 30, 2016. The carrying value at the time of sale included a $12.8 million investment in net assets of and advances to equity affiliates and a $2.4 million foreign currency translation loss that had been deferred in accumulated other comprehensive loss. In addition, the income tax provision, before the valuation allowance (See Note 19), for the year ended September 30, 2016 included an expense of $5.3 million as a result of the sale.
7.INVENTORIES
The components of inventories are as follows:
September 30, | |||||||
2018 | 2017 | ||||||
(In millions) | |||||||
Inventories at FIFO cost | |||||||
Finished goods | $ | 104.3 | $ | 87.6 | |||
Work in process | 15.1 | 20.3 | |||||
Raw materials, supplies and other | 57.7 | 52.5 | |||||
Inventories | $ | 177.1 | $ | 160.4 | |||
Inventory amounts have been adjusted for the September 30, 2018 conversion from LIFO to FIFO. The cost for FIFO inventory approximates replacement cost. For a detailed description on impacts see Note 2, “Summary of Significant Accounting Policies”.
70
8.PLANT AND EQUIPMENT, NET
The major classes of plant and equipment are as follows:
September 30, | |||||||||
Useful Life in years | 2018 | 2017 | |||||||
(In millions, except useful life) | |||||||||
Land | $ | 22.1 | $ | 21.8 | |||||
Buildings | 30 | 168.6 | 149.3 | ||||||
Machinery and Equipment | |||||||||
Production facilities | 10 to 15 | 467.4 | 479.9 | ||||||
Distribution and other(A) | 5 to 25 | 347.8 | 252.1 | ||||||
Total machinery and equipment | 815.2 | 732.0 | |||||||
Construction in progress | 66.2 | 52.1 | |||||||
Plant and equipment, at cost | 1,072.1 | 955.2 | |||||||
Less: accumulated depreciation | 667.0 | 624.9 | |||||||
Plant and equipment, net | $ | 405.1 | $ | 330.3 | |||||
(A) | The depreciable lives for various types of distribution equipment are 10 to 25 years for cylinders, depending on the nature and properties of the product, and generally 20 years for other distribution equipment such as tanks and trailers. |
Depreciation expense was $43.6 million, $38.4 million, and $39.4 million in 2018, 2017, and 2016, respectively.
In January 2016, we sold two onsite ammonia plants for $17.1 million, which resulted in a before-tax gain of $1.4 million during the second quarter of 2016. This gain is reflected in business separation, restructuring and cost reduction actions on our income statement. The income tax provision includes an expense of $1.5 million as a result of the sale.
9.GOODWILL
Changes to the carrying amount of goodwill by segment are as follows:
Materials | Delivery Systems and Services | Total | |||||||||
(In millions) | |||||||||||
Balance at September 30, 2016 | $ | 162.6 | $ | 17.5 | $ | 180.1 | |||||
Acquisition (Note 23) | 5.0 | — | 5.0 | ||||||||
Currency translation adjustment | (2.3 | ) | (0.2 | ) | (2.5 | ) | |||||
Balance at September 30, 2017 | $ | 165.3 | $ | 17.3 | $ | 182.6 | |||||
Currency translation adjustment | 0.3 | 0.1 | 0.4 | ||||||||
Balance at September 30, 2018 | $ | 165.6 | $ | 17.4 | $ | 183.0 | |||||
Goodwill is subject to impairment testing in the fourth quarter of each fiscal year and whenever events and changes in circumstances indicate that the carrying value of goodwill might not be recoverable.
We conducted impairment tests in the fourth quarter of 2018 and determined that there was no goodwill impairment. As of the fourth quarter of 2018, the qualitative assessment did not indicate a need to perform a further quantitative analysis. Therefore, we believe the fair value of each reporting unit still exceeds its carrying value.
71
10.INTANGIBLE ASSETS
The table below provides details of acquired intangible assets:
September 30, 2018 | September 30, 2017 | ||||||||||||||||||||||
Gross | Accumulated Amortization | Net | Gross | Accumulated Amortization | Net | ||||||||||||||||||
(In millions) | |||||||||||||||||||||||
Customer relationships | $ | 79.5 | $ | (26.5 | ) | $ | 53.0 | $ | 79.5 | $ | (22.7 | ) | $ | 56.8 | |||||||||
Patents and technology | 50.3 | (41.3 | ) | 9.0 | 50.3 | (37.9 | ) | 12.4 | |||||||||||||||
Other | 3.2 | (1.7 | ) | 1.5 | 3.2 | (1.6 | ) | 1.6 | |||||||||||||||
Total Intangible Assets | $ | 133.0 | $ | (69.5 | ) | $ | 63.5 | $ | 133.0 | $ | (62.2 | ) | $ | 70.8 | |||||||||
The intangible assets primarily pertain to the Materials segment and have a remaining useful life of approximately 16 years for customer relationships and 4 years for patents and technology.
Amortization expense for intangible assets was $7.2 million, $7.6 million, and $7.5 million in 2018, 2017, and 2016, respectively.
Projected annual amortization expense for intangible assets as of September 30, 2018 is as follows:
2019 | $ | 5.9 | |
2020 | 5.8 | ||
2021 | 5.8 | ||
2022 | 4.9 | ||
2023 | 3.8 | ||
Thereafter | 37.3 | ||
Total | $ | 63.5 | |
In 2017, Versum acquired the intellectual property and related assets of Dynaloy through a business combination. Refer to Note 23, "Acquisition," for further discussion of the related intangible assets and goodwill.
72
11.DEBT
Components of Debt
September 30, | |||||||
2018 | 2017 | ||||||
(In millions) | |||||||
Short-term borrowings(A) | $ | — | $ | — | |||
Current portion of long-term debt | 5.8 | 5.8 | |||||
Long-term debt | 974.2 | 977.0 | |||||
Total Debt | $ | 980.0 | $ | 982.8 | |||
(A) | Represents borrowing under foreign lines of credit by non-U.S. subsidiaries which are short term in nature. Availability under these lines of credit at September 30, 2018 is $20.3 million. |
Long-term Debt
September 30, | |||||||
2018 | 2017 | ||||||
(In millions) | |||||||
Term loan facility under Credit Agreement | $ | 563.5 | $ | 569.3 | |||
Revolving facility under Credit Agreement | — | — | |||||
5.5% Senior Notes due 2024 | 425.0 | 425.0 | |||||
Total debt | 988.5 | 994.3 | |||||
Less debt discount | 1.8 | 2.5 | |||||
Less deferred debt costs | 6.7 | 9.0 | |||||
Less current portion of long-term debt | 5.8 | 5.8 | |||||
Long-term debt payable after one year | $ | 974.2 | $ | 977.0 | |||
Credit Agreement
On September 30, 2016, Versum entered into a credit agreement (the “Credit Agreement”) providing for a senior secured first lien term loan B facility of $575 million (the “Term Facility”) and a senior secured first lien revolving credit facility of $200 million (the “Revolving Facility” and, together with the Term Facility, the “Senior Credit Facilities”). The Senior Credit Facilities are guaranteed by Versum’s material direct and indirect wholly-owned domestic restricted subsidiaries and secured by substantially all of the assets of Versum and its subsidiary guarantors.
Borrowings under the Term Facility bore interest at a rate of either LIBOR (adjusted for statutory reserve requirements), subject to a minimum floor of 0.75%, plus a margin of 2.50% or an alternate base rate, subject to a minimum floor of 1.75%, plus a margin of 1.50%. On October 10, 2017, Versum amended its Credit Agreement. The amendment decreased the interest rate on borrowings under the Term Facility to LIBOR plus a margin of 2.00%, or an alternate base rate plus a margin of 1.00% (effective rate of 4.39% as of September 30, 2018). The amendment removed the minimum floor on LIBOR and the alternate base rate. If our total leverage ratio is equal to or less than 2.00:1.00 (calculated without any netting of cash on hand) the interest rate will decrease further to LIBOR plus a margin of 1.75%, or an alternate base rate plus a margin of 0.75%. The Term Facility matures on September 30, 2023, and will amortize in equal quarterly installments in aggregate annual amounts equal to 1.00% of the original principal amount of the Term Facility, with the balance payable on September 30, 2023.
Borrowings under the Revolving Facility bear interest initially at a rate of either LIBOR (adjusted for statutory reserve requirements) plus a margin of 2.00% or an alternate base rate plus a margin of 1.00%, subject to a 0.25% margin reduction based on achieving a first lien net leverage ratio of 1.00:1.00. A commitment fee of 0.375% initially, subject to a reduction to 0.25% based on achieving a first lien net leverage ratio of 1.00:1.00, on the unused portion of the Revolving Facility is
73
payable quarterly in arrears. Letter of credit fees are payable on outstanding letters of credit under the Revolving Facility, and fronting fees equal to a percentage to be agreed with each issuing bank (not to exceed 0.125%) are payable to the issuing banks. The Revolving Facility matures on September 30, 2021. A maximum first lien net leverage ratio covenant (total debt net of cash on hand to total adjusted EBITDA) of 3.25:1.00 will apply if we draw upon the Revolving Facility. As of September 30, 2018, we had availability of $200 million under Revolving Facility.
The Credit Agreement, as amended, provides that, commencing with Versum’s fiscal year ending on September 30, 2017, a percentage of excess cash flow ranging from 0% to 50%, depending on the first lien net leverage ratio, is required to be used to prepay the Term Facility. As of September 30, 2018, there was no requirement to prepay due to excess cash flows.
Senior Notes
On September 30, 2016, Versum issued $425 million of 5.5% Senior Notes due 2024. The Notes are unsecured senior obligations of Versum, guaranteed by each of Versum’s subsidiaries that is a guarantor under the Senior Credit Facilities. The Notes bear interest at a rate of 5.5% per annum payable semiannually on March 15 and September 15 of each year, commencing on March 15, 2017. The Notes will mature on September 30, 2024.
Versum may, at its option, redeem some or all of the Notes during such times and at such prices as described in the Indenture governing the Senior Notes, plus accrued and unpaid interest, if any, to the date of redemption.
The agreements governing our indebtedness contain a number of affirmative and negative covenants. We were in compliance with all of our covenants at September 30, 2018.
Maturities
Maturities of long-term debt are as follows:
Total Debt | |||
(In millions) | |||
Payments due for the year ended September 30, | |||
2019 | $ | 5.8 | |
2020 | 5.8 | ||
2021 | 5.8 | ||
2022 | 5.8 | ||
2023 | 540.3 | ||
Thereafter | 425.0 | ||
Total | $ | 988.5 | |
74
12.LEASES
Lessee Accounting
Operating leases principally relate to real estate and also include distribution equipment and vehicles. Certain leases include escalation clauses, renewal, and purchase options. Rent expense is recognized on a straight-line basis over the minimum lease term. Rent expense under operating leases, including month-to-month agreements, was $10.8 million in 2018, $12.2 million in 2017, and $7.6 million in 2016.
At September 30, 2018, minimum payments due under leases are as follows:
(In millions) | |||
2019 | $ | 5.7 | |
2020 | 4.5 | ||
2021 | 4.0 | ||
2022 | 3.5 | ||
2023 | 2.4 | ||
Thereafter | 2.0 | ||
Total | $ | 22.1 | |
13.FAIR VALUE
Fair value is defined as an exit price, i.e., the price that would be received to sell an asset or paid to transfer a liability in an orderly transaction between market participants at the measurement date.
The fair value hierarchy prioritizes the inputs to valuation techniques used to measure fair value into three broad levels as follows:
Level 1 - Quoted prices (unadjusted) in active markets for identical assets or liabilities.
Level 2 - Inputs that are observable for the asset or liability, either directly or indirectly through market corroboration, for substantially the full term of the asset or liability.
Level 3 - Inputs that are unobservable for the asset or liability based on our own assumptions (about the assumptions market participants would use in pricing the asset or liability).
The methods and assumptions used to measure the fair value of financial instruments are as follows:
Derivatives
The fair value of our forward exchange contracts are quantified using the income approach and are based on estimates using standard pricing models. These models take into account the value of future cash flows as of the balance sheet date, discounted to a present value using discount factors that match both the time to maturity and currency of the underlying instruments. The computation of the fair values of these instruments is generally performed by the company. These standard pricing models utilize inputs which are derived from or corroborated by observable market data such as interest rate yield curves and currency spot and forward rates. Therefore, the fair value of our derivatives is classified as a level 2 measurement.
Refer to Note 14, Financial Instruments, for a description of derivative instruments, including details on the balance sheet line classifications.
75
Long-term Debt
The fair value of our Senior Notes is based primarily on quoted market prices reported on or near the respective balance sheet date and is therefore level 1. The fair value of our Term Facility debt is based on estimates using standard pricing models that take into account the value of future cash flows as of the balance sheet date, discounted to a present value using market based assumptions including published interest rates. This standard valuation model utilizes observable market data. Therefore, the fair value of our debt is classified as a level 2 measurement.
The carrying values and fair values of our derivatives and debt are as follows:
September 30, 2018 | September 30, 2017 | ||||||||||||||
Fair Value | Carrying Value | Fair Value | Carrying Value | ||||||||||||
(In millions) | |||||||||||||||
Assets | |||||||||||||||
Forward Exchange Contracts | $ | 0.4 | $ | 0.4 | $ | 0.9 | $ | 0.9 | |||||||
Liabilities | |||||||||||||||
Forward Exchange Contracts | $ | — | $ | — | $ | 1.5 | $ | 1.5 | |||||||
Long-term Debt | |||||||||||||||
Senior Notes | $ | 435.6 | $ | 425.0 | $ | 450.5 | $ | 425.0 | |||||||
Term Facility | 567.0 | 563.5 | 575.7 | 569.3 | |||||||||||
Total Long-term debt | $ | 1,002.6 | $ | 988.5 | $ | 1,026.2 | $ | 994.3 | |||||||
The carrying amounts reported in the annual consolidated balance sheet for cash and cash items, trade receivables, payables and accrued liabilities, and accrued income taxes approximate fair value due to the short-term nature of these instruments. Accordingly, these items have been excluded from the above table.
14.FINANCIAL INSTRUMENTS
We enter into forward exchange contracts to hedge the fair value exposure on inter-company loans. During the year ended September 30, 2018, this portfolio of forward exchange contracts consisted primarily of Japanese Yen and U.S. dollars as well as Euros and U.S. dollars. During the year ended September 30, 2017, this portfolio of forward exchange contracts consisted primarily of Korean Won and U.S. dollars. The maximum remaining term of any forward exchange contract outstanding at September 30, 2018 and 2017 was approximately 1 year. At September 30, 2018 and 2017, the total notional principal amount of our outstanding hedge contracts was $36.1 million and $158.4 million, respectively.
As of September 30, 2018 and 2017, there were no derivatives designated as hedging instruments. The tables below summarize the fair values of our derivatives not designated as hedging instruments and balance sheet location of these outstanding derivatives:
September 30, 2018 | |||||||||||
Balance Sheet Location | Amount | Balance Sheet Location | Amount | ||||||||
(In millions) | |||||||||||
Forward exchange contracts | Other current assets | $ | 0.4 | Payables and accrued liabilities | $ | — | |||||
September 30, 2017 | |||||||||||
Balance Sheet Location | Amount | Balance Sheet Location | Amount | ||||||||
(In millions) | |||||||||||
Forward exchange contracts | Other current assets | $ | 0.9 | Payables and accrued liabilities | $ | 1.5 | |||||
76
Refer to Note 13, Fair Value, which defines fair value, describes the method for measuring fair value, and provides additional disclosures regarding fair value measurements.
The table below summarizes the gain or loss related to our forward contracts:
Year Ended September 30, 2018 | Year Ended September 30, 2017 | ||||||
(In millions) | |||||||
Forward Exchange Contracts, net of tax: | |||||||
Net loss recognized in other (income) expense, net(A) | $ | 0.4 | $ | 2.2 | |||
(A) | The impact of the non-designated hedges noted above was largely offset by gains and losses resulting from the impact of changes in exchange rates on recognized assets and liabilities denominated in nonfunctional currencies. |
The cash flows related to all derivative contracts are reported in the operating activities section of the consolidated statements of cash flows.
77
15.RETIREMENT BENEFITS
For periods prior to October 1, 2016, Air Products offered various long-term benefits to our employees through defined benefit pension plans and defined contribution plans. Prior to the Separation on October 1, 2016, participation of our employees in these plans is reflected in the Annual Consolidated Financial Statements as though we participated in a multi-employer plan with Air Products.
Defined Benefit Pensions
In 2017, certain international pension plans were legally split from Air Products. Our plans provide certain international employees in Germany, Korea and Taiwan who previously participated in the Air Products plans the same defined benefit pension benefits that had previously been provided by Air Products.
The following table summarizes the benefit obligation, fair value of the plan assets and the funded status at September 30, 2018 and 2017:
2018 | 2017 | ||||||
(In millions) | |||||||
Change in benefit obligation: | |||||||
Benefit obligation at beginning of year | $ | 22.8 | $ | — | |||
Converted on October 1, 2016 | — | 26.5 | |||||
Service cost | 2.0 | 2.3 | |||||
Interest cost | 0.7 | 0.6 | |||||
Actuarial loss (gain) | 1.3 | (4.9 | ) | ||||
Benefits paid | (0.8 | ) | (1.2 | ) | |||
Other | 0.7 | — | |||||
Foreign currency impact | 0.4 | (0.5 | ) | ||||
Benefit obligation at end of year | $ | 27.1 | $ | 22.8 | |||
Change in plan assets: | |||||||
Fair value of plan assets at beginning of year | $ | 6.8 | $ | — | |||
Converted on October 1, 2016 | — | 3.0 | |||||
Employer contributions | 0.8 | 5.0 | |||||
Benefits paid | (0.8 | ) | (1.2 | ) | |||
Foreign currency impact | 0.1 | — | |||||
Fair value of plan assets at end of year | $ | 7.1 | $ | 6.8 | |||
Funded status: | |||||||
Plan assets less than benefit obligation - Net amount recognized | $ | (20.0 | ) | $ | (16.0 | ) | |
78
Amounts recognized in the annual consolidated balance sheets consist of:
2018 | 2017 | ||||||
(In millions) | |||||||
Non-current liabilities | $ | (20.0 | ) | $ | (16.0 | ) | |
Accumulated other comprehensive loss, net of taxes | (3.4 | ) | (2.2 | ) | |||
Amounts recognized in accumulated other comprehensive loss, net of tax consist of:
2018 | 2017 | ||||||
(In millions) | |||||||
Balance at beginning of year | $ | (2.2 | ) | $ | — | ||
Converted on October 1, 2016 | — | (6.2 | ) | ||||
Net actuarial loss amortized during the year | 0.1 | 0.4 | |||||
Net actuarial (loss) gain during the year | (1.4 | ) | 3.7 | ||||
Non-controlling interest | 0.1 | (0.1 | ) | ||||
Balance at end of year | $ | (3.4 | ) | $ | (2.2 | ) | |
The components of net periodic pension costs for our defined benefit pension plans are as follows:
2018 | 2017 | ||||||
(In millions) | |||||||
Service cost | $ | 2.0 | $ | 2.3 | |||
Interest cost | 0.7 | 0.6 | |||||
Expected return on plan assets | (0.1 | ) | (0.1 | ) | |||
Actuarial loss amortization | 0.1 | 0.5 | |||||
Net periodic pension cost | $ | 2.7 | $ | 3.3 | |||
The estimated amount that will be amortized from accumulated other comprehensive income into net periodic pension cost in 2019 is $0.2 million.
Assumptions used in determining the benefit obligation and net periodic pension cost for the years ended September 30, 2018 and 2017 are presented in the following table as weighted-averages:
2018 | 2017 | ||||
(In millions) | |||||
Benefit obligations: | |||||
Discount rate | 2.9 | % | 3.2 | % | |
Rate of compensation increase | 4.1 | % | 4.1 | % | |
Net Periodic Pension Cost: | |||||
Discount rate | 3.3 | % | 2.3 | % | |
Rate of compensation increase | 4.1 | % | 4.9 | % | |
Expected rate of return on plan | 1.7 | % | 2.0 | % | |
The discount rate assumption is calculated based on market yields at the valuation date on government bonds and high quality corporate bonds as well as the estimated maturity of benefit payments. The expected rate of return assumption is based on weighted-average expected returns from each asset class. Expected returns reflect a combination of historical performance analysis and current market conditions and include input from our actuaries.
79
The fair value of our pension plan assets at September 30, 2018 and 2017, by asset category utilizing the fair value hierarchy discussed in Note 13, is as follows:
2018 | 2017 | ||||||
(In millions) | |||||||
Other investments (Level 2) | $ | 4.4 | $ | 4.1 | |||
Insurance contract (Level 3) | 2.7 | 2.7 | |||||
Total | $ | 7.1 | $ | 6.8 | |||
The Other investments category represents accounts our subsidiaries in Taiwan have invested in a government directed Labor Pension Fund in which the return is guaranteed by the government. Therefore it is characterized as Other and level 2. The Insurance contract category represents the Korea plan which is funded by an investment with Samsung Insurance and is classified as level 3, as they are carried at contract value which approximates fair value.
We expect to make contributions of approximately $0.1 million during 2019. The expected future benefit payments related to the defined benefit plans are shown below:
Payments | |||
(In millions) | |||
2019 | $ | 0.9 | |
2020 | 1.0 | ||
2021 | 1.1 | ||
2022 | 1.3 | ||
2023 | 1.6 | ||
2024-2028 | 10.7 | ||
Defined Contribution Plan
Prior to the Separation, Air Products sponsored several defined contribution plans which covered all U.S. employees and certain non-U.S. employees. Versum received an allocation of the total cost of defined contributions from Air Products.
Upon Separation, our employees’ balances were transferred to a new Versum defined contribution plan.
The following table summarizes our defined contribution expense:
2018 | 2017 | 2016 | |||||||||
(In millions) | |||||||||||
Defined contribution expense | $ | 12.4 | $ | 11.0 | $ | 5.5 | |||||
16.SHARE-BASED COMPENSATION
In accordance with the Employee Matters Agreement entered into between Versum and Air Products on September 29, 2016 in connection with the Separation, all share-based compensation awards previously granted to Versum employees under Air Products’ Long-Term Incentive Plan that were outstanding on October 1, 2016, other than restricted stock, were adjusted and converted into Versum equity with substantially the same terms and conditions as the original Air Products awards. The converted awards will continue to vest over the original vesting period defined at the grant date.
As a result of the conversion, we have the following outstanding share-based compensation awards: (a) stock options; (b) time-based restricted stock units; and (c) market-based restricted stock units.
For the years ended September 30, 2018, 2017, and 2016, share-based compensation expense of $10.1 million, $8.3 million, and $5.0 million, respectively, was included in the Annual Consolidated Financial Statements.
80
During the year ended September 30, 2017, under the Versum Long-Term Incentive Plan we made a one-time Founders grant of time-based restricted stock units. In addition, during the years ended September 30, 2018 and 2017, we granted annual awards of market-based restricted stock units, consisting of performance-based restricted stock units and performance-based market stock units. Under all programs, the terms of the awards are fixed at the grant date. We issue new shares upon the payout of restricted stock units and the exercise of stock options. As of September 30, 2018, there were 4.7 million shares available for future grant under the Versum Long-Term Incentive Plan.
Total after-tax share-based compensation awards cost recognized in the consolidated income statement is summarized below:
Year Ended September 30, 2018 | Year Ended September 30, 2017 | ||||||
(In millions) | |||||||
Before-Tax Share-Based Compensation Award Cost | $ | 10.1 | $ | 8.3 | |||
Income Tax Benefit | 2.5 | 2.9 | |||||
After-Tax Share-Based Compensation Award Cost | $ | 7.6 | $ | 5.4 | |||
Before-tax share-based compensation award cost is primarily included in selling and administrative expense on our consolidated income statements.
Total before-tax share-based compensation award cost by type of program was as follows:
Year Ended September 30, 2018 | Year Ended September 30, 2017 | ||||||
(In millions) | |||||||
Restricted stock units | $ | 9.5 | $ | 7.5 | |||
Stock options | — | 0.2 | |||||
Director awards | 0.6 | 0.6 | |||||
Before-Tax Share-Based Compensation Cost | $ | 10.1 | $ | 8.3 | |||
Restricted Stock Units
Converted share-based compensation awards. As a result of the conversion in connection with the Separation described above, Versum executive officers and employees have outstanding time-based restricted stock units and market-based restricted stock units. These converted restricted stock units entitle the recipient to shares of common stock and accumulated dividends upon vesting. The payout of the converted market-based restricted stock units is conditioned on continued employment during a three year deferral period subject to payout upon death, disability, or retirement. The converted time-based restricted stock units vest four years after the grant date subject to payout upon death, disability or retirement. Upon involuntary termination without cause, a pro rata portion of restricted stock units will vest. Dividend equivalents are paid in cash and equal the dividends that would have accrued on a share of stock from the grant date to the vesting date.
New share-based compensation awards
During the year ended September 30, 2018, under its Long-Term Incentive Plan, Versum granted 203,405 market-based restricted stock units, consisting of performance-based restricted stock units and performance-based market stock units. The performance-based restricted stock units are earned at the end of a performance period beginning October 1, 2017 and ending September 30, 2020, conditioned on the level of Versum’s total shareholder return in relation to a defined peer group over the three-year performance period. The performance-based market stock units are earned based on the percentage change in the price of Versum’s common stock over the performance period beginning October 1, 2017 and ending September 30, 2020.
During the year ended September 30, 2017, under the Versum Long-Term Incentive Plan, we made a one-time Founders grant of 424,247 time-based restricted stock units at a weighted-average grant-date fair value of $22.53 per unit. One third of these restricted stock units vest on October 1, 2018, one third vest on October 1, 2019, and one third vest on October 1, 2020, subject to the holder’s continued employment with the company.
81
In addition, during the year ended September 30, 2017, under its Long-Term Incentive Plan Versum granted 304,520 market-based restricted stock units, consisting of performance-based restricted stock units and performance-based market stock units. The performance-based restricted stock units are earned at the end of a performance period beginning October 1, 2016 and ending September 30, 2019, conditioned on the level of Versum’s total shareholder return in relation to a defined peer group over the three-year performance period. The performance-based market stock units are earned based on the percentage change in the price of Versum’s common stock over the performance period beginning October 1, 2016 and ending September 30, 2019.
Subject to the recipient’s continued employment, these market-based restricted stock units granted during the years ended September 30, 2018 and 2017, generally vest on the date that the Versum Compensation Committee certifies the payout determination under the performance goals, which date must be within 90 days after the end of the performance period. Vesting is subject to certain exceptions in the event of involuntary termination by Versum, death, disability or retirement. Under GAAP, both the performance-based restricted stock units and performance-based market stock units are considered market-based awards. Upon vesting, restricted stock units represent the right to receive shares of our common stock. Dividend equivalent rights accrue for these awards, but do not vest unless the underlying awards vest.
The market-based restricted stock units awarded during the years ended September 30, 2018 and 2017 had an estimated grant-date fair value of $50.18 and $29.68, respectively, per unit for the performance-based restricted stock units and $45.71 and $28.37 for the performance-based market stock units. The fair value of market-based restricted stock units was estimated using a Monte Carlo simulation model as these equity awards are tied to a market condition. The model utilizes multiple input variables that determine the probability of satisfying the market condition stipulated in the grant and calculates the fair value of the awards.
We generally expense the grant-date fair value of these awards on a straight-line basis over the vesting period; however, expense recognition is accelerated for retirement eligible individuals who meet the requirements for vesting upon retirement.
The calculation of the fair value of market-based restricted stock units during the years ended September 30, 2018 and 2017 used the following assumptions:
Year Ended September 30, | |||||
2018 | 2017 | ||||
(In percentages) | |||||
Expected volatility | 28.0 | % | 28.7 | % | |
Risk-free interest rate | 1.9 | % | 1.4 | % | |
Expected dividend yield | 0.5 | % | — | % | |
The term is assumed to be the full vesting period for each grant.
82
A summary of restricted stock unit activity is presented below:
Shares | Weighted Average Grant-Date Fair Value | |||||
(In millions, except weighted average) | ||||||
Outstanding, September 30, 2017 | 1.1 | $ | 25.30 | |||
Granted | 0.2 | 47.23 | ||||
Paid out | (0.2 | ) | 29.65 | |||
Forfeited/adjustments | — | — | ||||
Outstanding, September 30, 2018 | 1.1 | $ | 29.47 | |||
Shares | Weighted Average Grant-Date Fair Value | |||||
(In millions, except weighted average) | ||||||
Outstanding, September 30, 2016 | — | $ | — | |||
Converted on October 1, 2016 | 0.5 | 22.85 | ||||
Granted | 0.7 | 25.30 | ||||
Paid out | (0.1 | ) | 15.55 | |||
Forfeited/adjustments | — | — | ||||
Outstanding, September 30, 2017 | 1.1 | $ | 25.30 | |||
No cash payments were made for restricted stock units for the years ended September 30, 2018 and 2017. As of September 30, 2018 and 2017, there was $13.3 million and $13.9 million, respectively, of unrecognized compensation cost related to restricted stock units. The cost is expected to be recognized over a weighted average period of 1.9 and 2.5 years, respectively. The total fair value of restricted stock units paid out during the years ended September 30, 2018 and 2017, including shares vested in prior periods, was $5.0 million and $1.7 million, respectively.
Stock Options
We may grant awards of options to purchase common stock to executive officers and selected employees. All of our outstanding stock options are a result of the conversion in connection with the Separation as described above. The exercise price of stock options equals the market price of our stock on the date of the grant. Options generally vest incrementally over three years, and remain exercisable for ten years from the date of grant. During the years ended September 30, 2018 and 2017, no stock options were granted.
83
A summary of stock option activity is presented below:
Shares | Weighted Average Exercise Price | |||||
(In millions, except weighted average) | ||||||
Outstanding, September 30, 2017 | 0.5 | $ | 18.55 | |||
Granted | — | — | ||||
Exercised | — | — | ||||
Outstanding, September 30, 2018 | 0.5 | $ | 18.66 | |||
Shares | Weighted Average Exercise Price | |||||
(In millions, except weighted average) | ||||||
Outstanding, September 30, 2016 | — | $ | — | |||
Converted on October 1, 2016 | 0.5 | 18.37 | ||||
Granted | — | — | ||||
Exercised | — | — | ||||
Outstanding, September 30, 2017 | 0.5 | $ | 18.55 | |||
Weighted Average Remaining Contractual Terms (In years) | Aggregate Intrinsic Value | ||||
(In millions, except years) | |||||
Outstanding, September 30, 2018 | 4.7 | $ | 7.9 | ||
Exercisable, September 30, 2018 | 4.7 | 7.9 | |||
Weighted Average Remaining Contractual Terms (In years) | Aggregate Intrinsic Value | ||||
(In millions, except years) | |||||
Outstanding, September 30, 2017 | 5.6 | $ | 9.6 | ||
Exercisable, September 30, 2017 | 5.6 | 9.3 | |||
The aggregate intrinsic value represents the amount by which our closing stock price of $36.01 and $38.82 as of September 30, 2018 and 2017, respectively, exceeds the exercise price multiplied by the number of in-the-money options outstanding or exercisable.
The total intrinsic value of stock options exercised during the year ended September 30, 2018 and 2017 was $0.4 million and $0.9 million, respectively.
Compensation cost is generally recognized over the stated vesting period consistent with the terms of the arrangement (i.e., either on a straight-line or graded-vesting basis). Expense recognition is accelerated for retirement-eligible individuals who would meet the requirements for vesting of awards upon their retirement. As of September 30, 2018, the stock options were fully expensed. As of September 30, 2017, there was $0.1 million of unrecognized compensation cost related to non-vested stock options, which is expected to be recognized over a weighted average period of 0.3 years.
84
Director Awards
Non-employee directors were granted equity awards under the Versum Long-Term Incentive Plan, with a grant date fair value of $100,000 annually. In the second quarter of 2018 non-employee directors were granted restricted stock units for service on our Board of Directors through the 2019 annual meeting of stockholders. Subject to continued service on the Board of Directors, the restricted stock units vest on the earlier of February 8, 2019, and the date immediately prior to Versum's next annual meeting of stockholders, and will be settled in common stock upon vesting. The grant date fair value per share is equal to the closing sales price of our common stock as reported on the New York Stock Exchange on the date of grant.
During the years ended September 30, 2018 and 2017, $0.6 million in share-based compensation expense was recognized related to these awards.
17.STOCKHOLDERS' EQUITY
Accumulated Other Comprehensive Loss
The table below summarizes changes in accumulated other comprehensive loss (AOCL), net of tax:
Net loss on derivatives qualifying as hedges | Foreign currency translation adjustments | Pension and postretirement benefits | Total | ||||||||||||
(In millions) | |||||||||||||||
Balance, September 30, 2017 | $ | (0.2 | ) | $ | (16.0 | ) | $ | (2.2 | ) | $ | (18.4 | ) | |||
Other comprehensive income (loss) before reclassifications | 0.2 | 1.1 | (1.4 | ) | (0.1 | ) | |||||||||
Amounts reclassified from AOCL | — | — | 0.1 | 0.1 | |||||||||||
Net current period other comprehensive income (loss) | 0.2 | 1.1 | (1.3 | ) | — | ||||||||||
Other comprehensive income (loss) attributable to non-controlling interest | — | (0.1 | ) | (0.1 | ) | (0.2 | ) | ||||||||
Balance, September 30, 2018 | $ | — | $ | (14.8 | ) | $ | (3.4 | ) | $ | (18.2 | ) | ||||
Net loss on derivatives qualifying as hedges | Foreign currency translation adjustments | Pension and postretirement benefits | Total | ||||||||||||
(In millions) | |||||||||||||||
Balance, September 30, 2016 | $ | (0.2 | ) | $ | (9.8 | ) | $ | — | $ | (10.0 | ) | ||||
Other comprehensive loss before reclassifications | — | (8.7 | ) | 3.7 | (5.0 | ) | |||||||||
Net transfers from Air Products | — | 3.8 | (6.2 | ) | (2.4 | ) | |||||||||
Amounts reclassified from AOCL | — | — | 0.3 | 0.3 | |||||||||||
Net current period other comprehensive loss | — | (4.9 | ) | (2.2 | ) | (7.1 | ) | ||||||||
Other comprehensive loss attributable to non-controlling interest | — | 1.3 | — | 1.3 | |||||||||||
Balance, September 30, 2017 | $ | (0.2 | ) | $ | (16.0 | ) | $ | (2.2 | ) | $ | (18.4 | ) | |||
85
The table below summarizes the reclassifications out of accumulated other comprehensive loss and the affected line item on the consolidated income statements:
Year Ended September 30, 2018 | Year Ended September 30, 2017 | ||||||
(In millions) | |||||||
Pension and Postretirement Benefits, net of tax(A) | $ | 0.1 | $ | 0.3 | |||
(A) | The components include actuarial loss amortization and are reflected in net periodic benefit cost. Refer to Note 15, Retirement Benefits, for further information. |
Cash Dividend
Holders of the company’s common stock are entitled to receive dividends when they are declared by the company’s Board of Directors. On October 31, 2017, the company’s Board of Directors declared a quarterly cash dividend of $0.05 per share, totaling $5.5 million, which was paid on November 27, 2017 to shareholders of record as of November 13, 2017. On January 30, 2018, the company’s Board of Directors declared a quarterly cash dividend of $0.05 per share totaling $5.4 million, which was paid on February 27, 2018 to shareholders of record as of February 13, 2018. On May 1, 2018, the company’s Board of Directors declared a quarterly cash dividend of $0.06 per share totaling $6.5 million, which was paid on May 29, 2018 to shareholders of record as of May 15, 2018. On July 31, 2018, the company’s Board of Directors declared a quarterly cash dividend of $0.06 per share totaling $6.6 million, which was paid on August 28, 2018 to shareholders of record as of August 14, 2018.
Future dividend declarations, if any, as well as the record and payment dates for such dividends, are subject to the final determination of the company’s Board of Directors.
18.EARNINGS PER SHARE
The following table sets forth the computation of basic and diluted earnings per share:
September 30, | |||||||||||
2018 | 2017 | 2016 | |||||||||
(In millions, except per share data) | |||||||||||
Numerator | |||||||||||
Net Income Attributable to Versum | $ | 197.5 | $ | 193.3 | $ | 209.3 | |||||
Denominator | |||||||||||
Weighted average number of common shares - Basic | 108.9 | 108.7 | 108.7 | ||||||||
Effect of dilutive securities | |||||||||||
Employee stock option and other award plans | 0.9 | 0.7 | — | ||||||||
Weighted average number of common shares - Diluted | 109.8 | 109.4 | 108.7 | ||||||||
Earnings Per Common Share Attributable to Versum | |||||||||||
Net Income Attributable to Versum - Basic | $ | 1.81 | $ | 1.78 | $ | 1.93 | |||||
Net Income Attributable to Versum - Diluted | 1.80 | 1.77 | 1.93 | ||||||||
For periods prior to the Separation, the computation of basic and diluted earnings per common share is calculated assuming the number of shares of Versum common stock outstanding on October 1, 2016 had been outstanding at the beginning of each period presented. For the periods prior to the Separation, it is assumed that there are no dilutive equity instruments as there were no equity awards in Versum outstanding prior to the Separation. See Note 1, “Basis of Presentation” for further discussion of the Separation.
86
For the year ended September 30, 2018, outstanding share-based awards of 0.2 million shares were anti-dilutive and therefore excluded from the computation of diluted earnings per share. For the year ended September 30, 2017, no outstanding share-based awards were anti-dilutive.
19.INCOME TAXES
The following table summarizes the income of U.S. and foreign operations before taxes:
Year Ended September 30, | |||||||||||
2018 | 2017 | 2016 | |||||||||
(In millions) | |||||||||||
Income Before Taxes | |||||||||||
United States | $ | 71.0 | $ | 29.3 | $ | 58.9 | |||||
Foreign | 252.6 | 223.9 | 217.1 | ||||||||
Total | $ | 323.6 | $ | 253.2 | $ | 276.0 | |||||
The following table shows the components of the provision for income taxes:
Year Ended September 30, | |||||||||||
2018 | 2017 | 2016 | |||||||||
(In millions) | |||||||||||
Current Tax Provision | |||||||||||
Federal | $ | 44.5 | $ | 2.4 | $ | — | |||||
State | 4.0 | 0.6 | 0.6 | ||||||||
Foreign | 68.9 | 47.0 | 58.3 | ||||||||
117.4 | 50.0 | 58.9 | |||||||||
Deferred Tax Provision | |||||||||||
Federal | 0.4 | 1.3 | 1.3 | ||||||||
State | (0.3 | ) | 0.1 | 0.1 | |||||||
Foreign | 1.4 | 1.6 | (1.5 | ) | |||||||
1.5 | 3.0 | (0.1 | ) | ||||||||
Income Tax Provision | $ | 118.9 | $ | 53.0 | $ | 58.8 | |||||
Income tax expense (benefit) differs from the expected amounts based on the statutory U.S. federal tax rate for the years ended September 30, 2018, 2017 and 2016 as follows:
Year Ended September 30, | |||||||||||
2018 | 2017 | 2016 | |||||||||
(In millions) | |||||||||||
U.S. federal tax | $ | 79.4 | $ | 88.4 | $ | 97.5 | |||||
State taxes, net of federal benefit | 0.8 | 0.5 | 2.2 | ||||||||
Foreign tax differentials | (3.6 | ) | (34.7 | ) | (30.7 | ) | |||||
U.S. taxes on foreign earnings | (0.9 | ) | (0.3 | ) | 4.7 | ||||||
Other credit and incentives | (1.7 | ) | (0.8 | ) | (0.8 | ) | |||||
U.S. tax law change | 41.7 | — | — | ||||||||
Valuation allowance | 0.6 | 0.9 | (19.2 | ) | |||||||
Other | 2.6 | (1.0 | ) | 5.1 | |||||||
Income Tax Expense (Benefit) | $ | 118.9 | $ | 53.0 | $ | 58.8 | |||||
87
On December 22, 2017, the Tax Act was enacted in the U.S. Certain provisions of the Tax Act are effective for the company’s fiscal year 2018, whereas other material provisions of the Tax Act will not apply to the company until the company’s fiscal year 2019.
For fiscal year ended September 30, 2018, the company’s statutory U.S. federal income tax rate was 24.5% which represents a blending of the 35.0% statutory rate under prior law and the new 21.0% statutory rate effective January 1, 2018, prorated based on the number of days during the company’s current fiscal year that each rate was effective. For fiscal years 2019 and later, the company’s statutory U.S. federal income tax rate will be 21.0%.
As a result of the Tax Act, and shown in the table above, the company recorded a provisional net one-time charge of $41.7 million for year ended September 30, 2018. This charge includes a $53.8 million charge for federal and state taxes on the mandatory deemed repatriation of certain of the company’s foreign accumulated earnings. We expect to elect to pay the federal portion of the resulting liability, net of available tax credits, over the eight-year period provided in the Tax Act, with $3.2 million of the federal liability payable in connection with our fiscal year 2018. The deemed repatriation charge was partially offset by a $12.1 million tax benefit related to the estimated revaluation of the company’s deferred tax assets and liabilities using the U.S. statutory federal and state income tax rates and compensation deductibility rules that are anticipated to apply when the deferred tax assets and liabilities will become current.
The methodology used in calculating these provisional items incorporates assumptions about required tax adjustments to book earnings, foreign taxes paid, future executive compensation levels, estimated temporary book to tax differences, pending guidance and other items. We will continue to obtain information, actively monitor factual and legal developments, complete our tax compliance cycles, analyze and review the available information, and expect to adjust the provisional tax accrual consistent with the SEC’s Staff Accounting Bulletin No. 118. The company has elected to account for GILTI tax in the period in which it is incurred, and therefore has not provided any deferred tax impacts of GILTI in its consolidated financial statements for the year ended September 30, 2018.
For the three months ended September 30, 2018, the adjustment to the provisional tax accrual recorded in nine months ended June 30, 2018, was a tax charge of $7.2 million. This resulted in an increase of 2.2% to the company’s effective tax rate for the twelve months ended September 30, 2018. The adjustment was primarily due to a change in estimated cumulative earnings and profits, aggregate foreign cash position, and tax pools in foreign jurisdictions that reduced the company’s tax on the mandatory deemed repatriation.
Beginning in the company’s fiscal year 2019, Versum will be subject to additional provisions in accordance with the Tax Act. These provisions include income inclusions, deductions, limitations on interest expense and other deductions and our ability to utilize certain tax credits, and minimum taxes, among other things.
Foreign tax differentials represent the differences between foreign earnings subject to foreign tax rates lower than the U.S. federal statutory tax rate of 24.5% for September 30, 2018. Foreign earnings are subject to local country tax rates that are generally below the 24.5% U.S. federal statutory rate. As a result, our effective non-U.S. tax rate varies from the U.S. statutory rate. The decrease in foreign tax rate differential as shown in the table above is the result of the decreased statutory U.S. tax rate from 35.0% to 24.5%. As substantially all of our undistributed earnings are in countries with a statutory tax rate of 17.0% or higher, we do not generate a disproportionate amount of taxable income in countries with very low tax rates. U.S. taxes on foreign earnings include the cost of foreign withholding taxes imposed on dividends paid to U.S. shareholders net of available US foreign tax credits.
We accrue U.S. income and foreign withholding taxes on the undistributed earnings of our foreign subsidiaries and corporate joint ventures unless those earnings are indefinitely reinvested. These cumulative undistributed earnings that were considered to be indefinitely reinvested in foreign subsidiaries and corporate joint ventures is estimated to be $795.0 million as of September 30, 2018. An estimated $79.5 million in foreign withholding taxes would be due if these earnings were remitted as dividends.
We have certain foreign subsidiaries that were granted seven-year tax holidays, the majority of which expired during the year ending September 30, 2017. The tax benefit of the holidays is reduced by 50% in the last two years of the holiday period. The net benefit of the tax holidays was $1.1 million, $8.0 million, and $7.1 million in 2018, 2017 and 2016, respectively.
88
We maintained a valuation allowance in 2016 against U.S. deferred tax accounts resulting primarily from restructuring charges taken in prior periods, as we determined that it was more likely than not that U.S. deferred tax assets would not be realized. These deferred tax assets related primarily to net operating loss and tax credit carryforwards derived from the stand-alone basis calculation. The valuation allowance benefit in 2016 shown in the table above relate to the utilization of federal net operating losses as a result of favorable operations. These net operating losses and tax credit carryforwards were utilized against Air Products’ income and are not available as future deductions on Versum tax returns. The fiscal years 2017 and 2018 effective tax rates, therefore, includes no valuation allowance benefit related to U.S. deferred tax assets. The valuation allowance cost for 2017 and 2018 relates to certain foreign tax credits accrued outside the U.S.
The significant components of deferred tax assets and liabilities are as follows:
September 30, | |||||||
2018 | 2017 | ||||||
(In millions) | |||||||
Gross Deferred Tax Assets | |||||||
Tax loss carryforwards | $ | 0.4 | $ | 0.5 | |||
Tax credit carryforwards | 3.1 | 0.9 | |||||
Retirement benefits and compensation accruals | 9.3 | 10.9 | |||||
Reserves and accruals | 6.2 | — | |||||
Other | 4.0 | 1.5 | |||||
Valuation allowance | (1.4 | ) | (0.9 | ) | |||
Deferred Tax Assets | 21.6 | 12.9 | |||||
Gross Deferred Tax Liabilities | |||||||
Intangible assets | 4.1 | 9.1 | |||||
Reserves and accruals | — | 1.6 | |||||
Plant and equipment | 35.2 | 22.9 | |||||
Unremitted earnings of foreign entities | — | 0.7 | |||||
Partnership investments | 0.3 | 0.8 | |||||
Accounting method change | 4.6 | — | |||||
Other | 0.4 | 0.2 | |||||
Deferred Tax Liabilities | 44.6 | 35.3 | |||||
Net Deferred Income Tax Liability | $ | 23.0 | $ | 22.4 | |||
Deferred tax assets and liabilities are included within the Annual Consolidated Financial Statements as follows:
September 30, | |||||||
2018 | 2017 | ||||||
(In millions) | |||||||
Other non-current assets | $ | 18.3 | $ | 18.1 | |||
Deferred tax liabilities | 41.3 | 40.5 | |||||
Net Deferred Income Tax Liability | $ | 23.0 | $ | 22.4 | |||
The federal and state research credit carryforwards as of September 30, 2018 were $1.7 million, which begin to expire in 2032. Gross foreign net operating loss carryforwards as of September 30, 2018 were $1.3 million, and expire in 2026.
The valuation allowance as of September 30, 2018 is related to the tax benefit of foreign tax credits accrued in jurisdictions outside the U.S. As of September 30, 2018, we believed it would be more likely than not that future earnings and reversal of deferred tax liabilities would be sufficient to utilize the deferred tax asset reflected on the financial statements, net of existing valuation allowance.
89
A reconciliation of the beginning and ending amount of the unrecognized tax benefits excluding interest and penalties is as follows:
Year Ended September 30, | |||||||
(In millions) | 2018 | 2017 | |||||
Unrecognized Tax Benefits | |||||||
Balance at beginning of year | $ | 15.7 | $ | 12.9 | |||
Additions for tax positions for the current year | 2.8 | 2.1 | |||||
Additions for tax positions of prior years | 1.8 | 1.0 | |||||
Reductions for tax positions of prior years | (4.9 | ) | (0.2 | ) | |||
Statute of limitations expiration | (1.9 | ) | (0.1 | ) | |||
Balance at End of Year | $ | 13.5 | $ | 15.7 | |||
At September 30, 2018 and 2017, we had $13.5 million and $15.7 million of unrecognized tax benefits of which $13.5 million and $15.7 million, respectively, would impact the tax rate, if recognized. The current year decrease in unrecognized tax benefits relates, primarily, to an income tax audit settlement in a foreign jurisdiction. Interest and penalties related to unrecognized tax benefits are recorded as a component of income tax expense. The cumulative amount of interest and penalties accrued on the balance sheet as of September 30, 2018 was $1.3 million.
We are currently under examination in a number of tax jurisdictions, some of which may be resolved in the next twelve months. As a result, it is reasonably possible that a change in the unrecognized tax benefits may occur during the next twelve months. However, quantification of an estimated range cannot be made at this time.
We generally remain subject to examination in the following major tax jurisdictions for the years indicated below:
Open Tax Years | |
Major Tax Jurisdiction | |
United States | 2017-2018 |
China | 2008-2018 |
South Korea | 2010-2018 |
Taiwan | 2013-2018 |
20.SUPPLEMENTAL INFORMATION
September 30, | |||||||
(In millions) | 2018 | 2017 | |||||
Payables and Accrued Liabilities | |||||||
Trade creditors | $ | 65.5 | $ | 56.0 | |||
Customer advances | 18.7 | 5.3 | |||||
Accrued payroll and employee benefits | 39.1 | 41.2 | |||||
Other costs associated with business separation, restructuring and cost reduction actions | 3.9 | 7.9 | |||||
Derivatives | — | 1.5 | |||||
Other | 11.4 | 8.9 | |||||
$ | 138.6 | $ | 120.8 | ||||
90
21.COMMITMENTS AND CONTINGENCIES
Litigation
In the normal course of business, Versum may be involved in various legal proceedings, including commercial, environmental, health, safety, and product liability matters. Although litigation with respect to these matters is routine and incidental to the conduct of our business, such litigation may result in large monetary awards for compensatory and punitive damages. Versum does not currently believe that there are any legal proceedings, individually or in the aggregate, that are reasonably possible to have a material impact on its financial condition, results of operations, or cash flows.
Environmental and Regulatory Proceedings
From time to time, Versum may be involved in proceedings, investigations, and audits involving governmental authorities in connection with environmental, health, safety, competition, and tax matters. In addition, pursuant to the Separation Agreement, Versum is liable to Air Products for proceedings by the Environmental Protection Agency under the Comprehensive Environmental Response, Compensation, and Liability Act, the federal Superfund law (“CERCLA”); the Resource Conservation and Recovery Act (“RCRA”); and similar state and foreign environmental laws relating to current or former Electronic Materials business sites, and third-party waste disposal facilities used by the Electronic Materials business, that have been designated for investigation or remediation. Versum may be liable for any unknown environmental liabilities related to legacy businesses and sites formerly owned and operated by Air Products related to its former electronics businesses. Versum does not currently believe that there are any environmental or regulatory matters, individually or in the aggregate, that are reasonably possible to have a material impact on our financial condition, results of operations, or cash flows.
Any future charges related to the costs of litigation, environmental, or regulatory proceedings for fines, settlements or damages related to any such matters could have a material impact on our results of operations or cash flows in the period incurred. While Versum cannot predict the outcome of any litigation, environmental, or regulatory matter or the potential for future litigation or regulatory action, we have evaluated all litigation, environmental and regulatory proceedings, claims and assessments in which Versum is involved, and do not believe that any of these matters, individually or in the aggregate, will result in losses that are materially in excess of amounts already recognized, if any.
Unconditional Purchase Obligations
We have unconditional purchase obligations of approximately $44.5 million for plant and equipment purchases as well as R&D facility enhancements. Otherwise, there are no material obligations.
22.SEGMENT AND GEOGRAPHIC INFORMATION
We are comprised of two primary operating segments, Materials and Delivery Systems and Services, under which we manage our operations and assess performance, and a Corporate segment. Our segments are differentiated by the types of products sold.
Materials
The Materials operating segment is an integrated provider of specialty materials for the high-growth electronics industry, focusing on the integrated circuit and flat-panel display markets. This segment provides the global semiconductor industry with high purity process materials for deposition, metallization, chamber cleaning and etching, chemicals mechanical planarization slurries, organosilanes, organometallics and liquid dopants for thin film deposition, and formulated chemical products for post-etch cleaning primarily for the manufacture of silicon and compound semiconductors and thin film transistor liquid crystal displays. The majority of our sales to the semiconductor industry are to large scale multinational companies.
Delivery Systems and Services
The Delivery Systems and Services operating segment designs, manufactures, installs, operates, and maintains chemical and gas delivery and distribution systems for specialty gases and chemicals delivered directly to our customers’
91
manufacturing tools. In addition, the business provides turnkey installation services during facility construction and startup as well as onsite operating services.
Corporate
The Corporate segment includes certain administrative costs such as information technology, general services, human resources, legal, accounting, and other services, as well as foreign exchange gains and losses, and other income and expense that cannot be directly associated with operating segments. Corporate assets primarily include cash and deferred tax assets.
Customers
For the fiscal year ended September 30, 2018, four customers each accounted for 10% or more of combined sales from both the Materials and Delivery Systems and Services segments. These customers accounted for 20%, 13%, 10% and 10% of our combined sales. For the fiscal years ended September 30, 2017 and 2016, three customers accounted for 10% or more of combined sales from both the Materials and Delivery Systems and Services segments. In 2017, these customers accounted for 22%, 13% and 12% of our combined sales. In 2016, these customers accounted for 21%, 13%, and 13% of our combined sales. No other customer accounted for more than 10% of combined sales in any period.
Products
For the fiscal year ended September 30, 2018, a Delivery Systems and Services segment product accounted for 10% or more of combined sales from both the Materials and Delivery Systems and Services segments. For the fiscal year ended September 30, 2018, this product accounted for 10% of our combined sales. For the fiscal years ended September 30, 2017 and 2016, a Materials segment product accounted for 10% or more of combined sales from both the Materials and Delivery Systems and Services segments. For the fiscal years ended September 30, 2017 and 2016, this product accounted for 11% and 12% of our combined sales, respectively.
Accounting Policies
The accounting policies of the segments are the same as those described in Note 2, Major Accounting Policies. We evaluate the performance of segments based upon reported segment operating income. Intersegment sales are not material and are recorded at selling prices that approximate market prices.
92
Segment
As of and for the year ended September 30, | |||||||||||
2018 | 2017 | 2016 | |||||||||
(In millions) | |||||||||||
Sales | |||||||||||
Materials | $ | 885.6 | $ | 829.7 | $ | 756.7 | |||||
Delivery Systems and Services | 483.7 | 293.6 | 213.4 | ||||||||
Corporate | 3.0 | 3.6 | — | ||||||||
Combined Total | $ | 1,372.3 | $ | 1,126.9 | $ | 970.1 | |||||
Operating Income (Loss) | |||||||||||
Materials | $ | 286.5 | $ | 274.9 | $ | 249.6 | |||||
Delivery Systems and Services | 135.5 | 71.7 | 50.8 | ||||||||
Corporate | (27.4 | ) | (20.5 | ) | (23.3 | ) | |||||
Segment Total | 394.6 | 326.1 | 277.1 | ||||||||
Business separation, restructuring and cost reduction actions | (20.6 | ) | (25.5 | ) | (0.9 | ) | |||||
Combined Total | $ | 374.0 | $ | 300.6 | $ | 276.2 | |||||
Depreciation and Amortization | |||||||||||
Materials | $ | 47.7 | $ | 43.1 | $ | 44.4 | |||||
Delivery Systems and Services | 2.1 | 1.4 | 2.1 | ||||||||
Corporate | 1.0 | 1.5 | 0.4 | ||||||||
Combined Total | $ | 50.8 | $ | 46.0 | $ | 46.9 | |||||
Equity Affiliates’ Income | |||||||||||
Materials | $ | — | $ | — | $ | 0.2 | |||||
Combined Total | $ | — | $ | — | $ | 0.2 | |||||
Total Assets | |||||||||||
Materials | $ | 862.5 | $ | 782.6 | $ | 741.7 | |||||
Delivery Systems and Services | 144.9 | 110.9 | 104.0 | ||||||||
Corporate | 497.9 | 362.1 | 206.4 | ||||||||
Combined Total | $ | 1,505.3 | $ | 1,255.6 | $ | 1,052.1 | |||||
Expenditures for Long-Lived Assets | |||||||||||
Materials | $ | 93.1 | $ | 45.7 | $ | 34.4 | |||||
Delivery Systems and Services | 1.0 | 1.7 | 0.7 | ||||||||
Corporate | 21.3 | 16.6 | 0.7 | ||||||||
Combined Total | $ | 115.4 | $ | 64.0 | $ | 35.8 | |||||
93
Sales by Product Group
Year Ended September 30, | |||||||||||
2018 | 2017 | 2016 | |||||||||
(In millions) | |||||||||||
Process Materials | $ | 408.0 | $ | 401.8 | $ | 387.4 | |||||
Advanced Materials | 477.6 | 427.9 | 369.3 | ||||||||
Equipment and Installations | 421.1 | 235.4 | 150.8 | ||||||||
Site Services | 62.6 | 58.2 | 62.6 | ||||||||
Corporate | 3.0 | 3.6 | — | ||||||||
Total | $ | 1,372.3 | $ | 1,126.9 | $ | 970.1 | |||||
Geographic Information
Year Ended September 30, | |||||||||||
2018 | 2017 | 2016 | |||||||||
(In millions) | |||||||||||
Sales to External Customers | |||||||||||
United States | $ | 418.9 | $ | 375.7 | $ | 349.4 | |||||
Taiwan | 249.1 | 242.8 | 230.8 | ||||||||
South Korea | 459.5 | 304.1 | 217.2 | ||||||||
China | 94.2 | 64.9 | 53.8 | ||||||||
Europe | 61.7 | 63.1 | 57.8 | ||||||||
Asia, excluding China, Taiwan, and South Korea | 88.9 | 76.3 | 61.1 | ||||||||
Total | $ | 1,372.3 | $ | 1,126.9 | $ | 970.1 | |||||
September 30, | |||||||||||
2018 | 2017 | 2016 | |||||||||
(In millions) | |||||||||||
Long-Lived Assets(A) | |||||||||||
United States | $ | 224.0 | $ | 170.3 | $ | 138.3 | |||||
South Korea | 130.7 | 112.2 | 112.2 | ||||||||
Taiwan | 38.2 | 38.2 | 36.8 | ||||||||
Asia, excluding Taiwan and South Korea | 11.1 | 9.2 | 9.0 | ||||||||
Europe | 1.1 | 0.4 | 0.2 | ||||||||
Total | $ | 405.1 | $ | 330.3 | $ | 296.5 | |||||
(A) | Long-lived assets include plant and equipment, net. |
Geographic information is based on country of origin. Included in United States revenues are export sales to third-party customers of $99.5 million in 2018, $68.7 million in 2017, and $75.8 million in 2016.
94
23.ACQUISITION
On August 1, 2017, the company completed the acquisition of 100% of Dynaloy, LLC (“Dynaloy”) from Eastman Chemical Co. Dynaloy is a supplier of formulated cleaning solutions for the semiconductor and specialty manufacturing industries. The purchase price of approximately $13 million was paid in cash from our available cash balance. The acquisition of Dynaloy does not constitute a material business combination.
The company has accounted for the acquisition as a business combination in accordance with ASC 805, Business Combinations ("ASC 805"), and has included Dynaloy within the Materials reportable segment. In applying the provisions of ASC 805 and determining that Dynaloy represents a business, the company elected to early adopt and apply ASU 2017-01 (refer to Note 1). Under ASU 2017-01, the company first assessed whether all of the fair value of the acquired Dynaloy gross assets is concentrated in a single identifiable asset or group of identifiable assets. If that concentration existed, Dynaloy would not be considered a business. The company concluded that there was not such a concentration, as the fair value of the acquired gross assets is distributed between various intangible and tangible assets.
The company has allocated the acquisition purchase price to the tangible net assets and identifiable intangible assets acquired based on their estimated fair values at the acquisition date and recorded the excess as goodwill. The valuation of the assets and liabilities acquired was based on the information that was available as of the acquisition date and the expectations and assumptions that have been deemed reasonable by the company’s management. In performing these valuations, the company used discounted cash flows and other factors as the best evidence of fair value. The key underlying assumptions of the discounted cash flows were projected revenues and royalty rates. The company has recognized $5.0 million of goodwill, which is attributable to the revenue growth and operating synergies that Versum expects to realize from this acquisition.
The company’s estimates and assumptions used in determining the estimated fair values of the net assets acquired are subject to change within the measurement period (up to one year from the acquisition date) as a result of additional information obtained with regards to facts and circumstances that existed as of the acquisition date.
The following table presents the final aggregate purchase price allocation:
Net Assets Acquired | |||
(In millions) | |||
Accounts receivable | $ | 1.0 | |
Other current assets | 0.1 | ||
Inventories | 1.4 | ||
Properties and Equipment, net | 2.4 | ||
Goodwill | 5.0 | ||
Intangible assets | 3.7 | ||
Other current liabilities | (0.4 | ) | |
Net assets acquired | $ | 13.2 | |
The table below presents the intangible assets acquired as part of the acquisition of Dynaloy and the periods over which they will be amortized on a straight line basis:
Amount | Weighted Average Amortization Period | ||||
(In millions, except years) | |||||
Technology | $ | 2.8 | 7 | ||
Trademarks | 0.9 | 5 | |||
Total | $ | 3.7 | |||
95
24.SUBSEQUENT EVENTS
Cash Dividend
On October 31, 2018, the company’s Board of Directors declared a quarterly cash dividend of $0.08 per share, an increase of 33% from previous dividends of $0.06 per share, to be paid on November 27, 2018 to shareholders of record as of November 13, 2018.
25.SUMMARY BY QUARTER (UNAUDITED)
These tables summarize the unaudited results of operations for each quarter of fiscal 2018 and 2017:
For the Quarter Ended | |||||||||||||||||||
December 31, 2017(A) | March 31, 2018(A) | June 30, 2018(A) | September 30, 2018(B) | Total | |||||||||||||||
(In millions) | |||||||||||||||||||
Sales | $ | 330.8 | $ | 340.7 | $ | 350.0 | $ | 350.8 | $ | 1,372.3 | |||||||||
Cost of sales | 191.4 | 195.9 | 200.4 | 200.4 | 788.1 | ||||||||||||||
Selling and administrative | 35.3 | 36.6 | 35.2 | 36.0 | 143.1 | ||||||||||||||
Research and development | 12.7 | 11.1 | 12.4 | 12.9 | 49.1 | ||||||||||||||
Business separation, restructuring and cost reduction actions | 1.8 | 8.2 | 6.7 | 3.9 | 20.6 | ||||||||||||||
Other (income) expense, net | 0.5 | (0.5 | ) | (0.9 | ) | (1.7 | ) | (2.6 | ) | ||||||||||
Operating Income | 89.1 | 89.4 | 96.2 | 99.3 | 374.0 | ||||||||||||||
Interest expense | 11.3 | 11.9 | 12.5 | 12.6 | 48.3 | ||||||||||||||
Write-off of financing costs | 2.1 | — | — | — | 2.1 | ||||||||||||||
Income Before Taxes | 75.7 | 77.5 | 83.7 | 86.7 | 323.6 | ||||||||||||||
Income tax provision | 55.0 | 14.2 | 19.6 | 30.1 | 118.9 | ||||||||||||||
Net Income | 20.7 | 63.3 | 64.1 | 56.6 | 204.7 | ||||||||||||||
Less: Net Income Attributable to Non-controlling Interests | 2.0 | 1.7 | 0.8 | 2.7 | 7.2 | ||||||||||||||
Net Income Attributable to Versum | $ | 18.7 | $ | 61.6 | $ | 63.3 | $ | 53.9 | $ | 197.5 | |||||||||
Net income attributable to Versum per common share: | |||||||||||||||||||
Basic | $ | 0.17 | $ | 0.57 | $ | 0.58 | $ | 0.49 | $ | 1.81 | |||||||||
Diluted | $ | 0.17 | $ | 0.56 | $ | 0.58 | $ | 0.49 | $ | 1.80 | |||||||||
(A) As adjusted, Note 2. The effects of the change were not material to any quarter.
(B) As reported
96
For the Quarter Ended (as adjusted, Note 2) | |||||||||||||||||||
December 31, 2016 | March 31, 2017 | June 30, 2017 | September 30, 2017 | Total | |||||||||||||||
(In millions) | |||||||||||||||||||
Sales | $ | 270.8 | $ | 270.8 | $ | 290.8 | $ | 294.5 | $ | 1,126.9 | |||||||||
Cost of sales | 151.2 | 154.5 | 159.6 | 171.1 | 636.4 | ||||||||||||||
Selling and administrative | 30.2 | 29.5 | 34.5 | 31.5 | 125.7 | ||||||||||||||
Research and development | 10.3 | 10.9 | 11.9 | 12.0 | 45.1 | ||||||||||||||
Business separation, restructuring and cost reduction actions | 3.2 | 6.1 | 6.0 | 10.2 | 25.5 | ||||||||||||||
Other (income) expense, net | (2.9 | ) | (0.1 | ) | (2.2 | ) | (1.2 | ) | (6.4 | ) | |||||||||
Operating Income | 78.8 | 69.9 | 81.0 | 70.9 | 300.6 | ||||||||||||||
Interest expense | 11.5 | 11.6 | 11.9 | 12.4 | 47.4 | ||||||||||||||
Income Before Taxes | 67.3 | 58.3 | 69.1 | 58.5 | 253.2 | ||||||||||||||
Income tax provision | 15.2 | 11.5 | 14.4 | 11.9 | 53.0 | ||||||||||||||
Net Income | 52.1 | 46.8 | 54.7 | 46.6 | 200.2 | ||||||||||||||
Less: Net Income Attributable to Non-controlling Interests | 1.5 | 1.9 | 2.0 | 1.5 | 6.9 | ||||||||||||||
Net Income Attributable to Versum | $ | 50.6 | $ | 44.9 | $ | 52.7 | $ | 45.1 | $ | 193.3 | |||||||||
Net income attributable to Versum per common share: | |||||||||||||||||||
Basic | $ | 0.47 | $ | 0.41 | $ | 0.48 | $ | 0.41 | $ | 1.78 | |||||||||
Diluted | $ | 0.46 | $ | 0.41 | $ | 0.48 | $ | 0.41 | $ | 1.77 | |||||||||
97
SCHEDULE II
CONSOLIDATED
VERSUM MATERIALS, INC.
SCHEDULE II-VALUATION AND QUALIFYING ACCOUNTS
For the Years Ended September 30, 2018, 2017, and 2016
Balance at Beginning of Period | Change Charged to Expense | Other Changes (A) | Balance at End of Period | ||||||||||
(In millions) | |||||||||||||
Year Ended September 30, 2018 | |||||||||||||
Allowance for doubtful accounts | $ | 1.0 | 0.1 | — | $ | 1.1 | |||||||
Allowance for deferred tax assets | $ | 0.9 | 0.5 | — | $ | 1.4 | |||||||
Year Ended September 30, 2017 | |||||||||||||
Allowance for doubtful accounts | $ | 0.8 | 0.2 | — | $ | 1.0 | |||||||
Allowance for deferred tax assets | $ | 55.6 | 0.9 | (55.6 | ) | $ | 0.9 | ||||||
Year Ended September 30, 2016 | |||||||||||||
Allowance for doubtful accounts | $ | 0.8 | — | — | $ | 0.8 | |||||||
Allowance for deferred tax assets | $ | 77.7 | (20.8 | ) | (1.3 | ) | $ | 55.6 | |||||
(A) | For 2017, Other Changes primarily includes adjustments related to the Separation. |
For 2016, Other Changes primarily includes write-offs of uncollectible trade receivable accounts and the impact of foreign currency translation adjustments.
98
Item 9. Changes in and Disagreements with Accountants on Accounting and Financial Disclosure
None
Item 9A. Controls and Procedures
Management’s Evaluation of Disclosure Controls and Procedures
As of the end of the period covered by this Annual Report on Form 10-K, our management, with the participation of our principal executive officer and our principal financial officer, has evaluated the effectiveness of our disclosure controls and procedures (as defined in Rule 13a-15(e) of the Exchange Act), which are designed to provide reasonable assurance that we are able to record, process, summarize and report the information required to be disclosed in our reports under the Exchange Act within the time periods specified in the rules and forms of the SEC. Based on the evaluation, as of September 30, 2018, our principal executive officer and principal financial officer concluded that our disclosure controls and procedures were effective to provide reasonable assurance that the information required to be disclosed in reports that we file or submit under the Exchange Act is accumulated and communicated to management, including our principal executive officer and principal financial officer, or persons performing similar functions, as appropriate to allow timely decisions regarding required disclosures and to ensure that such information is recorded, processed, summarized and reported within the time periods specified in the SEC’s rules and forms.
Management’s Annual Report on Internal Control Over Financial Reporting
Management is responsible for establishing and maintaining adequate internal control over financial reporting, as such term is defined in Exchange Act Rules 13a-15(f) and 15d-15(f). Internal control over financial reporting is a process designed to provide reasonable assurance regarding the reliability of financial reporting and the preparation of financial statements for external purposes in accordance with generally accepted accounting principles.
Internal control over financial reporting includes those policies and procedures that (i) pertain to the maintenance of records that, in reasonable detail, accurately and fairly reflect the transactions and dispositions of the assets of the company; (ii) provide reasonable assurance that transactions are recorded as necessary to permit preparation of financial statements in accordance with generally accepted accounting principles, and that receipts and expenditures of the company are being made only in accordance with authorizations of management and directors of the company and (iii) provide reasonable assurance regarding prevention or timely detection of unauthorized acquisition, use, or disposition of the company’s assets that could have a material effect on the financial statements.
Because of its inherent limitations, internal control over financial reporting may not prevent or detect misstatements. Projections of any evaluation of effectiveness to future periods are subject to the risk that controls may become inadequate because of changes in conditions, or that the degree of compliance with the policies and procedures may deteriorate.
Management conducted an assessment of the effectiveness of our internal control over financial reporting as of September 30, 2018, based on the framework established in Internal Control — Integrated Framework issued by the Committee of Sponsoring Organizations of the Treadway Commission (“COSO”). Based on the results of this evaluation, our management concluded that our internal control over financial reporting was effective as of September 30, 2018, based on criteria in Internal Control — Integrated Framework (2013) issued by the COSO.
The effectiveness of our internal control over financial reporting as of September 30, 2018, has been audited by KPMG LLP, an independent registered public accounting firm, as stated in their report which appears in this section.
Changes in Internal Control over Financial Reporting
Prior to the Separation, we relied on certain financial information and resources of Air Products to manage specific aspects of our business and report results. These included investor relations, corporate communications, accounting, tax, legal, human resources, benefit plan administration, benefit plan reporting, general management, real estate, treasury, insurance and risk management, and oversight functions, such as Board of Directors and internal audit, which includes Sarbanes-Oxley compliance. In conjunction with the Separation, we revised and adopted policies, as needed, to meet all regulatory
99
requirements applicable to us as a stand-alone public company. We continue to review and document our internal controls over financial reporting, and may from time to time make changes aimed at enhancing their effectiveness. These efforts may lead to additional changes in our internal controls over financial reporting.
During 2018, we implemented an Enterprise Resource Planning (“ERP”) system. The implementation of the ERP system represents a change in our internal control over financial reporting. We have taken steps to implement appropriate internal control over financial reporting during this period of change and will continue to evaluate the design and operating effectiveness of our internal controls during subsequent periods.
Other than internal controls affected by the implementation of the new ERP system discussed above, there were no other changes in our internal control over financial reporting during fiscal 2018 that have materially affected, or are reasonably likely to materially affect, our internal control over financial reporting.
100
Report of Independent Registered Public Accounting Firm
To the Stockholders and Board of Directors
Versum Materials, Inc.:
Opinion on Internal Control Over Financial Reporting
We have audited Versum Materials, Inc.’s and subsidiaries’ (the Company) internal control over financial reporting as of September 30, 2018, based on criteria established in Internal Control - Integrated Framework (2013) issued by the Committee of Sponsoring Organizations of the Treadway Commission. In our opinion, the Company maintained, in all material respects, effective internal control over financial reporting as of September 30, 2018, based on criteria established in Internal Control - Integrated Framework (2013) issued by the Committee of Sponsoring Organizations of the Treadway Commission.
We also have audited, in accordance with the standards of the Public Company Accounting Oversight Board (United States) (PCAOB), the consolidated balance sheets of the Company as of September 30, 2018 and 2017, the related consolidated statements of income, comprehensive income, stockholders’ equity, and cash flows for each of the years in the three-year period ended September 30, 2018, and the related notes and financial statement schedule II (collectively, the consolidated financial statements), and our report dated November 21, 2018 expressed an unqualified opinion on those consolidated financial statements.
Basis for Opinion
The Company’s management is responsible for maintaining effective internal control over financial reporting and for its assessment of the effectiveness of internal control over financial reporting, included in the accompanying Management’s Annual Report on Internal Control over Financial Reporting. Our responsibility is to express an opinion on the Company’s internal control over financial reporting based on our audit. We are a public accounting firm registered with the PCAOB and are required to be independent with respect to the Company in accordance with the U.S. federal securities laws and the applicable rules and regulations of the Securities and Exchange Commission and the PCAOB.
We conducted our audit in accordance with the standards of the PCAOB. Those standards require that we plan and perform the audit to obtain reasonable assurance about whether effective internal control over financial reporting was maintained in all material respects. Our audit of internal control over financial reporting included obtaining an understanding of internal control over financial reporting, assessing the risk that a material weakness exists, and testing and evaluating the design and operating effectiveness of internal control based on the assessed risk. Our audit also included performing such other procedures as we considered necessary in the circumstances. We believe that our audit provides a reasonable basis for our opinion.
Definition and Limitations of Internal Control Over Financial Reporting
A company’s internal control over financial reporting is a process designed to provide reasonable assurance regarding the reliability of financial reporting and the preparation of financial statements for external purposes in accordance with generally accepted accounting principles. A company’s internal control over financial reporting includes those policies and procedures that (1) pertain to the maintenance of records that, in reasonable detail, accurately and fairly reflect the transactions and dispositions of the assets of the company; (2) provide reasonable assurance that transactions are recorded as necessary to permit preparation of financial statements in accordance with generally accepted accounting principles, and that receipts and expenditures of the company are being made only in accordance with authorizations of management and directors of the company; and (3) provide reasonable assurance regarding prevention or timely detection of unauthorized acquisition, use, or disposition of the company’s assets that could have a material effect on the financial statements.
Because of its inherent limitations, internal control over financial reporting may not prevent or detect misstatements. Also, projections of any evaluation of effectiveness to future periods are subject to the risk that controls may become inadequate because of changes in conditions, or that the degree of compliance with the policies or procedures may deteriorate.
/s/ KPMG LLP
Philadelphia, Pennsylvania
November 21, 2018
101
Item 9B. Other Information
None
Part III
In accordance with General Instruction G(3) of Form 10-K, certain information required by this Part III is incorporated by reference to the definitive proxy statement relating to our 2018 Annual Meeting of Stockholders (“Proxy Statement”). The Proxy Statement will be filed with the Securities and Exchange Commission within 120 days after the end of our fiscal year ended September 30, 2018.
Item 10. Directors, Executive Officers and Corporate Governance
The information set forth in the Proxy Statement under the headings “Proposal One - Election of Directors,” “Executive Officers,” and “Section 16(a) Beneficial Ownership Reporting Compliance” is incorporated herein by reference.
The information regarding our Code of Conduct, our audit committee and our audit committee financial expert under the caption “Corporate Governance and Related Matters” in the Proxy Statement is also incorporated herein by reference.
The company has adopted a Code of Conduct that applies to all employees, including the Chief Executive Officer, the Chief Financial Officer, and the Principal Accounting Officer. The Code of Conduct can be found at our Internet website at www.versummaterials.com. We intend to disclose on our website future amendments or waivers of our Code of Business Conduct required to be disclosed the rules of either the SEC or the NYSE, on our website within the required periods.
Item 11. Executive Compensation
The information set forth in the Proxy Statement under the heading “Executive Compensation,” “Corporate Governance and Related Matters—Compensation Committee Report,” “Corporate Governance and Related Matters—Compensation Committee Report—Compensation Committee Interlocks and Insider Participation,” and “Director Compensation” is incorporated herein by reference.
Item 12. Security Ownership of Certain Beneficial Owners and Management and Related Stockholder Matters
The information contained in the sections captioned “Equity Compensation Plan Information” and “Security Ownership of Certain Beneficial Owners” of the Proxy Statement is incorporated herein by reference.
Item 13. Certain Relationships and Related Transactions and Director Independence
The information contained in the sections captioned “Certain Relationships and Related Person Transactions” and “Corporate Governance and Related Matters—Director Independence” in the Proxy Statement is incorporated herein by reference.
Item 14. Principal Accountant Fees and Services
The information regarding our independent registered public accounting firm fees and services in the sections captioned “Audit and Related Fees” and “Corporate Governance and Related Matters—Audit Committee” of the Proxy Statement is incorporated herein by reference.
102
Part IV
Item 15. Exhibits and Financial Statement Schedules
(a) The following documents are filed as a part of this annual report:
(1) The company’s 2018 consolidated financial statements and the Report of the Independent Registered Public Accounting Firm are included in Part II, Item 8.
(2) Financial Statement Schedules - the following additional information should be read in conjunction with the consolidated financial statements in the company’s 2018 consolidated financial statements.
Schedule II Valuation and Qualifying Accounts for the three fiscal years ended September 30, 2018.
All other schedules are omitted because the required matter or conditions are not present or because the information required by the Schedules is submitted as part of the consolidated financial statements and notes thereto.
(3) Exhibits - the exhibits filed as a part of this Annual Report on Form 10-K are listed in the Exhibit Index below.
EXHIBIT INDEX
Exhibit No. | Exhibit | |
103
101.INS | XBRL Instance Document | |
101.SCH | XBRL Taxonomy Extension Schema Document | |
101.CAL | XBRL Taxonomy Extension Calculation Linkbase Document | |
101.LAB | XBRL Taxonomy Extension Label Linkbase Document | |
101.PRE | XBRL Taxonomy Extension Presentation Linkbase Document | |
101.DEF | XBRL Taxonomy Extension Definition Linkbase Document | |
*Filed herewith.
†Furnished herewith.
#Management contract or compensatory plan or arrangement.
Item 16. Form 10-K Summary
None
104
SIGNATURES
Pursuant to the requirements of Section 13 or 15(d) of the Securities Exchange Act of 1934, the registrant has duly caused this report to be signed on its behalf by the undersigned, thereunto duly authorized.
VERSUM MATERIALS, INC. | |||
By: | /s/ Guillermo Novo | ||
Guillermo Novo | |||
President and Chief Executive Officer | |||
Date: | November 21, 2018 | ||
Pursuant to the requirements of the Securities Exchange Act of 1934, this Annual Report has been signed below by the following persons on behalf of the Registrant and in the capacities and on the dates indicated:
Name | Title | Date | ||
/s/ Seifi Ghasemi | Chairman of the Board of Directors | November 21, 2018 | ||
Seifi Ghasemi | ||||
/s/ Guillermo Novo | President and Chief Executive Officer and Director | November 21, 2018 | ||
Guillermo Novo | (Principal Executive Officer) | |||
/s/ George G. Bitto | Executive Vice President and Chief Financial Officer | November 21, 2018 | ||
George G. Bitto | (Principal Financial Officer) | |||
/s/ Jessica Feather-Bowman | Vice President, Controller and Principal Accounting Officer | November 21, 2018 | ||
Jessica Feather-Bowman | (Principal Accounting Officer) | |||
/s/ Jacques Croisetière | Director | November 21, 2018 | ||
Jacques Croisetière | ||||
/s/ Yi Hyon Paik | Director | November 21, 2018 | ||
Yi Hyon Paik | ||||
/s/ Thomas J. Riordan | Director | November 21, 2018 | ||
Thomas J. Riordan | ||||
/s/ Susan C. Schnabel | Director | November 21, 2018 | ||
Susan C. Schnabel | ||||
/s/ Alejandro D. Wolff | Director | November 21, 2018 | ||
Alejandro D. Wolff | ||||
105