Attached files
| file | filename |
|---|---|
| EX-32.1 - EXHIBIT 32.1 - Dolby Laboratories, Inc. | exhibit321-fy18q4.htm |
| EX-31.2 - EXHIBIT 31.2 - Dolby Laboratories, Inc. | exhibit312-fy18q4.htm |
| EX-31.1 - EXHIBIT 31.1 - Dolby Laboratories, Inc. | exhibit311-fy18q4.htm |
| EX-23.1 - EXHIBIT 23.1 - Dolby Laboratories, Inc. | exhibit231-fy18q4.htm |
| EX-21.1 - EXHIBIT 21.1 - Dolby Laboratories, Inc. | exhibit211-fy18q4.htm |
UNITED STATES
SECURITIES AND EXCHANGE COMMISSION
Washington, D.C. 20549
FORM 10-K
ý | ANNUAL REPORT PURSUANT TO SECTION 13 OR 15(d) OF THE SECURITIES EXCHANGE ACT OF 1934 |
For the Fiscal Year Ended September 28, 2018
OR
¨ | TRANSITION REPORT PURSUANT TO SECTION 13 OR 15(d) OF THE SECURITIES EXCHANGE ACT OF 1934 |
For the Transition Period From To
Commission File Number: 001-32431

DOLBY LABORATORIES, INC.
(Exact name of registrant as specified in its charter)
Delaware | 90-0199783 | |
(State or other jurisdiction of incorporation or organization) | (I.R.S. Employer Identification No.) | |
1275 Market Street San Francisco, CA | 94103-1410 | (415) 558-0200 |
(Address of principal executive offices) | (Zip Code) | (Registrant’s telephone number, including area code) |
Securities registered pursuant to Section 12(b) of the Act: | |
Class A common stock, $0.001 par value | The New York Stock Exchange |
(Title of class) | (Name of each exchange on which registered) |
Securities registered pursuant to Section 12(g) of the Act: | |
Class B common stock, $0.001 par value | |
(Title of class) | |
Indicate by check mark if the registrant is a well-known seasoned issuer, as defined in Rule 405 of the Securities Act. Yes ý No ¨
Indicate by check mark if the registrant is not required to file reports pursuant to Section 13 or Section 15(d) of the Act. Yes ¨ No ý
Indicate by check mark whether the registrant (1) has filed all reports required to be filed by Section 13 or 15(d) of the Securities Exchange Act of 1934 during the preceding 12 months (or for such shorter period that the registrant was required to file such reports), and (2) has been subject to such filing requirements for the past 90 days. Yes ý No ¨
Indicate by check mark whether the registrant has submitted electronically every Interactive Data File required to be submitted pursuant to Rule 405 of Regulation S-T (Section 232.405 of this chapter) during the preceding 12 months (or for such shorter period that the registrant was required to submit such files). Yes ý No ¨
Indicate by check mark if disclosure of delinquent filers pursuant to Item 405 of Regulation S-K (Section 229.405 of this chapter) is not contained herein, and will not be contained, to the best of registrant’s knowledge, in definitive proxy or information statements incorporated by reference in Part III of this Form 10-K or any amendment to this Form 10-K. ¨
Indicate by a check mark whether the registrant is a large accelerated filer, an accelerated filer, a non-accelerated filer, smaller reporting company, or an emerging growth company. See definition of “large accelerated filer”, “accelerated filer”, “smaller reporting company”, and "emerging growth company" in Rule 12b-2 of the Exchange Act.
Large accelerated filer ý | Accelerated filer ¨ | |
Non-accelerated filer ¨ | Smaller reporting company ¨ | |
Emerging growth company ¨ | ||
If an emerging growth company, indicate by check mark if the registrant has elected not to use the extended transition period for complying with any new or revised financial accounting standards provided pursuant to Section 13(a) of the Exchange Act. ¨ | ||
Indicate by check mark whether the registrant is a shell company (as defined in Rule 12b-2 of the Exchange Act). Yes ¨ No ý
The aggregate market value of the voting common equity held by non-affiliates of the registrant as of March 30, 2018 was $3.4 billion. This calculation excludes the shares of Class A and Class B common stock held by executive officers, directors and stockholders whose ownership exceeds 5% of the combined shares of Class A and Class B common stock outstanding at March 30, 2018. This calculation does not reflect a determination that such persons are affiliates for any other purposes. On October 26, 2018, the registrant had 64,002,056 shares of Class A common stock, par value $0.001 per share, and 39,261,035 shares of Class B common stock, par value $0.001 per share, outstanding.
DOCUMENTS INCORPORATED BY REFERENCE
Portions of the registrant’s Definitive Proxy Statement to be filed with the Commission pursuant to Regulation 14A in connection with the registrant’s 2019 Annual Meeting of Stockholders, to be filed subsequent to the date hereof, are incorporated by reference into Part III of this Report. Such Definitive Proxy Statement will be filed with the Securities and Exchange Commission not later than 120 days after the conclusion of the registrant’s fiscal year ended September 28, 2018. Except with respect to information specifically incorporated by reference in this Form 10-K, the Definitive Proxy Statement is not deemed to be filed as part of this Form 10-K.
DOLBY LABORATORIES, INC.
FORM 10-K
TABLE OF CONTENTS
PART I | |||
Item 1 | — | ||
Item 1A | — | ||
Item 1B | — | ||
Item 2 | — | ||
Item 3 | — | ||
Item 4 | — | ||
PART II | |||
Item 5 | — | ||
Item 6 | — | ||
Item 7 | — | ||
Item 7A | — | ||
Item 8 | — | Consolidated Financial Statements | |
Item 9 | — | ||
Item 9A | — | ||
Item 9B | — | ||
PART III | |||
Item 10 | — | ||
Item 11 | — | ||
Item 12 | — | ||
Item 13 | — | ||
Item 14 | — | ||
PART IV | |||
Item 15 | — | ||
1
GLOSSARY OF TERMS
The following table summarizes certain terms and abbreviations that may be used within the text of this report:
Abbreviation | Term | |
AAC | Advanced Audio Coding | |
AFS | Available-For-Sale (Securities) | |
AOCI | Accumulated Other Comprehensive Income | |
APIC | Additional-Paid In-Capital | |
ASC | Accounting Standards Codification | |
ASP | Average Selling Price | |
ASU | Accounting Standards Update | |
ATSC | Advanced Television Systems Committee | |
AVC | Advanced Video Coding | |
AVR | Audio/Video Receiver | |
CE | Consumer Electronics | |
CES | Consumer Electronics Show | |
CODM | Chief Operating Decision Maker | |
COGS | Cost Of Goods Sold | |
COSO | Committee Of Sponsoring Organizations (Of The Treadway Commission) | |
DD | Dolby Digital® | |
DD+ | Dolby Digital Plus™ | |
DMA | Digital Media Adapter | |
DTV | Digital Television | |
DVB | Digital Video Broadcasting | |
DVD | Digital Versatile Disc | |
EPS | Earnings Per Share | |
ESP | Estimated Selling Price | |
ESPP | Employee Stock Purchase Plan | |
FASB | Financial Accounting Standards Board | |
FCPA | Foreign Corrupt Practices Act | |
FIFO | First-in, First-out | |
G&A | General & Administrative | |
HD | High Definition | |
HDR | High-Dynamic Range | |
HDTV | High Definition Television | |
HE-AAC | High Efficiency Advanced Audio Coding | |
HEVC | High Efficiency Video Coding | |
HFR | High Frame Rate | |
HTIB | Home Theater In-A-Box | |
IC | Integrated Circuit | |
IMB | Integrated Media Block | |
IP | Intellectual Property | |
IPO | Initial Public Offering | |
IPTV | Internet Protocol Television | |
IT | Information Technology | |
LIFO | Last-in, First-out | |
LP | Limited Partner/Partnership | |
ME | Multiple Element | |
NOL | Net Operating Loss | |
OCI | Other Comprehensive Income | |
ODD | Optical Disc Drive | |
OECD | Organization For Economic Co-Operation & Development | |
OEM | Original Equipment Manufacturer | |
OLED | Organic Light-Emitting Diode | |
OTT | Over-The-Top | |
PC | Personal Computer | |
PCS | Post-Contract Support | |
PP&E | Property, Plant, & Equipment | |
PSO | Performance-Based Stock Option | |
R&D | Research & Development | |
RSU | Restricted Stock Unit | |
S&M | Sales & Marketing | |
SERP | Supplemental Executive Retirement Plan | |
SoC | System(s)-On-A-Chip | |
STB | Set-Top Box | |
TPE | Third Party Evidence | |
TSR | Total Stockholder Return | |
UHD | Ultra High Definition | |
U.S. GAAP | Generally Accepted Accounting Principles In The United States | |
VSOE | Vendor Specific Objective Evidence | |
2
Forward Looking Statements
This Annual Report on Form 10-K contains forward-looking statements including, but not limited to statements regarding: operating results and underlying measures; demand and acceptance for our technologies and products; market growth opportunities and trends; our plans, strategies, and expected opportunities; future competition; our stock repurchase program; and our dividend policy. Use of words such as “may,” “will,” “should,” “expect,” “plan,” “anticipate,” “believe,” “estimate,” “predict,” “potential,” “continue,” or similar expressions indicates a forward-looking statement. Such forward-looking statements are based on management’s reasonable and current assumptions and expectations. Actual results may differ materially from those discussed in these forward-looking statements due to a number of factors, including the risks set forth in Item 1A, “Risk Factors.” Although we believe that the expectations reflected in the forward-looking statements are reasonable, we cannot guarantee future results, levels of activity, performance, or achievements. We disclaim any duty to update any of the forward-looking statements to conform our prior statements to actual results.
3
PART I
ITEM 1. BUSINESS
OVERVIEW
Dolby Laboratories creates audio and imaging technologies that transform entertainment and communications at the cinema, at home, at work, and on mobile devices. Founded in 1965, our strengths stem from expertise in analog and digital signal processing and digital compression technologies that have transformed the ability of artists to convey entertainment experiences to their audiences through recorded media. Such technologies led to the development of our noise-reduction systems for analog tape recordings, and have since evolved into multiple offerings that enable more immersive sound for cinema, digital television transmissions and devices, OTT video services, DVD and Blu-ray Discs, gaming consoles, and mobile devices. Today, we derive the majority of our revenue from licensing our audio technologies. We also derive revenue from licensing our consumer imaging and communication technologies, as well as audio and imaging technologies for premium cinema offerings in collaboration with exhibitors. Finally, we provide products and services for a variety of applications in the cinema, broadcast, and communications markets.
OUR STRATEGY
Key elements of our strategy include:
Advancing the Science of Sight and Sound. We apply our understanding of the human senses, audio, and imaging engineering to develop technologies aimed at improving how people experience and interact with their entertainment and communications content.
Providing Creative Solutions. We promote the use of our solutions as creative tools, and provide our products, services, and technologies to filmmakers, sound mixers, and other content creators and providers. Our tools help showcase the quality and impact of their efforts and intent, which in turn may generate market demand.
Delivering Superior Experiences. Our technologies and solutions optimize playback and communications so that users may enjoy richer, clearer, and more immersive sound and sight experiences.
REVENUE GENERATION
The following table presents a summary of the composition of our revenue for all periods presented:
Fiscal Year Ended | |||
Revenue | September 28, 2018 | September 29, 2017 | September 30, 2016 |
Licensing | 90% | 89% | 89% |
Products | 8% | 9% | 9% |
Services | 2% | 2% | 2% |
Total | 100% | 100% | 100% |
We license our technologies in approximately 50 countries, and our licensees distribute products that incorporate our technologies throughout the world. As shown in the table below, we generate the majority of our revenue from outside the United States. Geographic data for our licensing revenue is based on the location of our licensees’ headquarters, products revenue is based on the destination to which we ship our products, and services revenue is based on the location where services are performed.
Fiscal Year Ended | |||
Revenue By Geographic Location | September 28, 2018 | September 29, 2017 | September 30, 2016 |
United States | 33% | 35% | 31% |
International | 67% | 65% | 69% |
We generate revenue from licensing arrangements with over 500 electronics product OEM and software developer licensees.
4
Licensing
We license our technologies to a range of customers who incorporate them into their products for enhanced audio and imaging functionality whether it be at home, at work, on mobile devices, or at the cinema. Our key technologies are as follows:
Technology | Description |
AAC & HE-AAC | An advanced digital audio codec solution with higher bandwidth efficiency used for a wide range of media applications such as TVs, STBs, PCs, gaming consoles, mobile devices, and digital radio. |
AVC | A digital video codec with high bandwidth efficiency used in a wide range of media devices, such as TVs, STBs, PCs, gaming consoles, and mobile devices. |
Dolby® AC-4 | A next-generation digital audio coding technology that increases transmission efficiency while delivering new audio experiences, including Dolby Atmos, to a wide range of playback devices, including TVs, STBs, and mobile devices. |
Dolby Atmos® | An object-oriented audio technology for home theaters, cinema, device speakers, mobile devices, and headphones that allows sound to be precisely placed and moved anywhere in the listening environment including the overhead dimension. Dolby Atmos is an immersive experience that can be provided via multiple Dolby audio coding technologies. |
Dolby Digital® | A digital audio coding technology that provides multichannel sound to applications such as DVD players, TVs, and STBs. |
Dolby Digital Plus™ | An advanced digital audio coding technology that offers more efficient audio transmission for a wide range of media applications such as TVs, STBs, Blu-ray Discs, PCs, and mobile devices. |
Dolby® TrueHD | A digital audio coding technology providing lossless encoding for premium quality media applications such as Blu-ray Discs and home theaters. |
Dolby Vision™ | An imaging technology combining high dynamic range and dynamic metadata to deliver higher color contrast, brighter highlights, and improved details for cinema and a wide range of media devices, including TVs, mobile devices, gaming consoles, and STBs. |
Dolby Voice® | An audio conferencing technology with superior spatial perception, voice clarity, and background noise reduction that emulates the in-person meeting experience. |
HEVC | A next-generation digital video codec with high bandwidth efficiency to support ultra-high definition experiences for a wide range of media devices. |
The following table presents the composition of our licensing business and revenues for all periods presented:
Fiscal Year Ended | ||||
Market | September 28, 2018 | September 29, 2017 | September 30, 2016 | Main Offerings Incorporating Our Technologies |
Broadcast | 39% | 43% | 46% | STBs & Televisions |
Mobile | 20% | 13% | 12% | Smartphones & Tablets |
CE | 14% | 13% | 13% | DMAs, Blu-ray Disc devices, AVRs, Soundbars, DVDs, & HTIBs |
PC | 12% | 15% | 16% | Windows and macOS operating systems |
Other | 15% | 16% | 13% | Gaming consoles, Auto DVD, Dolby Cinema, Dolby Voice |
Total | 100% | 100% | 100% | |
We have various licensing models: a two-tier model, an integrated licensing model, a patent licensing model, and collaboration arrangements.
Two-Tier Licensing Model. Most of our branded technology licensing business consists of a two-tier licensing model whereby our decoding technologies, included in reference software and firmware code, are first provided under license to semiconductor manufacturers whom we refer to as “implementation licensees.” Implementation licensees incorporate our technologies in ICs which they sell to OEMs of various electronic products, whom we refer to as “system licensees.” System licensees separately obtain licenses from us that allow them to make and sell end-user products using ICs that incorporate our technologies.
Implementation licensees pay us a one-time, up-front fee per license. In exchange, the licensee receives a licensing package which includes information that is useful in implementing our technologies into their chipsets. Once implemented, the licensee sends us a sample chipset for quality control evaluation, and following our validation of the design, the licensee is permitted during the term of the agreement to sell the chipset for use solely to our network of system licensees.
System licensees provide us with prototypes of products, or self-test results of products that incorporate our technologies. Upon our confirmation that our technologies are optimally and consistently incorporated, the system licensee may buy ICs under a license for the same Dolby technology from our network of implementation licensees, and may further sell approved products to retailers, distributors, and consumers. For the use of our technologies, our system licensees pay an initial licensing fee as well as royalties, which represent the majority of the revenue recognized from these arrangements. The amount of royalties we collect on a particular product depends on several
5
factors including the nature of the implementations, the mix of Dolby technologies used, and the volume of products using our technologies that are shipped by the system licensee.
Integrated Licensing Model. We also license our technologies to software operating system vendors and to certain other OEMs that act as combined implementation and system licensees. These licensees incorporate our technologies in their software used on PCs, in mobile applications, or in ICs they manufacture and incorporate into their products. As with the two-tier licensing model, the combined implementation and system licensee pays us an initial licensing fee in addition to royalties as determined by the mix of Dolby technologies used, the nature of the implementations, and the volume of products using our technologies that are shipped, and is subject to the same quality control evaluation process.
Patent Licensing Model. We license our patents through patent pools which are arrangements between multiple patent owners to jointly offer and license pooled patents to licensees. We also license our patents directly to manufacturers that use our IP in their products. Finally, we generate service fees for managing patent pools on behalf of third party patent owners through our wholly-owned subsidiary, Via Licensing Corporation. By aggregating and offering pooled IP, patent pools deliver efficiencies that reduce transactional costs for both IP owners and licensees. The Via Licensing patent pools enable product manufacturers to efficiently and transparently secure patent licenses for audio coding, interactive television, digital radio, and wireless technologies. We offer our AAC, AVC, HE-AAC, HEVC, and other IP through patent licensing. Currently, most of our revenue earned from patent licensing relates to the licensing of AAC and HE-AAC technologies.
Collaboration Arrangements.
Dolby Cinema: We partner with exhibitors to deliver a premium cinema offering with Dolby Vision and Dolby Atmos at new and pre-existing venues. We receive a portion of box-office receipts from the installed theaters.
Dolby Voice: We enter into arrangements with audio and video conferencing providers where, in return for licensing our IP and know-how, we earn revenue based on access to our technology and services. In addition, we sell hardware that facilitates the Dolby conferencing experience, including the Dolby Conference Phone for audio use only, and the Dolby Voice Room, our integrated solution that provides a video camera and a control hub integrated with the Dolby Conference Phone.
Settlements & Back Payments From Licensees. Licensing revenue recognized in any given quarter may include back payments and/or settlements with licensees. Within the Results of Operations section of Item 7 "Management’s Discussion and Analysis of Financial Condition and Results of Operations," settlements and back payments are collectively referred to as "recoveries." Such recoveries have become a recurring element of our business and are particularly subject to fluctuation and unpredictability.
Products
We design and manufacture audio and imaging products for the cinema, television, broadcast, and entertainment industries. Distributed in over 90 countries, these products are used in content creation, distribution, and playback to enhance image and sound quality, and improve transmission and playback. We also market and sell products, as discussed above, which help improve the conference call experience when using Dolby Voice.
Products revenue is derived primarily from sales of the following:
Product | Description | |
Cinema | Cinema Imaging Products | Digital Cinema Servers used to load, store, decrypt, decode, watermark, and playback digital film files for presentation on digital cinema projectors and software used to encrypt, encode, and package digital media files for distribution. |
Cinema Audio Products | Cinema Processors, amplifiers, and loudspeakers used to decode, render, and optimally playback digital cinema soundtracks including those using Dolby Atmos. | |
Other | Dolby Conference Phone | An integral hardware component of the Dolby Voice conferencing solution that enhances full-room voice capture, spatial voice separation, and playback. |
Dolby Voice Room | Video conferencing solution for huddle rooms and small conference rooms that combines a camera product with the Dolby Conference Phone. | |
Other Products | 3-D glasses and kits, broadcast hardware and software used to encode, transmit, and decode multiple channels of high quality audio for DTV and HDTV distribution, monitors, and accessibility solutions for hearing and visually impaired consumers. | |
6
Services
We offer various services to support theatrical and television production for cinema exhibition, broadcast, and home entertainment, including equipment training and maintenance, mixing room alignment, equalization, as well as audio, color, and light image calibration. We also provide PCS for products sold and equipment installed at Dolby Cinema theaters operated by exhibitor partners and support the implementation of our technologies into products manufactured by our licensees.
INTELLECTUAL PROPERTY
We have a substantial base of IP assets, including patents, trademarks, copyrights, and trade secrets developed based on our technical expertise.
As of September 28, 2018, we had approximately 9,300 issued patents and approximately 4,100 pending patent applications in more than 100 jurisdictions throughout the world. Our currently issued patents expire at various times through February 2043.
Some of our patents relating to DD technologies have expired, and others will expire over the next several years. While in the past we derived a significant portion of our licensing revenue from our DD technologies, this is no longer the case as revenues attributed to DD technologies have declined and are expected to continue to decline. The primary products where DD is widely used include DVD players (but not Blu-ray players), TVs, and STBs. We have transitioned a number of our DD licensees to DD+ technologies, an extension of our DD technologies, whose patents generally expire later than the DD patents. We are continuing to make progress in transitioning other DD licensees to DD+.
We pursue a general practice of filing patent applications for our technologies in the U.S. and foreign countries where our customers manufacture, distribute, or sell licensed products. We actively pursue new applications to expand our patent portfolio to address new technological innovations, and we also make strategic acquisitions of technology and patents from time to time. We have multiple patents covering aspects and improvements for many of our technologies.
We have approximately 1,000 trademark registrations throughout the world for a variety of wordmarks, logos, and slogans. Our trademarks cover our various products, technologies, improvements, and features, as well as the services that we provide. These trademarks are an integral part of our technology licensing program, and licensees typically elect to place our trademarks on their products to inform consumers that their products incorporate our technology and meet our quality specifications.
We protect our IP rights both domestically and internationally. From time to time, OEMs have failed to report or have underreported shipments of their products that incorporate our technologies. We have also had problems with implementation licensees selling ICs with our technologies to third parties that are not system licensees. We anticipate that such problems will continue to occur. Accordingly, we have taken steps in the past to enforce our IP rights and expect to continue to do so in the future.
Moreover, in certain countries, we have relatively few or no issued patents. For example, in China, Taiwan, and India, we have only limited patent protection for our Dolby technologies. Consequently, we may realize less revenue from those regions in the future. Maintaining or growing our licensing revenue in developing countries such as China, Taiwan, and India will depend in part on our ability to obtain patent rights in these countries, which is uncertain. Further, because of the limitations of the legal systems in many countries, the effectiveness of patents obtained or that may in the future be obtained is uncertain.
INDUSTRY STANDARDS
Several Dolby technologies have been adopted as the explicit or de facto industry standard for broadcast, discrete media, and online delivery in various markets worldwide.
Explicit industry standards are adopted through a standardization process whereby government entities, industry standards-setting bodies, trade associations, and others evaluate and then prescribe the use of a technology. For example, as global broadcast standards for digital, HD, and UHD television have developed, Dolby audio technologies have been adopted or mandated in various regions of the world, highlights of which are as follows:
• | DD+ and HE-AAC are mandated for use in terrestrial broadcast across many countries including France, Italy, the United Kingdom, Sweden, Germany, Poland, Turkey, and Russia. In addition, DD+ and HE-AAC are included in the digital terrestrial television specifications of emerging digital TV markets in |
7
Africa, South-East Asia, and India while operators in China have selected DD and DD+ as optional technologies for transmissions using the country’s digital terrestrial television specification. In mobile devices, HE-AAC is specified for various applications in the 3GPP suite of standards, and is a de facto audio standard in entertainment services.
• | DD+ is the de facto technology used by a wide range of pay-TV operators and streaming services worldwide and is included in popular operating systems such as iOS and Windows. It is also widely used by major OTT services such as Netflix, iTunes, and Amazon, and is included in the specifications of these services. |
• | DD is mandated for HD broadcast in multiple regions including North America and South Korea, and for DVD players on a global basis. |
• | AC-4 is Dolby’s next generation of audio coding technology that has been adopted for implementation in certain regions by worldwide standards organizations including the DVB and ATSC. AC-4 has also been adopted or proposed in forthcoming regional and country standards. AC-4 is already being supported in a number of TVs that are available worldwide from major manufacturers. |
In addition, Dolby technologies have become de facto industry standards in many consumer entertainment products. De facto industry standards are adopted by industry participants when technologies are introduced to the marketplace and become widely used. For example, prior to the adoption of HD terrestrial broadcast standards mandating Dolby technologies, many European HD broadcasters began broadcasting in DD or DD+, leading OEMs to include these technologies in their televisions and STBs for the European market.
RESEARCH AND DEVELOPMENT
We conduct R&D activities at numerous locations both in the U.S. and internationally. Dolby’s history of producing innovative technology has created many forms of IP. This IP generates licensing revenue that enables us to fund and pursue further innovation.
For much of the Company's history, we focused the majority of our R&D resources on developing leading audio technologies for consumer entertainment that today comprises most of our revenue. In recent years, we have expanded our efforts to identify and develop new technologies to include audio conferencing and imaging technologies. Each of these technologies can support many offerings, and we anticipate bringing new innovations to market in the future.
R&D expenses included in our consolidated statements of operations were as follows (in thousands):
Fiscal Year Ended | |||||||||
September 28, 2018 | September 29, 2017 | September 30, 2016 | |||||||
Research & Development | $ | 236,794 | $ | 233,312 | $ | 219,607 | |||
PRODUCT MANUFACTURING
Our product quality is enabled through the use of well-established, and in some cases, highly automated, assembly processes along with rigorous testing of our products. Although we have some manufacturing facilities, we rely primarily upon contract manufacturers for the majority of our production capacity. We purchase components and fabricated parts from multiple suppliers; however, we rely on sole source suppliers for certain components used to manufacture our products. We source components and fabricated parts both locally and globally.
SALES AND MARKETING
Our marketing efforts focus on demonstrating how our solutions improve entertainment and communications experiences. We sell our solutions primarily using an internal sales organization to various customers in the markets where we operate. We promote our solutions and our brand through industry events such as trade-shows, film festivals, movie premieres, product launches, as well as through our website, public relations, direct marketing, co-marketing programs, and social media. In addition, we hold the naming rights to the Dolby Theatre, home to the Academy Awards® in Hollywood, California, where we showcase our technology and host high-profile events.
8
We maintain more than 20 sales offices in key regions around the globe. S&M expenses included in our consolidated statements of operations were as follows (in thousands):
Fiscal Year Ended | |||||||||
September 28, 2018 | September 29, 2017 | September 30, 2016 | |||||||
Sales & Marketing | $ | 309,802 | $ | 296,661 | $ | 295,267 | |||
CUSTOMERS
We license our technologies to a broad set of customers that operate in a wide range of industries, and we sell our professional products either directly to the end user or, more commonly, through dealers and distributors. Users of our professional products and services include film studios, content creators, post-production facilities, cinema operators, broadcasters, and video game designers.
In fiscal 2018, 2017, and 2016, we did not have any individual customers whose revenue exceeded 10% of our total revenue.
COMPETITION
The entertainment and communications industries are highly competitive, and we face aggressive competition in all areas of our business. Some of our current and future competitors may have significantly greater financial, technical, marketing, and other resources than we do, or may have more experience or advantages in the markets in which they compete. For example, some of our current or potential competitors may have an advantage over us based on greater experience in certain technology markets. In addition, some of our current or potential competitors may be able to offer integrated systems in certain markets for entertainment technologies, including audio, imaging, and digital rights management technologies, which could make competing technologies that we develop or acquire obsolete. By offering an integrated system solution, these potential competitors may also be able to offer competing technologies at lower prices than we can, which could adversely affect our operating results.
Many products that include our audio and imaging technologies also include technologies developed by our competitors. We believe that the principal competitive factors in our markets include some or all of the following:
• | Degree of access and inclusion in industry standards; |
• | Technological performance, flexibility, and range of application; |
• | Brand recognition and reputation; |
• | Timeliness and relevance of new product introductions; |
• | Quality and reliability of products and services; |
• | Relationships with producers, directors, and distributors in the film industry, with television broadcast industry leaders, with OTT industry leaders, and with the management of semiconductor and consumer electronics OEMs; |
• | Availability of compatible high quality audio and video content; and |
• | Price. |
Certain foreign governments, particularly in China, have advanced arguments under their competition laws that exert downward pressure on royalties for IP, which can result in a competitive disadvantage. The regulatory enforcement activities in such jurisdictions can be unpredictable, in some cases because these jurisdictions have only recently implemented competition laws.
Our technologies, products, and services span the audio and imaging sectors of several distinct and diverse industries, including the broadcasting, personal computer, mobile, consumer entertainment, gaming, cinema, and communications industries. The lack of a clear definition of the markets in which our products, services, and technologies are sold or licensed, the nature of our technologies, their potential use for various commercial applications, and the diverse nature of and lack of detailed reporting by our competitors, make it impracticable to quantify our position.
9
EMPLOYEES
As of September 28, 2018, we had 2,151 employees worldwide, of which 892 employees were based outside of the U.S. None of our employees are subject to a collective bargaining agreement.
CORPORATE AND AVAILABLE INFORMATION
We were founded in London, England in 1965 and incorporated in the State of New York in 1967. We reincorporated in California in 1976 and reincorporated in Delaware in September 2004. Our principal corporate offices are located at 1275 Market Street, San Francisco, California 94103. Our telephone number is (415) 558-0200.
Our Internet address is www.dolby.com. We make available on our website, free of charge, our Annual Report on Form 10-K, Quarterly Reports on Form 10-Q, Current Reports on Form 8-K, and any amendments to those reports, as soon as reasonably practicable after we electronically file such material with, or furnish it to, the SEC. Our SEC reports can be accessed through the Investor Relations section of our Internet website. The information found on our Internet website is not part of this or any other report we file with or furnish to the SEC. The SEC also maintains a website that contains our SEC filings at www.sec.gov.
10
ITEM 1A. RISK FACTORS
The following risk factors and other information included in this Annual Report on Form 10-K should be carefully considered. The risks and uncertainties described below are not the only ones we face. Additional risks and uncertainties not currently known to us or that we currently deem less significant may also affect our business operations or financial results. If any of the following risks actually occur, our business, operating results and financial condition could be materially adversely affected.
REVENUE GENERATION
Markets We Target
Dependence on Sales by Licensees. Our licensing businesses depend on OEMs and other licensees to incorporate our technologies into their products. Our license agreements generally do not have minimum purchase commitments, are typically non-exclusive, and frequently do not require incorporation or use of our technologies. Our revenue will decline if our licensees choose not to incorporate our technologies into their products or if they sell fewer products incorporating our technologies.
Trends in Optical Disc Media. For many years, movies have been distributed, purchased, and consumed through optical disc media, such as DVD and Blu-ray Disc. However, the rapid advancement of online and mobile content delivery has resulted in a trend toward movie downloading and streaming services. We expect the shift away from optical disc media to online media content consumption to continue, resulting in decreased revenue from DVD and Blu-ray Disc players.
Additionally, the number of PCs that include optical disc drives has decreased significantly in recent years. Because PC OEMs are required to pay us a higher per-unit royalty for Windows PCs that include optical disc playback functionality than Windows PCs that do not include such functionality, the continued decreasing inclusion of optical disc drives in PCs will result in lower per-unit royalties. Revenue from our PC market depends on several factors, including underlying PC unit shipment growth, the extent to which our technologies are included on computers, through operating systems or otherwise, and the terms of any royalties or other payments we receive.
Mobile Industry Risks. Successful penetration of the mobile device market is important to our future growth. The mobile device market, particularly smartphones and tablets, is characterized by rapidly changing market conditions, frequent product introductions and intense competition based on features and price. Our technologies are not mandated as an industry standard for mobile devices. We must continually convince mobile device OEMs and end users of mobile devices of the value of our technologies. With shorter product lifecycles, it is easier for mobile device OEMs to add or remove our technologies from mobile devices than it is for TV OEMs and other hardware OEMs.
In order to increase the value of our technologies in the mobile market, we have worked with online and mobile media content service providers to encode their content with our technologies, which could affect OEM and software vendor demand for our decoding technologies. However, the online and mobile media content services markets are also characterized by intense competition, evolving industry standards and business and distribution models, disruptive software and hardware technology developments, frequent product and service introductions and short life cycles, and price sensitivity on the part of consumers, all of which may result in downward pressure on pricing or the removal of our technologies by these providers.
Cinema Industry Risks. Revenue from Dolby Cinema and cinema product sales is subject to the pace of construction or upgrade of screens, the advent of new or competing technologies, the willingness of movie studios to produce films in our Dolby Atmos and Dolby Vision formats, consumer trends, box-office performance generally, and other events or conditions in the cinema industry. Although we have invested, and expect to continue to invest, a substantial amount of time and resources developing Dolby Cinema and building our partnerships in connection with the launch of Dolby Cinema locations, this is a relatively new market for us and we may not recognize a meaningful amount of revenue from these efforts in the near future, or at all, if new Dolby Cinema locations are not ultimately successful, or if there is a decrease in the performance of our existing locations. Additionally, we have collaborations with multiple exhibitors in foreign markets, including China and the Middle East, and we may face a number of risks in expanding Dolby Cinema in these and other new international markets. The revenue we receive from Dolby Cinema exhibitors are based on a portion of box-office receipts from the installed theaters, and the timing of such theater installations is dependent upon a number of factors beyond our control. In addition, the success of our Dolby Cinema offering will be tied to the pipeline and success of motion pictures available at Dolby Cinema locations generally. The success of Dolby Cinema depends in large part on our ability to differentiate our offering, deploy new sites in
11
accordance with plans, provide a compelling experience, and attract and retain a viewing audience. In addition, a decrease in our ability to develop and introduce new cinema products and services successfully could affect licensing of our consumer technologies, because the strength of our brand and our ability to use professional product developments to introduce new consumer technologies would be negatively impacted.
Our revenue and associated demand from cinema product sales is dependent upon industry and economic cycles, along with our ability to develop and introduce new technologies, further our relationships with content creators, and promote new cinematic audio and imaging experiences. A significant portion of our growth opportunity lies in the China market, which is subject to economic risks as well as geo-political risks. Furthermore, future growth of our cinema products business also depends upon new theater construction and entering into an equipment replacement cycle whereby previously purchased cinema products are upgraded or replaced. To the extent that we do not make progress in these areas, or are faced with pricing pressures, competing technologies, or other global macroeconomic challenges our revenue may be adversely impacted.
Customers and Distributors
Loss of Key Licensee or Customer. A small number of our licensees or customers may represent a significant percentage of our licensing, products, or services revenue. Although we generally have agreements with these licensees or customers, these agreements typically do not require any minimum purchases or minimum royalty fees and do not prohibit licensees from using competing technologies or customers from purchasing products and services from competitors. Customer demand for our technologies and products can shift quickly as many of our markets are rapidly evolving. As a result of our increased presence across consumer electronic device markets where our technologies are not mandated and are subject to significant competition, the risk that a large licensee may reduce or eliminate its use of our technologies has increased.
Reliance on Semiconductor Manufacturers. Our licensing revenue from system licensees depends in large part upon the availability of ICs that implement our technologies. IC manufacturers incorporate our technologies into these ICs, which are then incorporated in consumer entertainment products. We do not manufacture these ICs, but rather depend on IC manufacturers to develop, produce, and then sell them to system licensees in accordance with their agreements. We do not control the IC manufacturers’ decisions on whether or not to incorporate our technologies into their ICs, and we do not control their product development or commercialization efforts.
Consumer Spending Weakness. Weakness in general economic conditions may suppress consumer demand in our markets. Many of the products in which our technologies are incorporated are discretionary goods, such as PCs, TVs, STBs, Blu-ray Disc players, video game consoles, AVRs, mobile devices, in-car entertainment systems, and home-theater systems. Weakness in general economic conditions may also lead to licensees and customers becoming delinquent on their obligations to us or being unable to pay, resulting in a higher level of write-offs. Economic conditions may increase underreporting and non-reporting of royalty-bearing revenue by our licensees as well as increase the unauthorized use of our technologies.
Reliance on Distributors. We rely significantly on a global network of independent, regional distributors to market and distribute our cinema and broadcast products. Our distributor arrangements are non-exclusive and our distributors are not obligated to buy our products and can represent competing products, and they may be unwilling or unable to dedicate the resources necessary to promote our portfolio of products. Our distributors could retain product channel inventory levels that exceed future anticipated sales, which could affect our future sales to those distributors. In addition, failure of our distributors to adhere to our policies designed to promote compliance with global anticorruption laws, export controls, and local laws, could subject us to criminal or civil penalties and stockholder litigation.
12
Marketing and Branding
Importance of Brand Strength. Maintaining and strengthening the Dolby brand is critical to maintaining and expanding our licensing, products, and services business, as well as our ability to offer technologies for new markets, including Dolby Voice for the communications market, Dolby Cinema, Dolby Vision and other imaging offerings for the consumer market, and others. Our continued success depends on our reputation for providing high quality technologies, products, and services across a wide range of entertainment markets, including the consumer entertainment, PC, broadcast, and gaming markets. If we fail to promote and maintain the Dolby brand successfully in licensing, products or services, our business will suffer. Furthermore, we believe that the strength of our brand may affect the likelihood that our technologies are adopted as industry standards in various markets and for various applications. Our ability to maintain and strengthen our brand will depend heavily on our ability to develop innovative technologies for the entertainment industry, to enter into new markets successfully, and to provide high quality products and services in these new markets.
Industry Standards
The entertainment industry has historically depended upon industry standards to ensure compatibility across delivery platforms and a wide variety of consumer entertainment products. We make significant efforts to design our products and technologies to address capability, quality, and cost considerations so that they either meet, or more importantly, are adopted as industry standards across the broad range of entertainment industry markets in which we participate, as well as the markets in which we plan to compete in the future. To have our products and technologies adopted as industry standards, we must convince a broad spectrum of standards-setting organizations throughout the world, as well as our major customers and licensees who are members of such organizations, to adopt them as such. The market for broadcast technologies has traditionally been heavily based on industry standards, often mandated by governments choosing from among alternative standards, and we expect this to continue to be the case in the future. However, the continued advancement of OTT media delivery and consumption may impact the importance of inclusion in certain broadcast standards in the future.
Difficulty Becoming Incorporated in an Industry Standard. Standards-setting organizations establish technology standards for use in a wide range of consumer entertainment products. It can be difficult for companies to have their technologies adopted as an industry standard, as multiple companies, including ones that typically compete against one another, are involved in the development of new technology standards for use in entertainment-oriented products. Furthermore, some standards-setting organizations choose to adopt a set of optional standards or a combination of mandatory and optional standards; in such cases, our technologies may be adopted only as an optional standard and not a mandatory standard. Standards may also change in ways that are unfavorable to Dolby.
Participants May Choose Among Alternative Technologies within Standards. Even when a standards-setting organization incorporates our technologies in an industry standard for a particular market, our technologies may not be the sole technologies adopted for that market. Furthermore, different standards may be adopted for different markets. Our operating results depend upon participants in that market choosing to adopt our technologies instead of competitive technologies that also may be acceptable under such standard. For example, the continued growth of our revenue from the broadcast market will depend upon both the continued global adoption of digital television generally, including in emerging markets, and the choice to use our technologies where it is one of several accepted industry standards.
Being Part of a Standard May Limit Our Licensing Practices. When a standards-setting organization mandates our technologies, we generally must agree to license such technologies on a fair, reasonable, and non-discriminatory basis, which could limit our control over the use of these technologies. In these situations, we must often limit the royalty rates we charge for these technologies, and we may be unable to limit to whom we license such technologies or to restrict many terms of the license. We have in the past, and may in the future, be subject to claims that our licensing of industry standard technologies may not conform to the requirements of the standards-setting organization. Allegations such as these could be asserted in private actions seeking monetary damages and injunctive relief, or in regulatory actions. Claimants in such cases could seek to restrict or change our licensing practices or our ability to license our technologies.
Royalty Reporting
Our operating results fluctuate based on the risks set forth in this section, as well as, among other factors, on:
• | Timing of royalty reports from our licensees and meeting revenue recognition criteria; |
13
• | Royalty reports including positive or negative corrective adjustments; |
• | Retroactive royalties that cover extended periods of time; and |
• | Timing of revenue recognition under licensing agreements and other contractual arrangements, including recognition of unusually large amounts of revenue in any given quarter because not all of our revenue recognition criteria were met in prior periods. |
Inaccurate Licensee Royalty Reporting. We generate licensing revenue primarily from OEMs who license our technologies and incorporate those technologies into their products. Our license agreements generally obligate our licensees to pay us a specified royalty for every product they ship that incorporates our technologies, and we rely on our licensees to report their shipments accurately. However, we have difficulty independently determining whether our licensees are reporting shipments accurately, particularly with respect to software incorporating our technologies because unauthorized copies of such software can be made relatively easily. A third party may disagree with our interpretation of the terms of a license agreement or, as a result of an audit, a third party could challenge the accuracy of our calculation. We are regularly involved in discussions with third party technology licensees regarding license terms. Most of our license agreements permit us to audit our licensees’ records, and we routinely exercise these rights, but audits are generally expensive, time-consuming, and potentially detrimental to our ongoing business relationships with our licensees. In the past, licensees have understated or failed to report the number of products incorporating our technologies that they shipped, and we have not been able to collect and recognize revenue to which we were entitled. We expect that we will continue to experience understatement and non-reporting of royalties by our licensees. We have been able to obtain certain recovery payments from licensees (either in the form of back payments or settlements), and such recoveries have become a recurring element of our business; however, we are unable to predict with certainty the revenue that we may recover in the future or our ability to continue to obtain such recoveries at all.
Royalties We Owe Others. In some cases, the products we sell and the technologies we license to our customers include IP that we have licensed from third parties. Our agreements with these third parties generally require us to pay them royalties for that use, and give the third parties the right to audit our calculation of those royalties. A third party may disagree with our interpretation of the terms of a license agreement or, as a result of an audit, a third party could challenge the accuracy of our calculation. We are regularly involved in discussions with third party technology licensors regarding license terms. A successful challenge by a third party could result in the termination of a license agreement or an increase in the amount of royalties we have to pay to the third party.
Changes in Revenue Recognition Standard. Beginning in Q1 of fiscal 2019, we adopted accounting standard ASU 2014-09, Revenue from Contracts with Customers (Topic 606), which we refer to as “ASC 606.” We elected to use the Full Retrospective method to adopt ASC 606, which requires us to recast our fiscal 2018 and fiscal 2017 revenues under ASC 606 by applying the new standard retrospectively. Going forward, we will report fiscal 2019 revenues only under ASC 606, along with prior year comparisons, which will also be reported under ASC 606. The transition from ASC 605 to ASC 606 most significantly impacts two key areas of Dolby’s revenue accounting, as described below.
The first topic related to ASC 606 that will significantly impact us involves multi-year contracts. Most of our licensing arrangements with customers currently involve multi-year contracts, and in the past under ASC 605, it would have been unusual for all revenue from a multi-year contract to be recognized upfront (i.e., upon execution of the contract). Under ASC 606, the accounting framework has shifted, and now, certain terms and conditions (such as “minimum volume commitments”) are more likely to result in upfront revenue recognition. Only a small number of our contracts were affected by this change; however, when we recast our fiscal 2017 and fiscal 2018 revenue under ASC 606, some of our revenue will shift to previous years. Going forward into fiscal 2019, as we transition to the new rules under ASC 606, we do not anticipate any material change in the amount of licensing revenue that is recognized upfront, compared to revenue previously recognized under ASC 605.
The second topic related to ASC 606 that will significantly impact us involves our quarterly recognition of certain royalty revenues from licensing customers. In a typical licensing arrangement, the customer enters into a contract with us agreeing to pay royalties for Dolby technology implemented in its products. Usually, the customer compiles its shipment activity throughout a quarter and then submits an aggregate report to us in the following quarter. Under ASC 605, we used those reports to compute, record and recognize royalty revenue in the quarter in which we received the report. For instance, units shipped by a customer in a quarter ending March 31st would result in us recognizing revenue in the following quarter ending June 30th. Under ASC 606, that approach has changed, and instead, we will recognize revenue in our March 31st quarter for units shipped by the customer in that March 31st
14
quarter. In order to do this, we will need to make estimates in the March 31st quarter of the units shipped by customers in that same quarter. Then, in the following quarter ending June 30th, when we receive the customer reports of the actual shipments that occurred in the March 31st quarter, we will book adjustments, as necessary, to “true-up” the difference between the estimated and the actual revenue (which could be an increase or decrease). The effect of this is to shift the timing of revenue recognition by one quarter - certain revenue previously recognized in one quarter will now be recognized in the prior quarter. The change may also cause more volatility in our quarterly figures because of the estimation process and the corresponding true-up adjustments, which we plan to disclose each quarter as appropriate.
Such changes to our reporting practices could significantly affect our results of operations to the extent that actual revenues differ significantly from estimated revenues, or that we are required to accelerate recognition of revenue under certain arrangements, potentially causing the amount of revenue we recognize to vary materially from quarter to quarter. While the adoption of the new standard will not change the cash flows or total revenues we receive from our contracts with customers, the new standard could result in changes to the timing of our reported revenue and income, which in turn could cause volatility in the price of our common stock.
TECHNOLOGY TRENDS AND DEVELOPMENTS
Technology Innovation. Our revenue growth will depend upon our success in new and existing markets for our technologies, such as digital broadcast, mobile devices, online and mobile media distribution, cinema, consumer imaging and communications. The markets for our technologies and products are defined by:
• | Rapid technological change; |
• | New and improved technology and frequent product introductions; |
• | Changing consumer and licensee demands; |
• | Evolving industry standards; and |
• | Technology and product obsolescence. |
Our future success depends on our ability to enhance our technologies and products and to develop new technologies and products that address the market needs in a timely manner. Technology development is a complex, uncertain process requiring high levels of innovation, highly-skilled engineering and development personnel, and the accurate anticipation of technological and market trends. We may not be able to identify, develop, acquire, market, or support new or enhanced technologies or products on a timely basis, if at all.
Experience with New Markets and Business Models. Our future growth will depend, in part, upon our expansion into areas beyond our audio licensing business. Over the past few years, we have introduced Dolby Voice technology for the communications market, Dolby Vision for the home and cinema markets, and our branded-theater experience, Dolby Cinema. In connection with entering into these new markets, we face new sources of competition, new business models, and new customer relationships. In order to be successful in these markets, we will need to cultivate new industry relationships and strengthen existing relationships to bring our products, services, and technologies to market. Our limited experience to date in one or more of these markets could limit our ability to successfully execute on our growth strategy.
Incorporation of Dolby Formats into New Products & Availability of Content in Dolby Formats. The success of many of our newer initiatives, such as Dolby Atmos, Dolby Vision, and Dolby Cinema, is dependent upon the availability and success of (i) products that incorporate Dolby formats and (ii) content produced in Dolby formats. However, there is no guarantee that device makers will continue to incorporate Dolby formats into their products, that content creators will continue to release content in Dolby formats, or that either those products or that content will be commercially successful.
For instance, to successfully establish Dolby Vision and Dolby Atmos, we will need to continue to expand the array of products and consumer devices that incorporate Dolby Atmos and Dolby Vision, expand the pipeline of Dolby Atmos and Dolby Vision content available from content creators, and encourage consumer adoption in the face of competing products and technologies. Similarly, the success of Dolby Cinema is dependent upon our ability to partner with movie theater exhibitors to launch new Dolby Cinema sites and deploy new sites in accordance with plans, as well as the continued release and box-office success of new films in the Dolby Vision and Dolby Atmos formats released through Dolby Cinemas.
Further, the commercial success of products incorporating Dolby formats, content released in Dolby formats, and Dolby Cinemas generally, depends upon a number of factors outside of our control, including, but not limited to,
15
consumer preferences, critical reception, timing of release, marketing efforts of third-parties, and general market conditions. Moreover, release and distribution of such products and content can be subject to delays in production or changes in release schedule, which can negatively impact the quantity, timing and quality of such products and content released in Dolby formats and available at Dolby Cinema theaters.
INTELLECTUAL PROPERTY
Our business is dependent upon protecting our patents, trademarks, trade secrets, copyrights, and other IP rights, the loss or expiration of which may significantly impact our results of operations and financial condition. Effective IP rights protection, however, may not be available under the laws of every country in which our products and services and those of our licensees are distributed. The efforts we have taken to protect our proprietary rights may not be sufficient or effective. We also seek to maintain select IP as trade secrets, and third parties or our employees could intentionally or accidentally compromise the IP that we maintain as trade secrets. In addition, protecting our IP rights is costly and time consuming. We have taken steps in the past to enforce our IP rights and expect to do so in the future. However, it may not be practicable or cost effective for us to enforce our IP rights fully, particularly in some countries or where the initiation of a claim might harm our business relationships.
We generally seek patent protection for our innovations. However, our patent program faces a number of challenges, including:
• | Possibility that innovations may not be protectable; |
• | Failure to protect innovations that later turn out to be important; |
• | Insufficient patent protection to prevent third parties from designing around our patent claims; |
• | Our pending patent applications may not be approved; and |
• | Possibility that an issued patent may later be found to be invalid or unenforceable. |
Patent Royalties and Expiration. Many of the technologies that we license to our system licensees are covered by patents, and the licensing revenue that we receive from those licenses depends in large part upon the life of such patents. In general, our agreements with our licensees require them to pay us a full royalty with respect to a particular technology only until the last patent covering that technology expires in a particular country. As of September 28, 2018, we had approximately 9,300 issued patents in addition to approximately 4,100 pending patent applications in more than 100 jurisdictions throughout the world. Our currently issued patents expire at various times through February 2043.
We seek to mitigate this risk in a variety of ways. We regularly look for opportunities to expand our patent portfolio through organic development and acquisitions. We develop proprietary technologies to replace licensing revenue from technologies covered by expiring patents with licensing revenue supported by patents with a longer remaining life. And we develop and license our technologies in a manner designed to minimize the chance that a system licensee would develop competing technologies that do not include any Dolby IP.
In the case of our patent coverage related to DD, some of our relevant patents have expired, but others continue to apply. DD is our solution that includes technology necessary to implement AC-3 as it has been updated over time. We have continued to innovate and develop intellectual property to support the standard and its implementation. Our customers use our DD implementation for quality, reliability, and performance, even in locations where we have not had applicable patent coverage. While in the past, we derived a significant portion of our licensing revenue from our DD technologies, this is no longer the case as revenues attributed to DD technologies have declined and are expected to continue to decline.
Many of our partners have adopted newer generations of our offerings such as DD+, and the range of products incorporating DD solutions is now limited to DVD players (but not Blu-ray players) and some TVs, STBs and soundbars. To continue to be successful in our audio licensing business, we must keep transitioning our DD licensees to our newer technologies, including our DD+ and Dolby AC-4 technologies.
Unauthorized Use of Our Intellectual Property. We have often experienced, and expect to continue to experience, problems with non-licensee OEMs and software vendors, particularly in China and certain emerging economies, incorporating our technologies and trademarks into their products without our authorization and without paying us any licensing fees. Manufacturers of ICs containing our technologies occasionally sell these ICs to third parties who are not our system licensees. These sales, and the failure of such manufacturers to report the sales, facilitate the unauthorized use of our IP. As emerging economies transition from analog to digital content, such as the transition from analog to digital broadcast, we expect to experience an increase in problems with this form of piracy.
16
Intellectual Property Litigation. Companies in the technology and entertainment industries frequently engage in litigation based on allegations of infringement or other violations of IP rights. We have faced such claims in the past, and we expect to face similar claims in the future. Any IP claims, with or without merit, could be time-consuming, expensive to litigate or settle, and could divert management resources and attention. In the past, we have settled claims relating to infringement allegations and agreed to make payments in connection with such settlements. An adverse determination in any IP claim could require that we pay damages or stop using technologies found to be in violation of a third party’s rights and could prevent us from offering our products and services to others. In order to avoid these restrictions, we may have to seek a license for the technology, which may not be available on reasonable terms or at all. Licensors could also require us to pay significant royalties. As a result, we may be required to develop alternative non-infringing technologies, which could require significant effort and expense. If we cannot license or develop technologies for any aspects of our business found to be infringing, we may be forced to limit our product and service offerings and may be unable to compete effectively.
In some instances, we have contractually agreed to provide indemnifications to licensees relating to our IP. Additionally, at times we have chosen to defend our licensees from third party IP infringement claims even where such defense was not contractually required, and we may choose to take on such defense in the future.
Licensee Disputes. At times, we are engaged in disputes regarding the licensing of our IP rights, including matters related to our royalty rates and other terms of our licensing arrangements. These types of disputes can be asserted by our customers or prospective customers or by other third parties as part of negotiations with us or in private actions seeking monetary damages or injunctive relief, or in regulatory actions. In the past, licensees have threatened to initiate litigation against us based on potential antitrust claims or regarding our licensing royalty rate practices. Damages and requests for injunctive relief asserted in claims like these could be significant, and could be disruptive to our business.
U.S. and Foreign Patent Rights. Our licensing business depends in part on the uniform and consistent treatment of patent rights in the U.S. and abroad. Changes to the patent laws and regulations in the U.S. and abroad may limit our ability to obtain, license, and enforce our rights. Additionally, court and administrative rulings may interpret existing patent laws and regulations in ways that hurt our ability to obtain, license, and enforce our patents. We face challenges protecting our IP in foreign jurisdictions, including:
• | Our ability to enforce our contractual and IP rights, especially in countries that do not recognize and enforce IP rights to the same extent as the U.S., Japan, Korea, and European countries do, which increases the risk of unauthorized use of our technologies; |
• | Limited or no patent protection for our DD technologies in countries such as China, Taiwan, and India, which may require us to obtain patent rights for new and existing technologies in order to grow or maintain our revenue; and |
• | Because of limitations in the legal systems in many countries, our ability to obtain and enforce patents in many countries is uncertain, and we must strengthen and develop relationships with entertainment industry participants worldwide to increase our ability to enforce our IP and contractual rights without relying solely on the legal systems in the countries in which we operate. |
OPERATIONS
Reliance on Key Suppliers. Our reliance on suppliers for some of the key materials and components we use in manufacturing our products involves risks, including limited control over the price, timely delivery, and quality of such components. We generally have no formal agreements in place with our suppliers for the continued supply of materials and components. Although we have identified alternate suppliers for most of our key materials and components, any required changes in our suppliers could cause delays in our operations and increase our production costs. In addition, our suppliers may not be able to meet our production demands as to volume, quality, or timeliness.
Moreover, we rely on sole source suppliers for some of the components that we use to manufacture our products, including specific charged coupled devices, light emitting diodes, and digital signal processors. These sole source suppliers may become unable or unwilling to deliver these components to us at an acceptable cost or at all, which could force us to redesign those specific products. Our inability to obtain timely delivery of key components of acceptable quality, any significant increases in the prices of components, or the redesign of our products could result in production delays, increased costs, and reductions in shipments of our products.
Product Quality. Our products, and products that incorporate our technologies, are complex and sometimes contain undetected software or hardware errors, particularly when first introduced or when new versions are released.
17
In addition, we have limited control over manufacturing performed by contract manufacturers, which could result in quality problems. Furthermore, our products and technologies are sometimes combined with or incorporated into products from other vendors, sometimes making it difficult to identify the source of a problem or, in certain instances, making the quality of our implementation dependent in part upon the quality of such other vendors' products. Any negative publicity or impact relating to these product problems could affect the perception of our brand and market acceptance of our products or technologies. These errors could result in a loss of or delay in market acceptance of our products or cause delays in delivering them and meeting customer demands, any of which could reduce our revenue and raise significant customer relations issues. In addition, if our products or technologies contain errors, we could be required to replace or reengineer them or rely upon parties who have incorporated our technologies into their products to implement updates to address such issues, which could cause delays or increase our costs. Moreover, if any such errors cause unintended consequences, we could incur substantial costs in defending and settling product liability claims. Although we generally attempt to contractually limit our liability, if these contract provisions are not enforced, or are unenforceable for any reason, or if liabilities arise that are not effectively limited, we could incur substantial costs in defending and settling product liability claims.
Production Processes and Production. Production difficulties or inefficiencies can interrupt production, resulting in our inability to deliver products on time in a cost effective manner, which could harm our competitive position. While we have three production facilities, we increasingly use contract manufacturers for a significant portion of our production capacity. Our reliance on contract manufacturers for the manufacture of our products involves risks, including limited control over timely delivery and quality of such products. If production of our products is interrupted, we may not be able to manufacture products on a timely basis. A shortage of manufacturing capacity for our products could reduce our operating results and damage our customer relationships. We may be unable to quickly adapt our manufacturing capacity to rapidly changing market conditions and a contract manufacturer may encounter similar difficulties. Likewise, we may be unable to quickly respond to fluctuations in customer demand or contract manufacturer interruptions. At times we underutilize our manufacturing facilities as a result of reduced demand for some of our products.
Data Security. We rely on information technology systems in the conduct of our business, including systems designed and managed by third parties. Many of these systems contain sensitive and confidential information, including our trade secrets and proprietary business information, and personal data, as well as content and information of or pertaining to our customers, suppliers and business partners. The secure maintenance of this information is critical to our operations and business strategy. Increasingly, companies are subject to a wide variety of attacks on their networks and systems on an ongoing basis. Our information technology and infrastructure may be vulnerable to penetration or attacks by hackers, malware, software bugs or other technical malfunctions, or other disruptions. If we use a vendor that stores information as part of their service or product offerings, we assess the security of such services prior to using the service. Nevertheless, our sensitive, confidential or proprietary information may be misappropriated by that vendor or others who may inappropriately access the vendor’s system.
While we have taken a number of steps to protect our information technology systems, including the use of encryption and authentication technologies, the number and sophistication of malicious attacks that companies have experienced has increased over the past few years. In addition, because techniques used by hackers (many of whom are highly sophisticated and well-funded) to access or sabotage networks and computer systems change frequently and often are not recognized until after they are used, we may be unable to anticipate or immediately detect these techniques. This could delay our response or the effectiveness of our response and impede our operations and ability to limit our exposure to third-party claims and other potential liability. Attacks on our systems are sometimes successful, and, in some instances, we might be unaware of an incident or its magnitude and effects. We also may suffer data security breaches and the unauthorized access to, misuse or acquisition of, personal data or other sensitive and confidential information as the result of intentional or inadvertent breaches or other compromises by our employees or service providers. Any data security breach or other incident, whether external or internal in origin, could compromise our networks and systems, creating system disruptions or slowdowns and exploiting security vulnerabilities of our products. Any such breach or other incident, can result in the information stored on our networks and systems being improperly accessed or acquired, publicly disclosed, lost, or stolen, which could subject us to liability to our customers, suppliers, business partners and others. We seek to detect and investigate such attempts and incidents and to prevent their recurrence where practicable through changes to our internal processes and tools, but in some cases preventive and remedial action might not be successful. In addition, despite the implementation of network security measures, our networks also may be vulnerable to computer viruses, malware, ransomware, social engineering, denial of service, and similar other disruptions. Disruptions to our information technology systems, due to outages, security breaches or other causes, could also have severe consequences to our business, including financial loss and reputational damage.
18
A variety of provincial, state, national, and international laws and regulations apply to the collection, use, retention, protection, disclosure, transfer and other processing of personal data. These laws and regulations are evolving and may result in ever-increasing regulatory and public scrutiny and escalating levels of enforcement and sanctions. Our actual or perceived failure to adequately comply with applicable laws and regulations relating to privacy and data protection could result in regulatory fines, investigations and enforcement actions, penalties and other liabilities, claims for damages by affected individuals, and damage to our reputation, any of which could have a material adverse effect on our operations, financial performance and business.
Fluctuations in Foreign Currency Exchange Rates. We earn revenues, pay expenses, own assets and incur liabilities in foreign countries using several currencies other than the U.S. dollar. As a result, we face exposure to adverse movements in currency exchange rates as the financial results of our international operations are translated from local currency into U.S. dollars upon consolidation. The majority of our revenue generated from international markets is denominated in U.S. dollars, while the operating expenses of our foreign subsidiaries are predominantly denominated in local currencies. Therefore, our operating expenses will increase when the U.S. dollar weakens against the local currency and decrease when the U.S. dollar strengthens against the local currency. Additionally, foreign exchange rate fluctuations on transactions denominated in currencies other than the functional currency result in gains or losses that are reflected in our consolidated statements of operations. Additional risks related to fluctuations in foreign currency exchange rates are described in the Foreign Currency Exchange Risk section of Part I, Item 3 "Quantitative and Qualitative Disclosures About Market Risk."
Business Interruptions by Natural Disasters and Other Events Beyond Our Control. Although we maintain crisis management plans, our business operations are subject to interruption by natural disasters and catastrophic events beyond our control, including, but not limited to, earthquakes, hurricanes, typhoons, tropical storms, floods, tsunamis, fires, droughts, tornadoes, public health issues and pandemics, severe changes in climate, war, terrorism, and geo-political unrest and uncertainties. Additionally, several of our offices, including our corporate headquarters in San Francisco, are located in seismically active regions. Because we do not carry earthquake insurance for earthquake–related losses and significant recovery time could be required to resume operations, our financial condition and operating results could be materially adversely affected in the event of a major earthquake or catastrophic event.
COMPETITION
The markets for our technologies are highly competitive, and we face competitive threats and pricing pressure in our markets. Consumers may perceive the quality of the visual and audio experiences produced by some of our competitors’ technologies to be equivalent or superior to the sight and sound experiences produced by our technologies. Some of our current or future competitors may have significantly greater financial, technical, marketing, and other resources than we do, or may have more experience or advantages in the markets in which they compete. These competitors may also be able to offer integrated systems in markets for entertainment technologies on a royalty-free basis or at a lower price than our technologies, including audio, imaging, and other technologies, which could make competing technologies that we develop less attractive.
Pricing Pressures. The markets for the consumer entertainment products in which our technologies are incorporated are intensely competitive and price sensitive. We expect to face increased royalty pricing pressure for our technologies as we seek to drive the adoption of our technologies into online content and portable devices, such as tablets and smartphones. Retail prices for consumer entertainment products that include our sound technologies, such as DVD and Blu-ray players and home theater systems, have decreased significantly, and we expect prices to decrease for the foreseeable future. In response, OEMs have sought to reduce their product costs, which can result in downward pressure on the licensing fees we charge.
Customers as Competitors. We face competitive risks in situations where our customers are also current or potential competitors. For example, Samsung and Technicolor are significant licensee customers, but are also competitors with respect to some of our consumer, broadcast, and cinema technologies. Our customers may choose to use competing technologies they have developed or in which they have an interest rather than use our technologies. The existence of important customer relationships may influence which strategic opportunities we pursue, as we may forgo some opportunities in the interests of preserving a critical customer relationship.
Competition from Other Audio Formats, Imaging Solutions, and Integrated System Offerings. We believe that the success we have had licensing our audio technologies to system licensees is due, in part, to the perception that our technologies provide a high quality solution for multichannel audio and the strength of our brand. However, both free and proprietary sound technologies are becoming increasingly prevalent, and we expect competitors to continue to enter this field with other offerings. Furthermore, to the extent that customers perceive our competitors’ products as
19
providing the same or similar advantages as our technologies at a lower or comparable price, there is a risk that these customers may treat sound encoding technologies as commodities, resulting in loss of status of our technologies, decline in their use, and significant pricing pressure. For example, we face competition with respect to our HDR imaging technology, Dolby Vision, and there can be no assurance that additional consumers will adopt Dolby Vision in the near future, or at all, or that we will maintain our existing customers.
In addition, some of our current or potential competitors may be able to offer integrated systems in certain markets for entertainment technologies, including audio, imaging, and digital rights management technologies, which could make competing technologies that we develop or acquire obsolete. By offering an integrated system solution, these potential competitors may also be able to offer competing technologies at lower prices than we can, which could adversely affect our operating results.
Competition for Employees. In order to be successful, we must attract, develop, and retain employees, including employees to work on our growth initiatives where our current employees may lack experience with the business models and markets we are pursuing. Competition for experienced employees in our markets can be intense. In order to attract and retain employees, we must provide a competitive compensation package, including cash and equity compensation. Our equity awards include stock options and restricted stock units. The future value of these awards is uncertain, and depends on our stock price performance over time. In order for our compensation packages to be viewed as competitive, prospective employees must perceive our equity awards to be a valuable benefit.
STRATEGIC ACTIVITIES
Importance of Industry Relationships. To be successful, we must maintain and grow our relationships with a broad range of industry participants, including:
• | Content creators, such as film directors, studios, mobile and online content producers, and music producers; |
• | Content distributors, such as studios, film exhibitors, broadcasters, operators, and OTT video service providers and video game publishers; |
• | Leading companies in the audio and video conferencing markets; and |
• | Device manufacturers. |
Industry relationships have historically played an important role in the markets that we serve, particularly in the entertainment market. For example, sales of our products and services are particularly dependent upon our relationships with major film studios and broadcasters, and licensing of our technologies is particularly dependent upon our relationships with system licensees and IC manufacturers. If we fail to maintain and strengthen these relationships, these entertainment industry participants may be less likely to purchase and use our technologies, products, and services, or create content incorporating our technologies. Industry relationships also play an important role in other markets we serve; for instance, our partner relationships in the audio and video conferencing markets are important to our communications business.
Consequences of M&A Activity. We evaluate a wide array of possible strategic transactions, including acquisitions. We consider these types of transactions in connection with, among other things, our efforts to strengthen our audio and cinema businesses and expand beyond sound technologies. Although we cannot predict whether or not we will complete any such acquisitions or other transactions in the future, any of these transactions could be significant in relation to our market capitalization, financial condition, or results of operations. The process of integrating an acquired company, business, or technology may create unforeseen difficulties and expenditures. Foreign acquisitions involve unique risks in addition to those mentioned above, including those related to integration of operations across different geographies, cultures, and languages; currency risks; and risks associated with the economic, political, and regulatory environment in specific countries. Future acquisitions could result in potentially dilutive issuances of our equity securities, the incurrence of debt, contingent liabilities, amortization expenses, and write-offs of goodwill. Future acquisitions may also require us to obtain additional equity or debt financing, which may not be available on favorable terms or at all. Also, the anticipated benefits of our acquisitions may not materialize.
We face various risks in integrating acquired businesses, including:
• | Diversion of management time and focus from operating our business to acquisition integration challenges; |
• | Cultural and logistical challenges associated with integrating employees from acquired businesses into our organization; |
20
• | Retaining employees, suppliers and customers from businesses we acquire; |
• | The need to implement or improve internal controls, procedures, and policies appropriate for a public company at businesses that prior to the acquisition may have lacked effective controls, procedures, and policies; |
• | Possible write-offs or impairment charges resulting from acquisitions; |
• | Unanticipated or unknown liabilities relating to acquired businesses; and |
• | The need to integrate acquired businesses’ accounting, management information, manufacturing, human resources, and other administrative systems to permit effective management. |
LEGAL AND REGULATORY COMPLIANCE
International Business and Compliance. We are dependent on international sales for a substantial amount of our total revenue. Approximately 67%, 65% and 69% of our revenue was derived outside of the U.S. in fiscal 2018, 2017, and 2016, respectively. We are subject to a number of risks related to conducting business internationally, including:
• | U.S. and foreign government trade restrictions, including those which may impose restrictions on importation of programming, technology, or components to or from the U.S.; |
• | U.S. government trade restrictions, including those which may impose restrictions, including prohibitions, on the exportation, reexportation, sale, shipment or other transfer of programming, technology, components, and/or services to foreign persons; |
• | Changes in diplomatic and trade relationships, including new tariffs, trade protection measures, import or export licensing requirements, trade embargoes and other trade barriers; |
• | Tariffs imposed by the U.S. on goods from other countries and tariffs imposed by other countries on U.S. goods, including the tariffs imposed in July and September 2018 by the U.S. government on various imports from China and by the Chinese government on certain U.S. goods, the scope and duration of which remain uncertain; |
• | Compliance with applicable international laws and regulations, including antitrust and other competition laws, that may change unexpectedly, differ, or conflict with laws in other countries where we conduct business, or are otherwise not harmonized with one another; |
• | Foreign government taxes, regulations, and permit requirements, including foreign taxes that we may not be able to offset against taxes imposed upon us in the U.S., and other laws limiting our ability to repatriate funds to the U.S.; |
• | Potential adverse changes in the political and/or economic stability of foreign countries or in their diplomatic relations with the U.S.; |
• | Difficulty in establishing, staffing, and managing foreign operations, including but not limited to restrictions on the ability to obtain or retain licenses required for operation, relationships with local labor unions and works councils, investment restrictions and/or requirements, and restrictions on foreign ownership of subsidiaries; |
• | Adverse fluctuations in foreign currency exchange rates and interest rates, including risks related to any interest rate swap or other hedging activities we undertake; |
• | Poor recognition of IP rights; |
• | Difficulties in enforcing contractual rights; |
• | Multi-jurisdictional data protection and privacy laws, including the European Union's General Data Protection Regulation and restrictions on transferring personally identifiable information outside of a jurisdiction; |
• | Political or social instability in the U.K. and Europe (including but not limited to uncertainty resulting from the Brexit referendum in the U.K.) and in Russia, the Middle East, North Africa, Latin America and other emerging markets; |
• | Uncertainties related to any geopolitical, economic and regulatory effects or changes due to the current political climate in the U.S.; |
• | Natural disasters, war or events of terrorism; and |
• | The strength of international economies. |
Any or all of these factors may impact the demand for, and profitability of, our technologies and products, as well as our customers' products that incorporate our technologies.
21
Certain foreign governments, particularly in China, have advanced arguments under their competition laws that exert downward pressure on royalties for IP. The regulatory enforcement activities in such jurisdictions can be unpredictable, in some cases because these jurisdictions have only recently implemented competition laws. From time to time, we are the subject of requests for information, market conduct examinations, inquires or investigations by industry groups and/or regulatory agencies in these jurisdictions. For instance, in October 2018, the Korean Fair Trade Commission (“KFTC”) requested information relating to the company’s business practices in Korea, and we are cooperating with such request. In the event that we are involved in significant disputes or are the subject of a formal action by a regulatory agency, our results could be negatively impacted and we could be exposed to costly and time-consuming legal proceedings.
In many foreign countries, particularly in those with developing economies, it is common to engage in business practices that are prohibited by U.S. regulations applicable to us such as the FCPA and U.S. export controls. Although we implement policies and procedures designed to ensure compliance with the FCPA and U.S. export controls, there can be no assurance that all of our employees, distributors, dealers, and agents will not take actions in violation of our policies or these regulations.
Costs of Environmental Laws and Regulation. Our operations use substances regulated under federal, state, local, and international laws governing the environment, including those governing the discharge of pollutants into the air and water, the management, disposal, and labeling of hazardous substances and wastes, and the cleanup of contaminated sites. In addition, future environmental laws and regulations have the potential to affect our operations, increase our costs, decrease our revenue, or change the way we design or manufacture our products. We face increasing complexity in our product design as we adjust to requirements relating to the materials composition of our products. For some products, substituting particular components containing regulated hazardous substances is more difficult or costly, and additional redesign efforts could result in production delays. We could incur costs, fines, and civil or criminal sanctions, third party property damage or personal injury claims, or could be required to incur substantial investigation or remediation costs, if we were to violate or become liable under environmental laws.
Conflict Minerals. SEC rules require the disclosure of the use of tantalum, tin, tungsten, and gold (commonly referred to as "conflict minerals") that are sourced from the Democratic Republic of the Congo and surrounding countries. This requirement could affect the sourcing, availability and pricing of materials used in our products as well as the companies we use to manufacture our products. In circumstances where sources of conflict minerals from the Democratic Republic of the Congo or surrounding countries are not validated as conflict free, Dolby may take actions to change materials, designs or manufacturers to reduce the possibility that Dolby's contracts to manufacture products that contain conflict minerals finance or benefit local armed groups in the region. The SEC disclosure requirements could adversely affect the sourcing, supply and pricing of materials used in our products. As there may be only a limited number of suppliers that can certify to us that they are offering “conflict free” conflict minerals, we cannot be sure that we will be able to obtain necessary conflict minerals from such suppliers in sufficient quantities or at competitive prices. These actions could also add engineering and other costs in connection with the manufacturing of our products.
We may not be able to sufficiently verify the origins for the minerals used in our products. Our reputation may suffer if we determine that our products contain conflict minerals that are not determined to be conflict free or if we are unable to sufficiently verify the origins for all conflict minerals used in our products. In addition, some customers may require that all of our products are certified to be conflict free and if we cannot satisfy these customers, they may choose a competitor's products.
Tax Rates and Liabilities. We are a U.S. multi-national company that is subject to tax in multiple U.S. and foreign jurisdictions. We must use judgment to determine our worldwide tax provision. We receive significant tax benefits from a portion of our foreign sales, and realizability of these benefits are contingent upon existing current tax laws and regulations in the U.S. and countries where we operate. The following could materially affect our effective tax rate:
• | Changes in geographic mix of earnings, where earnings are lower than anticipated in countries with lower tax rates and higher than anticipated in countries with higher tax rates; |
• | Changes in the valuation of our deferred tax assets and liabilities; |
• | Changes in transfer pricing arrangements; |
• | Outcomes of tax audits; |
• | Changes in accounting principles; or |
• | Changes in tax laws and regulations in the countries in which we operate, including an increase in tax rates, or an adverse change in the treatment of an item of income or expense. |
22
As a result of the Tax Act enacted into law on December 22, 2017, there have been significant changes to the U.S. Internal Revenue Code, requiring us to exercise significant judgment in interpreting the Tax Act’s provisions. As we evaluate the full impact of its regulations and guidance that are being introduced, our results may materially differ from previous estimates, and those differences may materially affect our financial position. In addition, the Tax Act includes certain international provisions that are effective for us beginning in fiscal 2019. These provisions and any changes that we make to our corporate tax structure could adversely affect our tax rate and cash flow in future years.
The Organization of Economic Cooperation and Development (“OECD”), an international association of many countries including the United States, has finalized its Base Erosion and Profit Shifting recommendations, and many countries have started to adopt its recommendations, or independently are changing long standing transfer pricing and cross-border taxation rules. In addition, the European Union and its European Commission are proposing model legislation and investigating companies that might be in violation of European Union competition rules against unjustified state aid. Further, the OECD, European Union and European Commission could conceivably make competing jurisdictional claims over the taxes owed on earnings of multinational companies in their respective countries or regions. To the extent these actions take place in the countries that we operate, it is possible that in the future, these efforts may increase uncertainty and have an adverse impact on our effective tax rates or operations.
We are subject to the periodic examination of our income tax returns by tax authorities. We regularly assess the likelihood of adverse outcomes resulting from these examinations to determine the adequacy of our provision for income taxes, but an adverse decision by tax authorities in excess of our reserves, could significantly impact our financial results.
STOCK-RELATED ISSUES
Controlling Stockholder. At September 28, 2018, the Dolby family and their affiliates owned 1,778,969 shares of our Class A common stock and 39,176,233 shares of our Class B common stock. As of September 28, 2018, the Dolby family and their affiliates had voting power of 99.8% of our outstanding Class B common stock, which combined with their shares of our Class A common stock, represented 86.2% of the combined voting power of our outstanding Class A and Class B common stock. Under our certificate of incorporation, holders of Class B common stock are entitled to ten votes per share while holders of Class A common stock are entitled to one vote per share. Generally, shares of Class B common stock automatically convert into shares of Class A common stock upon transfer of such Class B common stock, other than transfers to certain specified persons and entities, including the spouse and descendants of Ray Dolby and the spouses and domestic partners of such descendants.
As a result of this dual class structure, the Dolby family and their affiliates will, for the foreseeable future, have significant influence over our management and affairs, and will be able to control virtually all matters requiring stockholder approval, including the election of directors and significant corporate transactions such as mergers or other sales of our company or assets, even if they come to own considerably less than 50% of the total number of outstanding shares of our Class A and Class B common stock. Absent a transfer of Class B common stock that would trigger an automatic conversion as described above, there is no threshold or time deadline at which the shares of Class B common stock will automatically convert into shares of Class A common stock.
Moreover, the Dolby family and their affiliates may take actions in their own interests that our other stockholders do not view as beneficial.
Insider Sales of Common Stock. If our large shareholders, officers, directors or employees sell, or indicate an intention to sell, substantial amounts of our Class A common stock in the public market, including shares of Class A common stock issuable upon conversion of shares of Class B common stock, the trading price of our Class A common stock could decline.
Stock Repurchase Program. Our stock repurchase program may reduce the public float of shares available for trading on a daily basis. Such purchases may be limited, suspended, or terminated at any time without prior notice. There can be no assurance that we will buy additional shares of our Class A common stock under our stock repurchase program or that any future repurchases will have a positive impact on our stock price or earnings per share. Important factors that could cause us to discontinue or decrease our share repurchases include, among others, unfavorable market conditions, the market price of our Class A common stock, the nature of other investment or strategic opportunities presented to us, the rate of dilution of our equity compensation programs, our ability to make appropriate, timely, and beneficial decisions as to when, how, and whether to purchase shares under the stock repurchase program, and the availability of funds necessary to continue purchasing stock. If we curtail our repurchase program, our stock price may be negatively affected.
23
Dividend Program. We cannot provide assurance that we will continue to increase dividend payments and/or pay dividends. We are not obligated to pay dividends on our Class A and Class B common stock. In October 2014, we announced a quarterly cash dividend program for our stockholders that was initiated by our Board of Directors. Since the initial commencement of our dividend program, our Board of Directors has annually approved an increase to our cash dividend. Although we anticipate paying regular quarterly dividends for the foreseeable future, dividend declarations and the establishment of future record and payment dates are subject to the Board of Directors’ continuing determination that the dividend policy is in the best interests of our stockholders. The dividend policy may be changed or canceled at the discretion of the Board of Directors at any time. If we do not pay dividends, the market price of our Class A common stock must appreciate for investors to realize a gain on their investment. This appreciation may not occur and our Class A common stock may in fact depreciate in value.
24
ITEM 1B. UNRESOLVED STAFF COMMENTS
None.
ITEM 2. PROPERTIES
Our principal corporate office and worldwide headquarters, which we own, is at 1275 Market Street, San Francisco, California.
Other Properties
We also own a commercial office building located in Sunnyvale, California, and lease additional R&D, sales, product testing, and administrative facilities from third parties in California, New York, and internationally, including in Asia, Europe, Australia, the Middle East, and South America. We believe that our current facilities are adequate to meet our needs for the near future, and that suitable additional or alternative space will be available on commercially reasonable terms to accommodate our foreseeable future operations.
Dolby Wootton Bassett, LLC, of which Dagmar Dolby as Trustee of the Dagmar Dolby Trust under the Dolby Family Trust Instrument dated May 7, 1999 (the "Dagmar Dolby Trust") is the sole member, and the Dagmar Dolby Trust own a majority financial interest in real estate entities that own or from whom we lease certain facilities located in California and the U.K. We own the remaining financial interests in these real estate entities. Our ownership interest in these consolidated affiliated entities, in addition to information regarding the location of the property leased to Dolby Laboratories as of September 28, 2018 is summarized within the table below. The leases for these facilities expire at various times through 2025.
Entity Name | Minority Ownership Interest | Location Of Properties | Approximate Square Footage |
Dolby Properties Brisbane, LLC | 49.0% | Brisbane, California | 43,500 |
Dolby Properties Burbank, LLC | 49.0% | Burbank, California | 22,000 |
Dolby Properties UK, LLC | 49.0% | Wootton Bassett, England | 33,000 |
Dolby Properties, LP | 10.0% | ||
100 Potrero Avenue, San Francisco, California
Since 1980, we have leased a corporate office, warehouse space, and additional parking located at 100, 130, and 140 Potrero Avenue, San Francisco, California from the various Dolby family trusts. The lease for this office expires on October 31, 2024, and provides approximately 70,000 square feet of space. The Dolby family trusts retain the right to sublease approximately 1,099 square feet of office space in the premises with prior notice to us, at a rental rate equal to the then current base rent per square foot paid by us plus $14 per square foot per year (reflecting estimated costs payable by us for the operation and maintenance of the premises, subject to an annual increase of 1.5% per year during each year of the sublease term). We are generally responsible for operating expenses, taxes, and the condition, operation, repair, maintenance, security, and management of the premises. We have also agreed to indemnify and hold the Dolby family trusts, as landlord, harmless from and against certain liabilities, damages, claims, costs, penalties, and expenses arising from our conduct related to the premises.
ITEM 3. LEGAL PROCEEDINGS
We are involved in various legal proceedings from time to time arising from the normal course of business activities, including claims of alleged infringement of IP rights, commercial, employment, and other matters. In our opinion, resolution of these pending matters is not expected to have a material adverse impact on our operating results or financial condition. Given the unpredictable nature of legal proceedings, it is possible that an unfavorable resolution of one or more such proceedings could materially affect our future operating results or financial condition in a particular period; however, based on the information known by us as of the date of this filing and the rules and regulations applicable to the preparation of our consolidated financial statements, any such amount is either immaterial or it is not possible to provide an estimated amount of any such potential loss.
25
ITEM 4. MINE SAFETY DISCLOSURES
Not applicable.
26
PART II
ITEM 5. MARKET FOR REGISTRANT’S COMMON EQUITY, RELATED STOCKHOLDER MATTERS AND ISSUER PURCHASES OF EQUITY SECURITIES
Market Information
Our Class A common stock is traded on the New York Stock Exchange (“NYSE”) under the symbol “DLB.” Our Class B common stock is neither listed nor publicly traded. As of October 26, 2018, there were 12 holders of record of our Class A common stock and 39 holders of record of our Class B common stock. The number of Class A beneficial stockholders is substantially greater than the number of holders of record since a large portion of our common stock is held through brokerage firms. The following table sets forth the range of high and low sales prices on the NYSE of the Class A common stock for the periods indicated, as reported by the NYSE.
Fiscal Year 2018 | Fiscal Year 2017 | ||||||||||||
High | Low | High | Low | ||||||||||
First Quarter (Q1) | $ | 63.25 | $ | 57.38 | $ | 54.96 | $ | 45.19 | |||||
Second Quarter (Q2) | 70.19 | 59.98 | 52.41 | 46.06 | |||||||||
Third Quarter (Q3) | 69.06 | 59.82 | 53.09 | 48.96 | |||||||||
Fourth Quarter (Q4) | 71.83 | 61.22 | 59.07 | 48.25 | |||||||||
Dividend Policy
In October 2014, we announced a quarterly cash dividend program for our stockholders that was initiated by our Board of Directors. Since the program was initiated, a quarterly dividend has been declared and paid to all eligible stockholders of Class A and Class B common stock. Most recently, on October 24, 2018, we announced a dividend in the amount of $0.19 per share, payable on November 14, 2018, to stockholders of record as of the close of business on November 5, 2018.
Dividend declarations and the establishment of future record and payment dates are subject to the Board of Directors’ continuing determination that the dividend policy is in the best interests of our stockholders. The dividend policy may be changed or canceled at the discretion of the Board of Directors at any time. See Note 7 “Stockholders' Equity & Stock-Based Compensation” to our consolidated financial statements for additional information related to the quarterly dividend. Further discussion of our recurring quarterly dividend is included within Shareholder Return in Item 7 "Management’s Discussion and Analysis of Financial Condition and Results of Operations."
Sales of Unregistered Securities
None.
Purchases of Equity Securities by the Issuer and Affiliated Purchasers
In November 2009, our Board of Directors announced a stock repurchase program ("program"), providing for the repurchase of our Class A common stock. Stock repurchases under the program may be made through open market transactions, negotiated purchases, or otherwise, at times and in amounts that we consider appropriate. The timing of repurchases and the number of shares repurchased depend upon a variety of factors, including price, regulatory requirements, the rate of dilution from our equity compensation plans, and other market conditions. The program does not have a specified expiration date, and can be limited, suspended, or terminated at our discretion at any time without prior notice. Shares repurchased under the program will be returned to the status of authorized but unissued shares of Class A common stock.
The following table summarizes the initial amount of authorized repurchases as well as additional repurchases approved by our Board of Directors as of September 28, 2018 (in thousands):
Authorization Period | Authorization Amount | ||
Fiscal 2010: November 2009 | $ | 250,000 | |
Fiscal 2010: July 2010 | 300,000 | ||
Fiscal 2011: July 2011 | 250,000 | ||
Fiscal 2012: February 2012 | 100,000 | ||
Fiscal 2015: October 2014 | 200,000 | ||
Fiscal 2017: January 2017 | 200,000 | ||
Fiscal 2018: July 2018 | 350,000 | ||
Total | $ | 1,650,000 | |
27
The following table provides information regarding our share repurchases made under this program during the fourth quarter of fiscal 2018:
Repurchase Activity | Total Shares Purchased | Average Price Paid Per Share (1) | Total Shares Purchased As Part Of Publicly Announced Programs | Remaining Authorized Repurchases (2) | ||||
June 30, 2018 - July 27, 2018 | — | $ | — | — | $406.7 million | |||
July 28, 2018 - August 24, 2018 | 912,822 | 65.71 | 912,822 | $351.5 million | ||||
August 25, 2018 - September 28, 2018 | — | — | — | $351.5 million | ||||
Total | 912,822 | 912,822 | ||||||
(1) | Average price paid per share excludes commission costs. |
(2) | Amounts represent the approximate dollar value of the maximum remaining number of shares that may yet be purchased under the stock repurchase program, and excludes commission costs. |
Stock Price Performance Graph
The following graph compares the total cumulative return of our Class A common stock with the total cumulative return for the New York Stock Exchange Composite Index (“NYSE Composite”) and the Russell 3000 Index (“Russell 3000”) for the five fiscal years ended September 28, 2018. The figures represented below assume an investment of $100 in our Class A common stock at the closing price of $34.39 on September 27, 2013, and in the NYSE Composite and Russell 3000 on the same date and the reinvestment of dividends into shares of common stock. The comparisons in the table are required by the Securities and Exchange Commission and are not intended to forecast or be indicative of possible future performance of our Class A common stock. This graph shall not be deemed “filed” for purposes of Section 18 of Securities Exchange Act of 1934, as amended (“Exchange Act”) or otherwise subject to the liabilities under that Section, and shall not be deemed to be incorporated by reference into any of our filings under the Securities Act or the Exchange Act.
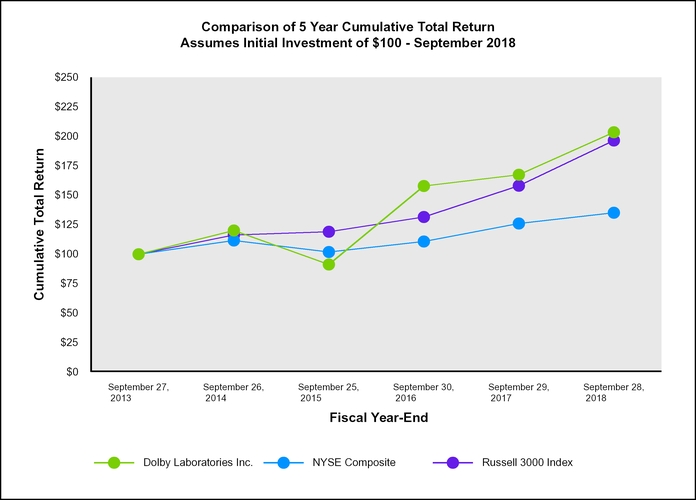
28
ITEM 6. SELECTED FINANCIAL DATA
The following selected consolidated financial data should be read in conjunction with Item 7, “Management’s Discussion and Analysis of Financial Condition and Results of Operations,” and our audited consolidated financial statements and the accompanying notes included within this filing. The consolidated balance sheet data for the fiscal years ended September 28, 2018 and September 29, 2017, and consolidated statements of operations data for the fiscal years ended September 28, 2018, September 29, 2017, and September 30, 2016 were derived from our audited consolidated financial statements included in this report. The consolidated statements of operations and balance sheet data for the fiscal years ended September 30, 2016, September 30, 2015, and September 26, 2014 were derived from our audited consolidated financial statements not included in this report. The historical financial results presented below are not necessarily indicative of results to be achieved in future periods. Note that fiscal 2016 consisted of 53 weeks, while all other fiscal years presented consisted of 52 weeks. All amounts presented below are displayed in thousands, except per share amounts.
Fiscal Year Ended | |||||||||||||||
September 28, 2018 | September 29, 2017 | September 30, 2016 | September 30, 2015 | September 26, 2014 | |||||||||||
Operations: | |||||||||||||||
Revenue | $ | 1,171,924 | $ | 1,081,454 | $ | 1,025,738 | $ | 970,638 | $ | 960,176 | |||||
Gross margin | 1,043,664 | 963,147 | 916,756 | 875,822 | 890,000 | ||||||||||
Operating expenses | 743,666 | 714,515 | 684,961 | 662,594 | 616,282 | ||||||||||
Income before provision for income taxes | 312,867 | 256,644 | 235,904 | 245,782 | 276,099 | ||||||||||
Net income attributable to Dolby Laboratories, Inc. | 122,246 | 201,802 | 185,860 | 181,390 | 206,103 | ||||||||||
Net Income Per Share: | |||||||||||||||
Basic | $ | 1.18 | $ | 1.98 | $ | 1.85 | $ | 1.77 | $ | 2.02 | |||||
Diluted | $ | 1.14 | $ | 1.95 | $ | 1.81 | $ | 1.75 | $ | 1.99 | |||||
Weighted-Average Shares Outstanding: | |||||||||||||||
Basic | 103,377 | 101,784 | 100,717 | 102,354 | 102,151 | ||||||||||
Diluted | 106,978 | 103,286 | 102,424 | 103,862 | 103,632 | ||||||||||
Cash dividends declared per common share | $ | 0.67 | $ | 0.58 | $ | 0.50 | $ | 0.42 | $ | — | |||||
Cash dividend paid per common share | $ | 0.64 | $ | 0.56 | $ | 0.48 | $ | 0.40 | $ | — | |||||
September 28, 2018 | September 29, 2017 | September 30, 2016 | September 30, 2015 | September 26, 2014 | |||||||||||
Cash and cash equivalents | $ | 918,063 | $ | 627,017 | $ | 516,112 | $ | 531,926 | $ | 568,472 | |||||
Working capital (1) | 1,029,827 | 765,661 | 546,647 | 611,548 | 730,036 | ||||||||||
Short-term and long-term investments | 365,920 | 562,121 | 515,533 | 459,916 | 527,543 | ||||||||||
Total assets | 2,659,269 | 2,533,554 | 2,310,106 | 2,133,293 | 1,984,012 | ||||||||||
Long-term debt | — | — | — | — | — | ||||||||||
Total stockholders’ equity—Dolby Laboratories, Inc. | 2,189,551 | 2,136,742 | 1,970,256 | 1,807,068 | 1,731,648 | ||||||||||
(1) | Working capital as of September 26, 2014 has been adjusted by $86.4 million to reflect the reclassification of deferred tax assets from current assets to non-current assets following our adoption of ASU 2015-17 during the first quarter of fiscal 2016. The changes to working capital as of September 25, 2015 as a result of this reclassification had previously been disclosed within our quarterly filings beginning with our Form 10-Q filed for the fiscal quarter ended January 1, 2016. For additional information, refer to Note 2 "Summary Of Significant Accounting Policies" to our consolidated financial statements. |
29
ITEM 7. MANAGEMENT’S DISCUSSION AND ANALYSIS OF FINANCIAL CONDITION AND RESULTS OF OPERATIONS
The following discussion contains forward-looking statements that are subject to risks and uncertainties. Actual results may differ substantially from those referred to herein due to a number of factors, including but not limited to risks described in Item 1A, “Risk Factors” and elsewhere in this Annual Report on Form 10-K. We disclaim any duty to update any of the forward-looking statements to conform our prior statements to actual results.
Investors and others should note that we disseminate information to the public about our company, our products, services and other matters through various channels, including our website (www.dolby.com), our investor relations website (http://investor.dolby.com), SEC filings, press releases, public conference calls, and webcasts, in order to achieve broad, non-exclusionary distribution of information to the public. We encourage investors and others to review the information we make public through these channels, as such information could be deemed to be material information.
We are focused on expanding our leadership in audio solutions for entertainment content and delivering dynamic new audio and imaging technologies. This will broaden the number of Dolby experiences that people can enjoy which in turn will help drive our revenue growth. Following is a discussion of the key markets that we address and the various Dolby technologies and solutions that serve these markets.
EXPANDING OUR LEADERSHIP IN AUDIO SOLUTIONS
AUDIO LICENSING
The majority of our licensing revenue is derived from the licensing of audio technologies. The following are highlights and key challenges related to audio licensing, by market.
Broadcast
Highlights: We have an established presence in developed markets with respect to our DD+ and HE-AAC technologies in broadcast services and devices, and are focused on the advancement of our newer technologies such as AC-4 and Dolby Atmos. We are also focused on increased adoption of DD+ in emerging markets such as China and India, where the HDTV transition is still underway, by working with country-specific operators and standards bodies to drive broader adoption.
We continue to see new products introduced in the broadcast market that incorporate our leading audio technologies. Throughout fiscal 2018, the number of TVs with Dolby Atmos continued to grow from partners such as LG, Skyworth, and Changhong, among others. We also continue to see more TVs available with Dolby Atmos and Dolby Vision.
Along with new product introductions, the availability of content in Dolby formats expanded in streaming and live broadcast. Dolby Atmos is offered through streaming OTT providers such as Apple, Netflix, Tencent, and iQiYi. In live broadcast, BT and SkySports delivered Premier League Football throughout the year, and Comcast and DirectTV delivered portions of the 2018 Winter Olympics in Dolby Atmos. Additionally, the World Cup was carried in Dolby Atmos by various broadcasters in Brazil, Russia, and China, among others. In September 2018, NBC began airing all of the University of Notre Dame home football games in Dolby Atmos in the United States.
Key Challenges: Our pursuit of growth and further adoption in emerging markets where conversion to digital television is still underway will be impacted by a number of factors. In some emerging growth countries, such as China, we face difficulties enforcing our contractual and IP rights, including instances in which our licensees fail to accurately report the shipment of products using our technologies. We must continue to present compelling reasons for consumers to demand our audio technologies. To the extent that OEMs do not incorporate our technologies in current and future products, our revenue could be impacted. Additionally, in the broadcast market, as well as other markets, we also face geopolitical challenges including changes in diplomatic and trade relationships, trade protection measures, and import or export licensing requirements.
Consumer Electronics
Highlights: We have an established presence in the home theater market that provides compatibility across devices, such as AVRs and DMAs, through the inclusion of our DD+ technologies. Additionally, the adoption of Dolby Atmos continues to expand amongst devices such as soundbars and home theater systems.
30
We now have over 15 Atmos soundbar partners, including products from Vizio, LG, and Sony with price points starting below $500. These hardware offerings can be paired with a growing array of Dolby enabled content via OTT services and Blu-ray discs, and the lower price points make the technology available to a broader range of consumers.
During the year, Apple began supporting Dolby Atmos and Dolby Vision on Apple TV 4K and iTunes, while Amazon began streaming Dolby Atmos content to Fire TV and Fire TV Cube.
Key Challenges: We must continue to present compelling reasons for consumers to demand our technologies wherever they enjoy entertainment content. To the extent that OEMs do not incorporate our technologies in current and future products, our revenue could be impacted.
Mobile
Highlights: We continue to focus on adoption of our technologies across major mobile ecosystems such as Apple, Android, Windows, and Amazon. In addition, HE-AAC is a de facto audio standard across mobile devices.
Throughout fiscal 2018, the availability of Dolby-Atmos enabled mobile devices gained momentum from a growing list of partners such as Amazon, Lenovo, ZTE, and Razer. Samsung and Huawei released the first mobile phones featuring Dolby Atmos, and then expanded the number of models supported beyond their flagship lines. Both partners ran trials of live-streaming matches from the French Open to their phones in Dolby Atmos. Also during the year, Lenovo launched a new series of Dolby Atmos-enabled tablets with price points starting at $100, while Sharp released the first mobile phone in Japan with both Dolby Atmos and Dolby Vision.
Key Challenges: Growth in this market is dependent on several factors. Due to short product life cycles, mobile device OEMs can easily add or remove certain of our technologies from their devices. Our success depends on our ability to address the rapid pace of change in mobile devices, and we must continuously collaborate with mobile device OEMs to incorporate our technologies. Finally, we must continue to support the development and distribution of Dolby content via various ecosystems.
Personal Computers
Highlights: DD+ continues to enhance playback in both Mac and Windows operating systems, including native support in their respective Safari and Microsoft Edge browsers. Dolby's presence in these browsers enables us to reach more users through new types of content, including streaming video entertainment.
During fiscal 2018, the number of PCs available with Dolby Atmos continued to expand from partners such as Huawei, Xiaomi, and Lenovo. We also partnered with Lenovo to develop the world's first laptop featuring the combined experience of Dolby Vision and the Dolby Atmos Speaker System.
Key Challenges: PC revenues have been impacted by a decline in the portion of PCs that have optical disc functionality which has resulted in a decline in our ASPs. We must continuously collaborate with PC manufacturers to incorporate our technologies, and we must continue to support the development and distribution of Dolby content via various ecosystems. If these conditions and trends persist, and OEMs do not incorporate our technologies in current and future products, our PC revenues could face continuing downward pressure.
Other
Highlights: DD+ is incorporated in both the Xbox and PlayStation gaming consoles and platforms. In addition, Dolby Atmos is enabled for Windows and Xbox One, which enables playback on devices such as Dolby Atmos soundbars and AVRs. Also, customers can purchase an OEM gaming headset bundled with Dolby Atmos for Headphones, or an app on the Microsoft app store to enable Dolby Atmos on their headphones. Six Dolby Atmos-titles from major game publishers are currently available on the Xbox One.
We also generate revenue from the automotive industry primarily through disc playback devices as well as other elements of the entertainment system.
Key Challenges: The gaming console market continues to be challenged by competition from mobile devices and gaming PCs, which have faster refresh cycles and appeal to a broader consumer base. This may adversely impact our future revenues.
31
PRODUCTS AND SERVICES
We also generate revenue by providing products and services for a variety of applications in the cinema, broadcast, and communications markets.
Highlights: We offer servers and audio processors to enable the playback of content in cinemas. We continue to see adoption of Dolby Atmos by studios, content creators, post-production facilities, and exhibitors. As of the end of fiscal 2018, there were over 4,000 Dolby Atmos-enabled screens installed, and over 1,000 Dolby Atmos theatrical titles announced or released.
We also offer a variety of newer cinema products, which include the IMS3000, an integrated imaging and audio server with Dolby Atmos, the Dolby Multichannel Amplifier, and our 3-Axis speaker. These products allow us to offer exhibitors a more complete Dolby Atmos solution that is potentially more cost effective than what was previously available to them.
Key Challenges: Demand for our cinema products is dependent upon industry and economic cycles and box office performance generally, along with our ability to develop and introduce new technologies, further our relationships with content creators, and promote new cinematic audio and imaging experiences. A significant portion of our growth opportunity lies in the China market, which is subject to economic risks as well as geo-political risks. To the extent that we do not make progress in these areas, or are faced with pricing pressures or competing technologies, our revenue may be adversely affected.
EXPANDING INTO NEW AUDIO AND VISUAL EXPERIENCES
Our new growth initiatives include Imaging Licensing (comprised of Dolby Vision and our patent licensing initiatives related to consumer imaging), Dolby Cinema, and Dolby Voice. Revenue associated with these offerings has continued to grow in fiscal 2018. Key highlights during fiscal 2018 and future challenges related to these initiatives are described below.
Imaging Licensing
Highlights: Dolby Vision is our end-to-end high-dynamic range solution that is included in TVs, STBs, Blu-ray players, smartphones, tablets, DMAs, PCs, and gaming consoles. Our HEVC and AVC imaging technologies offer efficient delivery of video content across a variety of devices, and we continue to see expanded adoption of our HEVC technologies, primarily in the broadcast and mobile markets.
During fiscal 2018, we continued to see a growing number of TVs that include Dolby Vision, with increasing inclusion in mid-tier TVs with price points starting at $350. Dolby Vision is included in Apple's iPhone X, iPhone 8, iPad Pro, and Apple TV 4K, as well as other devices such as UHD Bly-ray players, tablets, DMAs, and PCs.
The availability of content in Dolby Vision continues to grow. There are movie titles and original TV content available in Dolby Vision through our OTT streaming partners, which include Netflix, iTunes, Amazon, Vudu, Tencent, and iQiYi. Currently, iTunes has over 350 movies available in Dolby Vision, and Netflix has over 400 hours of original content in Dolby Vision. In September 2018, Tencent streamed the first live sporting event in Dolby Vision.
In fiscal 2018, we saw increasing availability of devices that offer the combined Dolby Atmos and Dolby Vision experience globally. At this year's CES, LG announced the inclusion of both Dolby Atmos and Dolby Vision in their 2018 OLED and Super UHD TVs. Other TV partners now offering a combined Dolby Atmos and Dolby Vision experience include TCL, Hisense, Changhong, and Skyworth, among others.
The Apple TV 4K became the first DMA supporting both Dolby Atmos and Dolby Vision, and, the first mobile phone supporting both Dolby Atmos and Dolby Vision was launched by Sharp in Japan. Other products supporting both Dolby Atmos and Dolby Vision announced during the year include Amazon's Fire TV Stick 4K, the first STB by Orange, a laptop from Lenovo, and select Xbox devices by Microsoft.
The distribution of content available in the combined format of Dolby Atmos and Dolby Vision also grew this year with support from leading OTT providers around the world, including Netflix, iTunes, Amazon, Tencent, Rakuten, and iQiYi. Currently, iTunes has over 170 titles available in the combined format of Dolby Atmos and Dolby Vision.
32
Key Challenges: The success of Dolby Vision and our consumer imaging patent licensing initiatives will depend on a number of factors, such as the breadth of available Dolby Vision content, the rate of adoption of our technologies into mainstream consumer device models, and the level of competition from alternative technologies.
Dolby Cinema
Highlights: In fiscal 2018, we continued to expand our global presence for Dolby Cinema by adding several new exhibitor partnerships in Europe, Japan, and China.
At the end of fiscal 2018, we had approximately 170 Dolby Cinema locations in operation, compared to approximately 115 a year ago. We have over 390 Dolby Cinema locations open or committed around the world. The content pipeline for Dolby Cinema continues to grow with over 190 theatrical titles with Dolby Vision and Dolby Atmos having been announced or released from every major studio.
Key Challenges: Although the premium large format market for the cinema industry is currently growing, Dolby Cinema is in competition with other existing offerings. Our success depends on our ability to differentiate our offering, deploy new sites in accordance with plans, and attract and retain a global viewing audience. In addition, the success of our Dolby Cinema offering will be tied to the pipeline and success of motion pictures available at Dolby Cinema locations and box office performance generally.
Dolby Voice
Highlights: In fiscal 2018, we launched our newest offering, Dolby Voice Room, our video conferencing solution for huddle rooms and small conference rooms that combines a camera product with the Dolby Conference Phone. Dolby Voice Room creates an experience that more closely resembles an in-person meeting by coupling the benefits of the Dolby Voice audio quality with new innovations in the video experience. In addition, Dolby Voice Room is designed to be easy to set up and use. Our first go-to-market partners for Dolby Voice Room, which began shipping during the year, are BlueJeans and Highfive, two of our current Dolby Voice partners. We continue to focus on expanding Dolby Voice’s availability to the global market for audio and video conferencing services with Dolby Voice Room which will address a broader set of customers in the growing huddle room space.
Key Challenges: Our success in this market will depend on the number of service providers and enterprise customers we are able to attract from competing conferencing service providers, the volume of products that we are able to sell, and the volume of usage of the service.
Dolby Dimension
More recently, on November 14, 2018, we also introduced Dolby Dimension™, a wireless headphone that will provide consumers with an innovative way to experience shows, movies, and music at home. Dolby Dimension features our Dolby LifeMix™ proprietary technology, which allows consumers to control how much they hear of their surroundings—experiencing cinematic sound while hearing as much or as little from their surroundings as desired with optimal balance and clarity. While Dolby Dimension was not previously announced, the anticipated revenue and operating expenses related to this initiative were factored into our previously released financial guidance for fiscal 2019.
Revenue From Significant Customers
In fiscal 2018, 2017, and 2016, we did not have any individual customers whose revenue exceeded 10% of our total revenue.
CRITICAL ACCOUNTING POLICIES AND ESTIMATES
Our consolidated financial statements and accompanying notes are prepared in accordance with U.S. GAAP, pursuant to SEC rules and regulations. The preparation of these financial statements requires us to establish accounting policies and make certain estimates and assumptions that affect the reported amounts of assets and liabilities, revenue and expenses. The SEC considers an accounting policy and estimate to be critical if it is both important to a company’s financial condition or results of operations and requires significant judgment by management in its application. On a regular basis, we evaluate our assumptions, judgments, and estimates, and historically, actual results have not differed significantly from them. If actual results or events differ materially from our judgments and estimates, our reported financial condition and results of operation for future periods could be materially affected. We have reviewed the selection and development of the critical accounting policies and estimates discussed below with the Audit Committee of our Board of Directors.
33
Revenue Recognition
We recognize revenue when persuasive evidence of an arrangement exists, we have delivered the product or performed the service, the fee is fixed or determinable, and collection is probable. Determining whether and when these criteria have been satisfied may involve assumptions and judgments that can have a significant impact on the timing and amount of revenue we report.
Revenue recognition for transactions may include multiple elements such as hardware and accompanying software, upgrade rights, support, maintenance, and extended warranty services, and rights to receive commissioning services in connection with certain digital servers. For those transactions that contain multiple elements, we:
• | Identify the deliverables (or elements) within the arrangements and determining whether they represent separate units of account. An element constitutes a separate unit of account when it has standalone value and delivery of an undelivered element is both probable and within our control. When these criteria are not met, the delivered and undelivered elements are combined and accounted for together. |
• | Determine a standalone selling price (whether VSOE, TPE, or ESP) for the separate units of account. Where we determine a standalone selling price using ESP, we estimate the selling price by considering actual sales prices if we sell the element on a standalone basis. Otherwise, we estimate the selling price by considering internal factors such as pricing practices and margin objectives. Consideration is also given to market conditions such as competitor pricing strategies, customer demands, and industry technology lifecycles. |
• | Estimate, for certain arrangements, the period of time over which revenue should be recognized when there is no stated term over which the customer may benefit from the contract. |
Income Taxes
We make estimates and judgments that affect our accounting for income taxes. These include estimating temporary differences from differing treatment of items for tax and accounting purposes, future taxable income, uncertainties in tax positions, and interpretations of current and changes to current tax laws. These differences result in deferred tax assets and liabilities which are included in our consolidated balance sheets. We recognize tax benefits from uncertain tax positions only if it is more likely than not that the tax position will be sustained on examination by the taxing authorities, based on the technical merits of the position. The tax benefits recognized in the financial statements from such positions are then measured based on the largest benefit that has a greater than 50% likelihood of being realized upon ultimate settlement. We also assess the likelihood that our deferred tax assets will be recovered from future taxable income, and to the extent that we believe that recovery is not likely, we establish a valuation allowance. Lastly, we are subject to the review of our income tax returns by the IRS and other tax authorities in the U.S. and abroad. We periodically assess the likelihood of adverse outcomes from these examinations to determine the adequacy of our provision for income taxes.
The Tax Act, which was enacted on December 2017, significantly changed existing U.S. tax laws and introduced new provisions that affected our business and required that we make preliminary estimates that significantly affected our reported income tax expense. The Tax Act, among other things, includes a permanent reduction in the corporate income tax rate from 35% to 21% and a one-time transition tax on unrepatriated foreign earnings. Other significant provisions that will impact our income taxes effective for our fiscal year 2019 include: an exemption from U.S. federal tax on dividends of future foreign earnings, an incremental tax on excessive amounts paid to foreign related parties, and a minimum tax on certain low taxed foreign earnings.
The Tax Act requires complex computations to be performed that were not previously required in U.S. tax law. It also requires that we make significant judgments and estimates in interpreting its provisions. The U.S. Treasury Department, the Internal Revenue Service, and other standard-setting bodies could interpret or issue guidance on how provisions of the Tax Act should be applied or otherwise administered that is different from our interpretation. In addition, further legislative action could be taken to address questions or issues caused by the Tax Act. As we continue our analysis of the Tax Act and its related interpretations, collect and prepare necessary data, and interpret additional guidance that may be issued, we may be required to materially adjust amounts that we have recorded thereby impacting our results of operations and financial condition. Additionally, state and foreign governments may enact tax laws in response to the Tax Act or other global initiatives requiring further judgments and estimates to be made resulting in potentially material changes to our income tax expense, results of operations, and financial condition. Refer to Note 10 "Income Taxes" to our consolidated financial statements for further detail.
34
IMPACT OF NEW ACCOUNTING STANDARDS NOT YET ADOPTED
Revenue Recognition. In May 2014, the FASB issued ASU 2014-09, Revenue from Contracts with Customers (Topic 606), which outlines a comprehensive revenue recognition model and supersedes most current revenue recognition guidance. The new standard defines a five-step approach for recognizing revenue, which may require a company to use more judgment and make more estimates than under the current guidance. The new standard requires an entity to recognize as revenue the amount to which it expects to be entitled for the transfer of promised goods or services to customers, to capitalize certain direct costs associated with revenues and contract acquisition costs, and to provide expanded disclosures.
We have evaluated the impact of adopting Topic 606 on all of our revenue streams and believe that the most significant changes to our revenue recognition policies as compared to Topic 605 are as follows:
• | Estimating variable consideration, including royalty-based revenue for which we will record revenue earned from our licensees’ shipments in the same period in which those shipments occurred, rather than recognizing our revenue in the quarter in which licensees report to us, which is typically in the quarter after those shipments have occurred; |
• | Specified performance obligations for which we have not historically had VSOE and which resulted in the deferral of revenue balances may accelerate revenue recognition as VSOE for the undelivered elements is no longer required to separately recognize revenue for the delivered elements; |
• | For certain transactions that have minimum commitment or fixed fee terms, recognizing licensing revenues on contract execution instead of as payments become due; |
• | Recording a one-time adjustment to retained earnings to reflect the cumulative impact of the changes noted above for the period prior to adoption. |
The new standard was effective for Dolby on September 29, 2018, being the beginning of our first quarter of fiscal 2019. We adopted Topic 606 using the full retrospective method whereby the standard was applied to all periods presented as if it had been applied historically. Although we are still evaluating the impact of adopting Topic 606 on all of our revenue streams for fiscal 2018 and 2017, our preliminary estimate is that fiscal 2018 revenue as recast under Topic 606 will be approximately $1.1 billion, as compared to $1.2 billion as reported under Topic 605. The difference between this preliminary estimate of our recast fiscal 2018 revenue and the amount of revenue we reported under Topic 605 for that period is due mostly to revenue that is expected to shift back into previous periods and, to a lesser extent, the impact of certain contract modifications. We expect to complete our procedures and finalize the recast of our fiscal 2018 and 2017 revenues in the first quarter of fiscal 2019.
The above-mentioned changes may also result in changes to our reported income tax expense in the prior recast reporting period.
In preparation for reporting financial results under Topic 606, we have implemented key system functionalities and will continue to address the impact of the new standard and its expanded disclosure requirements on our policies, processes, and controls.
Leases. In February 2016, the FASB issued ASU 2016-02, Leases (Topic 842), which amends the existing accounting standards for leases. Under the new guidance, a lessee will be required to recognize a lease liability and right-of-use asset for most leases. The new guidance also modifies the classification criteria and accounting for sales-type and direct financing leases, and requires additional disclosures to enable users of financial statements to understand the amount, timing, and uncertainty of cash flows arising from leases. Topic 842 must be applied using a modified retrospective approach. Upon adoption, we will recognize a lease liability and right-of-use asset for each of our lease arrangements, which exceed 70 as of September 28, 2018. We anticipate adoption of the standard will not have a material impact on our consolidated income statements. We plan to elect the practice expedients upon transition that will retain the lease classification and initial direct costs for any leases that exist prior to adoption of the standard. We will not reassess whether any contracts entered into prior to adoption are leases. We are in the process of evaluating our existing lease contracts and implementing changes to our systems. ASU 2016-02 is effective for Dolby beginning September 28, 2019, and we do not currently plan to early adopt.
Financial Instruments. In January 2016, the FASB issued ASU 2016-01, Financial Instruments - Overall (Subtopic 825-10): Recognition and Measurement of Financial Assets and Financial Liabilities. The new guidance requires certain equity investments that are not consolidated or accounted for under the equity method of accounting to be measured at fair value with changes in fair value recognized in net income. Additionally, an entity may choose to measure equity investments that do not have readily determinable fair values at cost minus impairment, if any, plus or minus changes resulting from observable price changes in orderly transactions for the identical or a similar investment
35
of the same issuer. The ASU is effective for Dolby beginning September 29, 2018. We do not anticipate that the new standard will materially impact our consolidated financial statements.
Cash Flow Classification. In August 2016, the FASB issued ASU 2016-15, Statement of Cash Flows (Topic 230): Classification of Certain Cash Receipts and Cash Payments. The new guidance addresses eight specific cash flow issues, with the objective of reducing an existing diversity in practices regarding the manner in which certain cash receipts and payments are presented and classified in the statement of cash flows. The ASU is effective for Dolby beginning September 29, 2018. We do not anticipate that the new standard will materially impact our consolidated financial statements.
Income Taxes: Intra-Entity Asset Transfers. In October 2016, the FASB issued ASU 2016-16, Income Taxes (Topic 740): Intra-Entity Transfers of Assets Other Than Inventory. The new guidance requires the recognition of the income tax consequences of an intercompany asset transfer, other than transfers of inventory, when the transfer occurs. For intercompany transfers of inventory, the income tax effects will continue to be deferred until the inventory has been sold to a third party. The ASU is effective Dolby us beginning September 29, 2018. We do not anticipate that the new standard will materially impact our consolidated financial statements.
Restricted Cash. In November 2016, the FASB issued ASU 2016-18, Restricted Cash - a consensus of the FASB Emerging Issues Task Force, which clarifies how entities should present restricted cash and restricted cash equivalents in the statement of cash flows. The new guidance requires entities to show the changes in the total of cash, cash equivalents, restricted cash and restricted cash equivalents in the statement of cash flows. The ASU is effective for Dolby beginning September 29, 2018. Aside from conforming to new cash flow presentation and restricted cash disclosure requirements, we do not anticipate that the new standard will materially impact our consolidated financial statements.
Accounting for Hedging Activities. In August 2017, the FASB issued ASU 2017-12, Derivatives and Hedging (Topic 815): Targeted Improvements to Accounting for Hedging Activities, which enables entities to better portray the economics of their risk management activities in the financial statements while enhancing the transparency and understandability of hedge results. The new guidance eliminates the requirement to separately measure and report hedge ineffectiveness. The ASU is effective for Dolby beginning September 29, 2018. We do not anticipate that the new standard will materially impact our consolidated financial statements.
Income Taxes: Comprehensive Income. On December 22, 2017, the U.S. government enacted comprehensive tax legislation commonly referred to as the Tax Cuts and Jobs Act ("Tax Act"). In February 2018, the FASB issued ASU 2018-02, Income Statement - Reporting Comprehensive Income (Topic 220): Reclassification of Certain Tax Effects From Accumulated Other Comprehensive Income, which allows a reclassification from accumulated other comprehensive income to retained earnings for stranded tax effects resulting from the Tax Act and requires entities to provide certain disclosures regarding stranded tax effects. The ASU is effective for Dolby beginning September 28, 2019, and we do not currently plan to early adopt. We are currently evaluating the timing and impact of the standard on our consolidated financial statements.
Collaborative Arrangements. In November 2018, the FASB issued ASU 2018-18, Collaborative Arrangements (Topic 808): Clarifying the Interaction between Topic 808 and Topic 606, which clarifies that certain transactions between participants in a collaborative arrangement should be accounted for under ASC 606 when the counterparty is a customer. In addition, ASU 2018-18 precludes an entity from presenting consideration from a transaction in a collaborative arrangement as revenue from contracts with customers if the counterparty is not a customer for that transaction. This guidance will be effective for Dolby beginning September 29, 2020, and we do not currently plan to early adopt. We do not believe that this guidance will have a material impact on our consolidated financial position, results of operation and cash flows.
36
RESULTS OF OPERATIONS
For each line item included on our consolidated statements of operations described and analyzed below, the significant factors identified as the leading drivers contributing to the overall fluctuation are presented in descending order of their impact on the overall change (from an absolute value perspective). Note that recovery payments received from licensees either in the form of back payments or settlements are collectively referred to as "recoveries."
Our annual fiscal reporting periods generally consist of 52 weeks. However, our fiscal year ended September 30, 2016 consisted of 53 weeks. The occurrence of an additional week during the fiscal year ended September 30, 2016 results in proportionately higher operating expenses related to compensation, depreciation, and amortization that are not entirely offset by incremental revenue that may have been earned during the additional week.
Revenue and Gross Margin
Licensing
Licensing revenue consists of fees earned from licensing our technologies to customers who incorporate them into their products and services to enable and enhance audio, imaging, and voice capabilities. The technologies that we license are either internally developed, acquired, or licensed from third parties. Our cost of licensing consists mainly of amortization of purchased intangible assets and intangible assets acquired in business combinations, third party royalty obligations, and direct fees incurred.
Fiscal Year Ended | 2018 vs. 2017 | 2017 vs. 2016 | |||||||
Licensing | September 28, 2018 | September 29, 2017 | September 30, 2016 | $ | % | $ | % | ||
Revenue | $1,057,606 | $965,792 | $917,032 | $91,814 | 10% | $48,760 | 5% | ||
Percentage of total revenue | 90% | 89% | 89% | ||||||
Cost of licensing | 43,492 | 39,216 | 28,333 | 4,276 | 11% | 10,883 | 38% | ||
Gross margin | 1,014,114 | 926,576 | 888,699 | 87,538 | 9% | 37,877 | 4% | ||
Gross margin percentage | 96% | 96% | 97% | ||||||
2018 vs. 2017
Factor | Revenue | Gross Margin | ||
Mobile | á | Higher adoption of our technologies into more devices, higher patent licensing, and recoveries | ßà | No significant fluctuations |
PC | â | Lower recoveries and lower ASP from decreasing number of PCs with optical disc functionality, partially offset by higher patent licensing | ||
CE | á | Higher patent licensing and higher volume of DMAs, partially offset by lower volume of DVDs | ||
Other | á | Higher patent licensing, revenue from Dolby Cinema, and Via administrative fees, partially offset by lower recoveries in automotive | ||
Broadcast | â | Lower volume of STBs and lower recoveries, offset by higher patent licensing and volume of TVs | ||
2017 vs. 2016
Factor | Revenue | Gross Margin | ||
Other | á | Higher revenues from automotive recoveries and Dolby Cinema | â | Increase in cost of licensing primarily due to higher fees, depreciation of Dolby Cinema equipment, and amortization of acquired assets. |
Mobile | á | Higher revenues from patent licensing and recoveries | ||
CE | á | Higher revenues from recoveries, patent licensing, and higher volumes of DMAs and soundbars, partially offset by lower volumes of DVD players and HTIBs, and pricing | ||
PC | â | Decrease due to timing of revenue under contractual arrangements, partially offset by higher volume and higher revenues from patent licensing and recoveries | ||
Broadcast | ßà | Higher volume of STBs and higher revenues from patent licensing, offset by lower recoveries, lower volume of TVs, and pricing | ||
37
Products
Products revenue is generated from the sale of audio, imaging, and voice products for the cinema, television broadcast, and communications industries. Cost of products consists of materials, labor, and manufacturing overhead, amortization of certain intangible assets, as well as third party royalty obligations.
Fiscal Year Ended | 2018 vs. 2017 | 2017 vs. 2016 | |||||||
Products | September 28, 2018 | September 29, 2017 | September 30, 2016 | $ | % | $ | % | ||
Revenue | $94,552 | $95,290 | $90,543 | $(738) | (1)% | $4,747 | 5% | ||
Percentage of total revenue | 8% | 9% | 9% | ||||||
Cost of products | 65,292 | 61,256 | 64,853 | 4,036 | 7% | (3,597) | (6)% | ||
Gross margin | 29,260 | 34,034 | 25,690 | (4,774) | (14)% | 8,344 | 32% | ||
Gross margin percentage | 31% | 36% | 28% | ||||||
2018 vs. 2017
Factor | Revenue | Gross Margin | ||
Products | ßà | No significant fluctuations | â | Lower utilization of manufacturing capacity and higher excess & obsolete charges, partially offset by improved mix of products |
2017 vs. 2016
Factor | Revenue | Gross Margin | ||
Products | á | Higher units of digital server and audio products, partially offset by lower volume of 3D glasses | á | Higher utilization of manufacturing capacity and improved mix of products, partially offset by higher excess & obsolete charges |
Services
Services revenue consists of fees for production and licensing services, maintenance and support, mixing room alignment, equalization, as well as audio, color, and light image calibration. Cost of services consists of personnel and personnel-related costs for providing our professional services, software maintenance and support, external consultants, and other direct expenses incurred on behalf of customers.
Fiscal Year Ended | 2018 vs. 2017 | 2017 vs. 2016 | |||||||
Services | September 28, 2018 | September 29, 2017 | September 30, 2016 | $ | % | $ | % | ||
Revenue | $19,766 | $20,372 | $18,163 | $(606) | (3)% | $2,209 | 12% | ||
Percentage of total revenue | 2% | 2% | 2% | ||||||
Cost of services | 19,476 | 17,835 | 15,796 | 1,641 | 9% | 2,039 | 13% | ||
Gross margin | 290 | 2,537 | 2,367 | (2,247) | (89)% | 170 | 7% | ||
Gross margin percentage | 1% | 12% | 13% | ||||||
2018 vs. 2017
Factor | Revenue | Gross Margin | ||
Support & Other | â | Decreased support and maintenance services | â | Lower utilization of available capacity |
2017 vs. 2016
Factor | Revenue | Gross Margin | ||
Configuration & Post-Production | á | Higher mastering services | No significant fluctuations | |
Support & Other | â | Decreased support and maintenance services | ||
38
Operating Expenses
Research and Development
R&D expenses consist primarily of employee compensation and benefits expenses, stock-based compensation, consulting and contract labor costs, depreciation and amortization, facilities costs, costs for outside materials, and information technology expenses.
Fiscal Year Ended | 2018 vs. 2017 | 2017 vs. 2016 | |||||||
September 28, 2018 | September 29, 2017 | September 30, 2016 | $ | % | $ | % | |||
Research and development | $236,794 | $233,312 | $219,607 | $3,482 | 1% | $13,705 | 6% | ||
Percentage of total revenue | 20% | 22% | 21% | ||||||
2018 vs. 2017
Category | Key Drivers | |
Facilities | á | Higher costs associated with our worldwide headquarters |
Depreciation & Amortization | â | Lower depreciation as certain assets have been fully depreciated |
Compensation & Benefits | á | Higher headcount on R&D projects along with merit increases across the employee base |
2017 vs. 2016
Category | Key Drivers | |
Compensation & Benefits | á | Higher headcount on R&D projects along with merit increases across the employee base |
Product Development | á | Increased funding of various research projects and initiatives aimed at developing new products and technologies |
Sales and Marketing
S&M expenses consist primarily of employee compensation and benefits expenses, stock-based compensation, marketing and promotional expenses for events such as trade shows and conferences, marketing campaigns, travel-related expenses, consulting fees, facilities costs, depreciation and amortization, information technology expenses, and legal costs associated with the protection of our IP.
Fiscal Year Ended | 2018 vs. 2017 | 2017 vs. 2016 | |||||||
September 28, 2018 | September 29, 2017 | September 30, 2016 | $ | % | $ | % | |||
Sales and marketing | $309,802 | $296,661 | $295,267 | $13,141 | 4% | $1,394 | —% | ||
Percentage of total revenue | 26% | 27% | 29% | ||||||
2018 vs. 2017
Category | Key Drivers | |
Legal, Professional, & Consulting | á | Increased IP related activities aimed at revenue generation |
Compensation & Benefits | á | Higher headcount and merit increases across the employee base |
Marketing Programs | á | Higher costs related to marketing efforts for growth initiatives |
2017 vs. 2016
Category | Key Drivers | |
Compensation & Benefits | á | Higher headcount and merit increases across the employee base |
Legal, Professional, & Consulting | á | Increased IP related activities aimed at revenue generation |
Depreciation & Amortization | â | Lower amortization from assets that have been fully amortized |
Stock-Based Compensation | â | Decrease in award grants |
Marketing Programs | â | Lower costs associated with select tradeshow activities |
39
General and Administrative
G&A expenses consist primarily of employee compensation and benefits expenses, stock-based compensation, depreciation, facilities and information technology costs, as well as professional fees and other costs associated with external consulting and contract labor.
Fiscal Year Ended | 2018 vs. 2017 | 2017 vs. 2016 | |||||||
September 28, 2018 | September 29, 2017 | September 30, 2016 | $ | % | $ | % | |||
General and administrative | $197,516 | $171,686 | $168,854 | $25,830 | 15% | $2,832 | 2% | ||
Percentage of total revenue | 17% | 16% | 16% | ||||||
2018 vs. 2017
Category | Key Drivers | |
Compensation & Benefits | á | Increase in headcount, merit increases, and higher employer costs |
Legal, Professional, & Consulting | á | Higher costs associated with various legal activities, patent filings, and implementing regulatory changes |
Stock-Based Compensation | á | Higher fair value of awards |
2017 vs. 2016
Category | Key Drivers | |
Compensation & Benefits | á | Increase in headcount and merit increases across the employee base |
Stock-Based Compensation | â | Decrease in award grants |
Restructuring
Restructuring charges recorded as operating expenses in our statements of operations represent costs associated with separate individual restructuring plans implemented in various fiscal periods. The extent of our costs arising as a result of these actions, including fluctuations in related balances between fiscal periods, is based on the nature of activities under the various plans.
Fiscal Year Ended | 2018 vs. 2017 | 2017 vs. 2016 | |||||||||||||
September 28, 2018 | September 29, 2017 | September 30, 2016 | $ | % | $ | % | |||||||||
Restructuring | $(446) | $12,856 | $1,233 | $ | (13,302 | ) | (103 | )% | $ | 11,623 | 943 | % | |||
Percentage of total revenue | —% | 1% | —% | ||||||||||||
Restructuring charges recorded in fiscal 2017 were incurred in relation to our fiscal 2017 restructuring plan, which was implemented during 2017 and represent costs to reduce certain activities in order to reallocate resources towards higher priority investment areas. Restructuring charges recorded in fiscal 2016 were incurred in relation to our fiscal 2016 restructuring plan implemented and completed within fiscal 2016 and represent costs to reorganize and consolidate certain strategic activities and positions within our global business infrastructure. These charges primarily related to severance and other related benefits provided to employees.
40
Other Income/Expense
Other income/(expense) primarily consists of interest income earned on cash and investments and the net gains/(losses) from foreign currency transactions, derivative instruments, and sales of marketable securities from our investment portfolio.
Fiscal Year Ended | 2018 vs. 2017 | 2017 vs. 2016 | |||||||
Other Income/Expense | September 28, 2018 | September 29, 2017 | September 30, 2016 | $ | % | $ | % | ||
Interest income | $18,970 | $9,577 | $5,684 | $9,393 | 98% | $3,893 | 68% | ||
Interest expense | (198) | (127) | (125) | (71) | 56% | (2) | 2% | ||
Other income/(expense), net | (5,903) | (1,438) | (1,450) | (4,465) | 311% | 12 | (1)% | ||
Total | $12,869 | $8,012 | $4,109 | $4,857 | 61% | $3,903 | 95% | ||
2018 vs. 2017
Category | Key Drivers | |
Interest Income | á | Higher yields on our increased investment balances |
Other Income/(Expense) | â | Increase in other expense primarily due to impairment charges recorded on cost method equity investments |
2017 vs. 2016
Category | Key Drivers | |
Interest Income | á | Higher yields on our increased investment balances |
Other Income/(Expense) | ßà | Increase in other expense due to an impairment charge recorded on a cost method investment, offset by lower foreign currency translation losses and other expenses |
Income Taxes
Our effective tax rate is based on our annual fiscal year results and is affected each period-end by several factors. These include changes in our projected fiscal year results, recurring items such as tax rates and relative income earned in foreign jurisdictions, as well as discrete items such as changes to our uncertain tax positions that may occur in, but are not necessarily consistent, between periods. Our fiscal 2018 income tax provision reflects amounts accrued in connection with the Tax Act enacted in December 2017. For additional information related to effective tax rates, see Note 10 “Income Taxes” to our consolidated financial statements.
Fiscal Year Ended | |||
September 28, 2018 | September 29, 2017 | September 30, 2016 | |
Provision for income taxes | $(190,062) | $(54,217) | $(49,502) |
Effective tax rate | 61% | 21% | 21% |
2018 vs. 2017
Factor | Impact On Effective Tax Rate | |
Enactment of Tax Act | á | Higher tax provision for deemed repatriation and write-down of deferred tax assets offset by higher benefit for the reduction of the federal statutory rate |
Valuation Allowance | á | Higher tax provision reflecting valuation allowance for California R&D Tax Credits |
Stock-Based Compensation | â | Higher benefit related to the settlement of stock-based awards |
2017 vs. 2016
Factor | Impact On Effective Tax Rate | |
Foreign Operations | â | Increased benefit from foreign earned income |
Federal R&D Credits | á | Decreased benefit from federal R&D credits |
Tax Contingencies | á | Prior year benefit from the settlement of a state audit |
41
LIQUIDITY, CAPITAL RESOURCES, AND FINANCIAL CONDITION
Our principal sources of liquidity are cash, cash equivalents, and investments, as well as cash flows from operations. We believe that these sources will be sufficient to satisfy our currently anticipated cash requirements through at least the next twelve months. As of September 28, 2018, we had cash and cash equivalents of $918.1 million, which mainly consisted of cash and highly-liquid money market funds. In addition, we had short and long-term investments of $365.9 million, which consisted primarily of municipal debt securities, certificates of deposit, government bonds, commercial paper, corporate bonds, and U.S. agency securities.
As a result of the Tax Act enacted in December 2017, we have an obligation to pay a one–time transition tax of approximately $71.8 million payable interest–free over eight years. However, we now have access to cash held by our foreign subsidiaries without a significant tax cost. During the fiscal year, we repatriated $450 million of foreign subsidiary earnings which were exempt from foreign withholding tax. Future repatriation of cash and other property held by our foreign subsidiaries will generally not be subject to U.S. federal tax.
The following table presents selected financial information as of the fiscal years ended September 28, 2018 and September 29, 2017 (amounts displayed are in thousands):
September 28, 2018 | September 29, 2017 | ||||||
Cash and cash equivalents | $ | 918,063 | $ | 627,017 | |||
Short-term investments | 178,138 | 247,757 | |||||
Long-term investments | 187,782 | 314,364 | |||||
Accounts receivable, net | 137,151 | 73,750 | |||||
Accounts payable and accrued liabilities | 245,516 | 221,407 | |||||
Working capital | 1,029,827 | 765,661 | |||||
Capital Expenditures and Uses of Capital
Our capital expenditures consist of purchases of land, building, building fixtures, laboratory equipment, office equipment, computer hardware and software, leasehold improvements, and production and test equipment. Included in capital expenditures are amounts associated with Dolby Cinema locations. We continue to invest in S&M and R&D to promote the overall growth of our business and technological innovation.
Asset Acquisition. During the first quarter of fiscal 2016, we completed an asset purchase of a patent portfolio that fits within our patent licensing programs for total consideration of $105.0 million.
We retain sufficient cash holdings to support our operations, and we also purchase investment grade securities diversified among security types, industries, and issuers. We have used cash generated from our operations to fund a variety of activities related to our business in addition to our ongoing operations, including business expansion and growth, acquisitions, and repurchases of our Class A common stock. We have historically generated significant cash from operations. However these cash flows and the value of our investment portfolio could be affected by various risks and uncertainties, as described in Part I, Item 1A “Risk Factors.”
Shareholder Return
We have returned cash to stockholders through both repurchases of Class A common stock under our repurchase program initiated in fiscal 2010 and our quarterly dividend program initiated in fiscal 2015. Refer to Note 7 "Stockholders' Equity & Stock-Based Compensation" of our consolidated financial statements for a summary of dividend payments made under the program during fiscal 2018 and additional information regarding our stock repurchase program.
Stock Repurchase Program. Our stock repurchase program was approved in fiscal 2010, and since then we have completed approximately $1.3 billion of stock repurchases under the program.
Quarterly Dividend Program. Under our cash dividend program for our stockholders, during fiscal 2018 quarterly dividends of $0.16 per share were paid on our Class A and Class B common stock to eligible stockholders of record for each respective dividend record date. On October 24, 2018, we announced an increase in the dividend amount to $0.19 per share, payable on November 14, 2018, to stockholders of record as of the close of business on November 5, 2018.
42
Cash Flows Analysis
For the following comparative analysis performed for each of the sections of the statement of cash flows, the significant factors identified as the leading drivers contributing to the fluctuation are presented in descending order of their impact relative to the overall change (amounts displayed in thousands, except as otherwise noted).
Operating Activities
Fiscal Year Ended | ||||||
September 28, 2018 | September 29, 2017 | |||||
Net cash provided by operating activities | $ | 352,202 | $ | 377,793 | ||
Net cash provided by operating activities decreased $25.6 million in fiscal 2018 compared to fiscal 2017, primarily due to the following:
Factor | Impact On Cash Flows | |
Working Capital | á | Higher inflows primarily due to increase in cash and cash equivalents |
Income Taxes, Net | á | Higher long term tax liabilities due to impact of the Tax Act |
Net Income | â | Net loss in Q1 fiscal 2018 due to impact of the Tax Act |
Investing Activities
Fiscal Year Ended | ||||||
September 28, 2018 | September 29, 2017 | |||||
Net cash provided by (used in) investing activities | $ | 78,250 | $ | (161,732 | ) | |
Capital expenditures | (72,814 | ) | (99,617 | ) | ||
Net cash provided by/(used in) investing activities increased $240.0 million in fiscal 2018 compared to fiscal 2017, primarily due to the following:
Factor | Impact On Cash Flows | |
Proceeds From Investments | á | Higher inflows from the sale & maturities of marketable investment securities |
Purchase of Investments | á | Lower outflows for the purchase of marketable investment securities |
Capital Expenditures | á | Lower expenditures for PP&E |
Business Combinations | â | Higher expenditures for business acquisitions completed during the fiscal year |
Financing Activities
Fiscal Year Ended | ||||||
September 28, 2018 | September 29, 2017 | |||||
Net cash used in financing activities | $ | (133,629 | ) | $ | (106,831 | ) |
Repurchase of common stock | (150,470 | ) | (100,000 | ) | ||
Net cash used in financing activities was $26.8 million higher in fiscal 2018 compared to fiscal 2017, primarily due to the following:
Factor | Impact On Cash Flows | |
Share Repurchases | â | Higher outflows resulting from increases in common stock repurchases |
Common Stock Issuance | á | Higher cash inflows from increased employee stock option exercises |
Dividend Payments | â | Higher outflows for payments of our quarterly cash dividend to common stockholders primarily as a result of a $0.02 per share increase in dividends compared to the prior fiscal year |
43
Off-Balance Sheet Arrangements and Contractual Obligations
As of September 28, 2018, we did not engage in off-balance sheet financing arrangements other than operating leases for office space and computer equipment, and the following table presents a summary of our contractual obligations and commitments as of that date (in thousands):
Payments Due By Fiscal Period | |||||||||||||||
1 Year | 2 - 3 Years | 4 - 5 Years | More Than 5 Years | Total | |||||||||||
Naming rights | $ | 7,811 | $ | 15,917 | $ | 16,317 | $ | 78,656 | $ | 118,701 | |||||
Operating leases | 17,117 | 25,893 | 19,207 | 19,928 | 82,145 | ||||||||||
Purchase obligations | 58,449 | 23,321 | 333 | — | 82,103 | ||||||||||
Donation commitments | 8,275 | 394 | 194 | 761 | 9,624 | ||||||||||
Total | $ | 91,652 | $ | 65,525 | $ | 36,051 | $ | 99,345 | $ | 292,573 | |||||
Naming Rights. In fiscal 2012, we entered into an agreement for naming rights and related benefits with respect to the Dolby Theatre in Hollywood, California, the location of the Academy Awards. The term of the agreement is 20 years (beginning in fiscal 2012), over which we make payments on a semi-annual basis. Our payment obligations are conditioned in part on the Academy Awards being held and broadcast from the Dolby Theatre.
Operating Leases. Operating lease payments represent our commitments for future minimum rent made under non-cancelable leases for office space, including those payable to our principal stockholder and portions attributable to the controlling interests in our wholly owned subsidiaries.
Purchase Obligations. Our purchase obligations consist of agreements to purchase goods and services, entered into in the ordinary course of business. These represent non-cancelable commitments for which a penalty would be imposed if the agreement was canceled for any reason other than an event of default as described by the agreement.
Donation Commitments. Our donation commitments relate to non-cancelable obligations to the Museum of the Academy of Motion Picture Arts and Sciences in Los Angeles, California, and the Smithsonian Institution in Washington, DC. Our commitment to the Museum of the Academy of Motion Picture Arts and Sciences is for 15 years from its expected opening date in 2019, and the Smithsonian Institution is for the next 5 years. Both donation commitments consist of the installation of imaging and audio products in the theaters and providing maintenance services in exchange for various marketing, branding, and publicity benefits.
Unrecognized Tax Benefits. As of September 28, 2018, we had an accrued liability for unrecognized tax benefits without interest, penalties, and related deferred tax assets, totaling $102.0 million. We are unable to estimate when any cash settlement with a taxing authority might occur and, therefore, have not reflected these anticipated future outflows in the table above.
For additional details regarding our contractual obligations, see Note 12 “Commitments & Contingencies” to our consolidated financial statements.
Indemnification Clauses
We are party to certain contractual agreements under which we have agreed to provide indemnification of varying scope and duration to the other party relating to our licensed IP. Historically, we have not made any payments for these indemnification obligations and no amounts have been accrued in our consolidated financial statements with respect to these obligations. Since the terms and conditions of the indemnification clauses do not explicitly specify our obligations, we are unable to reasonably estimate the maximum potential exposure for which we could be liable. In addition, we have entered into indemnification agreements with our officers, directors, and certain employees, and our certificate of incorporation and bylaws contain similar indemnification obligations. For additional details regarding indemnification clauses within our contractual agreements, see Note 12 “Commitments & Contingencies” to our consolidated financial statements.
ITEM 7A. QUANTITATIVE AND QUALITATIVE DISCLOSURES ABOUT MARKET RISK
Interest Rate Sensitivity
As of September 28, 2018, we had cash and cash equivalents of $918.1 million, which consisted of cash and highly liquid money market funds. In addition, we had both short and long-term investments of $365.9 million, which consisted primarily of municipal debt securities, corporate bonds, government bonds, and U.S. agency securities. Our
44
investment policy is focused on the preservation of capital and support for our liquidity requirements. Under the policy, we invest in highly rated securities with a minimum credit rating of A- while limiting the amount of credit exposure to any one issuer other than the U.S. government. At September 28, 2018, the weighted-average credit quality of our investment portfolio was AA, with a weighted-average maturity of approximately thirteen months. We do not invest in financial instruments for trading or speculative purposes, nor do we use leveraged financial instruments. We utilize external investment managers who adhere to the guidelines of our investment policy.
The investments within our fixed-income portfolio are subject to fluctuations in interest rates, which could affect our financial position, and to a lesser extent, results of operations. Based on our investment portfolio balance as of September 28, 2018, hypothetical changes in interest rates of 1% and 0.5% would have an impact on the carrying value of our portfolio of approximately $3.6 million and $1.8 million, respectively.
Foreign Currency Exchange Risk
We maintain business operations in foreign countries, most significantly in Australia, China, Germany, the Netherlands, Poland and the United Kingdom. Additionally, a growing portion of our business is conducted outside of the U.S. through subsidiaries with functional currencies other than the U.S. dollar, most notably:
• | Australian Dollar |
• | British Pound |
• | Chinese Yuan |
• | Euro |
• | Indian Rupee |
• | Japanese Yen |
• | Korean Won |
• | Polish Zloty |
• | Russian Ruble |
• | Singapore Dollar |
• | Swedish Krona |
As a result, we face exposure to adverse movements in currency exchange rates as the financial results of our international operations are translated from local currency into U.S. dollars upon consolidation. The majority of our revenue generated from international markets is denominated in U.S. dollars, while the operating expenses of our foreign subsidiaries are predominantly denominated in local currencies. Therefore, our operating expenses will increase when the U.S. dollar weakens against the local currency and decrease when the U.S. dollar strengthens against the local currency. Additionally, foreign exchange rate fluctuations on transactions denominated in currencies other than the functional currency result in gains or losses that are reflected in our consolidated statements of operations. Our foreign operations are subject to the same risks present when conducting business internationally, including, but not limited to, changes in economic and geopolitical climate, differing tax structures, foreign exchange rate volatility and other regulations and restrictions.
In an effort to reduce the risk that our earnings will be adversely affected by foreign currency exchange rate fluctuations, we enter into foreign currency forward contracts to hedge against assets and liabilities for which we have foreign currency exchange rate exposure. These derivative instruments are carried at fair value with changes in the fair value recorded to other income, net, in our consolidated statements of operations. While not designated as hedging instruments, these foreign currency forward contracts are used to reduce the exchange rate risk associated primarily with intercompany receivables and payables. These contracts do not subject us to material balance sheet risk due to exchange rate movements as gains and losses on these derivatives are intended to offset gains and losses on the related receivables and payables for which we have foreign currency exchange rate exposure. As of September 28, 2018 and September 29, 2017, the outstanding derivative instruments had maturities of equal to or less than 31 days, and the total notional amounts of outstanding contracts were $25.1 million and $24.5 million, respectively. The fair values of these contracts were nominal as of September 28, 2018 and September 29, 2017, and were included within prepaid expenses and other current assets and within accrued liabilities in our consolidated balance sheets. For additional information related to our foreign currency forward contracts, see Note 2 "Summary of Significant Accounting Policies" to our consolidated financial statements.
A sensitivity analysis was performed on all of our foreign currency forward contracts as of September 28, 2018. This sensitivity analysis was based on a modeling technique that measures the hypothetical market value resulting from a 10% shift in the value of exchange rates relative to the U.S. dollar. For these forward contracts, duration modeling was used where hypothetical changes are made to the spot rates of the currency. A 10% increase in the
45
value of the U.S. dollar would lead to an increase in the fair value of our financial instruments by $1.1 million. Conversely, a 10% decrease in the value of the U.S. dollar would result in a decrease in the fair value of these financial instruments by $1.1 million.
46
ITEM 8. CONSOLIDATED FINANCIAL STATEMENTS
DOLBY LABORATORIES, INC.
INDEX TO CONSOLIDATED FINANCIAL STATEMENTS
47
Report of Independent Registered Public Accounting Firm
The Board of Directors and Stockholders
Dolby Laboratories, Inc.:
Opinions on the Consolidated Financial Statements and Internal Control Over Financial Reporting
We have audited the accompanying consolidated balance sheets of Dolby Laboratories, Inc. and subsidiaries (the Company) as of September 28, 2018 and September 29, 2017, the related consolidated statements of operations, comprehensive income, stockholders’ equity, and cash flows for each of the years in the three-year period ended September 28, 2018, and the related notes (collectively, the consolidated financial statements). We also have audited the Company’s internal control over financial reporting as of September 28, 2018, based on criteria established in Internal Control - Integrated Framework (2013) issued by the Committee of Sponsoring Organizations of the Treadway Commission.
In our opinion, the consolidated financial statements referred to above present fairly, in all material respects, the financial position of the Company as of September 28, 2018 and September 29, 2017, and the results of its operations and its cash flows for each of the years in the three-year period ended September 28, 2018, in conformity with U.S. generally accepted accounting principles. Also in our opinion, the Company maintained, in all material respects, effective internal control over financial reporting as of September 28, 2018, based on criteria established in Internal Control - Integrated Framework (2013) issued by the Committee of Sponsoring Organizations of the Treadway Commission.
Basis for Opinions
The Company’s management is responsible for these consolidated financial statements, for maintaining effective internal control over financial reporting, and for its assessment of the effectiveness of internal control over financial reporting, included in the accompanying Management’s Report on Internal Controls over Financial Reporting in Item 9A. Our responsibility is to express an opinion on the Company’s consolidated financial statements and an opinion on the Company’s internal control over financial reporting based on our audits. We are a public accounting firm registered with the Public Company Accounting Oversight Board (United States) (PCAOB) and are required to be independent with respect to the Company in accordance with the U.S. federal securities laws and the applicable rules and regulations of the Securities and Exchange Commission and the PCAOB.
We conducted our audits in accordance with the standards of the PCAOB. Those standards require that we plan and perform the audits to obtain reasonable assurance about whether the consolidated financial statements are free of material misstatement, whether due to error or fraud, and whether effective internal control over financial reporting was maintained in all material respects.
Our audits of the consolidated financial statements included performing procedures to assess the risks of material misstatement of the consolidated financial statements, whether due to error or fraud, and performing procedures that respond to those risks. Such procedures included examining, on a test basis, evidence regarding the amounts and disclosures in the consolidated financial statements. Our audits also included evaluating the accounting principles used and significant estimates made by management, as well as evaluating the overall presentation of the consolidated financial statements. Our audit of internal control over financial reporting included obtaining an understanding of internal control over financial reporting, assessing the risk that a material weakness exists, and testing and evaluating the design and operating effectiveness of internal control based on the assessed risk. Our audits also included performing such other procedures as we considered necessary in the circumstances. We believe that our audits provide a reasonable basis for our opinions.
Definition and Limitations of Internal Control Over Financial Reporting
A company’s internal control over financial reporting is a process designed to provide reasonable assurance regarding the reliability of financial reporting and the preparation of financial statements for external purposes in accordance with generally accepted accounting principles. A company’s internal control over financial reporting includes those policies and procedures that (1) pertain to the maintenance of records that, in reasonable detail, accurately and fairly reflect the transactions and dispositions of the assets of the company; (2) provide reasonable assurance that transactions are recorded as necessary to permit preparation of financial statements in accordance with generally accepted accounting principles, and that receipts and expenditures of the company are being made only in
48
accordance with authorizations of management and directors of the company; and (3) provide reasonable assurance regarding prevention or timely detection of unauthorized acquisition, use, or disposition of the company’s assets that could have a material effect on the financial statements.
Because of its inherent limitations, internal control over financial reporting may not prevent or detect misstatements. Also, projections of any evaluation of effectiveness to future periods are subject to the risk that controls may become inadequate because of changes in conditions, or that the degree of compliance with the policies or procedures may deteriorate.
We have served as the Company’s auditor since 2002.
/s/ KPMG LLP
San Francisco, California
November 14, 2018
49
DOLBY LABORATORIES, INC.
CONSOLIDATED BALANCE SHEETS
(in thousands, except share and per share amounts)
September 28, 2018 | September 29, 2017 | |||||
ASSETS | ||||||
Current assets: | ||||||
Cash and cash equivalents | $ | 918,063 | $ | 627,017 | ||
Restricted cash | 7,187 | 7,351 | ||||
Short-term investments | 178,138 | 247,757 | ||||
Accounts receivable, net of allowance for doubtful accounts of $5,352 and $2,967 | 137,151 | 73,750 | ||||
Inventories | 26,206 | 25,051 | ||||
Prepaid expenses and other current assets | 35,209 | 30,508 | ||||
Total current assets | 1,301,954 | 1,011,434 | ||||
Long-term investments | 187,782 | 314,364 | ||||
Property, plant and equipment, net | 514,182 | 485,275 | ||||
Intangible assets, net | 184,019 | 189,648 | ||||
Goodwill | 327,982 | 311,087 | ||||
Deferred taxes | 101,070 | 190,915 | ||||
Other non-current assets | 42,280 | 30,831 | ||||
Total assets | $ | 2,659,269 | $ | 2,533,554 | ||
LIABILITIES AND STOCKHOLDERS’ EQUITY | ||||||
Current liabilities: | ||||||
Accounts payable | $ | 21,922 | $ | 14,373 | ||
Accrued liabilities | 223,594 | 207,034 | ||||
Income taxes payable | 2,680 | 1,216 | ||||
Deferred revenue | 23,931 | 23,150 | ||||
Total current liabilities | 272,127 | 245,773 | ||||
Long-term deferred revenue | 40,064 | 36,425 | ||||
Other non-current liabilities | 150,960 | 107,514 | ||||
Total liabilities | 463,151 | 389,712 | ||||
Stockholders’ equity: | ||||||
Class A, $0.001 par value, one vote per share, 500,000,000 shares authorized: 63,978,752 shares issued and outstanding at September 28, 2018 and 59,281,837 at September 29, 2017 | 61 | 58 | ||||
Class B, $0.001 par value, ten votes per share, 500,000,000 shares authorized: 39,261,035 shares issued and outstanding at September 28, 2018 and 42,873,597 at September 29, 2017 | 41 | 43 | ||||
Additional paid-in capital | 66,127 | 61,331 | ||||
Retained earnings | 2,139,154 | 2,083,063 | ||||
Accumulated other comprehensive (loss) | (15,832 | ) | (7,753 | ) | ||
Total stockholders’ equity – Dolby Laboratories, Inc. | 2,189,551 | 2,136,742 | ||||
Controlling interest | 6,567 | 7,100 | ||||
Total stockholders’ equity | 2,196,118 | 2,143,842 | ||||
Total liabilities and stockholders’ equity | $ | 2,659,269 | $ | 2,533,554 | ||
See accompanying notes to consolidated financial statements
50
DOLBY LABORATORIES, INC.
CONSOLIDATED STATEMENTS OF OPERATIONS
(in thousands, except per share amounts)
Fiscal Year Ended | |||||||||
September 28, 2018 | September 29, 2017 | September 30, 2016 | |||||||
Revenue: | |||||||||
Licensing | $ | 1,057,606 | $ | 965,792 | $ | 917,032 | |||
Products | 94,552 | 95,290 | 90,543 | ||||||
Services | 19,766 | 20,372 | 18,163 | ||||||
Total revenue | 1,171,924 | 1,081,454 | 1,025,738 | ||||||
Cost of revenue: | |||||||||
Cost of licensing | 43,492 | 39,216 | 28,333 | ||||||
Cost of products | 65,292 | 61,256 | 64,853 | ||||||
Cost of services | 19,476 | 17,835 | 15,796 | ||||||
Total cost of revenue | 128,260 | 118,307 | 108,982 | ||||||
Gross margin | 1,043,664 | 963,147 | 916,756 | ||||||
Operating expenses: | |||||||||
Research and development | 236,794 | 233,312 | 219,607 | ||||||
Sales and marketing | 309,802 | 296,661 | 295,267 | ||||||
General and administrative | 197,516 | 171,686 | 168,854 | ||||||
Restructuring charges/(credits) | (446 | ) | 12,856 | 1,233 | |||||
Total operating expenses | 743,666 | 714,515 | 684,961 | ||||||
Operating income | 299,998 | 248,632 | 231,795 | ||||||
Other income/expense: | |||||||||
Interest income | 18,970 | 9,577 | 5,684 | ||||||
Interest expense | (198 | ) | (127 | ) | (125 | ) | |||
Other income/(expense), net | (5,903 | ) | (1,438 | ) | (1,450 | ) | |||
Total other income | 12,869 | 8,012 | 4,109 | ||||||
Income before income taxes | 312,867 | 256,644 | 235,904 | ||||||
Provision for income taxes | (190,062 | ) | (54,217 | ) | (49,502 | ) | |||
Net income including controlling interest | 122,805 | 202,427 | 186,402 | ||||||
Less: net (income) attributable to controlling interest | (559 | ) | (625 | ) | (542 | ) | |||
Net income attributable to Dolby Laboratories, Inc. | $ | 122,246 | $ | 201,802 | $ | 185,860 | |||
Net income per share: | |||||||||
Basic | $ | 1.18 | $ | 1.98 | $ | 1.85 | |||
Diluted | $ | 1.14 | $ | 1.95 | $ | 1.81 | |||
Weighted-average shares outstanding: | |||||||||
Basic | 103,377 | 101,784 | 100,717 | ||||||
Diluted | 106,978 | 103,286 | 102,424 | ||||||
Related party rent expense: | |||||||||
Included in operating expenses | $ | 3,483 | $ | 3,142 | $ | 3,097 | |||
Included in net income attributable to controlling interest | $ | 712 | $ | 702 | $ | 706 | |||
Cash dividend declared per common share | $ | 0.67 | $ | 0.58 | $ | 0.50 | |||
Cash dividend paid per common share | $ | 0.64 | $ | 0.56 | $ | 0.48 | |||
See accompanying notes to consolidated financial statements
51
DOLBY LABORATORIES, INC.
CONSOLIDATED STATEMENTS OF COMPREHENSIVE INCOME
(in thousands)
Fiscal Year Ended | |||||||||
September 28, 2018 | September 29, 2017 | September 30, 2016 | |||||||
Net income including controlling interest | $ | 122,805 | $ | 202,427 | $ | 186,402 | |||
Other comprehensive income: | |||||||||
Foreign currency translation adjustments, net of tax | (5,578 | ) | 3,653 | 85 | |||||
Unrealized gains/(losses) on available-for-sale securities, net of tax | (2,571 | ) | (1,119 | ) | 392 | ||||
Comprehensive income | 114,656 | 204,961 | 186,879 | ||||||
Less: comprehensive (income)/loss attributable to controlling interest | (489 | ) | (715 | ) | 246 | ||||
Comprehensive income attributable to Dolby Laboratories, Inc. | $ | 114,167 | $ | 204,246 | $ | 187,125 | |||
See accompanying notes to consolidated financial statements
52
DOLBY LABORATORIES, INC.
CONSOLIDATED STATEMENTS OF STOCKHOLDERS’ EQUITY
(in thousands)
Dolby Laboratories, Inc. | ||||||||||||||||||||||||||||
Class A | Class B | APIC | Retained Earnings | AOCI | Total Stockholders’ Equity | Controlling Interest | Total | |||||||||||||||||||||
Shares | Amount | Shares | Amount | |||||||||||||||||||||||||
Balance at September 25, 2015 | 50,292 | $ | 51 | 50,743 | $ | 51 | $ | 17,571 | $ | 1,800,857 | $ | (11,462 | ) | $ | 1,807,068 | $ | 8,939 | $ | 1,816,007 | |||||||||
Net income | — | — | — | — | — | 185,860 | — | 185,860 | 542 | 186,402 | ||||||||||||||||||
Currency translation adjustments, net of tax of $586 | — | — | — | — | — | — | 873 | 873 | (788 | ) | 85 | |||||||||||||||||
Unrealized gains on investments, net of tax of $49 | — | — | — | — | — | — | 392 | 392 | — | 392 | ||||||||||||||||||
Distributions to controlling interest | — | — | — | — | — | — | — | — | (214 | ) | (214 | ) | ||||||||||||||||
Stock-based compensation expense | — | — | — | — | 66,985 | — | — | 66,985 | — | 66,985 | ||||||||||||||||||
Repurchase of common stock | (2,616 | ) | (3 | ) | — | — | (100,851 | ) | — | — | (100,854 | ) | — | (100,854 | ) | |||||||||||||
Cash dividends declared and paid on common stock | — | — | — | — | — | (48,397 | ) | — | (48,397 | ) | — | (48,397 | ) | |||||||||||||||
Tax benefit from employee stock plans | — | — | — | — | 850 | — | — | 850 | — | 850 | ||||||||||||||||||
Common stock issued under employee stock plans | 3,382 | 3 | — | — | 71,108 | — | — | 71,111 | — | 71,111 | ||||||||||||||||||
Tax withholdings on vesting of restricted stock | (379 | ) | (1 | ) | — | — | (13,631 | ) | — | — | (13,632 | ) | — | (13,632 | ) | |||||||||||||
Common stock transfers - Class B to Class A | 6,339 | 7 | (6,339 | ) | (7 | ) | — | — | — | — | — | — | ||||||||||||||||
Balance at September 30, 2016 | 57,018 | 57 | 44,404 | 44 | 42,032 | 1,938,320 | (10,197 | ) | 1,970,256 | 8,479 | 1,978,735 | |||||||||||||||||
Net income | 201,802 | 201,802 | 625 | 202,427 | ||||||||||||||||||||||||
Currency translation adjustments, net of tax of $(621) | 3,563 | 3,563 | 90 | 3,653 | ||||||||||||||||||||||||
Unrealized gains on investments, net of tax of $38 | (1,119 | ) | (1,119 | ) | (1,119 | ) | ||||||||||||||||||||||
Distributions to controlling interest | — | (2,094 | ) | (2,094 | ) | |||||||||||||||||||||||
Stock-based compensation expense | 65,343 | 65,343 | 65,343 | |||||||||||||||||||||||||
Repurchase of common stock | (2,025 | ) | (2 | ) | (99,998 | ) | (100,000 | ) | (100,000 | ) | ||||||||||||||||||
Cash dividends declared and paid on common stock | (57,059 | ) | (57,059 | ) | (57,059 | ) | ||||||||||||||||||||||
Tax benefit from employee stock plans | 1,634 | 1,634 | 1,634 | |||||||||||||||||||||||||
Common stock issued under employee stock plans | 3,138 | 2 | 69,996 | 69,998 | 69,998 | |||||||||||||||||||||||
Tax withholdings on vesting of restricted stock | (379 | ) | (17,676 | ) | (17,676 | ) | (17,676 | ) | ||||||||||||||||||||
Common stock transfers - Class B to Class A | 1,530 | 1 | (1,530 | ) | (1 | ) | — | — | ||||||||||||||||||||
Balance at September 29, 2017 | 59,282 | 58 | 42,874 | 43 | 61,331 | 2,083,063 | (7,753 | ) | 2,136,742 | 7,100 | 2,143,842 | |||||||||||||||||
Net income | 122,246 | 122,246 | 559 | 122,805 | ||||||||||||||||||||||||
Currency translation adjustments, net of tax of $106 | (5,508 | ) | (5,508 | ) | (70 | ) | (5,578 | ) | ||||||||||||||||||||
Unrealized gains on investments, net of tax of $89 | (2,571 | ) | (2,571 | ) | (2,571 | ) | ||||||||||||||||||||||
Distributions to controlling interest | — | (1,022 | ) | (1,022 | ) | |||||||||||||||||||||||
Stock-based compensation expense | 71,249 | 71,249 | 71,249 | |||||||||||||||||||||||||
Repurchase of common stock | (2,381 | ) | (2 | ) | (150,468 | ) | (150,470 | ) | (150,470 | ) | ||||||||||||||||||
Cash dividends declared and paid on common stock | (66,155 | ) | (66,155 | ) | (66,155 | ) | ||||||||||||||||||||||
Common stock issued under employee stock plans | 3,823 | 3 | 106,159 | 106,162 | 106,162 | |||||||||||||||||||||||
Tax withholdings on vesting of restricted stock | (358 | ) | — | (22,144 | ) | (22,144 | ) | (22,144 | ) | |||||||||||||||||||
Common stock transfers - Class B to Class A | 3,613 | 2 | (3,613 | ) | (2 | ) | — | — | ||||||||||||||||||||
Balance at September 28, 2018 | 63,979 | $ | 61 | 39,261 | $ | 41 | $ | 66,127 | $ | 2,139,154 | $ | (15,832 | ) | $ | 2,189,551 | $ | 6,567 | $ | 2,196,118 | |||||||||
See accompanying notes to consolidated financial statements
53
DOLBY LABORATORIES, INC.
CONSOLIDATED STATEMENTS OF CASH FLOWS
(in thousands)
Fiscal Year Ended | |||||||||
September 28, 2018 | September 29, 2017 | September 30, 2016 | |||||||
Operating activities: | |||||||||
Net income including controlling interest | $ | 122,805 | $ | 202,427 | $ | 186,402 | |||
Adjustments to reconcile net income to net cash provided by operating activities: | |||||||||
Depreciation and amortization | 81,283 | 84,308 | 85,152 | ||||||
Stock-based compensation | 71,249 | 65,343 | 66,985 | ||||||
Amortization of premium on investments | 2,473 | 2,758 | 3,824 | ||||||
Provision for doubtful accounts | 2,507 | 924 | 1,017 | ||||||
Deferred income taxes | 89,934 | (29,368 | ) | (22,798 | ) | ||||
Other non-cash items affecting net income | 7,570 | 2,886 | 1,779 | ||||||
Changes in operating assets and liabilities: | |||||||||
Accounts receivable | (65,723 | ) | 1,041 | 24,886 | |||||
Inventories | (6,602 | ) | (11,922 | ) | (2,949 | ) | |||
Prepaid expenses and other assets | (14,895 | ) | (12,411 | ) | (15,217 | ) | |||
Accounts payable and other liabilities | 15,690 | 44,453 | 2,834 | ||||||
Income taxes, net | 39,738 | 26,950 | 17,265 | ||||||
Deferred revenue | 4,362 | 23 | 10,288 | ||||||
Other non-current liabilities | 1,811 | 381 | 596 | ||||||
Net cash provided by operating activities | 352,202 | 377,793 | 360,064 | ||||||
Investing activities: | |||||||||
Purchases of investment securities | (174,195 | ) | (289,530 | ) | (426,118 | ) | |||
Proceeds from sales of investment securities | 123,058 | 84,047 | 262,125 | ||||||
Proceeds from maturities of investment securities | 237,432 | 152,324 | 103,987 | ||||||
Purchases of PP&E | (72,814 | ) | (99,617 | ) | (100,762 | ) | |||
Payments for business acquisitions, net of cash acquired | (22,852 | ) | — | — | |||||
Purchase of intangible assets | (12,543 | ) | (5,250 | ) | (121,020 | ) | |||
Change in restricted cash | 164 | (3,706 | ) | (709 | ) | ||||
Net cash provided by (used in) investing activities | 78,250 | (161,732 | ) | (282,497 | ) | ||||
Financing activities: | |||||||||
Proceeds from issuance of common stock | 106,162 | 69,998 | 71,111 | ||||||
Repurchase of common stock | (150,470 | ) | (100,000 | ) | (100,854 | ) | |||
Payment of cash dividend | (66,155 | ) | (57,059 | ) | (48,397 | ) | |||
Distribution to controlling interest | (1,022 | ) | (2,094 | ) | (214 | ) | |||
Shares repurchased for tax withholdings on vesting of restricted stock | (22,144 | ) | (17,676 | ) | (13,632 | ) | |||
Net cash used in financing activities | (133,629 | ) | (106,831 | ) | (91,986 | ) | |||
Effect of foreign exchange rate changes on cash and cash equivalents | (5,777 | ) | 1,675 | (1,395 | ) | ||||
Net increase/(decrease) in cash and cash equivalents | 291,046 | 110,905 | (15,814 | ) | |||||
Cash and cash equivalents at beginning of period | 627,017 | 516,112 | 531,926 | ||||||
Cash and cash equivalents at end of period | $ | 918,063 | $ | 627,017 | $ | 516,112 | |||
Supplemental disclosure: | |||||||||
Cash paid for income taxes, net of refunds received | $ | 60,875 | $ | 56,760 | $ | 55,085 | |||
Non-cash investing and financing activities: | |||||||||
Change in PP&E purchases unpaid at period-end | $ | 7,990 | $ | (9,613 | ) | $ | (7,233 | ) | |
Purchase consideration payable for acquisition | $ | 3,750 | $ | — | $ | — | |||
Purchase consideration payable for intangibles | $ | 200 | $ | — | $ | — | |||
See accompanying notes to consolidated financial statements
54
DOLBY LABORATORIES, INC.
NOTES TO CONSOLIDATED FINANCIAL STATEMENTS
1. Basis of Presentation
Principles of Consolidation
The consolidated financial statements include the accounts of Dolby Laboratories, Inc. and our wholly owned subsidiaries. In addition, we have consolidated the financial results of jointly owned affiliated companies in which our principal stockholder has a controlling interest. We report these controlling interests as a separate line in our consolidated statements of operations as net income attributable to controlling interest and in our consolidated balance sheets as a controlling interest. We eliminate all intercompany accounts and transactions upon consolidation.
Use of Estimates
The preparation of our financial statements in accordance with U.S. GAAP requires management to make certain estimates and assumptions that affect the amounts reported and disclosed in our consolidated financial statements and accompanying notes. Actual results could differ from our estimates. Significant items subject to such estimates and assumptions include:
• | Estimated selling prices for elements sold in ME revenue arrangements |
• | Valuation allowances for accounts receivable |
• | Carrying values of inventories and certain PP&E, goodwill, and intangible assets |
• | Fair values of investments |
• | Accrued liabilities, including liabilities for unrecognized tax benefits |
• | Deferred income tax assets and liabilities |
• | Stock-based compensation |
Fiscal Year
Our fiscal year is a 52 or 53 week period ending on the last Friday in September. The fiscal years presented herein include the 53 week period ended September 30, 2016 (fiscal 2016) and the 52 week periods ended September 28, 2018 (fiscal 2018) and September 29, 2017 (fiscal 2017).
Reclassifications
We have reclassified certain prior period amounts within our consolidated financial statements and accompanying notes to conform to our current period presentation. These reclassifications did not affect total revenue, operating income, operating cash flows or net income.
2. Summary of Significant Accounting Policies
Concentration of Credit Risk
Our financial instruments that are exposed to concentrations of credit risk principally consist of cash, cash equivalents, investments, and accounts receivable. Our investment portfolio consists of investment grade securities diversified amongst security types, industries, and issuers. All our securities are held in custody by a recognized financial institution. Our policy limits the amount of credit exposure to a maximum of 5% to any one issuer, except for the U.S. Treasury, and we believe no significant concentration risk exists with respect to these investments. The majority of our licensing revenue is generated from customers outside of the U.S. We manage this risk by performing regular evaluations of the creditworthiness of our licensing customers. In fiscal 2018, 2017, and 2016, we did not have any individual customers whose revenue exceeded 10% of our total revenue.
Cash and Cash Equivalents
We consider all short-term highly liquid investments with original maturities of 90 days or less from the date of purchase to be cash equivalents. Cash and cash equivalents primarily consist of funds held in general checking accounts, money market accounts, commercial paper, and government bonds.
55
Restricted Cash
Restricted cash on our consolidated balance sheets consists of cash contributed by Dolby and third-party licensors to Via Licensing Corporation, our wholly-owned subsidiary, that may only be used for licensor enforcement actions or licensee compliance activities related to certain Via-administered patent pools, as well as to disperse costs associated with any audit of Via Licensing Corporation for the Wideband Code Division Multiple Access (W-CDMA) patent pool.
Investments
All of our investments are classified as available-for-sale securities, with the exception of our mutual fund investments held in our supplemental retirement plan, which are classified as trading securities. Investments that have an original maturity of 91 days or more at the date of purchase and a current maturity of less than one year are classified as short-term investments, while investments with a current maturity of more than one year are classified as long-term investments. Our investments are recorded at fair value in our consolidated balance sheets. Unrealized gains and losses on our AFS securities are reported as a component of AOCI, while realized gains and losses, other-than-temporary impairments, and credit losses are reported as a component of net income. Upon sale, gains and losses are reclassified from AOCI into earnings, and are determined based on specific identification of securities sold.
We evaluate our investment portfolio for credit losses and other-than-temporary impairments by comparing the fair value with the cost basis for each of our investment securities. An investment is impaired if the fair value is less than its cost basis. If any portion of the impairment is deemed to be the result of a credit loss, the credit loss portion of the impairment is included as a component of net income. If we deem it probable that we will not recover the full cost basis of the security, the security is other-than-temporarily impaired, and the impairment loss is recognized as a component of net income.
Allowance for Doubtful Accounts
We maintain a provision for estimated losses on receivables resulting from our customers' inability to make required payments. In determining the provision, we evaluate the collectibility of our accounts receivable based upon a variety of factors. In cases where we are aware of circumstances that may impair a specific customer’s ability to meet its financial obligations, we record a specific allowance against amounts due, and thereby reduce the net recognized receivable to the amount reasonably believed to be collectible. For all other customers, we recognize allowances for doubtful accounts based on our actual historical write-off experience in conjunction with the length of time the receivables are past due, geographic risk and the current business environment. Actual future losses from uncollectible accounts may differ from our estimates.
Inventories
Inventories are accounted for using the first-in, first-out method, and are valued to the lower of cost and net realizable value. We evaluate our ending inventories for estimated excess quantities and obsolescence. Our evaluation includes the analysis of future sales demand by product within specific time horizons. Inventories in excess of projected future demand are written down to their net realizable value. In addition, we assess the impact of changing technology on our inventory balances and write-off inventories that are considered obsolete. Write-downs and write-offs of inventory are recorded as a cost of products in our consolidated statements of operations. We classify inventory that we do not expect to sell within twelve months as other non-current assets in our consolidated balance sheets.
56
Property, Plant, and Equipment
PP&E is stated at cost less accumulated depreciation. Depreciation expense is recognized on a straight-line basis according to estimated useful lives assigned to each of our different categories of PP&E as summarized within the following table:
PP&E Category | Useful Life |
Computer equipment and software | 3 to 5 years |
Machinery and equipment | 3 to 8 years |
Furniture and fixtures | 5 to 8 years |
Leasehold improvements | Lesser of useful life or related lease term |
Equipment provided under operating leases | 15 years |
Buildings and building improvements | 20 to 40 years |
We capitalize certain costs incurred during the construction phase of a project or asset into construction-in-progress until the construction process is complete. Once the related asset is placed into service, we transfer its carrying value into the appropriate fixed asset category and begin depreciating the value over its useful life.
Equipment Provided Under Operating Leases. We account for our cinema equipment installed at third party sites under collaborative or other arrangements as operating leases, and depreciate these assets on a straight-line basis over their estimated useful life.
Internal Use Software. We account for the costs of computer software developed for internal use by capitalizing costs of materials and external consultants. These costs are included in PP&E, net of accumulated amortization in our consolidated balance sheets. Our capitalized internal use software costs are typically amortized on a straight-line basis over estimated useful lives of three to five years. Costs incurred during the preliminary project and post-implementation stages are charged to expense.
Goodwill, Intangible Assets, and Long-Lived Assets
We test goodwill for impairment annually during our third fiscal quarter and whenever events or changes in circumstances indicate that the carrying amount may be impaired. We perform a qualitative assessment as a determinant for whether the two-step annual goodwill impairment test should be performed.
In performing the qualitative assessment, we consider events and circumstances, including macroeconomic conditions, industry and market considerations, cost factors, overall financial performance, changes in management or key personnel, changes in strategy, changes in customers, changes in the composition or carrying amount of a reporting unit's net assets, and changes in the price of our common stock. If, after assessing the totality of events or circumstances, we determine that it is more likely than not that the fair value of a reporting unit is greater than its carrying amount, then the two-step goodwill impairment test is not performed.
If the two-step goodwill test is performed, we evaluate and test our goodwill for impairment at a reporting-unit level using expected future cash flows to be generated by the reporting unit. If the carrying amount of a reporting unit exceeds its fair value, an impairment loss is recognized for any excess of the carrying amount of the reporting unit's goodwill over the calculated fair value of the goodwill. A reporting unit is an operating segment or one level below. Our operating segment is aligned with the management principles of our business.
During the fiscal quarter ended December 30, 2016, we reorganized certain aspects of our internal business infrastructure primarily to integrate and align sales support more directly with our business units. In accordance with ASC Topic 350, we reviewed and reassigned our goodwill amongst our reporting units using a relative fair value allocation approach. Before doing so, we performed a “Step Zero” qualitative assessment during the quarter ended September 30, 2016 and determined that there was minimal risk of goodwill impairment in our pre-reorganization reporting units. Immediately after the reorganization, and related to our consolidated balance of goodwill of $307.1 million as of December 30, 2016, we initiated the "Step One" goodwill impairment assessment using a market approach and an income approach to value our reporting units. We completed this assessment as of March 31, 2017 and determined that there was no goodwill impairment.
In addition, we completed our annual goodwill impairment assessment for fiscal 2018 in the fiscal quarter ended June 29, 2018. We determined in our qualitative review that it is more likely than not that the fair value of our reporting units are substantially in excess of their respective carrying amounts. Accordingly, there was no impairment, and the "Step One" goodwill impairment test was not required. We did not incur any goodwill impairment losses in any of the periods presented.
57
Intangible assets are stated at their original cost less accumulated amortization, and those with definite lives are amortized over their estimated useful lives. Our intangible assets principally consist of acquired technology, patents, trademarks, customer relationships and contracts, the majority of which are amortized on a straight-line basis over their useful lives using a range from three to eighteen years.
We review long-lived assets, including intangible assets, for impairment whenever events or a change in circumstances indicate an asset’s carrying value may not be recoverable. Recoverability of an asset is measured by comparing its carrying value to the total future undiscounted cash flows that the asset is expected to generate. If it is determined that an asset is not recoverable, an impairment loss is recorded in the amount by which the carrying value of the asset exceeds its estimated fair value.
Revenue Recognition
We enter into revenue arrangements with our customers to license technologies, trademarks, and other aspects of our technological expertise and to sell products and services. We recognize revenue when all of the following criteria are met: persuasive evidence of an arrangement exists, delivery has occurred or services have been completed, our price to the buyer is fixed or determinable, and collectability is probable.
Multiple Element Arrangements. Some of our revenue arrangements include multiple elements, such as hardware, software, maintenance, and other services. We evaluate each element in a multiple-element arrangement to determine whether it represents a separate unit of accounting. An element constitutes a separate unit of accounting when it has standalone value and delivery of an undelivered element is both probable and within our control. When these criteria are not met, the delivered and undelivered elements are combined and the arrangement fees are allocated to this combined single unit. If the unit separation criteria are met, we account for each element within a ME arrangement separately, whereby the total arrangement fees are allocated to each element based on its relative selling price, which we establish using a selling price hierarchy. We determine the selling price of each element based on its VSOE, if available, TPE, if VSOE is not available, or ESP, if neither VSOE nor TPE is available.
For some arrangements, customers receive certain elements over a period of time, after delivery of the initial product. These elements may include support and maintenance or the right to receive upgrades. Revenue allocated to the undelivered element is recognized either over its estimated service period or when the upgrade is delivered. We do not recognize revenue that is contingent upon the future delivery of products or services or upon future performance obligations. We recognize revenue for delivered elements only when we have completed all contractual obligations.
We determine our ESP for an individual element within a ME revenue arrangement using the same methods used to determine the selling price of an element sold on a standalone basis. If we sell the element on a standalone basis, we estimate the selling price by considering actual sales prices. Otherwise, we estimate the selling price by considering internal factors such as pricing practices and margin objectives. Consideration is also given to market conditions such as competitor pricing strategies, customer demands and industry technology lifecycles. Management applies judgment to establish margin objectives, pricing strategies and technology lifecycles.
We account for the majority of our digital cinema server and processor sales as ME arrangements that may include up to four separate units, or elements, of accounting.
▪ | The first element consists of our digital cinema server hardware and the accompanying software, which is essential to the functionality of the hardware. This element is typically delivered at the time of sale. |
▪ | The second element is the right to receive support and maintenance, which is included with the purchase of the hardware element and is typically delivered over a service period subsequent to the initial sale. |
▪ | The third element is the right to receive specified upgrades, which is included with the purchase of the hardware element and is typically delivered when a specified upgrade is available, subsequent to the initial sale. Under revenue recognition accounting standards, sales of our digital cinema servers typically result in the allocation of a substantial majority of the arrangement fees to the delivered hardware element based on its ESP, which we recognize as revenue at the time of sale once delivery has occurred. A small portion of the arrangement fee is allocated to the undelivered support and maintenance element, and when applicable, to the undelivered specified upgrade element based on the VSOE or ESP of each element. The portion of the arrangement fees allocated to the support and maintenance element are recognized as revenue ratably over the estimated service period, and the portion of the arrangement fees allocated to specified upgrades are recognized as revenue upon delivery of the upgrade. |
▪ | The fourth element is the right to receive commissioning services performed solely in connection with our digital servers necessary for the installation of Dolby Atmos-enabled theaters. These services consist of the |
58
review of venue designs specifying proposed speaker placement, as well as calibration services performed for installed speakers to ensure optimal playback. A small portion of the arrangement fee is allocated to these services based on their ESP which we recognize as revenue once the services have been completed.
Software Arrangements. Revenue recognition for transactions that involve software, such as fees we earn from certain system licensees, may include multiple elements. For some of our ME arrangements that involve software, customers receive certain elements over a period of time or after delivery of the initial software. These elements may include support, maintenance, and services. The fair value of these elements are recognized over the estimated period for which these elements will be delivered, which is sometimes the estimated life of the software. If we do not have VSOE of fair value for any undelivered element of these ME arrangements that include software, we defer revenue until all elements are delivered or services have been performed, or until we have VSOE of fair value for all remaining undelivered elements. If the undelivered element is support and we do not have VSOE of fair value for the support element, revenue for the entire arrangement is bundled and recognized ratably over the support period. To the extent that the undelivered element is support within the context of a royalty usage based arrangement, and assuming all other revenue recognition criteria are met, we recognize the entire royalty fee as license revenue once reported.
In certain cases, our arrangements require the licensee to pay a fixed fee for the right to distribute units in the future. These fees are generally recognized upon contract execution, unless the arrangement includes contingency terms wherein we assess the totality of the existing facts and circumstances and conclude upon an accounting treatment thereon, or is considered a ME arrangement.
Licensing. Our licensing revenue is primarily derived from royalties paid to us by licensees of our IP rights, including patents, trademarks, and trade secrets. Royalties are recognized when all revenue recognition criteria have been met. We determine that there is persuasive evidence of an arrangement upon the execution of a license agreement or in cases where an agreement has expired, upon the receipt of a licensee’s royalty report and payment. Generally, royalties are deemed fixed or determinable upon receipt of a licensee’s royalty report in accordance with the terms of the underlying executed agreement. We determine collectibility based on an evaluation of the licensee’s recent payment history, the existence of a standby letter-of-credit between the licensee’s financial institution and our financial institution, and other factors. If we cannot determine that collectibility is probable, we recognize revenue upon receipt of cash, provided that all other revenue recognition criteria have been met. Corrective royalty statements generally comprise less than 1% of our net licensing revenue and are recognized when received, or earlier if a reliable estimate can be made of an anticipated reduction in revenue from a prior royalty statement. An estimate of anticipated reduction in revenue based on historical negative correction royalty statements is also recorded. Deferred revenue represents amounts that we have already collected that are ultimately expected to be recognized as revenue, but for which not all revenue recognition criteria have been met. Licensing revenue also includes fees we earn for administering joint patent licensing programs (“patent pools”) containing patents owned by us and/or other companies. Royalties related to patent pools are recorded net of royalties payable to third party patent pool members and are recognized when all revenue recognition criteria have been met.
We generate the majority of our licensing revenue through our licensing contracts with OEMs ("system licensees") and implementation licensees. Our revenue recognition policies for each of these arrangements are summarized below.
Licensing to system licensees. We license our technologies to system licensees who manufacture consumer electronics products and, in return, the system licensee pays us a royalty generally for each unit shipped that incorporates our technologies. Royalties from system licensees are generally recognized upon receipt of a royalty report from the licensee and when all other revenue recognition criteria have been met. In certain cases, our arrangements require the licensee to pay up-front, non-refundable royalties for units they may distribute in the future. These up-front fees are generally recognized upon contract execution, unless the arrangement includes extended payment terms or is considered a ME arrangement. In addition, in some cases we receive initial license fees for our technologies and provide post-contract support. In these cases, we recognize the initial fees ratably over the expected support term.
Licensing to software vendors. We license our technologies for resale to software vendors and, in return, the software vendor pays us a royalty for each unit of software distributed that incorporates our technologies. Royalties from software vendors are generally recognized upon receipt of a royalty report from the licensee and when all other revenue recognition criteria have been met. In addition, in some cases we receive initial license fees for our technologies and provide post-contract upgrades and support. In these cases, we recognize the initial fees ratably over the expected support term, as VSOE of fair value typically does not exist for the upgrade and support elements of the contract.
59
Recovery Payments from Licensees. Licensing revenue recognized in any given quarter may include recovery payments representing back payments and/or settlements from licensees. These payments arise as a result of ongoing collection efforts as well as activities aimed at identifying potential unauthorized uses of our technologies. Although such collections have become a recurring part of our business, we cannot predict the timing or magnitude of such payments with certainty.
Back payments represent incremental royalties that relate to amounts not previously reported by licensees under existing licensing agreements. Consistent with the manner in which royalty revenue is recognized, we recognize reported back payments as revenue in either the period the fee becomes due and payable, or when collectability is deemed probable, whichever is later.
Settlements represent new agreements under which a third party has agreed to remit payments to us based on past use of our technology. We recognize settlements as revenue in the period in which all revenue recognition criteria have been met. Generally, settlement fees are deemed to be fixed or determinable upon execution of the settlement agreement, provided such agreement contains no contingency terms or extended payment terms. If we are unable to determine that collectability is probable based on an evaluation of a customer's creditworthiness, we recognize revenue upon the receipt of cash, provided the other revenue recognition criteria have been met.
In general, we classify legal costs associated with activities aimed at identifying potential unauthorized uses of our technologies, auditing existing licensees, and on occasion, pursuing litigation as S&M in our consolidated statements of operations.
Product Sales. Revenue from the sale of products is recognized when the risk of ownership has transferred to our customer, as provided under the terms of the governing purchase agreement, and when all other revenue recognition criteria have been met. Generally, these purchase agreements provide that the risk of ownership is transferred to the customer when the product is shipped, except in specific instances in which certain foreign regulations stipulate that the risk of ownership is transferred to the customer upon their receipt of the shipment. In these instances, we recognize revenue when the product is received by the customer.
Services. Services revenue is recognized as the related services are performed and when all other revenue recognition criteria have been met.
Collaborative Arrangements. In partnership with established cinema exhibitors, we offer Dolby Cinema, a branded premium cinema experience for movie audiences. Under such collaborations, Dolby and the exhibitor are both active participants, and share the significant risks and rewards associated with the business. Accordingly, these collaborations are governed by revenue sharing arrangements under which Dolby receives a portion of the theatrical box-office revenues in exchange for the use of our imaging and sound technologies, our proprietary designs and corporate branding as well as for the use of our equipment at the exhibitor’s venue. The use of our equipment meets the definition of a lease, and for the related portion of Dolby's share of revenue, we apply ASC 840, Leases, and recognize revenue upon receipt of quarterly box office reports from exhibitors, and on determining that collectability is probable. In general, revenues from collaboration arrangements are recognized as licensing revenue in our consolidated statements of operations.
Cost of Revenue
Cost of licensing. Cost of licensing primarily consists of amortization expenses associated with purchased intangible assets and intangible assets acquired in business combinations. Cost of licensing also includes royalty obligations to third parties for licensing IP rights as part of arrangements with our customers, depreciation of our Dolby Cinema equipment provided under operating leases in collaborative arrangements, and direct fees incurred.
Cost of products. Cost of products primarily consists of the cost of materials related to products sold, applied labor, and manufacturing overhead. Our cost of products also includes third party royalty obligations paid to license IP that we include in our products.
Cost of services. Cost of services primarily consists of the personnel and personnel-related costs of employees performing our professional services, and those of outside consultants, and reimbursable expenses incurred on behalf of customers.
Stock-Based Compensation
We measure expenses associated with all employee stock-based compensation awards using a fair-value method and record such expense in our consolidated financial statements on a straight-line basis over the requisite service period.
60
Advertising and Promotional Costs
Advertising and promotional costs are charged to S&M expense as incurred. Our advertising and promotional costs were as follows (in thousands):
Fiscal Year Ended | |||||||||
September 28, 2018 | September 29, 2017 | September 30, 2016 | |||||||
Advertising and promotional costs | $ | 49,519 | $ | 47,402 | $ | 44,221 | |||
Foreign Currency Activities
Foreign Currency Translation. We maintain business operations in foreign countries. We translate the assets and liabilities of our international subsidiaries, the majority of which are denominated in non-U.S. dollar functional currencies, into U.S. dollars using exchange rates in effect at the end of each period. Revenues and expenses of these subsidiaries are translated using the average rates for the period. Gains and losses from these translations are included in AOCI within stockholders’ equity.
Foreign Currency Transactions. Certain of our foreign subsidiaries transact in currencies other than their functional currency. Therefore, we re-measure non-functional currency assets and liabilities of these subsidiaries using exchange rates at the end of each period. As a result, we recognize foreign currency transaction and re-measurement gains and losses, which are recorded within other income, net in our consolidated statements of operations. These losses were as follows (in thousands):
Fiscal Year Ended | |||||||||
September 28, 2018 | September 29, 2017 | September 30, 2016 | |||||||
Foreign currency transaction (losses) | $ | (823 | ) | $ | (74 | ) | $ | (474 | ) |
Foreign Currency Exchange Risk. In an effort to reduce the risk that our earnings will be adversely affected by foreign currency exchange rate fluctuations, we enter into foreign currency forward contracts to hedge against assets and liabilities for which we have foreign currency exchange rate exposure. These derivative instruments are carried at fair value with changes in the fair value recorded to other income/(expense), net, in our consolidated statements of operations. While not designated as hedging instruments, these foreign currency forward contracts are used to reduce the exchange rate risk associated primarily with intercompany receivables and payables. These contracts do not subject us to material balance sheet risk due to exchange rate movements as gains and losses on these derivatives are intended to offset gains and losses on the related receivables and payables for which we have foreign currency exchange rate exposure. As of September 28, 2018 and September 29, 2017, the outstanding derivative instruments had maturities of equal to or less than 31 days and 31 days, respectively, and the total notional amounts of outstanding contracts were $25.1 million and $24.5 million, respectively. The fair values of these contracts were nominal as of September 28, 2018 and September 29, 2017, and were included within prepaid expenses and other current assets and within accrued liabilities in our consolidated balance sheets.
Income Taxes
We use the asset and liability method, under which deferred income tax assets and liabilities are determined based upon the difference between the financial statement carrying amounts and the tax bases of assets and liabilities, and NOL carryforwards are measured using the enacted tax rate expected to apply to taxable income in the years in which the differences are expected to be reversed. In assessing the realizability of deferred tax assets, we consider whether it is more likely than not that some portion or all of the deferred tax assets will not be realized. The realization of deferred tax assets is additionally dependent upon the generation of future taxable income during the periods in which those temporary differences become deductible. We consider the scheduled reversal of deferred tax liabilities and projected future taxable income in making this assessment, and we record a valuation allowance to reduce our deferred tax assets when it's more-likely-than-not that some portion or all of the deferred tax assets will not be realized.
We record an unrecognized tax benefit from an uncertain tax position only if it is more likely than not that the tax position will be sustained upon examination by the tax authorities. We include interest and penalties related to gross unrecognized tax benefits within our provision for income taxes. To the extent accrued interest and penalties do not ultimately become payable, amounts accrued are reduced in the period that such determination is made and are reflected as a reduction of the overall income tax provision.
61
Repatriation of Undistributed Foreign Earnings. The Tax Cuts and Jobs Act of 2017 ("the Tax Act"), provides an exemption from federal income taxes for distributions by foreign subsidiaries made after December 31, 2017 that were not subject to the transition tax. Therefore, we have provided for U.S. state income taxes and foreign withholding taxes on undistributed earnings of certain foreign subsidiaries to the extent such earnings are no longer considered to be indefinitely reinvested in the operations of those subsidiaries. We consider the earnings of certain foreign subsidiaries to be indefinitely reinvested outside the U.S. on the basis of estimates that future domestic cash generation will be sufficient to meet future domestic cash needs, and our specific plans for reinvestment of those subsidiary earnings.
Withholding Taxes. We recognize licensing revenue gross of withholding taxes, which our licensees remit directly to their local tax authorities, and for which we receive a partial foreign tax credit in our income tax provision. The foreign current tax provision includes this withholding tax expense while the appropriate foreign tax credit benefit is included in current federal and foreign taxes.
Recently Issued Accounting Standards
We continually assess any ASUs or other new accounting pronouncements issued by the FASB to determine their applicability and impact on us. Where it is determined that a new accounting pronouncement will result in a change to our financial reporting, we take the appropriate steps to ensure that such changes are properly reflected in our consolidated financial statements or notes thereto.
Adopted Standards
Share-Based Compensation. During the first quarter of fiscal 2018, we adopted ASU 2016-09, Improvements to Employee Share-Based Payment Accounting, which simplifies several aspects of the accounting for employee share-based payment transactions including the accounting for income taxes, forfeitures, and statutory withholding requirements, as well as classification in the statement of cash flows. Upon adoption, excess tax benefits or deficiencies from stock-based awards are recorded as a component of the income tax provision, whereas they previously were recorded as additional paid-in capital. In the year-to-date periods ended September 28, 2018, we recognized an excess tax benefit of $13.4 million related to stock-based awards in the provision for income taxes. We elected to continue to account for forfeitures based on an estimate of expected forfeitures, rather than to account for forfeitures as they occur. Additionally, we adopted the aspects of the guidance affecting the cash flow presentation retrospectively, which results in a reclassification of excess tax benefits from financing activities to operating activities in the consolidated statements of cash flows.
Standards Not Yet Adopted
Revenue Recognition. In May 2014, the FASB issued ASU 2014-09, Revenue from Contracts with Customers (Topic 606), which outlines a comprehensive revenue recognition model and supersedes most current revenue recognition guidance. The new standard defines a five-step approach for recognizing revenue, which may require a company to use more judgment and make more estimates than under the current guidance. The new standard requires an entity to recognize as revenue the amount it expects to be entitled for the transfer of promised goods or services to customers, to capitalize certain direct costs associated with revenues and contract acquisition costs, and to provide expanded disclosures.
We have evaluated the impact of adopting Topic 606 on all of our revenue streams and believe that the following are the most significant changes that are expected to occur:
• | Estimating variable consideration, including royalty-based revenue for which we will record revenue earned from our licensees’ shipments in the same period in which those shipments occurred, rather than recognizing our revenue in the quarter in which licensees report to us, which is typically in the quarter after those shipments have occurred; |
• | Specified performance obligations for which we have not historically had VSOE and which resulted in the deferral of revenue balances may accelerate revenue recognition as VSOE for the undelivered elements is no longer required to separately recognize revenue for the delivered elements; |
• | For certain transactions that have minimum commitment or fixed fee terms, recognizing licensing revenues on contract execution instead of as payments become due; |
• | Recording a one-time adjustment to retained earnings to reflect the cumulative impact of the changes noted above for the periods prior to adoption. |
62
The new standard became effective for Dolby on September 29, 2018, being the beginning of our first quarter of fiscal 2019. We are adopting Topic 606 using the full retrospective method whereby the standard is applied to all periods presented as if it had been applied historically. Although we are still evaluating the impact of adopting Topic 606 on all of our revenue streams for fiscal 2018 and 2017, our preliminary determination is that fiscal 2018 revenue as recast under Topic 606 will be lower than the amount of revenue we reported under Topic 605 mostly due to revenue that is expected to shift back into previous periods and, to a lesser extent, the impact of certain contract modifications. We expect to complete our procedures and finalize the recast of our fiscal 2018 and 2017 revenues in the first half of fiscal 2019.
The above-mentioned changes may also result in changes to our reported income tax expense in the prior recast reporting period.
In preparation for reporting financial results under Topic 606, we have implemented key system functionalities and will continue to address the impact of the new standard and its expanded disclosure requirements on our policies, processes, and controls.
Leases. In February 2016, the FASB issued ASU 2016-02, Leases (Topic 842), which amends the existing accounting standards for leases. Under the new guidance, a lessee will be required to recognize a lease liability and right-of-use asset for most leases. The new guidance also modifies the classification criteria and accounting for sales-type and direct financing leases, and requires additional disclosures to enable users of financial statements to understand the amount, timing, and uncertainty of cash flows arising from leases. Topic 842 must be applied using a modified retrospective approach. Upon adoption, we will recognize a lease liability and right-of-use asset for each of our lease arrangements. We anticipate adoption of the standard will not have a material impact on our consolidated income statements. We plan to elect the practice expedients upon transition that will retain the lease classification and initial direct costs for any leases that exist prior to adoption of the standard. We will not reassess whether any contracts entered into prior to adoption are leases. We are in the process of evaluating our existing lease contracts and implementing changes to our systems. ASU 2016-02 is effective for Dolby beginning September 28, 2019, and we do not currently plan to early adopt.
Income Taxes: Comprehensive Income. On December 22, 2017, the U.S. government enacted comprehensive tax legislation commonly referred to as the Tax Cuts and Jobs Act ("Tax Act"). In February 2018, the FASB issued ASU 2018-02, Income Statement - Reporting Comprehensive Income (Topic 220): Reclassification of Certain Tax Effects From Accumulated Other Comprehensive Income, which allows a reclassification from accumulated other comprehensive income to retained earnings for stranded tax effects resulting from the Tax Act and requires entities to provide certain disclosures regarding stranded tax effects. The ASU is effective for Dolby beginning September 28, 2019, and we do not currently plan to early adopt. We are currently evaluating the timing and impact of the standard on our consolidated financial statements.
Collaborative Arrangements. In November 2018, the FASB issued ASU 2018-18, Collaborative Arrangements (Topic 808): Clarifying the Interaction between Topic 808 and Topic 606, which clarifies that certain transactions between participants in a collaborative arrangement should be accounted for under ASC 606 when the counterparty is a customer. In addition, ASU 2018-18 precludes an entity from presenting consideration from a transaction in a collaborative arrangement as revenue from contracts with customers if the counterparty is not a customer for that transaction. This guidance will be effective for Dolby beginning September 29, 2020, and we do not currently plan to early adopt. We do not believe that this guidance will have a material impact on our consolidated financial position, results of operation and cash flows.
3. Composition of Certain Financial Statement Captions
The following tables present detailed information from our consolidated balance sheets as of September 28, 2018 and September 29, 2017 (amounts displayed in thousands, except as otherwise noted).
Accounts Receivable
Accounts Receivable, Net | September 28, 2018 | September 29, 2017 | |||||
Trade accounts receivable | $ | 101,945 | $ | 62,305 | |||
Accounts receivable from patent administration program licensees | 40,558 | 14,412 | |||||
Accounts receivable, gross | 142,503 | 76,717 | |||||
Less: allowance for doubtful accounts | (5,352 | ) | (2,967 | ) | |||
Total | $ | 137,151 | $ | 73,750 | |||
63
Allowance for Doubtful Accounts | Beginning Balance | Charged to G&A | Deductions | Ending Balance | ||||||||
For fiscal year ended: | ||||||||||||
September 30, 2016 | $ | 1,542 | $ | 1,017 | $ | (189 | ) | $ | 2,370 | |||
September 29, 2017 | 2,370 | 924 | (327 | ) | 2,967 | |||||||
September 28, 2018 | 2,967 | 2,507 | (122 | ) | 5,352 | |||||||
Inventories
Inventories | September 28, 2018 | September 29, 2017 | |||||
Raw materials | $ | 6,095 | $ | 6,812 | |||
Work in process | 4,044 | 4,954 | |||||
Finished goods | 16,067 | 13,285 | |||||
Total | $ | 26,206 | $ | 25,051 | |||
Inventories are stated at the lower of cost and net realizable value. Inventory with a consumption period expected to exceed twelve months is recorded within other non-current assets in our consolidated balance sheets. We have included $2.6 million and $1.8 million of raw materials inventory within other non-current assets in our consolidated balance sheets as of September 28, 2018 and September 29, 2017, respectively. Based on anticipated inventory consumption rates, and aside from existing write-downs due to excess inventory, we do not believe that material risk of obsolescence exists prior to ultimate sale.
Prepaid Expenses And Other Current Assets
Prepaid Expenses And Other Current Assets | September 28, 2018 | September 29, 2017 | |||||
Prepaid expenses | $ | 18,508 | $ | 16,681 | |||
Other current assets | 14,265 | 11,383 | |||||
Income tax receivable | 2,436 | 2,444 | |||||
Total | $ | 35,209 | $ | 30,508 | |||
Accrued Liabilities
Accrued Liabilities | September 28, 2018 | September 29, 2017 | |||||
Accrued royalties | $ | 2,430 | $ | 2,274 | |||
Amounts payable to patent administration program partners | 53,942 | 49,141 | |||||
Accrued compensation and benefits | 84,491 | 92,277 | |||||
Accrued professional fees | 9,749 | 5,530 | |||||
Unpaid PP&E additions | 13,956 | 10,096 | |||||
Other accrued liabilities | 59,026 | 47,716 | |||||
Total | $ | 223,594 | $ | 207,034 | |||
Other Non-Current Liabilities
Other Non-Current Liabilities | September 28, 2018 | September 29, 2017 | |||||
Supplemental retirement plan obligations | $ | 3,388 | $ | 2,928 | |||
Non-current tax liabilities | 129,253 | 91,013 | |||||
Other liabilities | 18,319 | 13,573 | |||||
Total | $ | 150,960 | $ | 107,514 | |||
Refer to Note 10 “Income Taxes” for additional information related to tax liabilities.
4. Investments & Fair Value Measurements
We use cash holdings to purchase investment grade securities diversified among security types, industries, and issuers. All of our investment securities are measured at fair value, and are recorded within cash equivalents and both short-term and long-term investments in our consolidated balance sheets. With the exception of our mutual fund investments held in our SERP and classified as trading securities, all of our investments are classified as AFS securities.
64
Our investment securities primarily consist of government bonds, certificates of deposit, municipal debt securities, corporate bonds, U.S. agency securities, and commercial paper. In addition, our cash and cash equivalents also consist of highly-liquid money market funds. Consistent with our investment policy, none of our municipal debt investments are supported by letters of credit or standby purchase agreements. Our cash and investment portfolio consisted of the following (in thousands):
September 28, 2018 | ||||||||||||||||||||||
Cost | Unrealized | Estimated Fair Value | ||||||||||||||||||||
Gains | Losses | Total | Level 1 | Level 2 | Level 3 | |||||||||||||||||
Cash and cash equivalents: | ||||||||||||||||||||||
Cash | $ | 905,660 | $ | 905,660 | $ | 905,660 | ||||||||||||||||
Cash equivalents: | ||||||||||||||||||||||
Commercial paper | 5,058 | — | — | 5,058 | 5,058 | |||||||||||||||||
Corporate bonds | 1,005 | — | 1,005 | 1,005 | ||||||||||||||||||
Money market funds | 3,301 | 3,301 | 3,301 | |||||||||||||||||||
Municipal debt securities | 545 | (1 | ) | 544 | 544 | |||||||||||||||||
Government bonds | 2,495 | — | 2,495 | 2,495 | ||||||||||||||||||
Cash and cash equivalents | 918,064 | — | (1 | ) | 918,063 | 911,456 | 6,607 | — | ||||||||||||||
Short-term investments: | ||||||||||||||||||||||
Certificate of deposit (1) | 12,875 | 14 | 12,889 | 12,889 | ||||||||||||||||||
U.S. agency securities | 11,997 | (135 | ) | 11,862 | 11,862 | |||||||||||||||||
Government bonds | 7,970 | — | (15 | ) | 7,955 | 7,955 | ||||||||||||||||
Commercial paper | 4,276 | — | — | 4,276 | 4,276 | |||||||||||||||||
Corporate bonds | 111,245 | 50 | (494 | ) | 110,801 | 110,801 | ||||||||||||||||
Municipal debt securities | 30,475 | (120 | ) | 30,355 | 30,355 | |||||||||||||||||
Short-term investments | 178,838 | 64 | (764 | ) | 178,138 | 7,955 | 170,183 | — | ||||||||||||||
Long-term investments: | ||||||||||||||||||||||
U.S. agency securities | 9,791 | (166 | ) | 9,625 | 9,625 | |||||||||||||||||
Government bonds | 15,966 | (317 | ) | 15,649 | 15,649 | |||||||||||||||||
Corporate bonds | 146,561 | 33 | (1,810 | ) | 144,784 | 144,784 | ||||||||||||||||
Municipal debt securities | 17,235 | (112 | ) | 17,123 | 17,123 | |||||||||||||||||
Other long-term investments (2) | 355 | 246 | 601 | 246 | ||||||||||||||||||
Long-term investments | 189,908 | 279 | (2,405 | ) | 187,782 | 15,895 | 171,532 | — | ||||||||||||||
Total cash, cash equivalents, and investments | $ | 1,286,810 | $ | 343 | $ | (3,170 | ) | $ | 1,283,983 | $ | 935,306 | $ | 348,322 | $ | — | |||||||
Investments held in supplemental retirement plan: | ||||||||||||||||||||||
Assets | 3,486 | 3,486 | 3,486 | |||||||||||||||||||
Included in prepaid expenses and other current assets & other non-current assets | ||||||||||||||||||||||
Liabilities | 3,486 | 3,486 | 3,486 | |||||||||||||||||||
Included in accrued liabilities & other non-current liabilities | ||||||||||||||||||||||
(1) | Certificates of deposit include marketable securities and those with a maturity in excess of one year as of September 28, 2018 are classified within long-term investments. |
(2) | Other long-term investments as of September 28, 2018 include a marketable equity security of $0.2 million, and other investments that are not carried at fair value including an equity method investment of $0.4 million. During fiscal 2018, we recorded write-off charges to reduce the carrying value of two cost method equity investments to zero in recognition of an other-than-temporary impairment for each investment. |
65
September 29, 2017 | ||||||||||||||||||||||
Cost | Unrealized | Estimated Fair Value | ||||||||||||||||||||
Gains | Losses | Total | Level 1 | Level 2 | Level 3 | |||||||||||||||||
Cash and cash equivalents: | ||||||||||||||||||||||
Cash | $ | 623,244 | $ | 623,244 | ||||||||||||||||||
Cash equivalents: | ||||||||||||||||||||||
Commercial paper | 1,223 | — | — | 1,223 | 1,223 | |||||||||||||||||
Money market funds | 2,550 | — | — | 2,550 | 2,550 | |||||||||||||||||
Cash and cash equivalents | 627,017 | — | — | 627,017 | 2,550 | 1,223 | — | |||||||||||||||
Short-term investments: | ||||||||||||||||||||||
Certificate of deposit (1) | 17,236 | 9 | (1 | ) | 17,244 | 17,244 | ||||||||||||||||
U.S. agency securities | 9,518 | — | (20 | ) | 9,498 | 9,498 | ||||||||||||||||
Government bonds | 2,034 | — | (6 | ) | 2,028 | 2,028 | ||||||||||||||||
Commercial paper | 15,160 | 2 | (1 | ) | 15,161 | 15,161 | ||||||||||||||||
Corporate bonds | 174,750 | 54 | (163 | ) | 174,641 | 174,641 | ||||||||||||||||
Municipal debt securities | 29,178 | 16 | (9 | ) | 29,185 | 29,185 | ||||||||||||||||
Short-term investments | 247,876 | 81 | (200 | ) | 247,757 | 2,028 | 245,729 | — | ||||||||||||||
Long-term investments: | ||||||||||||||||||||||
Certificate of deposit (1) | 22,940 | 5 | (6 | ) | 22,939 | 22,939 | ||||||||||||||||
U.S. agency securities | 21,779 | — | (178 | ) | 21,601 | 21,601 | ||||||||||||||||
Government bonds | 17,839 | — | (107 | ) | 17,732 | 17,732 | ||||||||||||||||
Corporate bonds | 218,857 | 327 | (537 | ) | 218,647 | 218,647 | ||||||||||||||||
Municipal debt securities | 28,913 | 29 | (25 | ) | 28,917 | 28,917 | ||||||||||||||||
Other long-term investments (2) | 4,171 | 357 | — | 4,528 | 357 | — | ||||||||||||||||
Long-term investments | 314,499 | 718 | (853 | ) | 314,364 | 18,089 | 292,104 | — | ||||||||||||||
Total cash, cash equivalents, and investments | $ | 1,189,392 | $ | 799 | $ | (1,053 | ) | $ | 1,189,138 | $ | 22,667 | $ | 539,056 | $ | — | |||||||
Investments held in supplemental retirement plan: | ||||||||||||||||||||||
Assets | 3,026 | 3,026 | 3,026 | |||||||||||||||||||
Included in prepaid expenses and other current assets & other non-current assets | ||||||||||||||||||||||
Liabilities | 3,026 | 3,026 | 3,026 | |||||||||||||||||||
Included in accrued liabilities & other non-current liabilities | ||||||||||||||||||||||
(1) | Certificates of deposit include marketable securities and those with a maturity in excess of one year as of September 29, 2017 are classified within long-term investments. |
(2) | Other long-term investments as of September 29, 2017 include a marketable equity security of $0.4 million, and other investments that are not carried at fair value including an equity method investment of $0.6 million and two cost method equity investments of $3.0 million and $0.5 million. During fiscal 2017, we recorded a write-off charge to reduce the carrying value of a cost method equity investment to zero in recognition of an other-than-temporary impairment. |
Fair Value Hierarchy. Fair value is the exchange price that would be received for an asset or paid to transfer a liability in the principal or most advantageous market for the asset or liability, in an orderly transaction between market participants at the measurement date. We minimize the use of unobservable inputs and use observable market data, if available, when determining fair value. We classify our inputs to measure fair value using the following three-level hierarchy:
Level 1: Quoted prices in active markets at the measurement date for identical assets and liabilities. We base the fair value of our Level 1 financial instruments, which are traded in active markets, using quoted market prices for identical instruments.
Level 2: Prices may be based upon quoted prices in active markets or inputs not quoted on active markets but are corroborated by market data. We obtain the fair value of our Level 2 financial instruments from a professional pricing service, which may use quoted market prices for identical or comparable instruments, or model driven valuations using observable market data or inputs corroborated by observable market data. To validate the fair value determination provided by our primary pricing service, we perform quality controls over values received which include comparing our pricing service provider’s assessment of the fair values of our investment securities against the fair values of our investment securities obtained from another independent source, reviewing the pricing movement in the context of overall market trends, and reviewing trading information from our investment managers. In addition, we assess the inputs and methods used in determining the fair value in order to determine the classification of securities in the fair value hierarchy.
Level 3: Unobservable inputs are used when little or no market data is available and reflect management’s estimates of assumptions that market participants would use in pricing the asset or liability.
66
The following table describes the valuation techniques and inputs applicable to each class of security held within our investment portfolio as of September 28, 2018:
Asset Type | Primary Source | Update Frequency | Fair Value Methodology | Secondary Source |
Level 1 | ||||
Money Market Funds | ICE (Intercontinental Exchange) | Daily | $1 per share | Not Applicable |
U.S. Government Bonds | ICE (Intercontinental Exchange) | Daily | Market Prices | Bloomberg |
Level 2 | ||||
Certificates of Deposit | ICE (Intercontinental Exchange) | Monthly | Market Prices | Bloomberg |
Commercial Paper | U.S. Bank Pricing Unit | Daily | Matrix Pricing | Not Applicable |
Corporate Bonds | ICE (Intercontinental Exchange) | Daily | Institutional Bond Quotes - evaluations based on various market and industry inputs | Bloomberg |
Municipal Debt Securities | Standard & Poor's | Daily | Evaluations based on various market and industry inputs | ICE (Intercontinental Exchange) & Bloomberg |
U.S. Agency Securities | ICE (Intercontinental Exchange) | Daily | Institutional Bond Quotes - evaluations based on various market and industry inputs | Bloomberg |
Int'l Government Bonds | ICE (Intercontinental Exchange) Extel Financial Ltd | Daily | Evaluations based on various market factors | Bloomberg |
Securities In Gross Unrealized Loss Position. We periodically evaluate our investments for other-than-temporary declines in fair value. The unrealized losses on our AFS securities were primarily the result of unfavorable changes in interest rates subsequent to the initial purchase of these securities. The following table presents the gross unrealized losses and fair value for those AFS securities that were in an unrealized loss position as of September 28, 2018 and September 29, 2017 (in thousands):
September 28, 2018 | September 29, 2017 | ||||||||||||||||||||||||
Less Than 12 Months | Greater Than 12 Months | Less Than 12 Months | Greater Than 12 Months | ||||||||||||||||||||||
Investment Type | Fair Value | Gross Unrealized Losses | Fair Value | Gross Unrealized Losses | Fair Value | Gross Unrealized Losses | Fair Value | Gross Unrealized Losses | |||||||||||||||||
Certificate of deposit | $ | — | $ | — | $ | — | $ | — | $ | 19,750 | $ | (6 | ) | $ | — | $ | — | ||||||||
U.S. agency securities | — | — | 21,486 | (302 | ) | 19,713 | (91 | ) | 11,386 | (108 | ) | ||||||||||||||
Government bonds | 16,633 | (332 | ) | — | — | 15,029 | (64 | ) | 4,729 | (49 | ) | ||||||||||||||
Commercial paper | 5,737 | (1 | ) | — | — | 4,292 | (1 | ) | — | — | |||||||||||||||
Corporate bonds | 143,051 | (1,680 | ) | 52,162 | (624 | ) | 125,890 | (251 | ) | 109,806 | (449 | ) | |||||||||||||
Municipal debt securities | 41,058 | (191 | ) | 6,965 | (41 | ) | 26,749 | (24 | ) | 3,625 | (10 | ) | |||||||||||||
Total | $ | 206,479 | $ | (2,204 | ) | $ | 80,613 | $ | (967 | ) | $ | 211,423 | $ | (437 | ) | $ | 129,546 | $ | (616 | ) | |||||
Although we had certain securities that were in an unrealized loss position as of September 28, 2018, we expect to recover the full carrying value of these securities as we do not intend to, nor do we currently anticipate a need to sell these securities prior to recovering the associated unrealized losses. As a result, we do not consider any portion of the unrealized losses at either September 28, 2018 or September 29, 2017 to represent an other-than-temporary impairment, nor do we consider any of the unrealized losses to be credit losses.
Investment Maturities. The following table summarizes the amortized cost and estimated fair value of the AFS securities within our investment portfolio based on stated maturities as of September 28, 2018 and September 29, 2017, which are recorded within cash equivalents and both short and long-term investments in our consolidated balance sheets (in thousands):
September 28, 2018 | September 29, 2017 | ||||||||||||
Range of maturity | Amortized Cost | Fair Value | Amortized Cost | Fair Value | |||||||||
Due within 1 year | $ | 191,241 | $ | 190,541 | $ | 251,649 | $ | 251,530 | |||||
Due in 1 to 2 years | 122,131 | 120,545 | 213,555 | 213,154 | |||||||||
Due in 2 to 3 years | 67,423 | 66,637 | 96,773 | 96,682 | |||||||||
Total | $ | 380,795 | $ | 377,723 | $ | 561,977 | $ | 561,366 | |||||
67
5. Property, Plant, & Equipment
PP&E are recorded at cost, with depreciation expense included in cost of licensing, cost of products, cost of services, R&D, S&M, and G&A expenses in our consolidated statements of operations. Depreciation expense was $54.8 million, $53.4 million, and $52.0 million in fiscal 2018, 2017, and 2016, respectively.
As of September 28, 2018 and September 29, 2017, PP&E consisted of the following (in thousands):
Property, Plant, & Equipment | September 28, 2018 | September 29, 2017 | |||||
Land | $ | 43,342 | $ | 43,364 | |||
Buildings and building improvements | 283,474 | 281,196 | |||||
Leasehold improvements | 66,866 | 65,034 | |||||
Machinery and equipment | 111,603 | 98,437 | |||||
Computer equipment and software | 194,079 | 173,341 | |||||
Furniture and fixtures | 30,556 | 28,118 | |||||
Equipment provided under operating leases | 139,201 | 97,456 | |||||
Construction-in-progress | 7,342 | 3,673 | |||||
Property, plant, and equipment, gross | 876,463 | 790,619 | |||||
Less: accumulated depreciation | (362,281 | ) | (305,344 | ) | |||
Property, plant, & equipment, net | $ | 514,182 | $ | 485,275 | |||
6. Goodwill & Intangible Assets
Goodwill
The following table outlines changes to the carrying amount of goodwill (in thousands):
Goodwill | |||
Balance at September 30, 2016 | $ | 309,616 | |
Translation adjustments | 1,471 | ||
Balance at September 29, 2017 | $ | 311,087 | |
Acquired goodwill | 18,394 | ||
Translation adjustments | (1,499 | ) | |
Balance at September 28, 2018 | $ | 327,982 | |
Intangible Assets
Intangible assets are stated at their original cost less accumulated amortization. Intangible assets subject to amortization consisted of the following (in thousands):
September 28, 2018 | September 29, 2017 | ||||||||||||||||||
Intangible Assets, Net | Cost | Accumulated Amortization | Net | Cost | Accumulated Amortization | Net | |||||||||||||
Acquired patents and technology | $ | 319,082 | $ | (152,775 | ) | $ | 166,307 | $ | 299,707 | $ | (128,986 | ) | $ | 170,721 | |||||
Customer relationships | 58,342 | (41,012 | ) | 17,330 | 56,843 | (38,368 | ) | 18,475 | |||||||||||
Other intangibles | 22,742 | (22,360 | ) | 382 | 22,742 | (22,290 | ) | 452 | |||||||||||
Total | $ | 400,166 | $ | (216,147 | ) | $ | 184,019 | $ | 379,292 | $ | (189,644 | ) | $ | 189,648 | |||||
During fiscal 2018 and 2017, we purchased various patents and developed technology for purchase consideration of $21.0 million and $5.3 million, and upon acquisition, these intangible assets had a weighted-average useful life of 10.5 years and 18.0 years, respectively. These acquisitions facilitate our R&D efforts, technologies and potential product offerings.
Amortization expense for our intangible assets is included in cost of licensing, cost of products, R&D and S&M expenses in our consolidated statements of operations. Amortization expense was $26.5 million, $30.9 million, and $33.2 million in fiscal 2018, 2017 and 2016, respectively. As of September 28, 2018, expected amortization expense of our intangible assets in future periods was as follows (in thousands):
68
Fiscal Year | Amortization Expense | ||
2019 | $ | 27,696 | |
2020 | 27,233 | ||
2021 | 27,206 | ||
2022 | 24,542 | ||
2023 | 21,198 | ||
Thereafter | 56,144 | ||
Total | $ | 184,019 | |
7. Stockholders' Equity & Stock-Based Compensation
We provide stock-based awards as a form of compensation for employees, officers and directors. We have issued stock-based awards in the form of stock options and RSUs under our equity incentive plans, as well as shares under our ESPP.
Common Stock - Class A and Class B
Our Board of Directors has authorized two classes of common stock, Class A and Class B. At September 28, 2018, we had authorized 500,000,000 Class A shares and 500,000,000 Class B shares. At September 28, 2018, we had 63,978,752 shares of Class A common stock and 39,261,035 shares of Class B common stock issued and outstanding. Holders of our Class A and Class B common stock have identical rights, except that holders of our Class A common stock are entitled to one vote per share and holders of our Class B common stock are entitled to ten votes per share. Shares of Class B common stock can be converted to shares of Class A common stock at any time at the option of the stockholder and automatically convert upon sale or transfer, except for certain transfers specified in our amended and restated certificate of incorporation.
2005 Stock Incentive Plan
Following shareholder approval in January 2005, our 2005 Stock Plan was adopted by our Board of Directors on February 16, 2005, the day prior to the completion of our IPO. Our 2005 Stock Plan, as amended and restated, provides for the ability to grant incentive stock options, non-qualified stock options, restricted stock, RSUs, stock appreciation rights, deferred stock units, performance units, performance bonus awards, and performance shares. A total of 46.0 million shares of our Class A common stock is authorized for issuance under the 2005 Stock Plan. For awards granted prior to February 2011, any shares subject to an award with a per share price less than the fair market value of our Class A common stock on the date of grant and any shares subject to an outstanding RSU award will be counted against the authorized share reserve as two shares for every one share subject to the award, and if returned to the 2005 Stock Plan, such shares will be counted as two shares for every one share returned. For those awards granted from February 2011 onward, any shares subject to an award with a per share price less than the fair market value of our Class A common stock on the date of grant and any shares subject to an outstanding RSU award will be counted against the authorized share reserve as 1.6 shares for every one share subject to the award, and if returned to the 2005 Stock Plan, such shares will be counted as 1.6 for every one share returned.
Stock Options. Stock options are generally granted at fair market value on the date of grant. Options granted to employees and officers prior to June 2008 generally vest over 4 years, with equal annual cliff-vesting and expire on the earlier of 10 years after the date of grant or three months after termination of service. Options granted to employees and officers from June 2008 onward generally vest over four years, with 25% of the shares subject to the option becoming exercisable on the one-year anniversary of the date of grant and the balance of the shares vesting in equal monthly installments over the following 36 months. These options expire on the earlier of ten years after the date of grant or three months after termination of service. All options granted vest over the requisite service period and upon the exercise of stock options, we issue new shares of Class A common stock under the 2005 Stock Plan. Our 2005 Stock Plan also allows us to grant stock awards which vest based on the satisfaction of specific performance criteria.
Performance-Based Stock Options. In fiscal 2016, we began granting PSOs to our executive officers with shares of our Class A common stock underlying such options. The contractual term for the PSOs is seven years, with vesting contingent upon market-based performance conditions, representing the achievement of specified Dolby annualized TSR targets at the end of a three-year measurement period following the date of grant. If the minimum conditions are met, the PSOs earned will cliff vest on the third anniversary of the grant date, upon certification of achievement of the performance conditions by our Compensation Committee. Anywhere from 0% to 125% of the
69
shares subject to a PSO may vest based on achievement of the performance conditions at the end of the three-year performance period.
In valuing the PSOs which will be recognized as compensation cost, we used a Monte Carlo valuation model. Aside from the use of an expected term for the PSOs commensurate with their shorter contractual term, the nature of the valuation inputs used in the Monte Carlo valuation model were consistent with those used to value our non-performance based options granted under the 2005 Plan. Compensation cost is being amortized on a straight-line basis over the requisite service period.
On December 15, 2017, we granted PSOs to our executive officers exercisable for an aggregate of 264,000 shares at the target award amount, which would be exercisable up to an aggregate of 330,000 shares at 125% of the target award amount. On December 15, 2016, we granted PSOs to our executive officers exercisable for an aggregate of 276,199 shares at the target award amount, which would be exercisable for an aggregate of up to 345,248 shares at 125% of the target award amount. On December 15, 2015, we granted PSOs to our executive officers exercisable for an aggregate of 335,699 shares at the target award amount, which would be exercisable for an aggregate of up to 419,623 shares at 125% of the target award amount. As of September 28, 2018, PSOs exercisable for an aggregate of 784,898 shares at the target award amount, which would be exercisable for an aggregate of up to 981,121 shares at 125% of the target award amount, were outstanding.
The following table summarizes information about stock options issued under our 2005 Stock Plan:
Shares | Weighted-Average Exercise Price | Weighted-Average Remaining Contractual Life | Aggregate Intrinsic Value (1) | ||||||
(in thousands) | (in years) | (in thousands) | |||||||
Options outstanding at September 29, 2017 | 8,741 | $ | 38.65 | ||||||
Grants | 1,420 | 62.34 | |||||||
Exercises | (2,473 | ) | 37.33 | ||||||
Forfeitures and cancellations | (390 | ) | 40.58 | ||||||
Options outstanding at September 28, 2018 | 7,298 | 43.61 | 6.6 | $ | 192,397 | ||||
Options vested and expected to vest at September 28, 2018 | 6,911 | 43.06 | 6.6 | 185,978 | |||||
Options exercisable at September 28, 2018 | 3,889 | $ | 37.88 | 5.7 | 124,812 | ||||
(1) | Aggregate intrinsic value is based on the closing price of our Class A common stock on September 28, 2018 of $69.97 and excludes the impact of options that were not in-the-money. |
Restricted Stock Units. Beginning in fiscal 2008, we began granting RSUs to certain directors, officers and employees under our 2005 Stock Plan. Awards granted to employees and officers generally vest over four years, with equal annual cliff-vesting. Awards granted to directors prior to November 2010 generally vest over three years, with equal annual cliff-vesting. Awards granted after November 2010 and prior to fiscal 2014 to new directors vest over approximately two years, with 50% vesting per year, while awards granted from November 2010 onward to ongoing directors generally vest over approximately one year. Awards granted to new directors from fiscal 2014 onward vest on the earlier of the first anniversary of the award’s date of grant, or the day immediately preceding the date of the next annual meeting of stockholders that occurs after the award’s date of grant. Our 2005 Stock Plan also allows us to grant RSUs that vest based on the satisfaction of specific performance criteria, although no such awards had been granted as of September 28, 2018. At each vesting date, the holder of the award is issued shares of our Class A common stock. Compensation expense from these awards is equal to the fair market value of our Class A common stock on the date of grant and is recognized on a straight-line basis over the requisite service period.
70
The following table summarizes information about RSUs issued under our 2005 Stock Plan:
Shares | Weighted-Average Grant Date Fair Value | ||||
(in thousands) | |||||
Non-vested at September 29, 2017 | 2,839 | $ | 44.38 | ||
Granted | 1,341 | 62.84 | |||
Vested | (1,045 | ) | 40.77 | ||
Forfeitures | (329 | ) | 44.62 | ||
Non-vested at September 28, 2018 | 2,806 | $ | 54.52 | ||
The fair value as of the respective vesting dates of RSUs were as follows (in thousands):
Fiscal Year Ended | |||||||||
September 28, 2018 | September 29, 2017 | September 30, 2016 | |||||||
Restricted stock units - vest date fair value | $ | 64,755 | $ | 51,985 | $ | 40,283 | |||
Employee Stock Purchase Plan. Our plan allows eligible employees to have up to 10 percent of their eligible compensation withheld and used to purchase Class A common stock, subject to a maximum of $25,000 worth of stock purchased in a calendar year or no more than 1,000 shares in an offering period, whichever is less. An offering period consists of successive six-month purchase periods, with a look back feature to our stock price at the commencement of a one-year offering period. The plan provides for a discount equal to 15 percent of the lower of the closing price of our Class A common stock on the New York Stock Exchange on the first and last day of the offering periods. The plan also includes an automatic reset feature that provides for an offering period to be reset and recommenced to a new lower-priced offering if the offering price of a new offering period is less than that of the immediately preceding offering period.
Stock Option Valuation Assumptions
We use the Black-Scholes option pricing model to determine the estimated fair value of employee stock options at the date of the grant. The Black-Scholes model includes inputs that require us to make certain estimates and assumptions regarding the expected term of the award, as well as the future risk-free interest rate, and the volatility of our stock price over the expected term of the award.
Expected Term. The expected term of an award represents the estimated period of time that options granted will remain outstanding, and is measured from the grant date to the date at which the option is either exercised or canceled. Our determination of the expected term involves an evaluation of historical terms and other factors such as the exercise and termination patterns of our employees who hold options to acquire our Class A common stock, and is based on certain assumptions made regarding the future exercise and termination behavior.
Risk-Free Interest Rate. The risk-free interest rate is based on the yield curve of United States Treasury instruments in effect on the date of grant. In determining an estimate for the risk-free interest rate, we use average interest rates based on these instruments’ constant maturities with a term that approximates and corresponds with the expected term of our awards.
Expected Stock Price Volatility. The expected volatility represents the estimated volatility in the price of our Class A common stock over a time period that approximates the expected term of the awards, and is determined using a blended combination of historical and implied volatility. Historical volatility is representative of the historical trends in our stock price for periods preceding the measurement date for a period that is commensurate with the expected term. Implied volatility is based upon externally traded option contracts of our Class A common stock.
Dividend Yield. The dividend yield is based on our anticipated dividend payout over the expected term of our option awards. Dividend declarations and the establishment of future record and payment dates are subject to the Board of Directors’ continuing determination that the dividend policy is in the best interests of our stockholders. The dividend policy may be changed or canceled at the discretion of the Board of Directors at any time.
71
The weighted-average assumptions used in the determination of the fair value of our stock options were as follows:
Fiscal Year Ended | ||||||
September 28, 2018 | September 29, 2017 | September 30, 2016 | ||||
Expected term (in years) | 5.06 | 5.13 | 5.24 | |||
Risk-free interest rate | 2.2 | % | 2.1 | % | 1.7 | % |
Expected stock price volatility | 22.6 | % | 27.4 | % | 29.8 | % |
Dividend yield | 1.1 | % | 1.1 | % | 1.4 | % |
The following table summarizes the weighted-average fair value (per share) of stock options granted and the total intrinsic value of stock options exercised (in thousands):
Fiscal Year Ended | |||||||||
September 28, 2018 | September 29, 2017 | September 30, 2016 | |||||||
Stock options granted - weighted-average grant date fair value | $ | 13.19 | $ | 11.39 | $ | 8.49 | |||
Stock options exercised - intrinsic value | 63,973 | 28,544 | 27,485 | ||||||
Stock-Based Compensation Expense
Stock-based compensation expense for equity awards granted to employees is determined by estimating their fair value on the date of grant, and recognizing that value as an expense on a straight-line basis over the requisite service period in which our employees earn the awards. Compensation expense related to these equity awards is recognized net of estimated forfeitures, which reduce the expense recorded in the consolidated statements of operations. Our methodology under which estimated forfeiture rates are derived is based on an evaluation of trends in our historical forfeiture data with consideration for other potential driving factors. If in subsequent periods actual forfeitures significantly differ from our estimates, we will revise such estimates accordingly. Beginning in fiscal 2015, we revised the method under which we estimate forfeitures. The impact of this change in estimate was not material. The estimated annual forfeiture rates used for awards granted were 9.91%, 10.16% and 10.49% in fiscal 2018, 2017, and 2016, respectively.
The following tables separately present stock-based compensation expense both by award type and classification within our consolidated statements of operations (in thousands):
Expense - By Award Type
Fiscal Year Ended | |||||||||
September 28, 2018 | September 29, 2017 | September 30, 2016 | |||||||
Stock options | $ | 21,083 | $ | 18,630 | $ | 21,311 | |||
Restricted stock units | 46,162 | 43,171 | 42,201 | ||||||
Employee stock purchase plan | 4,004 | 3,542 | 3,473 | ||||||
Total stock-based compensation | 71,249 | 65,343 | 66,985 | ||||||
Estimated benefit from income taxes | (12,595 | ) | (18,959 | ) | (19,627 | ) | |||
Total stock-based compensation, net of tax | $ | 58,654 | $ | 46,384 | $ | 47,358 | |||
Expense - By Income Statement Classification
Fiscal Year Ended | |||||||||
Compensation Expense - By Classification | September 28, 2018 | September 29, 2017 | September 30, 2016 | ||||||
Cost of products | $ | 1,009 | $ | 946 | $ | 859 | |||
Cost of services | 565 | 512 | 547 | ||||||
Research and development | 19,515 | 18,497 | 17,771 | ||||||
Sales and marketing | 24,997 | 26,175 | 27,579 | ||||||
General and administrative | 25,163 | 19,213 | 20,229 | ||||||
Total stock-based compensation | 71,249 | 65,343 | 66,985 | ||||||
Estimated benefit from income taxes | (12,595 | ) | (18,959 | ) | (19,627 | ) | |||
Total stock-based compensation, net of tax | $ | 58,654 | $ | 46,384 | $ | 47,358 | |||
72
The tax benefit that we recognize from shares issued under our ESPP is excluded from the tables above. This benefit was as follows (in thousands):
Fiscal Year Ended | |||||||||
September 28, 2018 | September 29, 2017 | September 30, 2016 | |||||||
Tax benefit - shares issued under ESPP | $ | 577 | $ | 802 | $ | 550 | |||
Unrecognized Compensation Expense. At September 28, 2018, total unrecognized compensation expense associated with employee stock options expected to vest was approximately $26.8 million, which is expected to be recognized over a weighted-average period of 2.2 years. At September 28, 2018, total unrecognized compensation expense associated with RSUs expected to vest was approximately $98.2 million, which is expected to be recognized over a weighted-average period of 2.4 years.
Common Stock Repurchase Program
In November 2009, we announced a stock repurchase program ("program"), providing up to $250.0 million to be used for the repurchase of our Class A common stock. The following table summarizes the initial amount of authorized repurchases as well as additional repurchases approved by our Board of Directors as of September 28, 2018 (in thousands):
Authorization Period | Authorization Amount | ||
Fiscal 2010: November 2009 | $ | 250,000 | |
Fiscal 2010: July 2010 | 300,000 | ||
Fiscal 2011: July 2011 | 250,000 | ||
Fiscal 2012: February 2012 | 100,000 | ||
Fiscal 2015: October 2014 | 200,000 | ||
Fiscal 2017: January 2017 | 200,000 | ||
Fiscal 2018: July 2018 | 350,000 | ||
Total | $ | 1,650,000 | |
Stock repurchases under the program may be made through open market transactions, negotiated purchases, or otherwise, at times and in amounts that we consider appropriate. The timing of repurchases and the number of shares repurchased depend upon a variety of factors, including price, regulatory requirements, the rate of dilution from our equity compensation plans and other market conditions. The program does not have a specified expiration date, and can be limited, suspended or terminated at our discretion at any time without prior notice. Shares repurchased under the program will be returned to the status of authorized but unissued shares of Class A common stock. As of September 28, 2018, the remaining authorization to purchase additional shares is approximately $351.5 million.
The following table provides information regarding share repurchase activity under the program in fiscal 2018:
Quarterly Repurchase Activity | Shares Repurchased | Cost (1) | Average Price Paid Per Share (2) | |||||
(in thousands) | ||||||||
Q1 - Quarter ended December 29, 2017 | 493,884 | $ | 29,999 | $ | 60.73 | |||
Q2 - Quarter ended March 30, 2018 | 77,705 | 5,001 | 64.33 | |||||
Q3 - Quarter ended June 29, 2018 | 896,689 | 55,480 | 61.86 | |||||
Q4 - Quarter ended September 28, 2018 | 912,822 | 59,990 | 65.71 | |||||
Total | 2,381,100 | $ | 150,470 | |||||
(1) | Cost of share repurchases includes the price paid per share and applicable commissions. |
(2) | Average price paid per share excludes commission costs. |
Dividend Program
The following table summarizes dividends declared under the program during fiscal 2018:
73
Fiscal Period | Announcement Date | Record Date | Payment Date | Cash Dividend Per Common Share | Dividend Payment | |||
Fiscal 2018 | ||||||||
Q1 - Quarter ended December 29, 2017 | January 24, 2018 | February 5, 2018 | February 14, 2018 | $ | 0.16 | $16.6 million | ||
Q2 - Quarter ended March 30, 2018 | April 24, 2018 | May 7, 2018 | May 16, 2018 | $ | 0.16 | $16.7 million | ||
Q3 - Quarter ended June 29, 2018 | July 24, 2018 | August 6, 2018 | August 14, 2018 | $ | 0.16 | $16.6 million | ||
Q4 - Quarter ended September 28, 2018 | October 24, 2018 | November 5, 2018 | November 14, 2018 | $ | 0.19 | $19.6 million | (1) | |
(1) | The dividend payment amount is estimated based on the number of shares of our Class A and Class B common stock that we estimate will be outstanding as of the Record Date. |
8. Accumulated Other Comprehensive Income
OCI consists of two components: unrealized gains or losses on our AFS marketable investment securities, and the gain or loss from foreign currency translation adjustments, both of which accumulate and are included within AOCI, a subsection within stockholders’ equity in our consolidated balance sheets. Unrealized gains and losses on our investment securities are reclassified from AOCI into earnings when realized upon sale, and are determined based on specific identification of securities sold. Gains and losses from foreign currency translation adjustments relate to the translation of assets and liabilities denominated in non-U.S. dollar functional currencies.
The following table summarizes the changes in the accumulated balances during the period, and includes information regarding the manner in which the reclassifications out of AOCI into earnings affect our consolidated statements of operations (in thousands):
Fiscal Year Ended September 28, 2018 | Fiscal Year Ended September 29, 2017 | ||||||||||||||||||
Investment Securities | Currency Translation Adjustments | Total | Investment Securities | Currency Translation Adjustments | Total | ||||||||||||||
Beginning Balance | $ | (377 | ) | $ | (7,376 | ) | $ | (7,753 | ) | $ | 742 | $ | (10,939 | ) | $ | (10,197 | ) | ||
Other comprehensive income before reclassifications: | |||||||||||||||||||
Unrealized gains/(losses) - investment securities | (2,213 | ) | — | (2,213 | ) | (1,062 | ) | (1,062 | ) | ||||||||||
Foreign currency translation gains/(losses) (1) | — | (5,614 | ) | (5,614 | ) | 4,184 | 4,184 | ||||||||||||
Income tax effect - benefit/(expense) | — | 106 | 106 | 12 | (621 | ) | (609 | ) | |||||||||||
Net of tax | (2,213 | ) | (5,508 | ) | (7,721 | ) | (1,050 | ) | 3,563 | 2,513 | |||||||||
Amounts reclassified from AOCI into earnings: | |||||||||||||||||||
Realized gains/(losses) - investment securities (1) | (447 | ) | (447 | ) | (95 | ) | (95 | ) | |||||||||||
Income tax effect - benefit/(expense) (2) | 89 | 89 | 26 | 26 | |||||||||||||||
Net of tax | (358 | ) | — | (358 | ) | (69 | ) | — | (69 | ) | |||||||||
Net current-period other comprehensive income/(loss) | (2,571 | ) | (5,508 | ) | (8,079 | ) | (1,119 | ) | 3,563 | 2,444 | |||||||||
Ending Balance | $ | (2,948 | ) | $ | (12,884 | ) | $ | (15,832 | ) | $ | (377 | ) | $ | (7,376 | ) | $ | (7,753 | ) | |
(1) | Realized gains or losses, if any, from the sale of our AFS investment securities or from foreign currency translation adjustments are included within other income/expense, net in our consolidated statements of operations. |
(2) | The income tax benefit or expense is included within provision for income taxes in our consolidated statements of operations. |
9. Earnings Per Share
Basic EPS is computed by dividing net income attributable to Dolby Laboratories, Inc. by the number of weighted-average shares of Class A and Class B common stock outstanding during the period. Through application of the treasury stock method, diluted EPS is computed in the same manner, except that the number of weighted-average shares outstanding is increased by the number of potentially dilutive shares from employee incentive plans during the period. Potentially dilutive shares include the hypothetical number of shares issued under the assumed exercise of outstanding stock options and vesting of outstanding RSUs.
Basic and diluted EPS are computed independently for each fiscal quarter and year-to-date period presented, which involves the use of different weighted-average share count figures relating to quarterly and annual periods. As a result, and after factoring the effect of rounding to the nearest cent per share, the sum of all four quarter-to-date EPS figures may not equal year-to-date EPS.
74
The following table sets forth the computation of basic and diluted EPS attributable to Dolby Laboratories, Inc. (in thousands, except per share amounts):
Fiscal Year Ended | |||||||||
September 28, 2018 | September 29, 2017 | September 30, 2016 | |||||||
Numerator: | |||||||||
Net income attributable to Dolby Laboratories, Inc. | $ | 122,246 | $ | 201,802 | $ | 185,860 | |||
Denominator: | |||||||||
Weighted-average shares outstanding—basic | 103,377 | 101,784 | 100,717 | ||||||
Potential common shares from options to purchase common stock | 2,370 | 1,098 | 1,013 | ||||||
Potential common shares from restricted stock units | 1,231 | 404 | 694 | ||||||
Weighted-average shares outstanding—diluted | 106,978 | 103,286 | 102,424 | ||||||
Net income per share attributable to Dolby Laboratories, Inc.: | |||||||||
Basic | $ | 1.18 | $ | 1.98 | $ | 1.85 | |||
Diluted | $ | 1.14 | $ | 1.95 | $ | 1.81 | |||
Antidilutive awards excluded from calculation: | |||||||||
Stock options | 1,043 | 160 | 2,971 | ||||||
Restricted stock units | 6 | — | 30 | ||||||
10. Income Taxes
Our income tax expense, deferred tax assets and liabilities, and reserves for unrecognized tax benefits reflect management's best assessment of estimated current and future taxes to be paid. We are subject to income taxes in both the U.S. and numerous foreign jurisdictions. Significant judgments and estimates are required in determining the consolidated income tax expense.
Tax Act Enacted in 2017
On December 22, 2017, the U.S. government enacted comprehensive tax legislation commonly referred to as the Tax Act. The Tax Act makes broad and complex changes to the U.S. tax code, including, but not limited to, (1) reducing the U.S. federal corporate income tax rate from 35 percent to 21 percent; (2) requiring companies to pay a one-time transition tax on accumulated earnings of foreign subsidiaries; (3) implementing a modified territorial tax system and how foreign earnings are subject to U.S. tax; (4) capitalizing specific R&D expenses which are amortized over five to 15 years; and (5) eliminating the domestic manufacturing deduction.
Consistent with applicable Securities and Exchange Commission (“SEC”) guidance, we made a reasonable estimate of the accounting impact of the Tax Act. We recorded a total provisional amount of $121.4 million in our fiscal 2018 income tax provision as follows:
• | Remeasurement of net deferred tax assets: The Tax Act reduces the corporate tax rate from 35 percent to 21 percent, which results in an estimated net decrease of $49.6 million in our net deferred tax asset balance. While we are able to make a reasonable estimate of the impact of the reduced corporate tax rate on our net deferred tax asset balances, our deferred taxes may be affected by changes in our interpretations and assumptions, as well as additional guidance on the interpretation of the Tax Act. |
• | Deemed Repatriation Transition Tax: The Deemed Repatriation Transition Tax ("Transition Tax") is a one time tax on the accumulated earnings of our foreign subsidiaries. To determine the amount of the Transition Tax, we must determine, in addition to other factors, the amount of post-1986 earnings and profits of the relevant subsidiaries as of December 31, 2017, as well as the amount of foreign income taxes paid on such earnings and profits. The portion of earnings and profits comprised of cash and other specified assets is taxed at a rate of 15.5 percent and any remaining amount of earnings and profits is taxed at a rate of eight percent. We made a reasonable estimate of the Transition Tax and recorded a liability for a provisional Transition Tax obligation of $71.8 million which the Tax Act allows us to pay in installments over a period of eight years. This provisional estimate will be updated when additional information regarding our accumulated earnings and profit and non-U.S. income taxes paid becomes available. |
75
Other significant provisions that are effective beginning in our fiscal year 2019 include: a modified territorial tax system, an incremental tax on excessive payments to foreign related parties, and a minimum tax on certain low taxed foreign earnings ("minimum foreign tax"). Under GAAP, we are allowed to make an accounting policy election to either (1) treat the future taxes due as a current period expense or (2) factor such amounts into our measurement of deferred taxes. We have yet to make the policy election, therefore its impact has not been reflected in our fiscal year 2018 financial statements.
The final transitional impacts of the Tax Act may differ from our current estimate, due to, among other things, changes in interpretations of the Tax Act, any legislative actions to address questions that arise because of the Tax Act, any changes in accounting standards for income taxes or related interpretations in response to the Tax Act, and any updates or changes to estimates we have utilized to calculate the transition impacts. The SEC has issued rules that would allow for a measurement period of up to one year after the enactment date of the Tax Act to finalize the recording of the related tax impacts. We currently anticipate finalizing and recording any resulting adjustments by the end of our quarter ending December 28, 2018.
Income Tax Provision
The following two tables present the components of our income before provision for income taxes by geographic region and the portion of our provision for income taxes classified as current and deferred (in thousands):
Fiscal Year Ended | |||||||||
September 28, 2018 | September 29, 2017 | September 30, 2016 | |||||||
United States | $ | 75,689 | $ | 28,221 | $ | 37,223 | |||
Foreign | 237,178 | 228,423 | 198,681 | ||||||
Total | $ | 312,867 | $ | 256,644 | $ | 235,904 | |||
Fiscal Year Ended | |||||||||
September 28, 2018 | September 29, 2017 | September 30, 2016 | |||||||
Current: | |||||||||
Federal | $ | 40,624 | $ | 30,719 | $ | 19,226 | |||
State | 333 | 610 | 521 | ||||||
Foreign | 59,383 | 55,531 | 52,492 | ||||||
Total current | 100,340 | 86,860 | 72,239 | ||||||
Deferred: | |||||||||
Federal | 71,988 | (27,345 | ) | (19,540 | ) | ||||
State | 18,243 | (4,596 | ) | (3,451 | ) | ||||
Foreign | (509 | ) | (702 | ) | 254 | ||||
Total deferred | 89,722 | (32,643 | ) | (22,737 | ) | ||||
Provision for income taxes | $ | 190,062 | $ | 54,217 | $ | 49,502 | |||
Repatriation of Undistributed Foreign Earnings
As a result of the Tax Act, foreign accumulated earnings that were subject to the mandatory Transition Tax as of December 31, 2017, can be repatriated to the U.S. without incurring further U.S. federal tax. The Tax Act moves towards a modified territorial tax system through the provision of a 100% dividend received deduction for the foreign-source portions of dividends received from controlled foreign subsidiaries. As a result, we continue to evaluate the indefinite reinvestment assertions with regards to unremitted earnings for certain of our foreign subsidiaries. During the fiscal year, we repatriated $450 million of foreign subsidiary earnings which were exempt from foreign withholding tax. Future repatriation of cash and other property held by our foreign subsidiaries will generally not be subject to U.S. federal tax. As of September 28, 2018, the total undistributed earnings of our non-U.S. subsidiaries were approximately $526 million. Historically, we have asserted our intention to indefinitely reinvest a portion of the undistributed earnings of certain foreign subsidiaries. However, we have reevaluated our historical assertion as a result of the Tax Act and determined that we no longer consider a vast majority of these earnings to be indefinitely reinvested. As such, we have recorded an immaterial provisional estimate of U.S. state income tax liability on those undistributed foreign earnings. The unrecognized deferred tax liability on the portion of the undistributed earnings considered indefinitely reinvested is not material.
76
Withholding Taxes
We recognize licensing revenue gross of withholding taxes, which our licensees remit directly to their local tax authorities, and for which we receive a partial foreign tax credit in our income tax provision. The foreign current tax provision includes this withholding tax expense while the appropriate foreign tax credit benefit is included in current federal and foreign tax provision. Withholding taxes were as follows (in thousands):
Fiscal Year Ended | |||||||||
September 28, 2018 | September 29, 2017 | September 30, 2016 | |||||||
Withholding taxes | $ | 50,313 | $ | 48,012 | $ | 45,151 | |||
Deferred Income Taxes
Deferred income taxes reflect the net tax effects of temporary differences between the carrying amounts of assets and liabilities for financial reporting purposes and the amounts used for income tax purposes, using enacted tax rates in effect for the year in which the differences are expected to reverse. A summary of the tax effects of the temporary differences were as follows (in thousands):
Fiscal Year Ended | ||||||
September 28, 2018 | September 29, 2017 | |||||
Deferred income tax assets: | ||||||
Investments | $ | 2,215 | $ | 2,327 | ||
Inventories | 4,070 | 6,821 | ||||
Net operating loss | 2,174 | 2,806 | ||||
Accrued expenses | 12,573 | 19,732 | ||||
Stock-based compensation | 15,601 | 26,970 | ||||
Revenue recognition | 33,464 | 53,843 | ||||
Depreciation and amortization | 16,078 | 52,876 | ||||
Research and development credits | 21,302 | 15,504 | ||||
Foreign tax credits | 9,345 | 10,140 | ||||
Translation adjustment | — | 625 | ||||
Other | 3,335 | 6,696 | ||||
Total gross deferred income tax assets | 120,157 | 198,340 | ||||
Less: valuation allowance | (16,256 | ) | — | |||
Total deferred income tax assets | 103,901 | 198,340 | ||||
Deferred income tax liabilities: | ||||||
Intangibles | (2,831 | ) | (2,277 | ) | ||
International earnings | — | (4,855 | ) | |||
Unrealized gain on investments | — | (293 | ) | |||
Deferred income tax assets, net (non-current) | $ | 101,070 | $ | 190,915 | ||
NOL and Tax Credit Carryforwards
At September 28, 2018, the NOL carried forward for California tax purposes was $5.8 million and will expire in fiscal 2029 if unused. Additionally, we had total foreign NOL carryforwards of $8.6 million as of September 28, 2018, an amount which is not subject to expiration. At September 28, 2018, we also had foreign tax credit and federal R&D tax credit carryforwards of $6.9 million and $4.9 million, respectively, which will expire between fiscal 2025 and fiscal 2035, and California and foreign R&D tax credits of $24.1 million and $1.8 million, respectively, which will be carried forward indefinitely.
Establishment of Valuation Allowance
In fiscal 2018, a $16.3 million valuation allowance was established for California R&D credit carryforwards for which ultimate realization of its future benefits is uncertain.
77
Effective Tax Rate
Each period, the combination of multiple different factors can impact our effective tax rate. These factors include both recurring items such as tax rates and the relative amount of income earned in foreign jurisdictions, as well as discrete items that may occur in, but are not necessarily consistent between periods. The benefit associated with the foreign rate differential shown below is net of the impact of uncertain tax positions affecting the amount of income subject to foreign taxation. A reconciliation of the federal statutory tax rate to our effective tax rate on income from continuing operations was as follows:
Fiscal Year Ended | ||||||
September 28, 2018 | September 29, 2017 | September 30, 2016 | ||||
Federal statutory rate | 24.6 | % | 35.0 | % | 35.0 | % |
State income taxes, net of federal effect | 0.7 | 0.7 | 0.7 | |||
Stock-based compensation expense rate | (3.2 | ) | 1.4 | 1.5 | ||
Research and development tax credits | (2.8 | ) | (3.7 | ) | (5.2 | ) |
Tax exempt interest | — | (0.1 | ) | (0.1 | ) | |
U.S. manufacturing tax incentives | (0.2 | ) | (0.8 | ) | (1.1 | ) |
Foreign rate differential | (3.9 | ) | (11.7 | ) | (9.5 | ) |
Audit settlements | — | (0.6 | ) | (2.3 | ) | |
Tax Act | 38.8 | — | — | |||
Establishment of Valuation Allowance | 5.2 | — | — | |||
Other | 1.5 | 0.9 | 2.0 | |||
Effective tax rate | 60.7 | % | 21.1 | % | 21.0 | % |
Our effective tax rate was 60.7% in fiscal 2018, compared with our blended federal statutory rate of 24.6% (as a result of the change from 35% to 21% during the year), and with our effective tax rate in fiscal 2017 of 21.1%. The increase in our effective tax rate reflects the impact from the Tax Act, most notably the remeasurement of net deferred tax assets and the Transition Tax on the accumulated earnings of our foreign subsidiaries, the establishment of a valuation allowance against California tax credits, and reduced by excess benefit related to stock-based awards.
Our effective tax rate was 21.0% in fiscal 2016 and was 21.1% in fiscal 2017. The effective tax rate in fiscal 2017 compared to fiscal 2016 reflects a benefit from a higher proportion of our overall earnings being attributable to lower tax-rate jurisdictions, offset by reduced benefits from both federal R&D tax credits and lower settlements from prior years' state audits.
Uncertain Tax Positions
As of September 28, 2018, the total amount of gross unrecognized tax benefits was $102.0 million, of which $96.9 million, if recognized, would reduce our effective tax rate. Our liability for unrecognized tax benefits is classified within other non-current liabilities in our consolidated balance sheets. Over the next twelve months, we estimate that this amount will be reduced by $1.9 million as a result of the expiration of certain statute of limitations. Aggregate changes in the balance of gross unrecognized tax benefits, excluding interest and penalties, were as follows (in thousands):
Fiscal Year Ended | |||||||||
September 28, 2018 | September 29, 2017 | September 30, 2016 | |||||||
Beginning Balance | $ | 98,665 | $ | 75,168 | $ | 65,161 | |||
Gross increases - tax positions taken during prior years | — | 308 | 4,343 | ||||||
Gross decreases - tax positions taken during prior years | (2,209 | ) | — | — | |||||
Gross increases - tax positions taken during current year | 9,580 | 26,724 | 26,585 | ||||||
Gross decreases - settlements with tax authorities during current year | (130 | ) | (1,101 | ) | (20,086 | ) | |||
Lapse of statute of limitations | (3,897 | ) | (2,434 | ) | (835 | ) | |||
Ending Balance | $ | 102,009 | $ | 98,665 | $ | 75,168 | |||
78
Classification of Interest and Penalties
We include interest and penalties related to gross unrecognized tax benefits within our provision for income taxes. To the extent accrued interest and penalties do not ultimately become payable, amounts accrued are reduced in the period that such determination is made and are reflected as a reduction of the overall income tax provision. In fiscal year 2018, our current tax provision was increased by interest expense of $3.0 million, while in fiscal year 2017, our current tax provision was increased by interest expense of $1.8 million. Accrued interest and penalties are included within the related tax liability line item in our consolidated balance sheets. Our accrued interest and penalties on unrecognized tax benefits as of September 28, 2018 and September 29, 2017 were as follows (in thousands):
Fiscal Year Ended | ||||||
September 28, 2018 | September 29, 2017 | |||||
Accrued interest | $ | 6,778 | $ | 3,733 | ||
Accrued penalties | 42 | 55 | ||||
Total | $ | 6,820 | $ | 3,788 | ||
We continue to monitor the progress of ongoing income tax controversies and the impact, if any, of the expected tolling of the statute of limitations in various taxing jurisdictions. We file income tax returns in the U.S. federal jurisdiction and in many state and foreign jurisdictions. The material income tax jurisdictions are the United States federal, California, New York, and the Netherlands.
We are currently under audit by the State of New York for fiscal years 2014 and 2015 and Spain for fiscal years 2012 through 2015. In the U.S federal jurisdiction, other major states, and major foreign jurisdictions, the fiscal years subsequent to 2013, 2013, and 2011, respectively, remain open and could be subject to examination by the taxing authorities.
Management does not believe that the outcome of any ongoing examination will have a material impact on our consolidated financial statements. We believe that an adequate provision has been made for any adjustments that may result from tax examinations. However, the outcome of tax audits cannot be predicted with certainty. If resolution of any tax issues addressed in our current audits are inconsistent with management’s expectations, we may be required to adjust our tax provision for income taxes in the period such resolution occurs.
11. Restructuring
Restructuring charges recorded in our statements of operations represent costs associated with separate individual restructuring plans implemented in various fiscal periods. Accruals for restructuring charges are included within accrued liabilities in our consolidated balance sheets while restructuring charges are included within restructuring charges in our consolidated statements of operations.
Fiscal 2017 Restructuring Plan. In September 2017, we implemented a plan to reduce certain activities in order to reallocate those resources towards higher priority investment areas. As a result, we recorded $12.9 million in restructuring costs during fiscal 2017, representing severance and other related benefits offered to approximately 80 employees that were affected by this action. The table presented below summarizes changes in restructuring accruals under this plan (in thousands):
Severance and associated costs | |||
Restructuring charges | $ | 12,856 | |
Cash payments | (168 | ) | |
Non-cash and other adjustments | — | ||
Balance at September 29, 2017 | $ | 12,688 | |
Restructuring charges | 23 | ||
Cash payments | (12,005 | ) | |
Non-cash and other adjustments | (582 | ) | |
Balance at September 28, 2018 | $ | 124 | |
Fiscal 2016 Restructuring Plan. In January 2016, we implemented a plan to reorganize and consolidate certain activities and positions within our global business infrastructure. As a result, we recorded $1.3 million in restructuring costs during fiscal 2016, representing severance and other related benefits offered to approximately 30 employees that were affected by this action. The table presented below summarizes changes in restructuring accruals under this
plan, and reflects the completion of activity during fiscal 2016 (in thousands):
Severance and associated costs | |||
Restructuring charges | $ | 1,294 | |
Cash payments | (1,233 | ) | |
Non-cash and other adjustments | (61 | ) | |
Balance at September 30, 2016 | $ | — | |
12. Commitments & Contingencies
In the ordinary course of business, we enter into contractual agreements with third parties that include non-cancelable payment obligations, for which we are liable in future periods. These arrangements can include terms binding us to minimum payments and/or penalties if we terminate the agreement for any reason other than an event of default as described by the agreement. The following table presents a summary of our contractual obligations and commitments as of September 28, 2018 (in thousands):
Payments Due By Fiscal Period | |||||||||||||||||||||
Fiscal 2019 | Fiscal 2020 | Fiscal 2021 | Fiscal 2022 | Fiscal 2023 | Thereafter | Total | |||||||||||||||
Naming rights | $ | 7,811 | $ | 7,909 | $ | 8,008 | $ | 8,108 | $ | 8,209 | $ | 78,656 | $ | 118,701 | |||||||
Operating leases | 17,117 | 14,371 | 11,522 | 9,967 | 9,240 | 19,928 | 82,145 | ||||||||||||||
Purchase obligations | 58,449 | 22,844 | 477 | 333 | — | — | 82,103 | ||||||||||||||
Donation commitments | 8,275 | 297 | 97 | 97 | 97 | 761 | 9,624 | ||||||||||||||
Total | $ | 91,652 | $ | 45,421 | $ | 20,104 | $ | 18,505 | $ | 17,546 | $ | 99,345 | $ | 292,573 | |||||||
Naming Rights. We are party to an agreement for naming rights and related benefits with respect to the Dolby Theatre in Hollywood, California, the location of the Academy Awards®. The term of the agreement is 20 years, over which we will make payments on a semi-annual basis until fiscal 2032. Our payment obligations are conditioned in part on the Academy Awards being held and broadcast from the Dolby Theatre.
Operating Leases. Operating lease payments represent our commitments for future minimum rent made under non-cancelable leases for office space, including those payable to our principal stockholder and portions attributable to the controlling interests in our wholly owned subsidiaries. The following table summarizes information about our total rental expenses under operating leases, including the portion of this total rent expense which is payable to our principal stockholder (in thousands):
Fiscal Year Ended | |||||||||
September 28, 2018 | September 29, 2017 | September 30, 2016 | |||||||
Total rent expense | $ | 17,161 | $ | 15,091 | $ | 13,288 | |||
Purchase Obligations. Purchase obligations primarily consist of our commitments made under agreements to purchase goods and services related to Dolby Cinema and for purposes that include IT and telecommunications, marketing and professional services, and manufacturing and other R&D activities.
Donation Commitments. Our donation commitments relate to non-cancelable obligations to the Museum of the Academy of Motion Picture Arts and Sciences in Los Angeles, California, and the Smithsonian Institution in Washington, DC. Our commitment to the Museum of the Academy of Motion Picture Arts and Sciences is for 15 years from its expected opening date in fiscal 2019, and the Smithsonian Institution is for the next 5 years. Both donation commitments consist of the installation of imaging and audio products in its theaters and providing maintenance services in exchange for various marketing, branding, and publicity benefits.
Purchase Obligations. Purchase obligations primarily consist of our commitments made under agreements to purchase goods and services related to Dolby Cinema and for purposes that include IT and telecommunications, marketing and professional services, and manufacturing and other R&D activities.
Indemnification Clauses. On a limited basis, our contractual agreements will contain a clause under which we agree to provide indemnification to the counterparty, most commonly to licensees in connection with licensing arrangements that include our IP. We have also entered into indemnification agreements with our officers, directors, and certain employees, and our certificate of incorporation and bylaws contain similar indemnification obligations. Additionally, and although not a contractual requirement, we have at times elected to defend our licensees from third
79
party IP infringement claims. Since the terms and conditions of our contractual indemnification clauses do not explicitly specify our obligations, we are unable to reasonably estimate the maximum potential exposure for which we could be liable. Furthermore, we have not historically made any payments in connection with any such obligation and believe there to be a remote likelihood that any potential exposure in future periods would be of a material amount. As a result, no amounts have been accrued in our consolidated financial statements with respect to the contingent aspect of these indemnities.
13. Business Combinations
On September 19, 2018 ("acquisition date"), we completed an asset purchase with a privately held technology company that offers enterprise media encoding and cloud-based media workflow management services to customers. We believe that these technologies will further enhance our existing capabilities, as well as future initiatives. We completed the acquisition for a gross purchase price of $19.28 million. Pursuant to the purchase agreement, $3.0 million of the total purchase consideration is being held by us for a period of eighteen months following the closing of the acquisition. This holdback amount has been recorded as a non-current liability on our Consolidated Balance Sheet as of September 28, 2018. We have completed a preliminary purchase price allocation and the balance sheet reflects the preliminary fair value estimates of the intangible assets and goodwill acquired. These estimates are subject to change within the measurement period which will not exceed one year from the acquisition date.
14. Operating Segments & Geographic Information
Operating Segments
Operating segments are defined as components of an enterprise for which separate financial information is available, and which are evaluated regularly by the chief operating decision maker, or decision-making group, in deciding how to allocate resources and assess performance. Our CODM is our Chief Executive Officer. Reporting segments are operating segments exceeding specified revenue, profit or loss, or asset thresholds for which separate disclosure of information is necessary.
We operate as a single reporting segment. During the fiscal quarter ended December 30, 2016, we reorganized certain aspects of our internal business infrastructure primarily to integrate and align sales support more directly with our business units. Following the reorganization, we reassessed our business units and concluded that the composition of our reportable segments remains unchanged and that we continue to operate as a single reportable segment. This reflects the fact that our CODM continues to evaluate our financial information and resources, and continues to assess the performance of these resources, on a consolidated basis. All required financial segment information is therefore included in our consolidated financial statements.
Geographic Information
The methods to determine revenue by geographic region for each of the three categories included within total revenue in our consolidated statements of operations are described within the table presented below.
Revenue Category | Basis For Determining Geographic Location |
Licensing | Region in which our licensees’ headquarters are located |
Products | Destination to which our products are shipped |
Services | Location in which the relevant services are performed |
The following tables present selected information regarding total revenue by geographic location (amounts presented in thousands).
Revenue Composition - United States & International
Fiscal Year Ended | |||||||||
Location | September 28, 2018 | September 29, 2017 | September 30, 2016 | ||||||
United States | $ | 388,700 | $ | 373,264 | $ | 320,129 | |||
International | 783,224 | 708,190 | 705,609 | ||||||
Total revenue | $ | 1,171,924 | $ | 1,081,454 | $ | 1,025,738 | |||
80
Revenue Concentration - Significant Individual Geographic Regions
Fiscal Year Ended | ||||||
Location | September 28, 2018 | September 29, 2017 | September 30, 2016 | |||
United States | 33 | % | 35 | % | 31 | % |
South Korea | 19 | % | 16 | % | 17 | % |
China | 17 | % | 16 | % | 14 | % |
Japan | 12 | % | 12 | % | 12 | % |
Europe | 11 | % | 11 | % | 14 | % |
Taiwan | 3 | % | 4 | % | 4 | % |
Other | 5 | % | 6 | % | 8 | % |
Total | 100 | % | 100 | % | 100 | % |
Long-lived tangible assets, net of accumulated depreciation, by geographic region were as follows (in thousands):
Location | September 28, 2018 | September 29, 2017 | ||||
United States | $ | 453,336 | $ | 439,023 | ||
International | 60,846 | 46,252 | ||||
Total long-lived tangible assets, net of accumulated depreciation | $ | 514,182 | $ | 485,275 | ||
15. Legal Matters
We are involved in various legal proceedings that occasionally arise in the normal course of business. These can include claims of alleged infringement of IP rights, commercial, employment, and other matters. In our opinion, resolution of these proceedings is not expected to have a material adverse impact on our operating results or financial condition. Given the unpredictable nature of legal proceedings, it is possible that an unfavorable resolution of one or more such proceedings could materially affect our future operating results or financial condition in a particular period, including as a result of required changes to our licensing terms, monetary penalties, and other potential consequences. However, based on the information known by us as of the date of this filing and the rules and regulations applicable to the preparation of our consolidated financial statements, any such amounts are either immaterial, or it is not possible to provide an estimate of any such potential losses.
16. Related Parties
We maintain contractual agreements relating to certain entities affiliated with the Dolby family, who is considered a related party as our principal stockholder. These jointly-owned entities were established for the purpose of acquiring and leasing commercial property in the U.S. and U.K. primarily for our operational use. Although the entities affiliated with the Dolby family are the limited member or LP in each of these entities, they have a controlling interest based on holding majority economic ownership. We are the managing member or general partner in each of these affiliated entities, and with the exception of isolated instances where portions of these facilities are leased to third parties, we occupy the majority of the space. Therefore, since these affiliated entities are an integral part of our operations, we have consolidated the entities’ assets and liabilities and results of operations in our consolidated financial statements. The share of earnings and net assets of the entities attributable to the limited member or LP, as the case may be, is reflected as controlling interest in our consolidated financial statements.
Our interests in these consolidated affiliated entities and the location of the property leased to Dolby Laboratories as of September 28, 2018 were as follows:
Entity Name | Minority Ownership Interest | Location Of Properties | |
Dolby Properties Brisbane, LLC | 49.0 | % | Brisbane, California |
Dolby Properties Burbank, LLC | 49.0 | % | Burbank, California |
Dolby Properties UK, LLC | 49.0 | % | Wootton Bassett, England |
Dolby Properties, LP | 10.0 | % | Wootton Bassett, England |
We lease from our principal stockholder a commercial office building located at 100 Potrero Avenue in San Francisco, California under a term that expires on October 31, 2024. Related party rent expense included in operating expenses in our consolidated statements of operations were as follows (in thousands):
81
Fiscal Year Ended | |||||||||
September 28, 2018 | September 29, 2017 | September 30, 2016 | |||||||
Related party rent expense included in operating expenses | $ | 3,483 | $ | 3,142 | $ | 3,097 | |||
Distributions. Distributions made by the jointly-owned real estate entities to our principal stockholder were as follows (in thousands):
Fiscal Year Ended | |||||||||
September 28, 2018 | September 29, 2017 | September 30, 2016 | |||||||
Distributions to principal stockholder | $ | (1,022 | ) | $ | (2,094 | ) | $ | (214 | ) |
17. Retirement Plans
We maintain a tax-qualified Section 401(k) retirement plan for employees in the United States and similar plans in foreign jurisdictions. Under the plan, employees are eligible to receive matching contributions and profit-sharing contributions.
We also maintain a SERP, a non-qualified, employer-funded retirement plan for certain senior executives employed in the United States. The plan was adopted in October 2004 prior to our IPO and was terminated in fiscal 2005. We have not made any contributions to the SERP since fiscal 2006. The purpose of the plan was to provide these executives with the opportunity to receive retirement income benefits in addition to the benefits generally available to all employees. The benefits provided to participants were based on defined contributions that we made to the plan and the gains and losses on the investment of those contributions. At September 28, 2018, the balance in the SERP account represents amounts contributed prior to the plan's termination, with the underlying plan investments consisting primarily of mutual fund investments. SERP assets are included within prepaid expenses and other current assets and within other non-current assets, while SERP liabilities are included within accrued liabilities and within other non-current liabilities in our consolidated balance sheets.
Retirement plan expenses, which are included in cost of products, cost of services, R&D, S&M, and G&A expense in our consolidated statements of operations, were as follows (in thousands):
Fiscal Year Ended | |||||||||
September 28, 2018 | September 29, 2017 | September 30, 2016 | |||||||
Retirement plan expenses | $ | 23,439 | $ | 22,035 | $ | 20,471 | |||
18. Selected Quarterly Financial Data
The following table presents selected unaudited quarterly financial information from fiscal 2018 and 2017 (in thousands, except per share amounts):
Fiscal Year 2018 | Fiscal Year 2017 | ||||||||||||||||||||||||
Q1 | Q2 | Q3 | Q4 | Q1 | Q2 | Q3 | Q4 | ||||||||||||||||||
Revenue: | |||||||||||||||||||||||||
Licensing | $ | 258,016 | $ | 273,143 | $ | 286,325 | $ | 240,122 | $ | 232,699 | $ | 241,617 | $ | 278,106 | $ | 213,370 | |||||||||
Products | 24,933 | 22,665 | 26,265 | 20,689 | 28,211 | 20,713 | 22,569 | 23,797 | |||||||||||||||||
Services | 4,848 | 5,547 | 4,857 | 4,514 | 5,357 | 5,144 | 4,990 | 4,881 | |||||||||||||||||
Total revenue | 287,797 | 301,355 | 317,447 | 265,325 | 266,267 | 267,474 | 305,665 | 242,048 | |||||||||||||||||
Cost of revenue | 30,876 | 30,959 | 34,465 | 31,960 | 29,967 | 26,977 | 32,125 | 29,238 | |||||||||||||||||
Gross margin | 256,921 | 270,396 | 282,982 | 233,365 | 236,300 | 240,497 | 273,540 | 212,810 | |||||||||||||||||
Income before taxes and controlling interest | 84,834 | 89,483 | 96,590 | 41,960 | 67,656 | 66,194 | 96,303 | 26,491 | |||||||||||||||||
Net income/(loss) attributable to Dolby Laboratories | $ | (81,622 | ) | $ | 70,631 | $ | 83,145 | $ | 50,092 | $ | 53,374 | $ | 50,590 | $ | 76,043 | $ | 21,795 | ||||||||
Earnings per share: | |||||||||||||||||||||||||
Basic | $ | (0.80 | ) | $ | 0.68 | $ | 0.80 | $ | 0.48 | $ | 0.53 | $ | 0.50 | $ | 0.75 | $ | 0.21 | ||||||||
Diluted | $ | (0.80 | ) | $ | 0.66 | $ | 0.78 | $ | 0.47 | $ | 0.51 | $ | 0.49 | $ | 0.73 | $ | 0.21 | ||||||||
Weighted-average shares outstanding: | |||||||||||||||||||||||||
Basic | 102,552 | 103,771 | 103,836 | 103,349 | 101,483 | 101,787 | 101,905 | 101,959 | |||||||||||||||||
Diluted | 102,552 | 107,001 | 106,950 | 106,794 | 103,876 | 103,883 | 104,222 | 103,530 | |||||||||||||||||
82
ITEM 9. CHANGES IN AND DISAGREEMENTS WITH ACCOUNTANTS ON ACCOUNTING AND FINANCIAL DISCLOSURES
None.
ITEM 9A. CONTROLS AND PROCEDURES
Evaluation of Disclosure Controls and Procedures
We maintain “disclosure controls and procedures,” as such term is defined in Rules 13a-15(e) and 15d-15(e) under the Securities Exchange Act of 1934, as amended (“Exchange Act”), that are designed to ensure that information required to be disclosed by us in reports that we file or submit under the Exchange Act is recorded, processed, summarized, and reported within the time periods specified in Securities and Exchange Commission rules and forms, and that such information is accumulated and communicated to our management, including our Chief Executive Officer ("CEO") and Chief Financial Officer ("CFO"), as appropriate, to allow for timely decisions regarding required disclosure. In designing and evaluating our disclosure controls and procedures, management recognized that disclosure controls and procedures, no matter how well conceived and operated, can provide only reasonable, not absolute, assurance that the objectives of the disclosure controls and procedures are met. Additionally, in designing disclosure controls and procedures, our management necessarily was required to apply its judgment in evaluating the cost-benefit relationship of possible disclosure controls and procedures. The design of any disclosure controls and procedures also is based in part upon certain assumptions about the likelihood of future events, and there can be no assurance that any design will succeed in achieving its stated goals under all potential future conditions.
Subject to the limitations noted above, our management, with the participation of our CEO and CFO, has evaluated the effectiveness of the design and operation of our disclosure controls and procedures as of the end of the fiscal year covered by this Annual Report on Form 10-K. Based on that evaluation, the CEO and CFO have concluded that, as of such date, our disclosure controls and procedures were effective to meet the objective for which they were designed and operate at the reasonable assurance level.
Management’s Report on Internal Control over Financial Reporting
Our management is responsible for establishing and maintaining adequate internal control over financial reporting for the Company as defined in Rule 13a-15(f) or 15d-15(f) of the Exchange Act. Internal control over financial reporting is a process designed to provide reasonable assurance regarding the reliability of financial reporting and the preparation of financial statements for external purposes in accordance with generally accepted accounting principles, and includes those policies and procedures that: (i) pertain to the maintenance of records that, in reasonable detail, accurately and fairly reflect the transactions and dispositions of our assets; (ii) provide reasonable assurance that transactions are recorded as necessary to permit preparation of financial statements in accordance with GAAP, and that our receipts and expenditures are being made only in accordance with authorizations of our management and directors; and (iii) provide reasonable assurance regarding prevention or timely detection of unauthorized acquisition, use or disposition of our assets that could have a material effect on our financial statements.
Because of its inherent limitations, internal control over financial reporting may not prevent or detect misstatements. Also, projections of any evaluation of effectiveness to future periods are subject to the risk that controls may become inadequate because of changes in conditions, or that the degree of compliance with the policies or procedures may deteriorate.
Our management assessed the effectiveness of the Company’s internal control over financial reporting as of September 28, 2018 using the criteria established in Internal Control - Integrated Framework (2013) issued by the COSO. Based on this assessment and those criteria, management concluded that our internal control over financial reporting was effective as of September 28, 2018. Our internal control over financial reporting has been audited by KPMG LLP, an independent registered public accounting firm, as stated in their report, which appears in Part II, Item 8 of this Form 10-K.
Changes in Internal Control Over Financial Reporting
There were no changes in our internal control over financial reporting during the fiscal quarter ended September 28, 2018 that have materially affected, or are reasonably likely to materially affect, our internal control over financial reporting.
ITEM 9B. OTHER INFORMATION
None.
83
PART III
ITEM 10. DIRECTORS, EXECUTIVE OFFICERS AND CORPORATE GOVERNANCE
The information required by this item concerning our directors, compliance with Section 16 of the Securities Exchange Act of 1934, as amended (“Exchange Act”), our code of business conduct and ethics, our Compensation Committee, Nominating and Governance Committee and Audit Committee is incorporated by reference from the information set forth in the sections under the headings “Election of Directors,” “Section 16(a) Beneficial Ownership Reporting Compliance” and “Corporate Governance Matters” in our Definitive Proxy Statement to be filed with the Securities and Exchange Commission in connection with the Annual Meeting of Stockholders to be held in 2019 (“2019 Proxy Statement”).
Executive Officers of the Registrant
Our executive officers serve at the discretion of the Board of Directors. The names of our executive officers and their ages, titles, and biographies as of October 26, 2018 are set forth below:
Executive Officers | Age | Position(s) |
Kevin Yeaman | 52 | President and Chief Executive Officer |
Lewis Chew | 55 | Executive Vice President and Chief Financial Officer |
Andy Sherman | 51 | Executive Vice President, General Counsel and Corporate Secretary |
Giles Baker | 42 | Senior Vice President, Consumer Entertainment |
Steven Forshay | 64 | Senior Vice President, Advanced Technology Group |
Todd Pendleton | 46 | Senior Vice President, and Chief Marketing Officer |
Kevin Yeaman joined us as Chief Financial Officer and Vice President in October 2005, was appointed Senior Vice President in November 2006 and Executive Vice President in July 2007. He became our President and CEO in March 2009 and has been a member of our Board since he assumed the role of CEO. Prior to joining us, he worked for seven years at E.piphany, Inc., a publicly traded enterprise software company, most recently as Chief Financial Officer from August 1999 to October 2005. Previously, Mr. Yeaman also served as Worldwide Vice President of Field Finance Operations for Informix Software, Inc., a provider of relational database software, from February 1998 to August 1998. From September 1988 to February 1998, Mr. Yeaman served in Silicon Valley and London in various positions at KPMG LLP, an accounting firm, serving most recently as a senior manager. Mr. Yeaman is a member of the Academy of Motion Picture Arts and Sciences. He also sits on the Board of Trustees of the Academy Museum Foundation. He holds a B.S. degree in commerce from Santa Clara University.
Lewis Chew joined us as Executive Vice President and Chief Financial Officer in June 2012. Mr. Chew leads the worldwide finance organization and is responsible for the financial and infrastructure support for our business, which includes all finance functions, information technology, real estate and facilities, manufacturing, supply chain, and investor relations. Mr. Chew comes to us with decades of financial and strategic business management experience. Mr. Chew is the former Senior Vice President of Finance and Chief Financial Officer of National Semiconductor Corporation, a manufacturer of electronic components, where he was responsible for all finance functions as well as information systems and investor relations. Prior to joining National Semiconductor, Mr. Chew was a partner at KPMG LLP, an accounting firm, serving numerous technology and financial institution clients. Mr. Chew serves as a member of the Board of Directors at PG&E Corporation, an energy-based holding company. Mr. Chew holds a B.S. degree in accounting from Santa Clara University.
Andy Sherman joined us as Executive Vice President, General Counsel and Corporate Secretary in January 2011. Mr. Sherman oversees Dolby’s patent licensing businesses and government relations, and Dolby's worldwide legal affairs, including all corporate, regulatory, IP, litigation, and licensing activities. Prior to joining us, from June 2008 to January 2011, Mr. Sherman served as Senior Vice President and General Counsel at CBS Interactive, an online content network, where he led the legal group advising CBS’s online entertainment, mobile, technology, sports, news, games, lifestyle, and international business units. Mr. Sherman joined CBS Interactive following CBS’s acquisition of CNET Networks, an online content network, where from June 2007 to June 2008 he was Senior Vice President, General Counsel and Secretary. Before CNET, Mr. Sherman served as Vice President, Legal at Sybase, an enterprise software and services company, from November 2006 to May 2007, following Sybase’s acquisition of Mobile 365, where he was Vice President, General Counsel and Secretary. Prior to joining Mobile 365, he held senior legal positions with global responsibility at a variety of public technology companies including PeopleSoft and E.piphany. Earlier in his career, Mr. Sherman worked in private practice with Gray Cary Ware & Freidenrich (now DLA Piper),
84
focusing on the representation of emerging technology companies. Mr. Sherman holds a J.D. from the University of the Pacific, as well as a B.S. degree in business administration from the University of Southern California.
Giles Baker joined us in March 2010 and has served since in a variety of positions, including Vice President, Broadcast Business Group; Senior Vice President, Broadcast Business Group; and since October 2016, Senior Vice President, Consumer Entertainment. Mr. Baker focuses on Dolby's business in the consumer entertainment industry, leading a global team that builds complete industry solutions—from content production to distribution and playback—to bring immersive entertainment experiences to consumer devices, including TVs, game consoles, PCs, digital media adapters, mobile phones, and tablets. Before joining Dolby, Mr. Baker spent nearly 10 years in business leadership roles at Adobe Systems, where he was responsible for professional video software. Previously, he was responsible for the professional DVD authoring business at Sonic Solutions. Mr, Baker holds an undergraduate degree in music and sound recording from the University of Surrey in the United Kingdom and an MBA degree from the Wharton School.
Steven Forshay joined us in July 1982 and has served since in a variety of positions advancing our technologies, including Senior Vice President, Research; Senior Vice President of Research for Image and Sound; Senior Vice President, Sound Technology R&D; and since January 2015, Senior Vice President, Advanced Technology Group. Mr. Forshay is a member of the Audio Engineering Society, the Institute of Electrical and Electronics Engineers, and the Society of Motion Picture and Television Engineers. Mr. Forshay holds a B.S.E.E. degree in electrical engineering from the New Jersey Institute of Technology and a M.B.A. from Saint Mary’s College of California.
Todd Pendleton joined us in July 2018 as Senior Vice President and Chief Marketing Officer. He leads Dolby’s marketing efforts and is responsible for promoting the brand globally to consumers and through its partners. Prior to Dolby, from June 2011 to June 2018, Mr. Pendleton served as Chief Marketing Officer of Samsung Telecommunications America, where he among other things led the relaunch of the Samsung Galaxy. Prior to Samsung Telecommunications America, Mr. Pendleton was with Nike for over 15 years, where he held country, regional, and global leadership roles working across North America, Europe, and Asia. Mr. Pendleton earned his B.A. degree in Political Science and International Business from Northeastern University in Boston, Massachusetts.
ITEM 11. EXECUTIVE COMPENSATION
The information required by this item concerning executive compensation is incorporated by reference from the information in the 2019 Proxy Statement under the headings “Compensation Discussion and Analysis,” “Report of the Compensation Committee of the Board of Directors,” “Executive Compensation Tables and Related Matters,” “Compensation of Directors”, and “Corporate Governance Matters-Compensation Committee Interlocks and Insider Participation.”
ITEM 12. SECURITY OWNERSHIP OF CERTAIN BENEFICIAL OWNERS AND MANAGEMENT AND RELATED STOCKHOLDER MATTERS
The information required by this item concerning securities authorized for issuance under equity compensation plans and security ownership of certain beneficial owners and management is incorporated by reference from the information in the 2019 Proxy Statement under the headings “Executive Compensation Tables and Related Matters—Equity Compensation Plan Information” and “Security Ownership of Certain Beneficial Owners and Management.”
ITEM 13. CERTAIN RELATIONSHIPS AND RELATED TRANSACTIONS, AND DIRECTOR INDEPENDENCE
The information required by this item concerning transactions with related persons and director independence is incorporated by reference from the information in the 2019 Proxy Statement under the headings “Certain Relationships and Related Transactions" and “Corporate Governance Matters.”
ITEM 14. PRINCIPAL ACCOUNTING FEES AND SERVICES
The information required by this item is incorporated by reference from the information in the 2019 Proxy Statement under the heading “Ratification of Independent Registered Public Accounting Firm.”
85
PART IV
ITEM 15. EXHIBITS, FINANCIAL STATEMENT SCHEDULES
1. | Financial Statements: See “Index to Consolidated Financial Statements” in Part II, Item 8 of this Annual Report on Form 10-K. |
2. | Financial Statement Schedules: Financial statement schedules have been omitted as the information required is inapplicable or the information is presented in the consolidated financial statements and related notes |
3. | Exhibits: The exhibits listed in the accompanying index to exhibits are filed or incorporated by reference as part of this Annual Report on Form 10-K. |
86
INDEX TO EXHIBITS
Exhibit Number | Description | Incorporated by Reference Herein | |
Form | Date | ||
2.1* | Registration Statement on Form S-1 (No. 333-120614), Amendment No. 1 | December 30, 2004 | |
3.1 | Registration Statement on Form S-1 (No. 333-120614), Amendment No. 2 | January 19, 2005 | |
3.2 | Quarterly Report on Form 10-Q | April 30, 2009 | |
4.1 | Registration Statement on Form S-1 (No. 333-120614), Amendment No. 1 | December 30, 2004 | |
4.2 | Registration Statement on Form 8-A | January 25, 2006 | |
10.1* | Registration Statement on Form S-1 (No. 333-120614) | November 19, 2004 | |
10.2* | Quarterly Report on Form 10-Q | February 6, 2013 | |
10.3* | Current Report on Form 8-K | February 9, 2017 | |
10.4*+ | |||
10.5* | Registration Statement on Form S-1 (No. 333-120614) | November 19, 2004 | |
10.6* | Quarterly Report on Form 10-Q | February 2, 2017 | |
10.7* | Quarterly Report on Form 10-Q | February 2, 2017 | |
10.8* | Quarterly Report on Form 10-Q | February 2, 2017 | |
10.9* | Quarterly Report on Form 10-Q | February 2, 2017 | |
10.10* | Annual Report on Form 10-K | November 19, 2009 | |
10.11* | Quarterly Report on Form 10-Q | August 8, 2012 | |
10.12* | Current Report on Form 8-K | December 11, 2015 | |
10.13* | Current Report on Form 8-K | November 15, 2017 | |
10.14* | Quarterly Report on Form 10-Q | April 30, 2009 | |
10.15* | Quarterly Report on Form 10-Q | February 6, 2013 | |
10.16* | Quarterly Report on Form 10-Q | May 10, 2011 | |
10.17* | Quarterly Report on Form 10-Q | May 8, 2012 | |
10.18* | Quarterly Report on Form 10-Q | January 29, 2014 | |
10.19* | Quarterly Report on Form 10-Q | February 8, 2006 | |
10.20* | Quarterly Report on Form 10-Q | May 4, 2006 | |
10.21* | Quarterly Report on Form 10-Q | July 30, 2014 | |
10.22* | Quarterly Report on Form 10-Q | February 8, 2006 | |
10.23* | Quarterly Report on Form 10-Q | July 30, 2014 | |
10.24* | Quarterly Report on Form 10-Q | February 8, 2006 | |
10.25* | Quarterly Report on Form 10-Q | July 30, 2014 | |
10.26* | Annual Report on Form 10-K | November 15, 2013 | |
10.27* | Quarterly Report on Form 10-Q | August 8, 2012 | |
10.28* | Quarterly Report on Form 10-Q | August 1, 2018 | |
21.1+ | |||
23.1+ | |||
24.1 | Power of Attorney (incorporated by reference from the signature page of this Annual Report on Form 10-K) | ||
31.1+ | |||
31.2+ | |||
32.1‡ | |||
101.INS‡ XBRL Instance Document | |||
101.SCH‡ XBRL Taxonomy Extension Schema Document | |||
101.CAL‡ XBRL Taxonomy Extension Calculation Linkbase Document | |||
101.DEF‡ XBRL Extension Definition | |||
101.LAB‡ XBRL Taxonomy Extension Label Linkbase Document | |||
101.PRE‡ XBRL Taxonomy Extension Presentation Linkbase Document | |||
+ Filed herewith.
* Denotes a management contract or compensatory plan or arrangement.
‡ Furnished herewith.
87
SIGNATURES
Pursuant to the requirements of Section 13 or 15(d) of the Securities Exchange Act of 1934, the registrant has duly caused this report to be signed on its behalf by the undersigned, thereunto duly authorized.
Date: November 14, 2018
DOLBY LABORATORIES, INC. | |
By: | /S/ LEWIS CHEW |
Lewis Chew | |
Executive Vice President and Chief Financial Officer | |
(Principal Financial and Accounting Officer) | |
POWER OF ATTORNEY
KNOW ALL PERSONS BY THESE PRESENTS, that each person whose signature appears below constitutes and appoints Kevin J. Yeaman and Lewis Chew, and each of them, his or her attorney-in-fact, each with the power of substitution, for him or her in any and all capacities, to sign any amendments to this Annual Report on Form 10-K, and to file the same, with exhibits thereto and other documents in connection therewith, with the Securities and Exchange Commission, hereby ratifying and confirming all that each of said attorneys-in-fact, or his or her substitutes, may do or cause to be done by virtue of hereof.
Pursuant to the requirements of the Securities Exchange Act of 1934, this report has been signed below by the following persons on behalf of the registrant and in the capacities and on the dates indicated.
SIGNATURE | TITLE | DATE | |
/S/ PETER GOTCHER | Chairman of the Board of Directors | November 14, 2018 | |
Peter Gotcher | |||
/S/ KEVIN J. YEAMAN | President, Chief Executive Officer and Director (Principal Executive Officer) | November 14, 2018 | |
Kevin J. Yeaman | |||
/S/ LEWIS CHEW | Executive Vice President and Chief Financial Officer (Principal Financial and Accounting Officer) | November 14, 2018 | |
Lewis Chew | |||
/S/ MICHELINE CHAU | Director | November 14, 2018 | |
Micheline Chau | |||
/S/ DAVID DOLBY | Director | November 14, 2018 | |
David Dolby | |||
/S/ N. W. JASPER, JR. | Director | November 14, 2018 | |
N. W. Jasper, Jr. | |||
/S/ SIMON SEGARS | Director | November 14, 2018 | |
Simon Segars | |||
/S/ ROGER SIBONI | Director | November 14, 2018 | |
Roger Siboni | |||
/S/ AVADIS TEVANIAN, JR. | Director | November 14, 2018 | |
Avadis Tevanian, Jr. | |||
88