Attached files
| file | filename |
|---|---|
| 8-K - FORM 8-K INVESTOR PRESENTATION NOVEMBER 2018 - SUN COMMUNITIES INC | form8-kxinvestorpresentati.htm |
PALM CREEK – CASA GRANDE, AZ INVESTOR PRESENTATION NOVEMBER 2018

FORWARD-LOOKING STATEMENTS This presentation has been prepared for informational purposes only from information supplied by Sun Communities, Inc. (the “Company” or “Sun”) and from third- party sources indicated herein. Such third-party information has not been independently verified. The Company makes no representation or warranty, expressed or implied, as to the accuracy or completeness of such information. This presentation contains various “forward-looking statements” within the meaning of the United States Securities Act of 1933, as amended, and the United States Securities Exchange Act of 1934, as amended, and we intend that such forward-looking statements will be subject to the safe harbors created thereby. For this purpose, any statements contained in this presentation that relate to expectations, beliefs, projections, future plans and strategies, trends or prospective events or developments and similar expressions concerning matters that are not historical facts are deemed to be forward-looking statements. Words such as “forecasts,” “intends,” “intend,” “intended,” “goal,” “estimate,” “estimates,” “expects,” “expect,” “expected,” “project,” “projected,” “projections,” “plans,” “predicts,” “potential,” “seeks,” “anticipates,” “anticipated,” “should,” “could,” “may,” “will,” “designed to,” “foreseeable future,” “believe,” “believes,” “scheduled,” “guidance” and similar expressions are intended to identify forward-looking statements, although not all forward looking statements contain these words. These forward-looking statements reflect our current views with respect to future events and financial performance, but involve known and unknown risks and uncertainties, both general and specific to the matters discussed in this presentation. These risks and uncertainties may cause our actual results to be materially different from any future results expressed or implied by such forward-looking statements. In addition to the risks disclosed under “Risk Factors” contained in our Annual Report on Form 10-K for the year ended December 31, 2017, and our other filings with the Securities and Exchange Commission from time to time, such risks and uncertainties include but are not limited to: . changes in general economic conditions, the real estate industry and the markets in which we operate; . difficulties in our ability to evaluate, finance, complete and integrate acquisitions, developments and expansions successfully; . our liquidity and refinancing demands; . our ability to obtain or refinance maturing debt; . our ability to maintain compliance with covenants contained in our debt facilities; . availability of capital; . changes in foreign currency exchange rates, including between the U.S. dollar and each of the Canadian and Australian dollars; . our ability to maintain rental rates and occupancy levels; . our failure to maintain effective internal control over financial reporting and disclosure controls and procedures; . increases in interest rates and operating costs, including insurance premiums and real property taxes; . risks related to natural disasters such as hurricanes, earthquakes, floods and wildfires; . general volatility of the capital markets and the market price of shares of our capital stock; . our failure to maintain our status as a REIT; . changes in real estate and zoning laws and regulations; . legislative or regulatory changes, including changes to laws governing the taxation of REITs; . litigation, judgments or settlements; . competitive market forces; . the ability of manufactured home buyers to obtain financing; and . the level of repossessions by manufactured home lenders. Readers are cautioned not to place undue reliance on these forward-looking statements, which speak only as of the date the statement was made. We undertake no obligation to publicly update or revise any forward-looking statements included in this presentation, whether as a result of new information, future events, changes in our expectations or otherwise, except as required by law. Although we believe that the expectations reflected in the forward-looking statements are reasonable, we cannot guarantee future results, levels of activity, performance or achievements. All written and oral forward-looking statements attributable to us or persons acting on our behalf are qualified in their entirety by these cautionary statements.
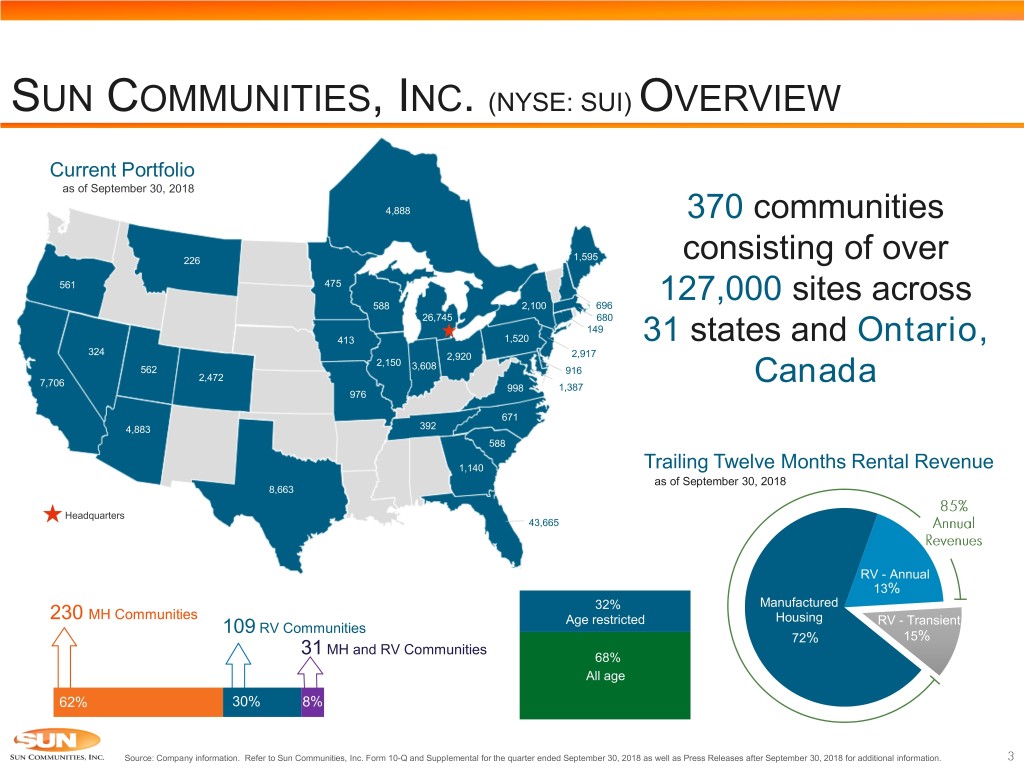
SUN COMMUNITIES, INC. (NYSE: SUI) OVERVIEW Current Portfolio as of September 30, 2018 4,888 370 communities 226 1,595 consisting of over 561 475 127,000 sites across 588 2,100 696 26,745 680 149 413 1,520 31 states and Ontario, 324 2,920 2,917 2,150 562 3,608 916 2,472 7,706 Canada 998 1,387 976 671 4,883 392 588 1,140 Trailing Twelve Months Rental Revenue as of September 30, 2018 8,663 Headquarters 43,665 RV - Annual 13% 32% Manufactured 230 MH Communities Age restricted Housing RV - Transient 109 RV Communities 72% 15% MH and RV Communities 31 68% All age 62% 30% 8% Source: Company information. Refer to Sun Communities, Inc. Form 10-Q and Supplemental for the quarter ended September 30, 2018 as well as Press Releases after September 30, 2018 for additional information.
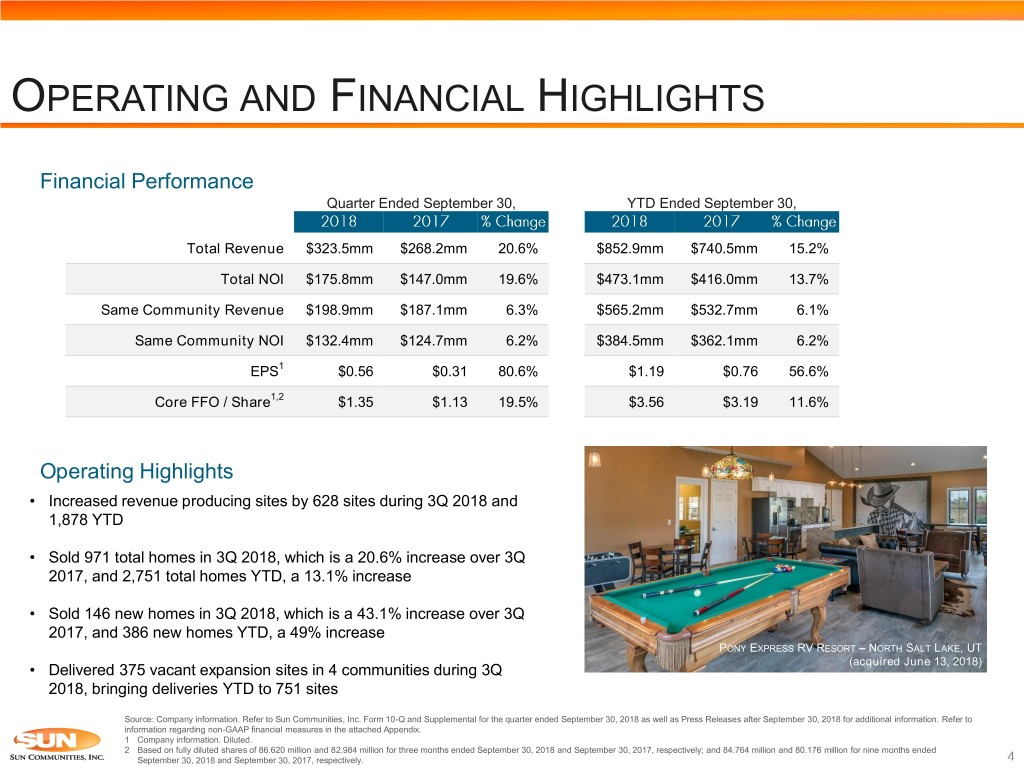
OPERATING AND FINANCIAL HIGHLIGHTS Financial Performance Quarter Ended September 30, YTD Ended September 30, Total Revenue $323.5mm $268.2mm 20.6% $852.9mm $740.5mm 15.2% Total NOI $175.8mm $147.0mm 19.6% $473.1mm $416.0mm 13.7% Same Community Revenue $198.9mm $187.1mm 6.3% $565.2mm $532.7mm 6.1% Same Community NOI $132.4mm $124.7mm 6.2% $384.5mm $362.1mm 6.2% EPS1 $0.56 $0.31 80.6% $1.19 $0.76 56.6% Core FFO / Share1,2 $1.35 $1.13 19.5% $3.56 $3.19 11.6% Operating Highlights • Increased revenue producing sites by 628 sites during 3Q 2018 and 1,878 YTD • Sold 971 total homes in 3Q 2018, which is a 20.6% increase over 3Q 2017, and 2,751 total homes YTD, a 13.1% increase • Sold 146 new homes in 3Q 2018, which is a 43.1% increase over 3Q 2017, and 386 new homes YTD, a 49% increase PONY EXPRESS RV RESORT – NORTH SALT LAKE, UT (acquired June 13, 2018) • Delivered 375 vacant expansion sites in 4 communities during 3Q 2018, bringing deliveries YTD to 751 sites Source: Company information. Refer to Sun Communities, Inc. Form 10-Q and Supplemental for the quarter ended September 30, 2018 as well as Press Releases after September 30, 2018 for additional information. Refer to information regarding non-GAAP financial measures in the attached Appendix. 1 Company information. Diluted. 2 Based on fully diluted shares of 86.620 million and 82.984 million for three months ended September 30, 2018 and September 30, 2017, respectively; and 84.764 million and 80.176 million for nine months ended September 30, 2018 and September 30, 2017, respectively.

2018 YTD ACQUISITIONS . Acquired 20 communities and 6 land parcels in 15 states with ~4,900 developed sites and ~3,000 additional sites for expansion or development as of October 31, 2018 2 333 1 1 88 1 2 696, 194 3 332 1 474, 297 2 1 1 244, 30 4 866 2 1 231, 30 562, 50 1 258, 86 1,454 Total Acquisition Community / Value 1 1 155, 100 1 315 Date Portfolio Name (mm) 5/23/2018 Compass RV Resort $14.0 376 6/13/2018 Highway West Portfolio 36.5 3 6/26/2018 Silver Creek RV Resort 7.3 1 424, 288 6/30/2018 Northgate (Sun NG Resorts) 256.8 2 7/9/2018 The Sands RV Resort 14.3 8/28/2018 Petoskey RV Resort 9.0 Number of Communities / Land 175, 158 8/30/2018 Archview (Highway West) 14.6 Total Developed Sites 10/30/2018 Leaf Verde RV Resort 11.6 Total Development Sites Available Total YTD Community Acquisitions $364.0 (6) Land Parcels 12.0 Total YTD Community and Land Acquisitions $376.0 Source: Company information. Refer to Sun Communities, Inc. Form 10-Q and Supplemental for the quarter ended September 30, 2018 as well as Press Releases after September 30, 2018 for additional information. Refer to information regarding non-GAAP financial measures in the attached Appendix. 1 Purchased an 80% equity interest in Sun NG RV Resorts

INVESTMENT IN AUSTRALIA’S INGENIA COMMUNITIES GROUP AND CONCURRENT JV AGREEMENT . Sun invested ~$54mm for a 9.9% stake in Ingenia Communities Group (ASX: INA), a leading owner, operator and developer of senior manufactured housing communities and holiday resorts in Australia . Sun and Ingenia will also establish and grow a manufactured housing (MH) greenfield development program in Australia with returns generated by the sale of new manufactured homes and lease-up of MH rental sites . A unique investment structure and opportunity for Sun shareholders, who benefit from investments in both the listed company as well as the development joint venture Purchase of INA Securities . Subscribe to new INA securities in the aggregate amount of 9.9% of the outstanding shares of INA on a fully-diluted basis Private Placement . Price per security equal to 8.75% premium to the 30-day volume weighted average price (VWAP) . Purchase price of approximately US$54 million1 . Sun is subject to an 18 month standstill from purchasing additional INA shares, subject to certain exceptions, including Standstill Agreement the following: (a) after 90 days Sun can purchase an additional 3.5% of the issued and outstanding shares; or (b) if INA undertakes certain major transactions or change of control transaction Joint Venture Agreement Ownership . 50% / 50% between SUI and INA . Sun has the right to cause the joint venture to participate in all greenfield developments, including developments in INA’s First Right of Refusal current land acquisition pipeline Development and . INA to manage the development process and day-to-day operations of the joint venture communities Asset Management Notes: ‘ASX’ means Australian Securities Exchange. On November 1, 2018, AUS/USD exchange rate was 1.391. 1 Calculated based on the 30-day VWAP per INA security of A$2.9583 on November 1, 2018.

COMPELLING AUSTRALIAN MANUFACTURED HOUSING ESTATE SECTOR OPPORTUNITY Why Australia? Strong Underlying Demand Drivers Favorable demographic trends and supportive Outsized Core Customer Proportion of Core Customer market dynamics Population Growth Population Expanding Australians over 55 in age are Australians over 55 are expected Sun has followed the market for some time, expected to grow at 2x the rest to increase to 33% of the total including in the context of recent offshore of the population to 2040 population by 2040 investment into the Australian real estate market Limited Homeownership Rate High Savings / Pensions among Australians over 55 Complimentary business culture between U.S. 4 out of 5 seniors in Australia 82% of seniors in Australia own and Australia have less than A$100k in their homes outright with no pensions mortgage Why MH and RVs in Australia? Downsizing Provides a Way to Opportunity for MH to Capture Fund a Comfortable Retirement Greater Market Share A couple requires A$60k/year for Current MH penetration rate for Highly fragmented market, underserved by a comfortable retirement, but the over 55 segment is expected to institutional capital and few competitors of scale average pension is only increase from 1.2% to 2.2-4.4% A$32k/year2 in Australia by 2040 Compelling demographic trends for MH/RV similar to those in the U.S. Highly Fragmented Market Increasing unaffordability of traditional housing 5% Sector participants 1% <5 creates an opportunity for MH owning 5 or more <1% Communities communities own . Over the past 20 years, median home 5-9 <10% of total Communities prices in key Australian capital cities have Australian MH 1 10-19 grown by more than 2-4x communities Communities 20+ Sources: Australian Bureau of Statistics, ASFA Research and Resource Centre, ANZ Research, CoreLogic, Ingenia company filings and broker research. 93% Communities Note: On November 1, 2018, AUS/USD exchange rate was 1.391. 1 Includes Sydney, Melbourne and Brisbane. 2 Pension represents base rate.
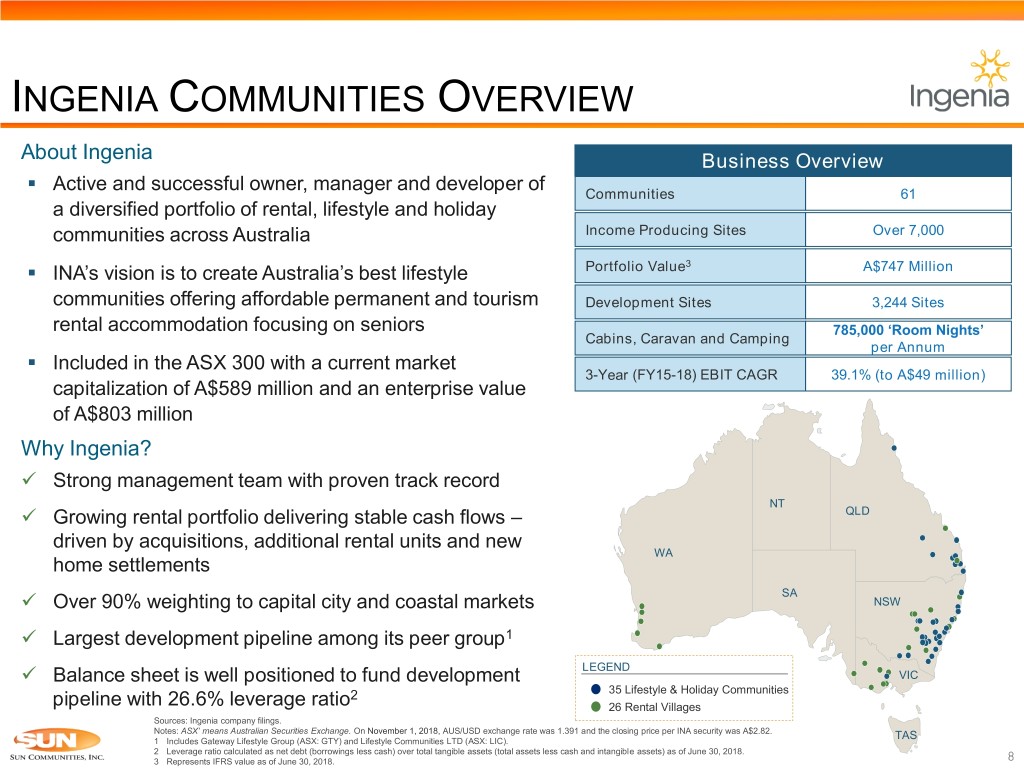
INGENIA COMMUNITIES OVERVIEW About Ingenia Business Overview . Active and successful owner, manager and developer of Communities 61 a diversified portfolio of rental, lifestyle and holiday communities across Australia Income Producing Sites Over 7,000 . INA’s vision is to create Australia’s best lifestyle Portfolio Value3 A$747 Million communities offering affordable permanent and tourism Development Sites 3,244 Sites rental accommodation focusing on seniors 785,000 ‘Room Nights’ Cabins, Caravan and Camping per Annum . Included in the ASX 300 with a current market 3-Year (FY15-18) EBIT CAGR 39.1% (to A$49 million) capitalization of A$589 million and an enterprise value of A$803 million Why Ingenia? Strong management team with proven track record NT Growing rental portfolio delivering stable cash flows – QLD driven by acquisitions, additional rental units and new WA home settlements SA Over 90% weighting to capital city and coastal markets NSW Largest development pipeline among its peer group1 LEGEND Balance sheet is well positioned to fund development VIC 2 35 Lifestyle & Holiday Communities pipeline with 26.6% leverage ratio 26 Rental Villages Sources: Ingenia company filings. Notes: ASX’ means Australian Securities Exchange. On November 1, 2018, AUS/USD exchange rate was 1.391 and the closing price per INA security was A$2.82. TAS 1 Includes Gateway Lifestyle Group (ASX: GTY) and Lifestyle Communities LTD (ASX: LIC). 2 Leverage ratio calculated as net debt (borrowings less cash) over total tangible assets (total assets less cash and intangible assets) as of June 30, 2018. 3 Represents IFRS value as of June 30, 2018.

POWERING SUN’S GROWTH ENGINE . Sun is the premier owner and operator of manufactured home (“MH”) and recreational vehicle (“RV”) communities . Strong cycle-tested record of operating, expanding and acquiring MH and RV communities dating back to 1975 INTERNAL EXTERNAL Contractual Rent Increases MH Occupancy Gains Acquisitions . Weighted average monthly rent has . 3Q 2018 MH occupancy of 94.9% . 2015-2017 historical average of historically increased by 2-4% . 130 communities are 98%+ occupied ~$150mm in single asset and small portfolio acquisitions annually . Expect additional 300 bps of . . 3Q 2018 weighted average monthly occupancy gains across MH portfolio Investment in ~$364.0mm of rent increase of 4.0% to reach 98% operating properties YTD . High degree of visibility into acquisition pipeline Expansions Transient Conversions Development . Delivered 375 expansion sites in . ~19,000 transient RV sites in . 2-3 greenfield development starts per 3Q 2018, 751 expansion sites YTD portfolio, a portion of which can be year . Expected to deliver an additional converted to annual leases over time . Targeting high single digit IRRs . ~600 expansion sites in 7 365 total conversions in 3Q 2018 . In 2018, opened first 330 site ground- communities by year end 2018 and 879 total conversions YTD up development in Paso Robles, CA . . ~7,600 sites available for expansion Conversions have historically . Projects underway in South Carolina, post-2018 increased revenues / site by 40-60% North Carolina and Colorado totaling for the first full year after conversion ~2,600 sites Source: Company information. Refer to Sun Communities, Inc. Form 10-Q and Supplemental for the quarter ended September 30, 2018 as well as Press Releases after September 30, 2018 for additional information.
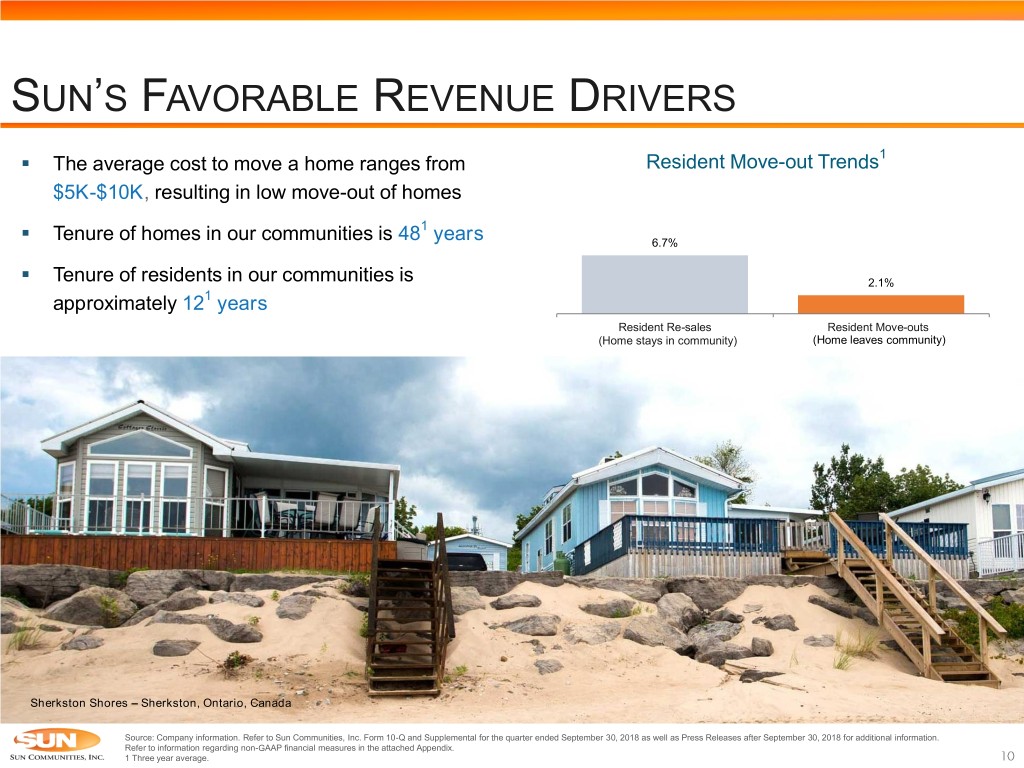
SUN’S FAVORABLE REVENUE DRIVERS 1 . The average cost to move a home ranges from Resident Move-out Trends $5K-$10K, resulting in low move-out of homes . 1 Tenure of homes in our communities is 48 years 6.7% . Tenure of residents in our communities is 2.1% approximately 121 years Resident Re-sales Resident Move-outs (Home stays in community) (Home leaves community) Sherkston Shores – Sherkston, Ontario, Canada Source: Company information. Refer to Sun Communities, Inc. Form 10-Q and Supplemental for the quarter ended September 30, 2018 as well as Press Releases after September 30, 2018 for additional information. Refer to information regarding non-GAAP financial measures in the attached Appendix. 1 Three year average.

STRONG SAME COMMUNITY PERFORMANCE NOI Growth Percentage Manufactured Home Weighted Occupancy Percentage Average Monthly Rent per Site INCREASE 97.3%97.8% 96.6% 95.9% 9.1% $551 93.2% 7.0% 2012-2017 7.7% AVERAGE 7.1% $518 6.9% 6.9% 88.9% $498 5.9% 86.7% 5.5% $481 85.8% 84.3% $461 83.4% 82.1% $445 $437 3.6% 3.1% $425 2.8% $413 $404 $393 0.7% 2 2008 2009 2010 2011 2012 2013 2014 2015 2016 2017 2018E1 2008 2009 2010 2011 2012 2013 2014 2015 2016 2017 2018 2008 2009 2010 2011 2012 2013 2014 2015 2016 2017 20182 . Positive NOI growth for . Strong and consistent rental rate . Occupancy gains are a function of 18 consecutive years growth creates a stable revenue Sun’s integrated platform, which . Low-annual resident turnover stream that is recession-resistant includes: leasing, sales, and results in stability of income and financing occupancy Source: Company information. Refer to Sun Communities, Inc. Form 10-Q and Supplemental for the quarter ended September 30, 2018 as well as Press Releases after September 30, 2018 for additional information. Refer to information regarding non-GAAP financial measures in the attached Appendix. Note: Same community pool of assets changes annually. Same community pools included 135 communities in 2008, 231 communities in 2017 and includes 336 communities in 2018. 1 Mid-point of 2018 expected same community year over year growth. 2 Weighted average monthly rent per site and Occupancy as of December 31 for 2008-2017 and as of September 30, for 2018.

CONSISTENT AND CYCLE TESTED INTERNAL GROWTH . Sun’s average same community NOI growth has exceeded REIT industry average by ~180 bps and the apartment sector’s average by ~170 bps since 1998 . Every individual year or rolling 4-quarter period has positive same community NOI growth Same Community NOI Growth Annual Growth Since 1998 Average Annual Growth Since 1998 Apartment REITs Sun Communities 4.9% SUI: SUI: + ~170bps + ~180bps 10.0% 5.0% 3.2% 3.1% 0.0% (5.0%) (10.0%) 2Q99 2Q00 2Q01 2Q02 2Q03 2Q04 2Q05 2Q06 2Q07 2Q08 2Q09 2Q10 2Q11 2Q12 2Q13 2Q14 2Q15 2Q16 2Q17 2Q18 2Q98 Sun Communities Apartment REITs REIT Industry Source: Citi Investment research, June 2018. “REIT Industry Average” includes an index of REITs across a variety of asset classes including: self storage; mixed office; regional malls; shopping centers; apartments; student housing; manufactured homes and specialty. Refer to information regarding non-GAAP financial measures of the attached Appendix.

MANUFACTURED HOUSING VS. MULTIFAMILY . Sun’s manufactured homes provide nearly 15% more space at ~30% less cost per square foot PRICE $0.75 per sq. ft. $1.06 per sq. ft SQUARE FOOTAGE 1,250 sq. ft. 1,100 sq. ft. RENT $940 per month $1,170 per month 1 Source: Company information. 2 Source: The RentPath Network. Represents average rent for a 2 bedroom apartment in major metropolitan areas Sun operates in adjusted for inflation as of September, 2018.

MANUFACTURED HOUSING VS. SINGLE FAMILY . Sun’s communities offer affordable options in attractive locations Manufactured Homes Single Family Homes Average cost of a new Manufactured Home is Average cost of Single Family is $286,814 or $70,600 or roughly 2 years median income roughly 8 years median income $400,000 Manufactured Homes Portion of purchase price attributable to land Single Family Homes $350,000 $300,000 $250,000 $286,814 $261,172 $276,284 $200,000 $249,429 $223,085 $203,182 $206,560 $207,950 $150,000 $100,000 Average $50,000 Household Income $63,100 $62,800 $60,500 $68,000 $62,200 $64,000 $65,300 $70,600 ~$37,5001 $- 2009 2010 2011 2012 2013 2014 2015 2016 Source: Manufactured Housing Institute, Quick Facts: “Trends and Information About the Manufactured Housing Industry, 2017.” 1 Historical average from Sun community applications.

THE INCREASING NEED FOR AFFORDABLE HOMEOWNERSHIP . Widening gap in income distribution trends has resulted in increased demand for affordable home ownership and rental properties . Percentage of the US population in the Lower Income bracket has increased by 4% to 29% of the total adult population over a ~45 year period Number of Adults by Income Tier % of Adult Population (in millions) by Income Tier 1971 2015 1 120.8 Lower Income (up to $42k) 25% 29% 51% Middle Income ($42k-$125k)1 61% 50% Upper Income (above $125k)1 14% 21% 80.0 112% 70.3 51.0 177% 33.2 18.4 Lower Income Middle Income Upper Income 1971 2015 Source: Pew Research as of 2015 1 In 2015 dollars

MH AND RV MANUFACTURING BUSINESSES INCREASING SHIPMENTS . The demand for affordable homeownership and vacationing is reflected in the increased output from MH and RV manufacturers . Current yearly MH shipments as a percentage of single family starts are significantly below long-term averages Manufactured Home Shipments Recreational Vehicle Shipments (in thousands) (in thousands) 92.9 504.6 81.2 430.7 374.2 70.5 356.7 64.3 60.2 321.1 54.9 285.9 51.6 50.0 242.3 252.3 2010 2011 2012 2013 2014 2015 2016 2017 2010 2011 2012 2013 2014 2015 2016 2017 Manufactured Home Shipments as Percentage of Single Family Starts 40% 30% 20% Long-Term Average 17.4% 10% Current 9.9% 0% 1960 1963 1966 1969 1972 1975 1978 1981 1984 1987 1990 1993 1996 1999 2002 2005 2008 2011 2014 2017 Source: RVIA Business Indicators, December 2017; Manufactured Housing Institute’s Monthly Economic Reports as of 2017, US Census Bureau

EXPANSIONS PROVIDE STRONG GROWTH AND ATTRACTIVE RETURNS . At the start of 2018, inventory of ~7,900 zoned and entitled sites available for expansion at ~60 properties in 16 states and Ontario, Canada . 375 sites were delivered at 4 communities during the third quarter of 2018, bringing YTD expansion site deliveries to 751 in 9 communities . A 100-site expansion at a $35,000 cost per site, is expected to lease up between 12-24 months, results in a 5-year unlevered IRR of 12% - 14% . Expansion in communities with strong demand evidenced by occupancies >96% and continued strong demand Boulder Ridge – Pflugerville, TX Boulder Ridge – Pflugerville, TX Source: Company information. Refer to Sun Communities, Inc. Form 10-Q and Supplemental for the quarter ended September 30, 2018 as well as Press Releases after September 30, 2018 for additional information.

EXPANSION OPPORTUNITIES SUPPORTED BY RENTAL PROGRAM . Sun’s rental program is a key onboarding and conversion tool for our communities Rental Program All-in 5-Year Unlevered IRR . $42,000 initial investment in new home . Weighted average monthly rental rate ~$900 x 12 = $10,800 (3% annual increases) . Monthly operating expenses1 +1 month vacancy factor $275 x 12 = $3,300 (3% annual increases) . End of 5-year period sell the home and recoup 90% of original invoice price . All-in 5-year unlevered IRR in the high teens Riverside Club – Ruskin, FL Riverside Club – Ruskin, FL Source: Company information. Refer to Sun Communities, Inc. Form 10-Q and Supplemental for the quarter ended September 30, 2018 as well as Press Releases after September 30, 2018 for additional information. 1 Operating expenses include repairs and refurbishment, taxes and insurance, marketing, and commissions.

EXTRACTING VALUE FROM STRATEGIC ACQUISITIONS REPOSITIONING PROFESSIONAL WITH ADDIT’L SKILLED OPERATIONAL CAPEX MANAGEMENT EXPENSE MANAGEMENT HOME SALES ENTAL & R ADDING ROGRAM P VALUE WITH EXPANSIONS INCREASING MARKET CALL RENT CENTER & DIGITAL MARKETING OUTREACH Year-end Communities and Sites . Since May 2011, Sun has acquired communities valued in excess of $4.8 billion, increasing its number of sites and communities by ~190%1 2011 2012 2013 2014 2015 2016 2017 2018 YTD 159 communities 173 communities 188 communities 217 communities 231 communities 341 communities 350 communities 370 communities 54,811 sites 63,697 sites 69,789 sites 79,554 sites 88,612 sites 117,376 sites 121,892 sites 127,574 sites Source: Company information. Refer to Sun Communities, Inc. Form 10-K and Supplemental for the period ended December 31st for the respective year as well as Sun Communities, Inc. Form 10-Q and Supplemental for the period ended September 30, 2018 for additional information. 1 Includes 30 community dispositions realized in 2014 and 2015.

STRATEGIC BALANCE SHEET . Balance sheet supports growth strategy . Sun’s annual mortgage maturities average 3.0% from 2018 - 2022 1 2 Net Debt / EBITDA Reduced Net Debt / TEV ~38% reduction leverage by 4.3x since 2011 since 2011 61.5% 9.7x 8.4x 7.2x 7.3x 7.5x 50.4% 6.6x 6.3x 45.8% 5.4x 34.8% 34.0% 33.8% 28.2% 23.9% 2011 2012 2013 2014 2015 2016 2017 3Q 2018 2011 2012 2013 2014 2015 2016 2017 3Q 2018 Mortgage Debt Outstanding Mortgage Debt 5-Year Maturity Ladder principal amounts in thousands amounts in thousands Quarter Ended September 30, 2018 CMBS Fannie Mae Freddie Mac Life Companies Principal WA 3 Outstanding Interest Rates $270,680 CMBS $407,778 5.10% Fannie Mae $775,383 4.39% Life Companies $1,253,935 3.96% $82,544 $58,078 Freddie Mac $382,129 3.86% $0 $10,141 Total $2,819,225 4.23% 2018 2019 2020 2021 2022 Source: Company information. Refer to Sun Communities, Inc. Form 10-Q and Supplemental for the quarter ended September 30, 2018 as well as Press Releases after September 30, 2018 for additional information. 1 The debt ratios are calculated using trailing 12 months recurring EBITDA for the period ended September 30, 2018. Refer to information regarding non-GAAP financial measures in the attached Appendix. 2 Total Enterprise Value includes common shares outstanding (per Supplemental), OP Units and Preferred OP Units, as converted, outstanding at the end of each respective period. 3 Includes premium / discount on debt and financing costs.

APPENDIX Oceanside RV Resort – Coos Bay, OR (acquired June 13, 2018)
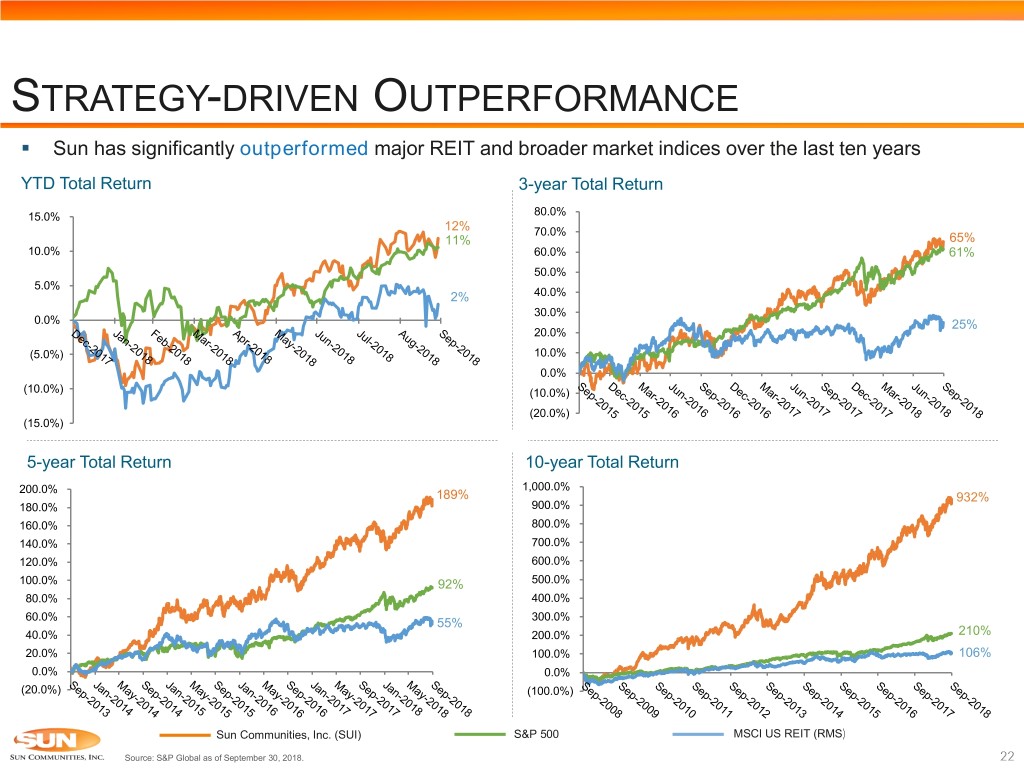
STRATEGY-DRIVEN OUTPERFORMANCE . Sun has significantly outperformed major REIT and broader market indices over the last ten years YTD Total Return 3-year Total Return 15.0% 80.0% 12% 70.0% 11% 65% 10.0% 60.0% 61% 50.0% 5.0% 2% 40.0% 30.0% 0.0% 25% 20.0% (5.0%) 10.0% 0.0% (10.0%) (10.0%) (20.0%) (15.0%) 5-year Total Return 10-year Total Return 200.0% 1,000.0% 189% 932% 180.0% 900.0% 160.0% 800.0% 140.0% 700.0% 120.0% 600.0% 100.0% 92% 500.0% 80.0% 400.0% 60.0% 55% 300.0% 40.0% 200.0% 210% 20.0% 100.0% 106% 0.0% 0.0% (20.0%) (100.0%) Sun Communities, Inc. (SUI) S&P 500 MSCI US REIT (RMS Source: S&P Global as of September 30, 2018.

CONSISTENT NOI GROWTH . Manufactured housing is one of the most recession-resistant sectors of the housing and commercial real estate sectors and has consistently outperformed multifamily in same community NOI growth since 2000 NOI Growth $230 $225 Self-storage $224 Sun Communities $219 Manufactured Housing $210 $190 $170 $158 Multifamily $150 $146 Mall $140 Shopping Centers $140 Industrial $130 $132 Office $110 $90 2000 2001 2002 2003 2004 2005 2006 2007 2008 2009 2010 2011 2012 2013 2014 2015 2016 2017 2018 Source: Citi Investment research, June, 2018. Refer to information regarding non-GAAP financial measures in this Appendix.

NON-GAAP TERMS DEFINED Investors in and analysts following the real estate industry utilize funds from operations (“FFO”), net operating income (“NOI”), and earnings before interest, tax, depreciation and amortization (“EBITDA”) as supplemental performance measures. The Company believes that FFO, NOI, and EBITDA are appropriate measures given their wide use by and relevance to investors and analysts. Additionally, FFO, NOI, and EBITDA are commonly used in various ratios, pricing multiples, yields and returns and valuation calculations used to measure financial position, performance and value. FFO, reflecting the assumption that real estate values rise or fall with market conditions, principally adjusts for the effects of generally accepted accounting principles (“GAAP”) depreciation and amortization of real estate assets. NOI provides a measure of rental operations that does not factor in depreciation, amortization and non-property specific expenses such as general and administrative expenses. EBITDA provides a further measure to evaluate ability to incur and service debt and to fund dividends and other cash needs. FFO is defined by the National Association of Real Estate Investment Trusts (“NAREIT”) as GAAP net income (loss), excluding gains (or losses) from sales of depreciable operating property, plus real estate- related depreciation and amortization, and after adjustments for unconsolidated partnerships and joint ventures. FFO is a non-GAAP financial measure that management believes is a useful supplemental measure of the Company’s operating performance. By excluding gains and losses related to sales of previously depreciated operating real estate assets, impairment and excluding real estate asset depreciation and amortization (which can vary among owners of identical assets in similar condition based on historical cost accounting and useful life estimates), FFO provides a performance measure that, when compared period-over-period, reflects the impact to operations from trends in occupancy rates, rental rates, and operating costs, providing perspective not readily apparent from GAAP net income (loss). Management believes the use of FFO has been beneficial in improving the understanding of operating results of REITs among the investing public and making comparisons of REIT operating results more meaningful. The Company also uses FFO excluding certain gain and loss items that management considers unrelated to the operational and financial performance of our core business (“Core FFO”). The Company believes that Core FFO provides enhanced comparability for investor evaluations of period-over-period results. The Company believes that GAAP net income (loss) is the most directly comparable measure to FFO. The principal limitation of FFO is that it does not replace GAAP net income (loss) as a performance measure or GAAP cash flow from operations as a liquidity measure. Because FFO excludes significant economic components of GAAP net income (loss) including depreciation and amortization, FFO should be used as a supplement to GAAP net income (loss) and not as an alternative to it. Further, FFO is not intended as a measure of a REIT’s ability to meet debt principal repayments and other cash requirements, nor as a measure of working capital. FFO is calculated in accordance with the Company’s interpretation of standards established by NAREIT, which may not be comparable to FFO reported by other REITs that interpret the NAREIT definition differently. NOI is derived from revenues minus property operating expenses and real estate taxes. NOI is a non-GAAP financial measure that the Company believes is helpful to investors as a supplemental measure of operating performance because it is an indicator of the return on property investment, and provides a method of comparing property performance over time. The Company uses NOI as a key measure when evaluating performance and growth of particular properties and/or groups of properties. The principal limitation of NOI is that it excludes depreciation, amortization, interest expense and non-property specific expenses such as general and administrative expenses, all of which are significant costs. Therefore, NOI is a measure of the operating performance of the properties of the Company rather than of the Company overall. The Company believes that GAAP net income (loss) is the most directly comparable measure to NOI. NOI should not be considered to be an alternative to GAAP net income (loss) as an indication of the Company’s financial performance or GAAP cash flow from operating activities as a measure of the Company’s liquidity; nor is it indicative of funds available for the Company’s cash needs, including its ability to make cash distributions. Because of the inclusion of items such as interest, depreciation, and amortization, the use of GAAP net income (loss) as a performance measure is limited as these items may not accurately reflect the actual change in market value of a property, in the case of depreciation and in the case of interest, may not necessarily be linked to the operating performance of a real estate asset, as it is often incurred at a parent company level and not at a property level. EBITDA as defined by NAREIT (referred to as “EBITDAre”) is calculated as GAAP net income (loss), plus interest expense, plus income tax expense, plus depreciation and amortization, plus or minus losses or gains on the disposition of depreciated property (including losses or gains on change of control), plus impairment write-downs of depreciated property and of investments in unconsolidated affiliates caused by a decrease in value of depreciated property in the affiliate, and adjustments to reflect the entity’s share of EBITDAre of unconsolidated affiliates. EBITDAre is a non-GAAP financial measure that the Company uses to evaluate its ability to incur and service debt, fund dividends and other cash needs and cover fixed costs. Investors utilize EBITDAre as a supplemental measure to evaluate and compare investment quality and enterprise value of REITs. The Company also uses EBITDAre excluding certain gain and loss items that management considers unrelated to measurement of the Company’s performance on a basis that is independent of capital structure (“Recurring EBITDA”). The Company believes that GAAP net income (loss) is the most directly comparable measure to EBITDAre. EBITDAre is not intended to be used as a measure of the Company’s cash generated by operations or its dividend-paying capacity, and should therefore not replace GAAP net income (loss) as an indication of the Company’s financial performance or GAAP cash flow from operating, investing and financing activities as measures of liquidity.

NET INCOME TO FFO RECONCILIATION (amounts in thousands except per share data) Three Months Ended September 30, Nine Months Ended September 30, Year Ended December 31, 2018 2017 2018 2017 2017 2016 2015 Net income attributable to Sun Communities, Inc. common stockholders $ 46,060 $ 24,115 $ 96,454 $ 57,583 $ 65,021 $ 17,369 $ 137,325 Adjustments: Depreciation and amortization 72,269 64,484 206,892 190,143 262,211 221,576 178,048 Amounts attributable to noncontrolling interests 4,311 1,608 7,724 3,710 4,535 (41) 9,644 Preferred return to preferred OP units 549 578 1,654 1,750 2,320 2,462 2,612 Preferred distribution to Series A-4 preferred stock 432 441 1,305 1,666 2,107 - - Gain on disposition of properties, net - - - - - - (125,376) Gain on disposition of assets, net (6,603) (4,309) (16,977) (11,342) (16,075) (15,713) (10,125) FFO attributable to Sun Communities, Inc. common stockholders and dilutive convertible securities $ 117,018 $ 86,917 $ 297,052 $ 243,510 $ 320,119 $ 225,653 $ 192,128 Adjustments: Transaction costs - 2,167 - 6,990 9,801 31,914 17,803 Other acquisition related costs 345 343 781 2,712 2,810 3,328 - Income from affiliate transactions - - - - - (500) (7,500) Catastrophic weather related charges, net 173 7,756 (1,987) 8,124 8,352 1,172 - Loss of earnings - catastrophic weather related 325 - 975 - 292 - - Preferred stock redemption costs - - - - - - 4,328 Loss on extinguishment of debt 939 - 2,657 759 6,019 1,127 2,800 Other (income) / expense, net (1,231) (3,345) 3,214 (5,340) (8,982) 4,676 - Debt premium write-off (411) - (1,402) (438) (1,343) (839) - Ground lease intangible write-off - - 817 - 898 - - Deferred tax benefit / (expense) (199) (81) (434) (745) (582) (400) 1,000 Core FFO attributable to Sun Communities, Inc. common stockholders and dilutive convertible securities $ 116,959 $ 93,757 $ 301,673 $ 255,572 $ 337,384 $ 266,131 $ 210,559 Weighted average common shares outstanding - basic 81,599 78,369 80,022 75,234 76,084 65,856 53,686 Weighted average common shares outstanding - fully diluted 86,620 82,984 84,764 80,176 80,996 70,165 57,979 FFO attributable to Sun Communities, Inc. common stockholders and dilutive convertible securities per share - fully diluted $ 1.35 $ 1.05 $ 3.50 $ 3.04 $ 3.95 $ 3.22 $ 3.31 Core FFO attributable to Sun Communities, Inc. common stockholders and dilutive convertible securities per share - fully diluted $ 1.35 $ 1.13 $ 3.56 $ 3.19 $ 4.17 $ 3.79 $ 3.63 Source: Company information. Refer to Sun Communities, Inc. Form 10-Q and Supplemental for the quarter ended September 30, 2018 as well as Press Releases after September 30, 2018 for additional information.
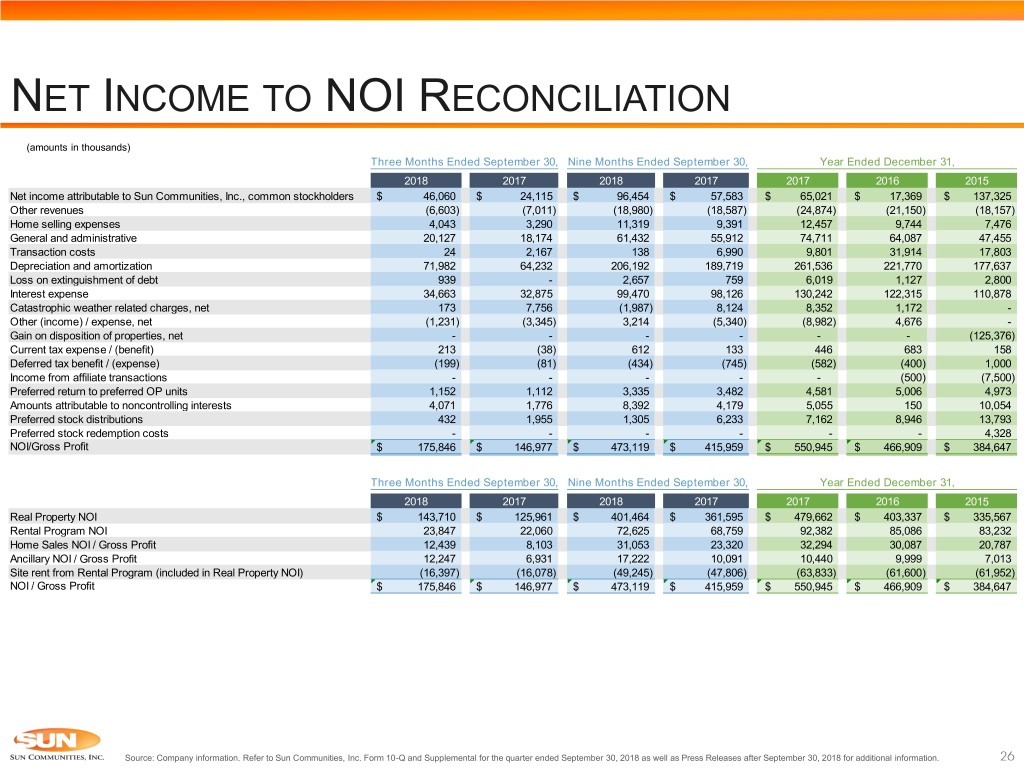
NET INCOME TO NOI RECONCILIATION (amounts in thousands) Three Months Ended September 30, Nine Months Ended September 30, Year Ended December 31, 2018 2017 2018 2017 2017 2016 2015 Net income attributable to Sun Communities, Inc., common stockholders $ 46,060 $ 24,115 $ 96,454 $ 57,583 $ 65,021 $ 17,369 $ 137,325 Other revenues (6,603) (7,011) (18,980) (18,587) (24,874) (21,150) (18,157) Home selling expenses 4,043 3,290 11,319 9,391 12,457 9,744 7,476 General and administrative 20,127 18,174 61,432 55,912 74,711 64,087 47,455 Transaction costs 24 2,167 138 6,990 9,801 31,914 17,803 Depreciation and amortization 71,982 64,232 206,192 189,719 261,536 221,770 177,637 Loss on extinguishment of debt 939 - 2,657 759 6,019 1,127 2,800 Interest expense 34,663 32,875 99,470 98,126 130,242 122,315 110,878 Catastrophic weather related charges, net 173 7,756 (1,987) 8,124 8,352 1,172 - Other (income) / expense, net (1,231) (3,345) 3,214 (5,340) (8,982) 4,676 - Gain on disposition of properties, net - - - - - - (125,376) Current tax expense / (benefit) 213 (38) 612 133 446 683 158 Deferred tax benefit / (expense) (199) (81) (434) (745) (582) (400) 1,000 Income from affiliate transactions - - - - - (500) (7,500) Preferred return to preferred OP units 1,152 1,112 3,335 3,482 4,581 5,006 4,973 Amounts attributable to noncontrolling interests 4,071 1,776 8,392 4,179 5,055 150 10,054 Preferred stock distributions 432 1,955 1,305 6,233 7,162 8,946 13,793 Preferred stock redemption costs - - - - - - 4,328 NOI/Gross Profit $ 175,846 $ 146,977 $ 473,119 $ 415,959 $ 550,945 $ 466,909 $ 384,647 Three Months Ended September 30, Nine Months Ended September 30, Year Ended December 31, 2018 2017 2018 2017 2017 2016 2015 Real Property NOI $ 143,710 $ 125,961 $ 401,464 $ 361,595 $ 479,662 $ 403,337 $ 335,567 Rental Program NOI 23,847 22,060 72,625 68,759 92,382 85,086 83,232 Home Sales NOI / Gross Profit 12,439 8,103 31,053 23,320 32,294 30,087 20,787 Ancillary NOI / Gross Profit 12,247 6,931 17,222 10,091 10,440 9,999 7,013 Site rent from Rental Program (included in Real Property NOI) (16,397) (16,078) (49,245) (47,806) (63,833) (61,600) (61,952) NOI / Gross Profit $ 175,846 $ 146,977 $ 473,119 $ 415,959 $ 550,945 $ 466,909 $ 384,647 Source: Company information. Refer to Sun Communities, Inc. Form 10-Q and Supplemental for the quarter ended September 30, 2018 as well as Press Releases after September 30, 2018 for additional information.
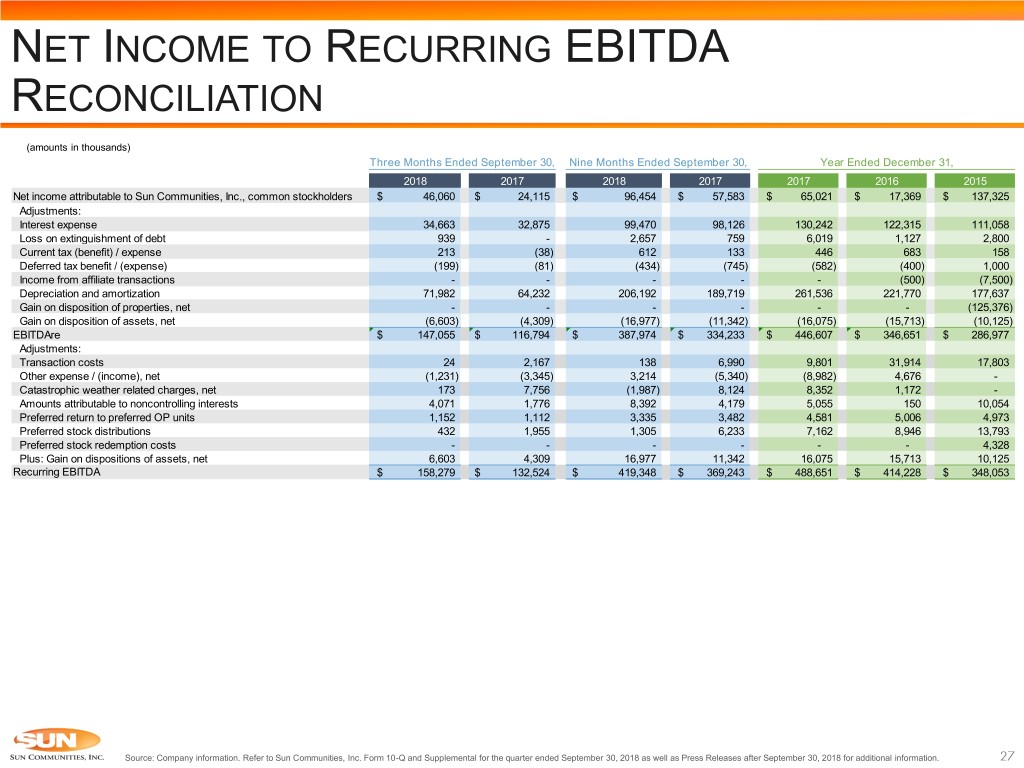
NET INCOME TO RECURRING EBITDA RECONCILIATION (amounts in thousands) Three Months Ended September 30, Nine Months Ended September 30, Year Ended December 31, 2018 2017 2018 2017 2017 2016 2015 Net income attributable to Sun Communities, Inc., common stockholders $ 46,060 $ 24,115 $ 96,454 $ 57,583 $ 65,021 $ 17,369 $ 137,325 Adjustments: Interest expense 34,663 32,875 99,470 98,126 130,242 122,315 111,058 Loss on extinguishment of debt 939 - 2,657 759 6,019 1,127 2,800 Current tax (benefit) / expense 213 (38) 612 133 446 683 158 Deferred tax benefit / (expense) (199) (81) (434) (745) (582) (400) 1,000 Income from affiliate transactions - - - - - (500) (7,500) Depreciation and amortization 71,982 64,232 206,192 189,719 261,536 221,770 177,637 Gain on disposition of properties, net - - - - - - (125,376) Gain on disposition of assets, net (6,603) (4,309) (16,977) (11,342) (16,075) (15,713) (10,125) EBITDAre $ 147,055 $ 116,794 $ 387,974 $ 334,233 $ 446,607 $ 346,651 $ 286,977 Adjustments: Transaction costs 24 2,167 138 6,990 9,801 31,914 17,803 Other expense / (income), net (1,231) (3,345) 3,214 (5,340) (8,982) 4,676 - Catastrophic weather related charges, net 173 7,756 (1,987) 8,124 8,352 1,172 - Amounts attributable to noncontrolling interests 4,071 1,776 8,392 4,179 5,055 150 10,054 Preferred return to preferred OP units 1,152 1,112 3,335 3,482 4,581 5,006 4,973 Preferred stock distributions 432 1,955 1,305 6,233 7,162 8,946 13,793 Preferred stock redemption costs - - - - - - 4,328 Plus: Gain on dispositions of assets, net 6,603 4,309 16,977 11,342 16,075 15,713 10,125 Recurring EBITDA $ 158,279 $ 132,524 $ 419,348 $ 369,243 $ 488,651 $ 414,228 $ 348,053 Source: Company information. Refer to Sun Communities, Inc. Form 10-Q and Supplemental for the quarter ended September 30, 2018 as well as Press Releases after September 30, 2018 for additional information.
