Attached files
| file | filename |
|---|---|
| EX-99.1 - EX-99.1 EARNINGS RELEASE Q3-18 - CrossAmerica Partners LP | capl-ex991_7.htm |
| 8-K - 8-K EARNINGS RELEASE Q3-18 - CrossAmerica Partners LP | capl-8k_20181106.htm |
November 2018 Third Quarter 2018 Earnings Call Exhibit 99.2
Forward Looking Statement Statements contained in this presentation that state the Partnership’s or management’s expectations or predictions of the future are forward-looking statements. The words “believe,” “expect,” “should,” “intends,” “estimates,” “target” and other similar expressions identify forward-looking statements. It is important to note that actual results could differ materially from those projected in such forward-looking statements. For more information concerning factors that could cause actual results to differ from those expressed or forecasted, see CrossAmerica’s annual reports on Form 10-K, quarterly reports on Form 10-Q and other reports filed with the Securities and Exchange Commission and available on the Partnership’s website at www.crossamericapartners.com. If any of these factors materialize, or if our underlying assumptions prove to be incorrect, actual results may vary significantly from what we projected. Any forward-looking statement you see or hear during this presentation reflects our current views as of the date of this presentation with respect to future events. We assume no obligation to publicly update or revise these forward-looking statements for any reason, whether as a result of new information, future events, or otherwise.
CrossAmerica Business Overview Gerardo Valencia, CEO & President
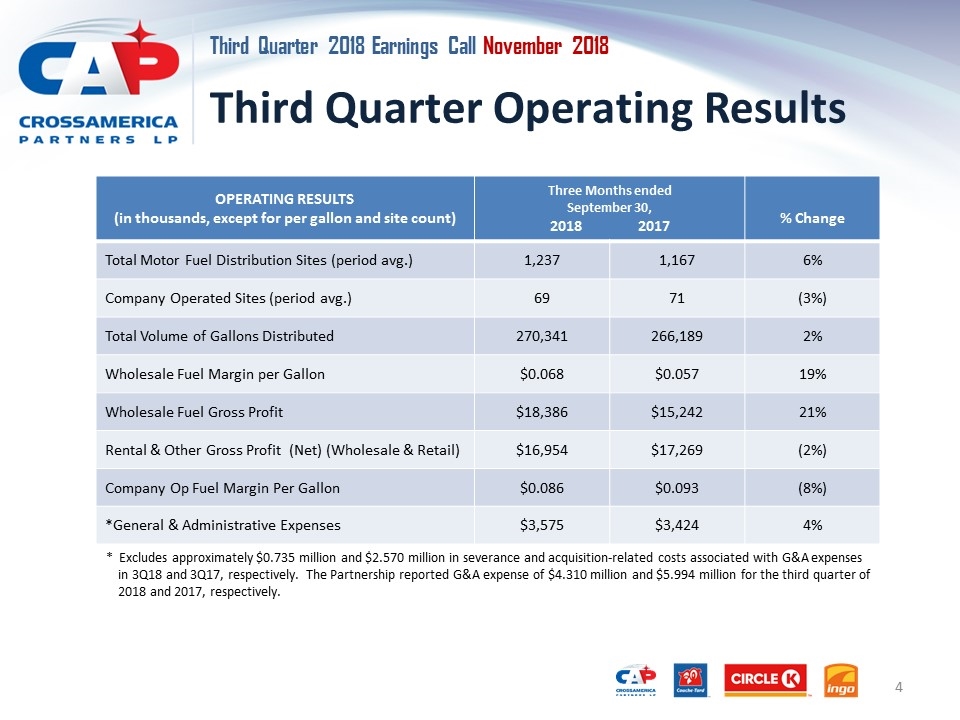
Third Quarter Operating Results OPERATING RESULTS (in thousands, except for per gallon and site count) Three Months ended September 30, 2018 2017 % Change Total Motor Fuel Distribution Sites (period avg.) 1,237 1,167 6% Company Operated Sites (period avg.) 69 71 (3%) Total Volume of Gallons Distributed 270,341 266,189 2% Wholesale Fuel Margin per Gallon $0.068 $0.057 19% Wholesale Fuel Gross Profit $18,386 $15,242 21% Rental & Other Gross Profit (Net) (Wholesale & Retail) $16,954 $17,269 (2%) Company Op Fuel Margin Per Gallon $0.086 $0.093 (8%) *General & Administrative Expenses $3,575 $3,424 4% * Excludes approximately $0.735 million and $2.570 million in severance and acquisition-related costs associated with G&A expenses in 3Q18 and 3Q17, respectively. The Partnership reported G&A expense of $4.310 million and $5.994 million for the third quarter of 2018 and 2017, respectively.
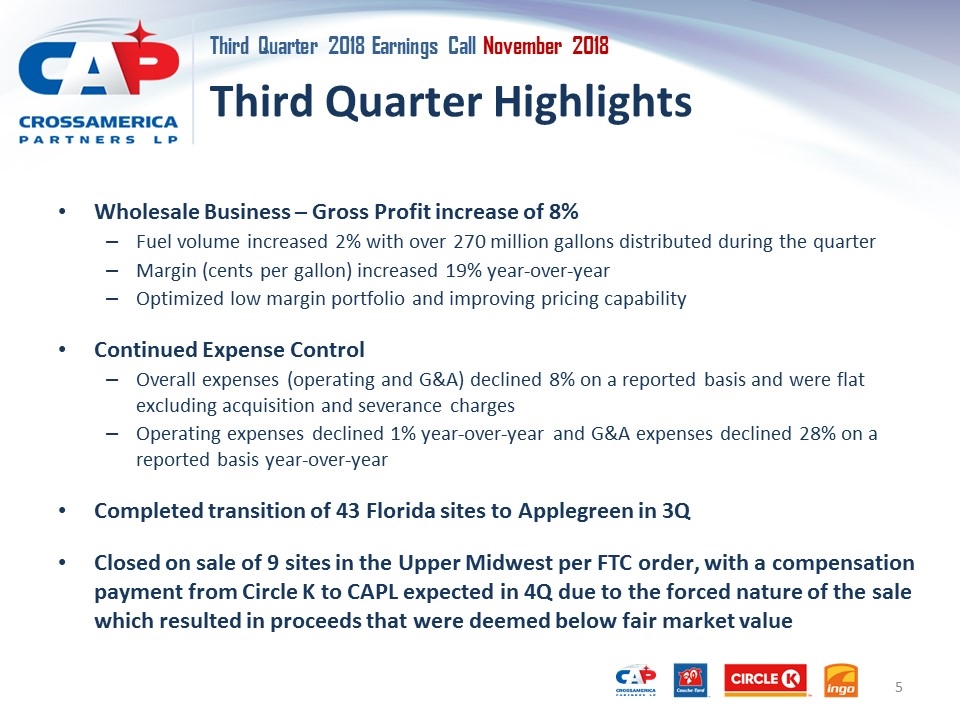
Third Quarter Highlights Wholesale Business – Gross Profit increase of 8% Fuel volume increased 2% with over 270 million gallons distributed during the quarter Margin (cents per gallon) increased 19% year-over-year Optimized low margin portfolio and improving pricing capability Continued Expense Control Overall expenses (operating and G&A) declined 8% on a reported basis and were flat excluding acquisition and severance charges Operating expenses declined 1% year-over-year and G&A expenses declined 28% on a reported basis year-over-year Completed transition of 43 Florida sites to Applegreen in 3Q Closed on sale of 9 sites in the Upper Midwest per FTC order, with a compensation payment from Circle K to CAPL expected in 4Q due to the forced nature of the sale which resulted in proceeds that were deemed below fair market value
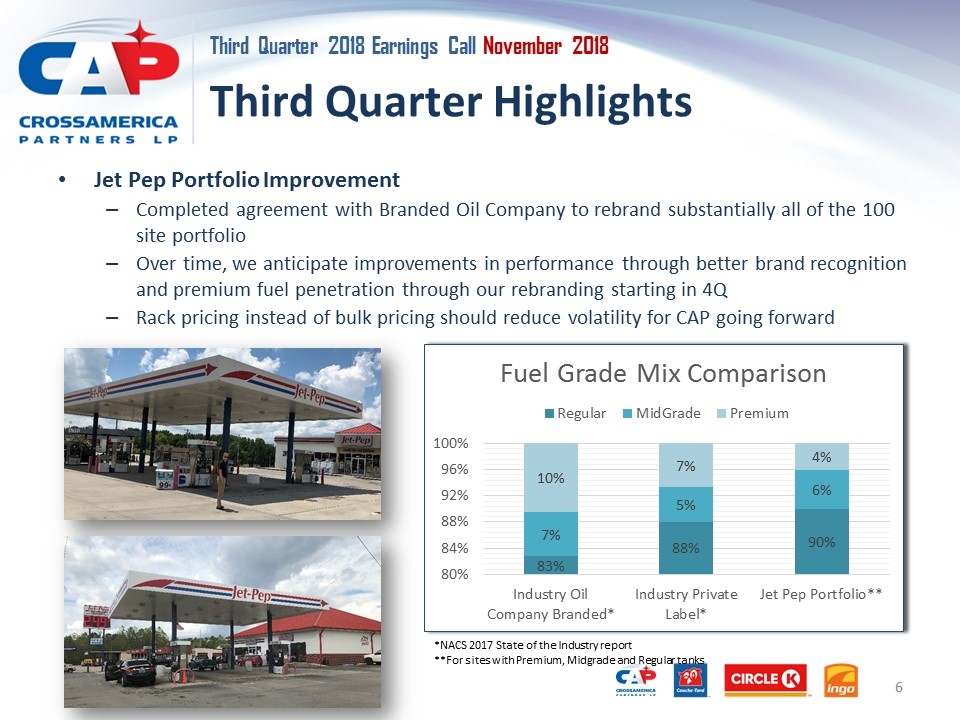
Third Quarter Highlights Jet Pep Portfolio Improvement Completed agreement with Branded Oil Company to rebrand substantially all of the 100 site portfolio Over time, we anticipate improvements in performance through better brand recognition and premium fuel penetration through our rebranding starting in 4Q Rack pricing instead of bulk pricing should reduce volatility for CAP going forward *NACS 2017 State of the Industry report **For sites with Premium, Midgrade and Regular tanks
Third Quarter Highlights Fuel Supply Synergies On track to capture fuel synergies as disclosed earlier in year leveraging Circle K scale Initially working on 385 sites for about 325 million gallons of fuel Establishing relationships with a smaller group of strategic suppliers with whom future growth will provide incremental value going forward Received feedback from multiple parties and expect to complete optimization shortly
CrossAmerica Financial Overview Evan Smith, Chief Financial Officer
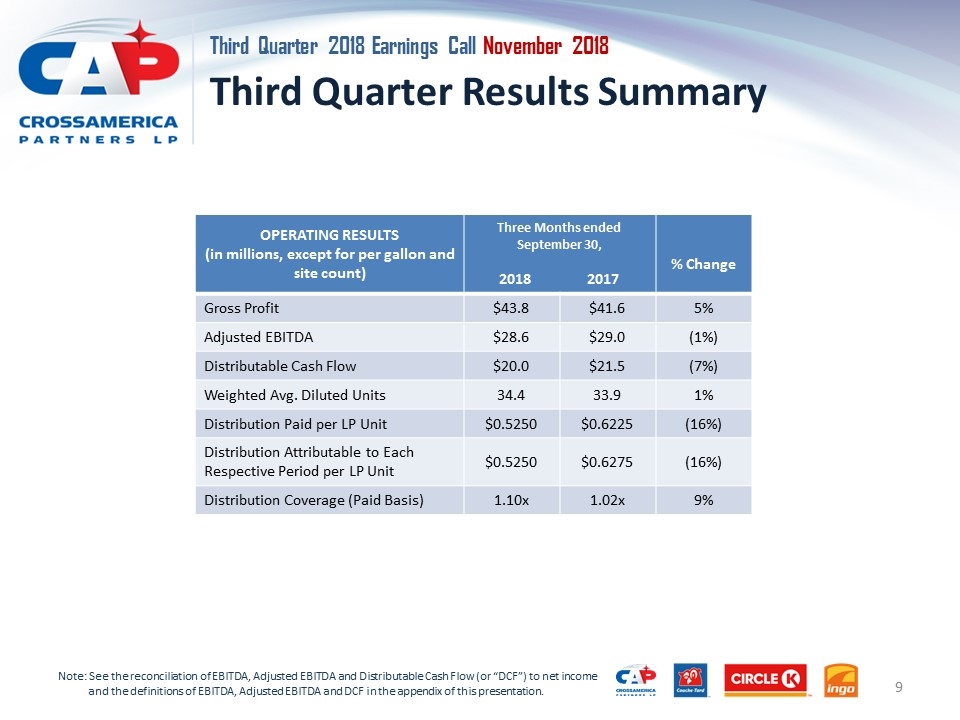
Third Quarter Results Summary OPERATING RESULTS (in millions, except for per gallon and site count) Three Months ended September 30, 2018 2017 % Change Gross Profit $43.8 $41.6 5% Adjusted EBITDA $28.6 $29.0 (1%) Distributable Cash Flow $20.0 $21.5 (7%) Weighted Avg. Diluted Units 34.4 33.9 1% Distribution Paid per LP Unit $0.5250 $0.6225 (16%) Distribution Attributable to Each Respective Period per LP Unit $0.5250 $0.6275 (16%) Distribution Coverage (Paid Basis) 1.10x 1.02x 9% Note: See the reconciliation of EBITDA, Adjusted EBITDA and Distributable Cash Flow (or “DCF”) to net income and the definitions of EBITDA, Adjusted EBITDA and DCF in the appendix of this presentation.
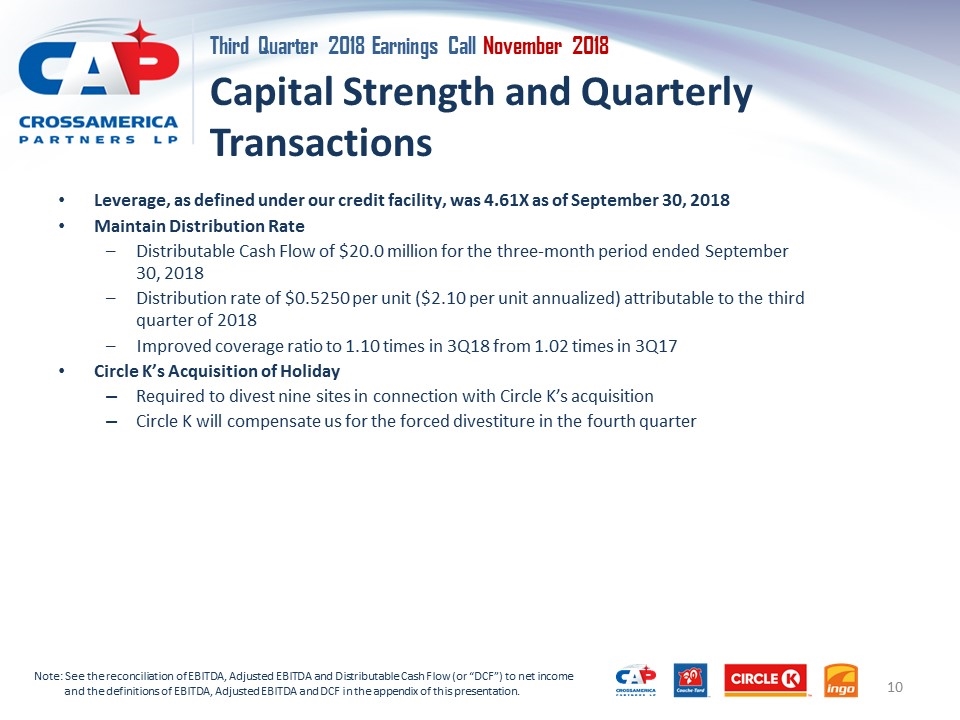
Capital Strength and Quarterly Transactions Leverage, as defined under our credit facility, was 4.61X as of September 30, 2018 Maintain Distribution Rate Distributable Cash Flow of $20.0 million for the three-month period ended September 30, 2018 Distribution rate of $0.5250 per unit ($2.10 per unit annualized) attributable to the third quarter of 2018 Improved coverage ratio to 1.10 times in 3Q18 from 1.02 times in 3Q17 Circle K’s Acquisition of Holiday Required to divest nine sites in connection with Circle K’s acquisition Circle K will compensate us for the forced divestiture in the fourth quarter Note: See the reconciliation of EBITDA, Adjusted EBITDA and Distributable Cash Flow (or “DCF”) to net income and the definitions of EBITDA, Adjusted EBITDA and DCF in the appendix of this presentation.
Appendix Third Quarter 2018 Earnings Call
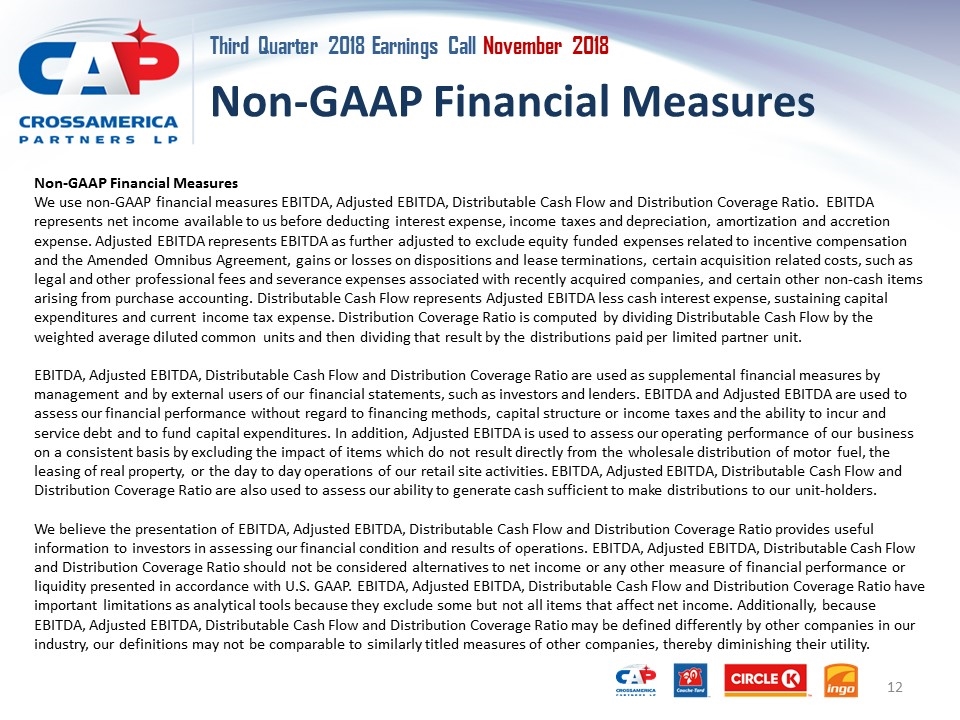
Non-GAAP Financial Measures Non-GAAP Financial Measures We use non-GAAP financial measures EBITDA, Adjusted EBITDA, Distributable Cash Flow and Distribution Coverage Ratio. EBITDA represents net income available to us before deducting interest expense, income taxes and depreciation, amortization and accretion expense. Adjusted EBITDA represents EBITDA as further adjusted to exclude equity funded expenses related to incentive compensation and the Amended Omnibus Agreement, gains or losses on dispositions and lease terminations, certain acquisition related costs, such as legal and other professional fees and severance expenses associated with recently acquired companies, and certain other non-cash items arising from purchase accounting. Distributable Cash Flow represents Adjusted EBITDA less cash interest expense, sustaining capital expenditures and current income tax expense. Distribution Coverage Ratio is computed by dividing Distributable Cash Flow by the weighted average diluted common units and then dividing that result by the distributions paid per limited partner unit. EBITDA, Adjusted EBITDA, Distributable Cash Flow and Distribution Coverage Ratio are used as supplemental financial measures by management and by external users of our financial statements, such as investors and lenders. EBITDA and Adjusted EBITDA are used to assess our financial performance without regard to financing methods, capital structure or income taxes and the ability to incur and service debt and to fund capital expenditures. In addition, Adjusted EBITDA is used to assess our operating performance of our business on a consistent basis by excluding the impact of items which do not result directly from the wholesale distribution of motor fuel, the leasing of real property, or the day to day operations of our retail site activities. EBITDA, Adjusted EBITDA, Distributable Cash Flow and Distribution Coverage Ratio are also used to assess our ability to generate cash sufficient to make distributions to our unit-holders. We believe the presentation of EBITDA, Adjusted EBITDA, Distributable Cash Flow and Distribution Coverage Ratio provides useful information to investors in assessing our financial condition and results of operations. EBITDA, Adjusted EBITDA, Distributable Cash Flow and Distribution Coverage Ratio should not be considered alternatives to net income or any other measure of financial performance or liquidity presented in accordance with U.S. GAAP. EBITDA, Adjusted EBITDA, Distributable Cash Flow and Distribution Coverage Ratio have important limitations as analytical tools because they exclude some but not all items that affect net income. Additionally, because EBITDA, Adjusted EBITDA, Distributable Cash Flow and Distribution Coverage Ratio may be defined differently by other companies in our industry, our definitions may not be comparable to similarly titled measures of other companies, thereby diminishing their utility.
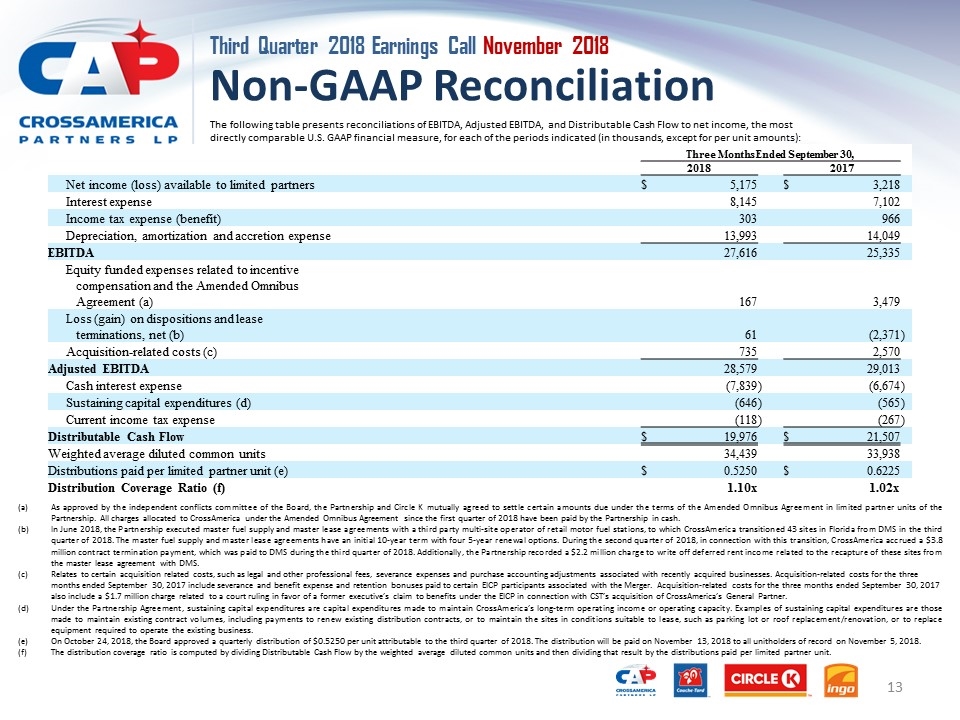
Non-GAAP Reconciliation The following table presents reconciliations of EBITDA, Adjusted EBITDA, and Distributable Cash Flow to net income, the most directly comparable U.S. GAAP financial measure, for each of the periods indicated (in thousands, except for per unit amounts): (a)As approved by the independent conflicts committee of the Board, the Partnership and Circle K mutually agreed to settle certain amounts due under the terms of the Amended Omnibus Agreement in limited partner units of the Partnership. All charges allocated to CrossAmerica under the Amended Omnibus Agreement since the first quarter of 2018 have been paid by the Partnership in cash. (b)In June 2018, the Partnership executed master fuel supply and master lease agreements with a third party multi-site operator of retail motor fuel stations, to which CrossAmerica transitioned 43 sites in Florida from DMS in the third quarter of 2018. The master fuel supply and master lease agreements have an initial 10-year term with four 5-year renewal options. During the second quarter of 2018, in connection with this transition, CrossAmerica accrued a $3.8 million contract termination payment, which was paid to DMS during the third quarter of 2018. Additionally, the Partnership recorded a $2.2 million charge to write off deferred rent income related to the recapture of these sites from the master lease agreement with DMS. (c)Relates to certain acquisition related costs, such as legal and other professional fees, severance expenses and purchase accounting adjustments associated with recently acquired businesses. Acquisition-related costs for the three months ended September 30, 2017 include severance and benefit expense and retention bonuses paid to certain EICP participants associated with the Merger. Acquisition-related costs for the three months ended September 30, 2017 also include a $1.7 million charge related to a court ruling in favor of a former executive’s claim to benefits under the EICP in connection with CST’s acquisition of CrossAmerica’s General Partner. (d)Under the Partnership Agreement, sustaining capital expenditures are capital expenditures made to maintain CrossAmerica’s long-term operating income or operating capacity. Examples of sustaining capital expenditures are those made to maintain existing contract volumes, including payments to renew existing distribution contracts, or to maintain the sites in conditions suitable to lease, such as parking lot or roof replacement/renovation, or to replace equipment required to operate the existing business. (e)On October 24, 2018, the Board approved a quarterly distribution of $0.5250 per unit attributable to the third quarter of 2018. The distribution will be paid on November 13, 2018 to all unitholders of record on November 5, 2018. (f)The distribution coverage ratio is computed by dividing Distributable Cash Flow by the weighted average diluted common units and then dividing that result by the distributions paid per limited partner unit. Three Months Ended September 30, 2018 2017 Net income (loss) available to limited partners $ 5,175 $ 3,218 Interest expense 8,145 7,102 Income tax expense (benefit) 303 966 Depreciation, amortization and accretion expense 13,993 14,049 EBITDA 27,616 25,335 Equity funded expenses related to incentive compensation and the Amended Omnibus Agreement (a) 167 3,479 Loss (gain) on dispositions and lease terminations, net (b) 61 (2,371 ) Acquisition-related costs (c) 735 2,570 Adjusted EBITDA 28,579 29,013 Cash interest expense (7,839 ) (6,674 ) Sustaining capital expenditures (d) (646 ) (565 ) Current income tax expense (118 ) (267 ) Distributable Cash Flow $ 19,976 $ 21,507 Weighted average diluted common units 34,439 33,938 Distributions paid per limited partner unit (e) $ 0.5250 $ 0.6225 Distribution Coverage Ratio (f) 1.10x 1.02x
