Attached files
| file | filename |
|---|---|
| EX-99.1 - EX-99.1 - CENTURY CASINOS INC /CO/ | cnty-20181106xex99_1.htm |
| 8-K - 8-K - CENTURY CASINOS INC /CO/ | cnty-20181106x8k.htm |
CENTURY CASINOS Financial Results Q3 2018 CENTURY CASINOS 1
Forward-Looking Statements, Business Environment and Risk Factors This presentation may contain “forward-looking statements” within the meaning of Section 27 A of the Securities Act of 1933 , as amended, Section 21 E of the Securities Exchange Act of 1934 , as amended (the “Exchange Act”), and the Private Securities Litigation Reform Act of 1995 . In addition, Century Casinos, Inc . (together with its subsidiaries, the “Company”) may make other written and oral communications from time to time that contain such statements . Forward-looking statements include statements as to industry trends and future expectations of the Company and other matters that do not relate strictly to historical facts and are based on certain assumptions by management at the time such statements are made . Forward-looking statements in this presentation include statements regarding future results of operations, operating efficiencies, synergies and operational performance, the prospects for and timing and costs of new projects, projects in development and other opportunities, including the Century Mile, Bermuda and Vietnam projects , debt repayment, investments in joint ventures, outcomes of legal proceedings, changes in our tax provisions or exposure to additional income tax liabilities, and plans for our casinos and our Company . These statements are often identified by the use of words such as “may,” “will,” “expect,” “believe,” “anticipate,” “intend,” “could,” “estimate,” or “continue,” and similar expressions or variations . These statements are based on the beliefs and assumptions of the management of the Company based on information currently available to management . Such forward-looking statements are subject to risks, uncertainties and other factors that could cause actual results to differ materially from future results expressed or implied by such forward-looking statements . Important factors that could cause actual results to differ materially from the forward-looking statements include, among others, the risks described in the section entitled “Risk Factors” under Item 1 A in our Annual Report on Form 10-K for the year ended December 31 , 2017 (the “ 2017 Annual Report”) and our subsequent periodic and current reports filed with the SEC . We caution the reader to carefully consider such factors . Furthermore, such forward-looking statements speak only as of the date on which such statements are made . We undertake no obligation to update any forward-looking statements to reflect events or circumstances after the date of such statements . CENTURY CASINOS 2
Forward-Looking Statements, Business Environment and Risk Factors continued In this presentation the term “USD” refers to US dollars, the term “CAD” refers to Canadian dollars, the term “PLN” refers to Polish zloty and the term “GBP” refers to the British pound . Adjusted EBITDA and Adjusted EBITDA margin are non-GAAP financial measures . See Appendix A for the definition and reconciliation of Adjusted EBITDA and Adjusted EBITDA margin . Amounts presented are rounded . As such, rounding differences could occur in period-over-period changes and percentages reported throughout this presentation . The names of the Company’s subsidiaries and certain operating segments are abbreviated on certain of the following slides . See Appendix A for a list of the subsidiaries and their abbreviations . CENTURY CASINOS 3
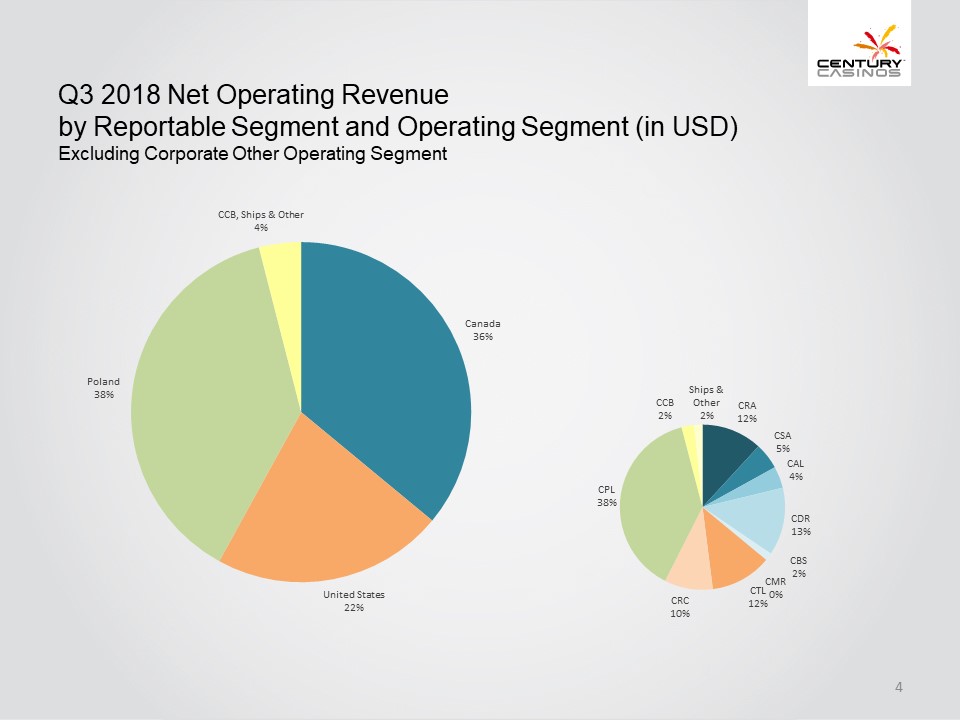
Q3 2018 Net Operating Revenue by Reportable Segment and Operating Segment (in USD) Excluding Corporate Other Operating Segment Canada 36% United States 22% Poland 38% CCB, Ships & Other 4% CRA 12% CSA 5% CAL 4% CDR 13% CBS 2% CMR 0% CTL 12% CRC 10% CPL 38% CCB 2% Ships & Other 2% CENTURY CASINOS 4
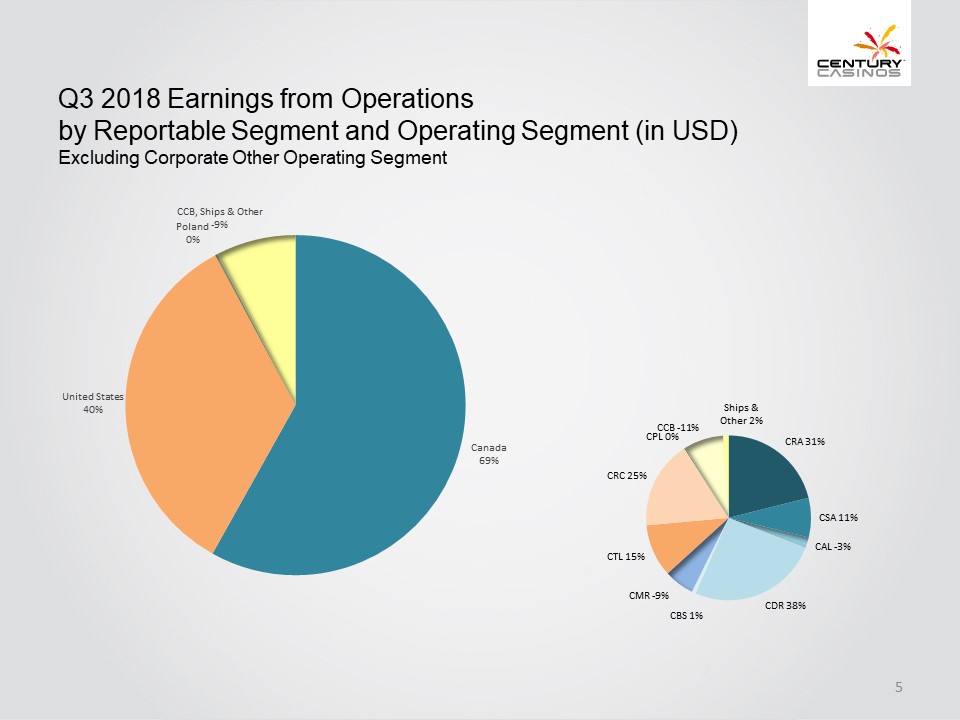
Q3 2018 Earnings from Operations by Reportable Segment and Operating Segment (in USD) Excluding Corporate Other Operating Segment Canada 69% United States 40% Poland 0% CCB, Ships & Other-9% CRA 31% CSA 11% CAL-3% CDR 38% CBS 1% CMR-9% CTL 15% CRC 25% CPL 0% CCB-11% Ships & Other 2% CENTURY CASINOS 5
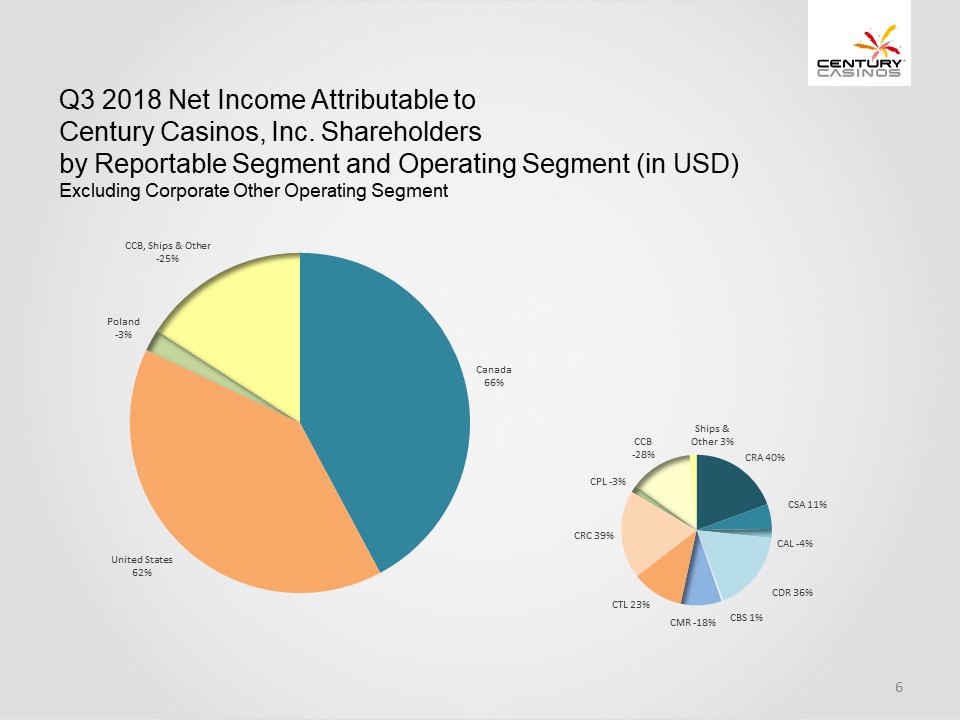
Q3 2018 Net Income Attributable to Century Casinos, Inc. Shareholders by Reportable Segment and Operating Segment (in USD) Excluding Corporate Other Operating Segment Canada 66% United States 62% Poland-3% CCB, Ships & Other-25% CRA 40% CSA 11% CAL-4% CDR 36% CBS 1% CMR-18% CTL 23% CRC 39% CPL-3% CCB-28% Ships & Other 3% CENTURY CASINOS 6
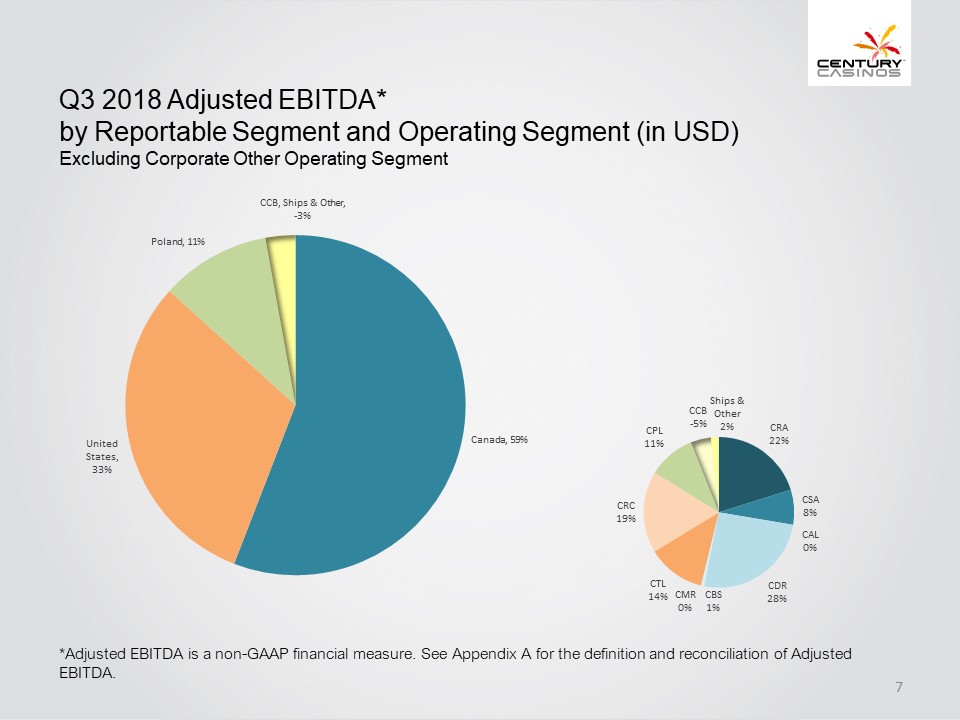
Q3 2018 Adjusted EBITDA* by Reportable Segment and Operating Segment (in USD) Excluding Corporate Other Operating Segment Canada , 59% United States , 33% Poland , 11% CCB, Ships & Other ,-3% CRA 22% CSA 8% CAL 0% CDR 28% CBS 1% CMR 0% CTL 14% CRC 19% CPL 11% CCB-5% Ships & Other 2% *Adjusted EBITDA is a non-GAAP financial measure. See Appendix A for the definition and reconciliation of Adjusted EBITDA. CENTURY CASINOS 7
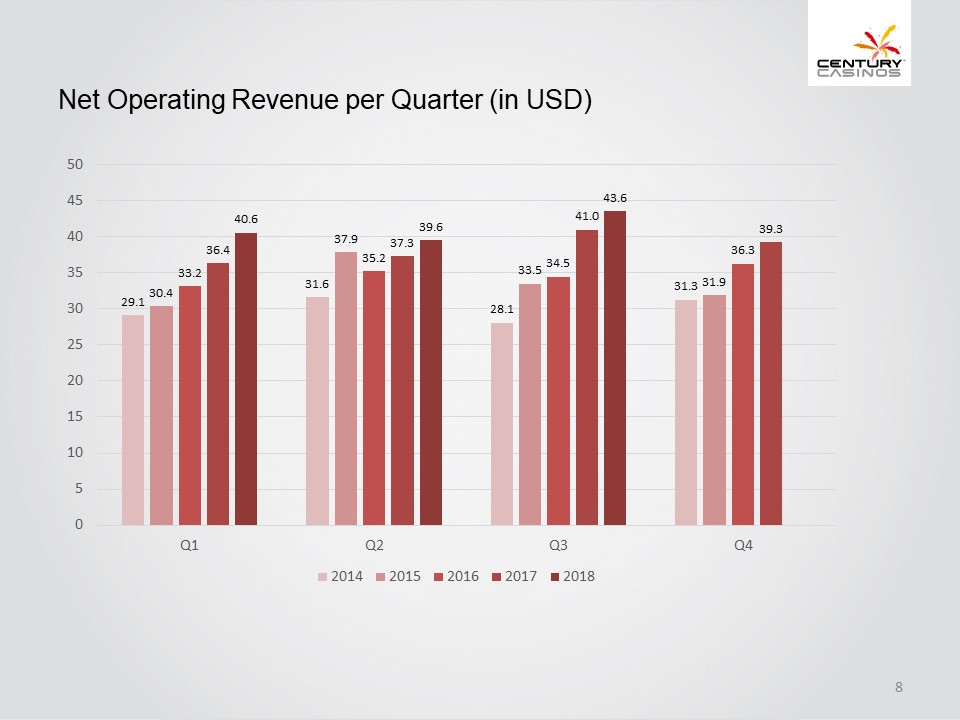
Net Operating Revenue per Quarter (in USD) Q1 29.1 30.4 33.2 36.4 40.6 Q2 31.6 37.9 35.2 37.3 39.6 Q3 28.1 33.5 34.5 41.0 43.6 Q4 31.3 31.9 36.3 39.3 0 5 10 15 20 25 30 35 40 45 50 Q1 Q2 Q3 Q4 2014 2015 2016 2017 2018 CENTURY CASINOS 8
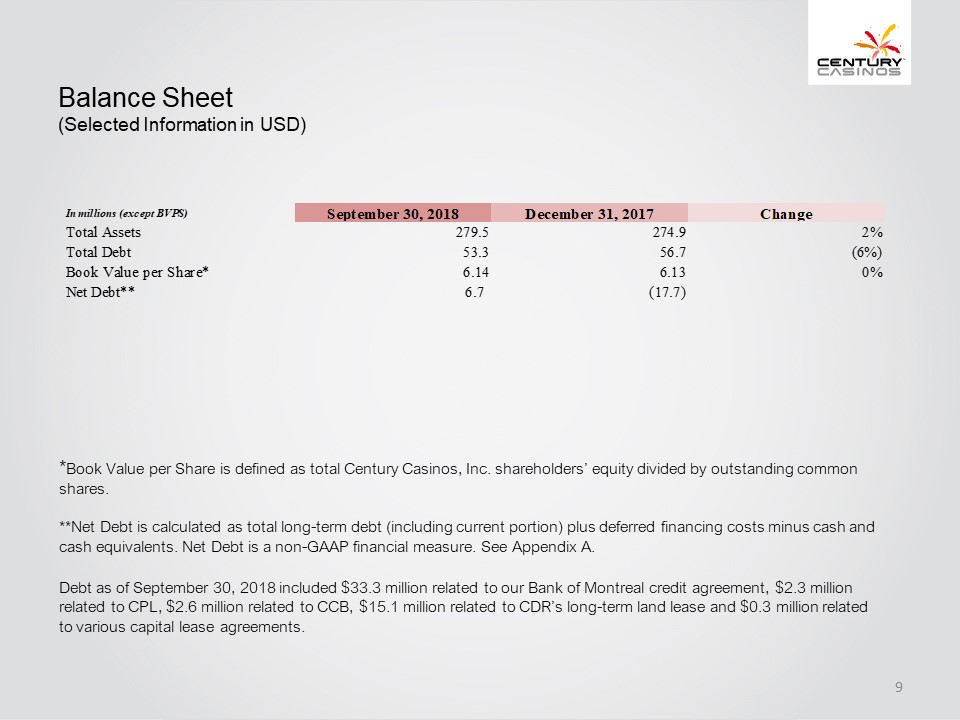
Balance Sheet (Selected Information in USD) In millions (except BVPS) September 30, 2018 December 31, 2017 Change Total Assets 279.5 274.9 2% Total Debt 53.3 56.7 (6%) Book Value per Share* 6.14 6.13 0% Net Debt** 6.7 (17.7)* Book Value per Share is defined as total Century Casinos, Inc. shareholders’ equity divided by outstanding common shares. **Net Debt is calculated as total long-term debt (including current portion) plus deferred financing costs minus cash and cash equivalents. Net Debt is a non-GAAP financial measure. See Appendix A. Debt as of September 30, 2018 included $33.3 million related to our Bank of Montreal credit agreement , $2.3 million related to CPL, $2.6 million related to CCB, $15.1 million related to CDR’s long-term land lease and $ 0.3 million related to various capital lease agreements . CENTURY CASINOS 9
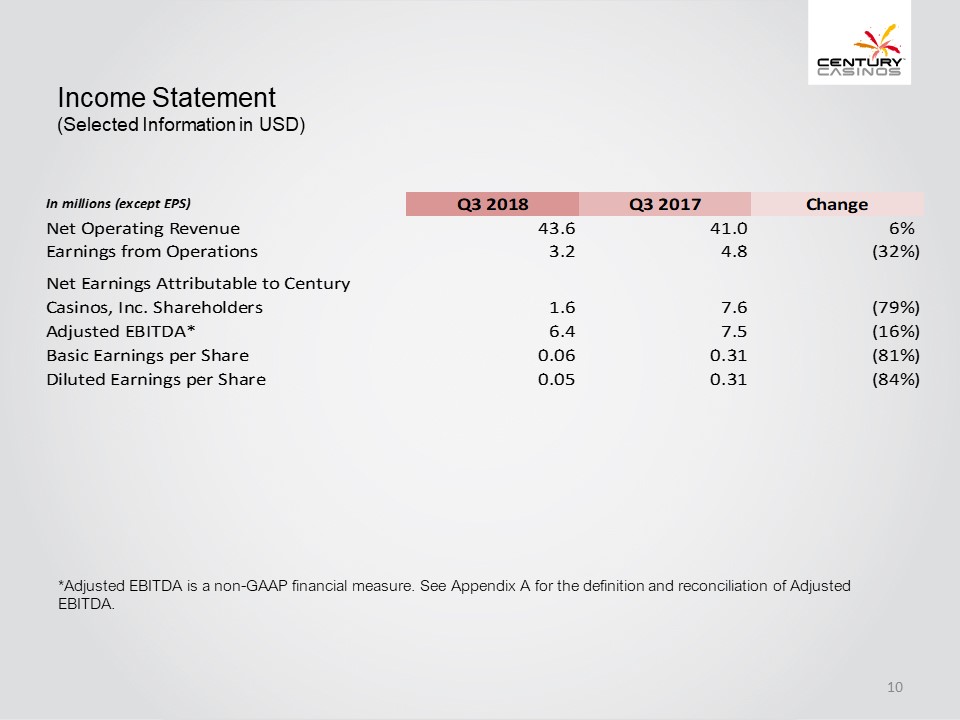
Income Statement (Selected Information in USD) In millions (except EPS) Q3 2018 Q3 2017 Change Net Operating Revenue 43.6 41.0 6% Earnings from Operations 3.2 4.8 (32%) Net Earnings Attributable to Century Casinos, Inc. Shareholders 1.6 7.6 (79%) Adjusted EBITDA* 6.4 7.5 (16%) Basic Earnings per Share 0.06 0.31 (81%) Diluted Earnings per Share 0.05 0.31 (84%) *Adjusted EBITDA is a non-GAAP financial measure. See Appendix A for the definition and reconciliation of Adjusted EBITDA.CENTURY CASINOS 10
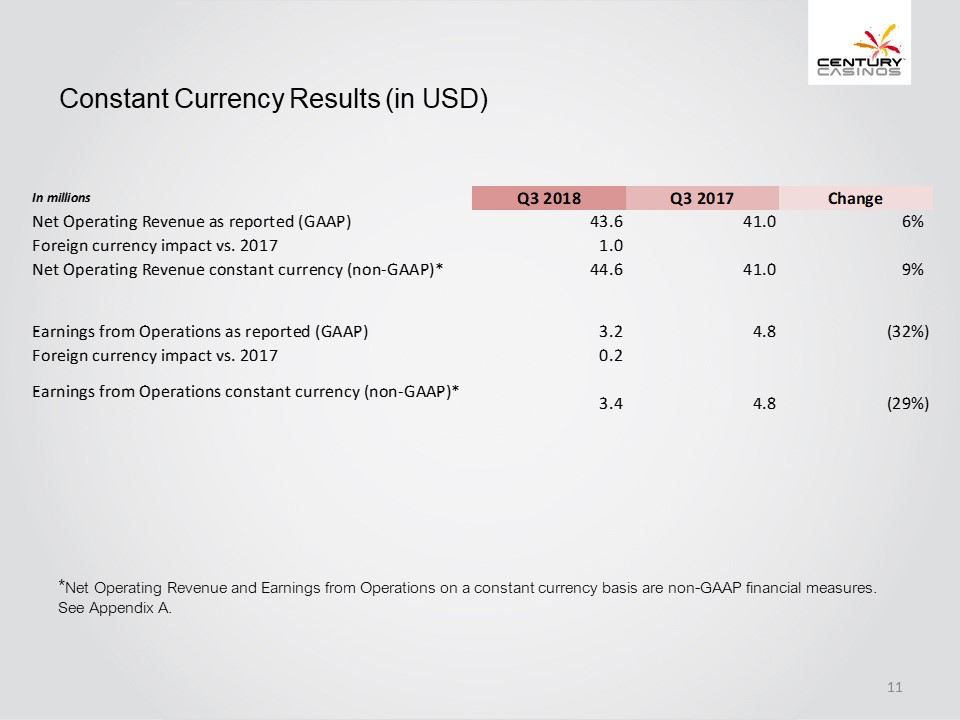
Constant Currency Results (in USD). In millions Q3 2018 Q3 2017 Change Net Operating Revenue as reported (GAAP) 43.6 41.0 6% Foreign currency impact vs. 2017 1.0 Net Operating Revenue constant currency (non-GAAP)* 44.6 41.0 9% Earnings from Operations as reported (GAAP) 3.2 4.8 (32%) Foreign currency impact vs. 2017 0.2 Earnings from Operations constant currency (non-GAAP)* * Net Operating Revenue and Earnings from Operations on a constant currency basis are non-GAAP financial measures. See Appendix A 3.4 4.8 (29%) CENTURY CASINOS 11
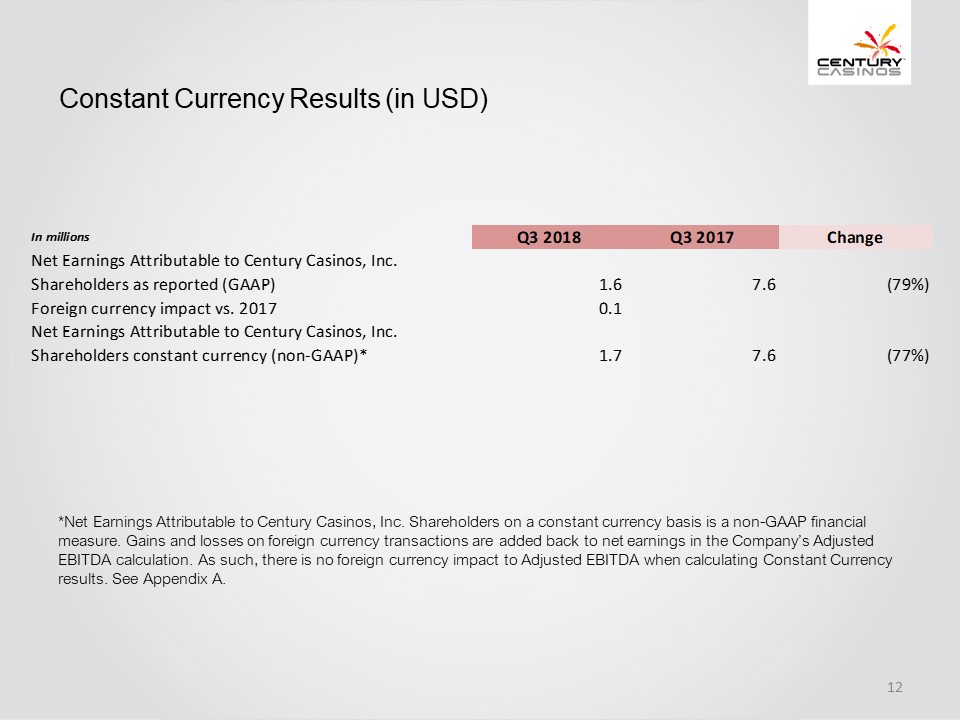
Constant Currency Results (in USD). In millions Q3 2018 Q3 2017 Change Net Earnings Attributable to Century Casinos, Inc. Shareholders as reported (GAAP)1.6 7.6 (79%) Foreign currency impact vs. 2017 0.1 Net Earnings Attributable to Century Casinos, Inc. Shareholders constant currency (non-GAAP)* 1.7 7.6 (77%)*Net Earnings Attributable to Century Casinos, Inc. Shareholders on a constant currency basis is a non-GAAP financial measure . Gains and losses on foreign currency transactions are added back to net earnings in the Company’s Adjusted EBITDA calculation. As such, there is no foreign currency impact to Adjusted EBITDA when calculating Constant Currency results . See Appendix A CENTURY CASINOS 12
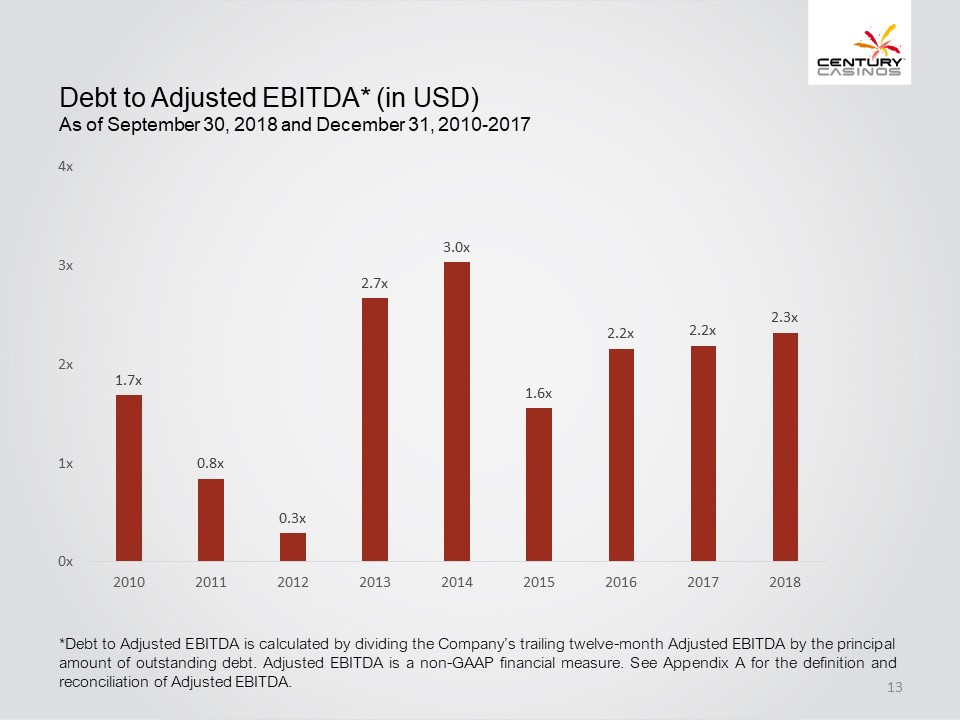
Debt to Adjusted EBITDA* (in USD) As of September 30, 2018 and December 31, 2010-2017 1.7x 2011 0.8x 2012 0.3x 2013 2.7x 2014 3.0x 2015 1.6x 2016 2.2x 2017 2.2x 2018 2.3x 0x 1x 2x 3x 4x *Debt to Adjusted EBITDA is calculated by dividing the Company’s trailing twelve-month Adjusted EBITDA by the principal amount of outstanding debt . Adjusted EBITDA is a non-GAAP financial measure . See Appendix A for the definition and reconciliation of Adjusted EBITDA . CENTURY CASINOS 13
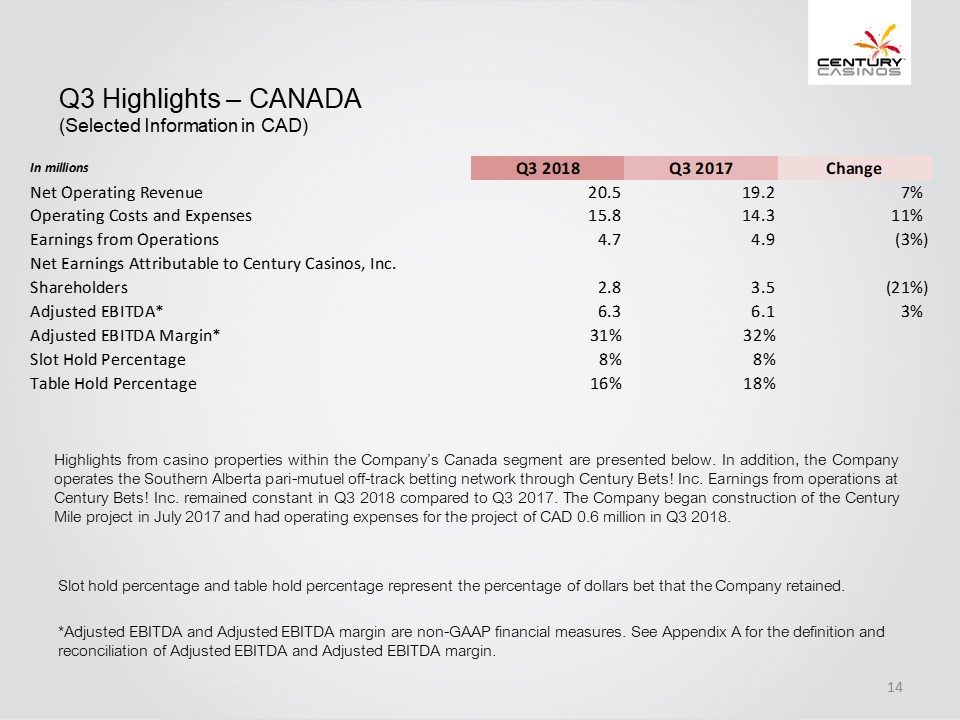
Q3 Highlights – CANADA (Selected Information in CAD). In millions Q3 2018 Q3 2017 Change Net Operating Revenue 20.5 19.2 7% Operating Costs and Expenses 15.8 14.3 11% Earnings from Operations 4.7 4.9 (3%) Net Earnings Attributable to Century Casinos, Inc. Shareholders 2.8 3.5 (21%) Adjusted EBITDA* 6.3 6.1 3% Adjusted EBITDA Margin*31% 32% Slot Hold Percentage 8% 8% Table Hold Percentage 16% 18% Highlights from casino properties within the Company’s Canada segment are presented below . In addition, the Company operates the Southern Alberta pari-mutuel off-track betting network through Century Bets! Inc . Earnings from operations at Century Bets! Inc . remained constant in Q 3 2018 compared to Q 3 2017 . The Company began construction of the Century Mile project in July 2017 and had operating expenses for the project of CAD 0 . 6 million in Q 3 2018 . Slot hold percentage and table hold percentage represent the percentage of dollars bet that the Company retained. * Adjusted EBITDA and Adjusted EBITDA margin are non-GAAP financial measures. See Appendix A for the definition and reconciliation of Adjusted EBITDA and Adjusted EBITDA margin CENTURY CASINOS 14
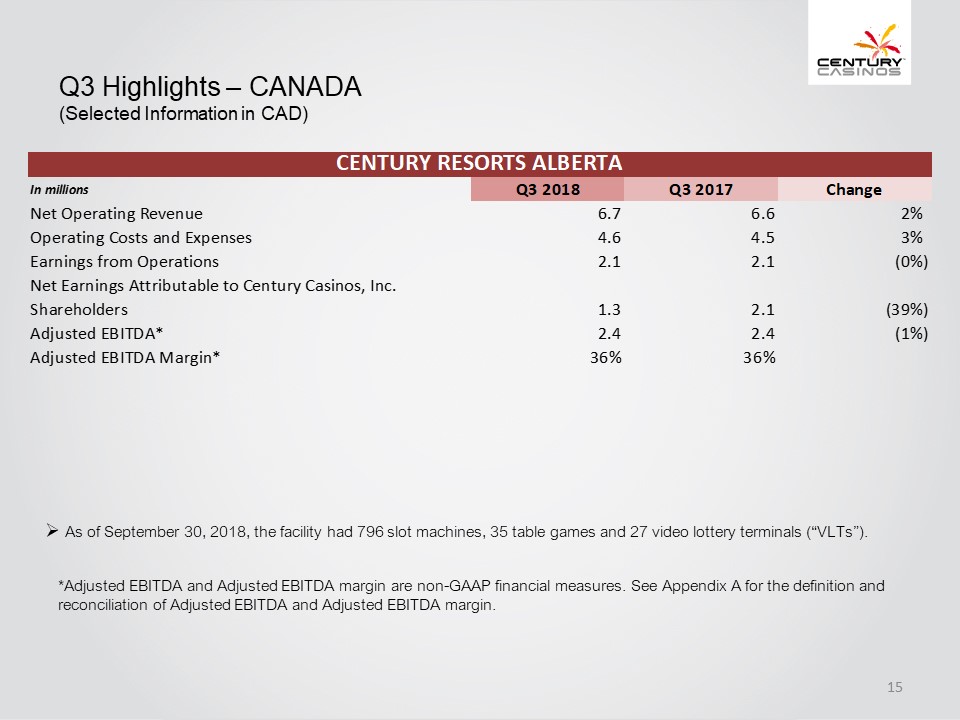
Q3 Highlights – CANADA (Selected Information in CAD) CENTURY RESORTS ALBERTA In millions Q3 2018 Q3 2017 Change Net Operating Revenue 6.7 6.6 2% Operating Costs and Expenses 4.6 4.5 3% Earnings from Operations 2.1 2.1 (0%) Net Earnings Attributable to Century Casinos, Inc. Shareholders 1.3 2.1 (39%) Adjusted EBITDA* 2.4 2.4 (1%) Adjusted EBITDA Margin* 36% 36% As of September 30 , 2018 , the facility had 796 slot machines, 35 table games and 27 video lottery terminals (“VLTs”)*Adjusted EBITDA and Adjusted EBITDA margin are non-GAAP financial measures. See Appendix A for the definition and reconciliation of Adjusted EBITDA and Adjusted EBITDA margin CENTURY CASINOS 15
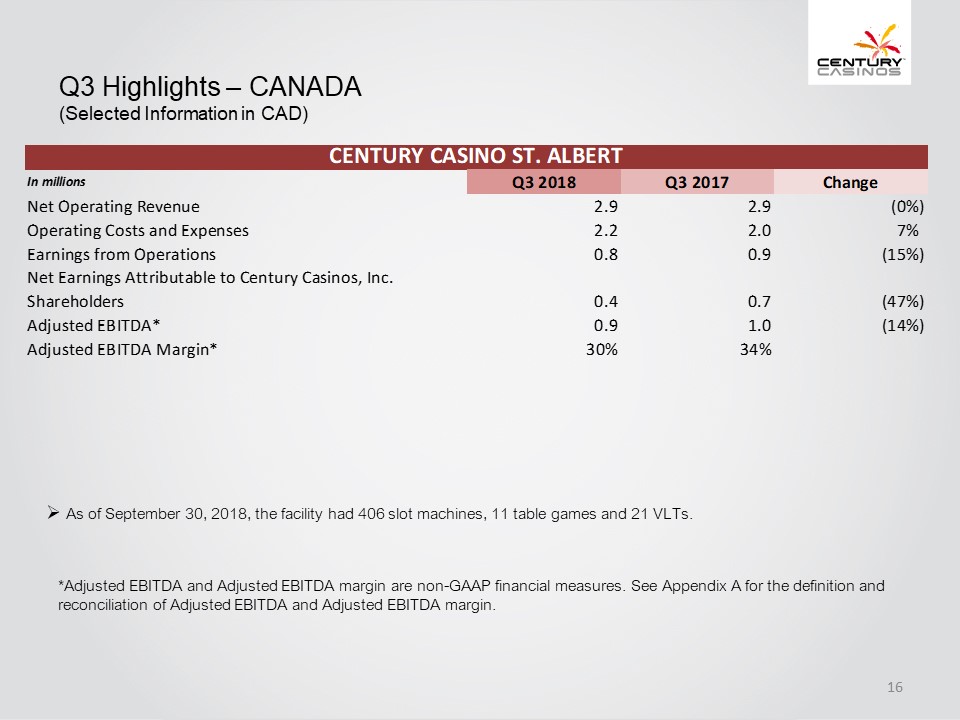
Q3 Highlights – CANADA (Selected Information in CAD) CENTURY CASINO ST. ALBERT In millions Q3 2018 Q3 2017 Change Net Operating Revenue 2.9 2.9 (0%) Operating Costs and Expenses 2.2 2.0 7% Earnings from Operations 0.8 0.9 (15%) Net Earnings Attributable to Century Casinos, Inc. Shareholders 0.4 0.7 (47%) Adjusted EBITDA* 0.9 1.0 (14%) Adjusted EBITDA Margin* 30% 34% As of September 30 , 2018 , the facility had 406 slot machines, 11 table games and 21 VLTs * Adjusted EBITDA and Adjusted EBITDA margin are non-GAAP financial measures. See Appendix A for the definition and reconciliation of Adjusted EBITDA and Adjusted EBITDA margin CENTURY CASINOS 16
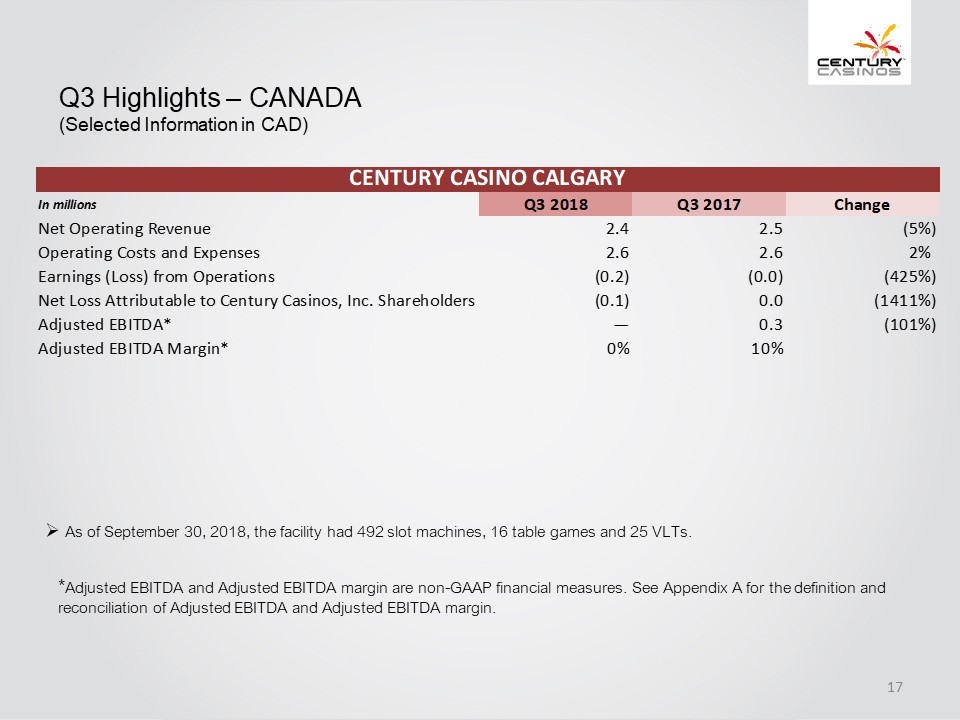
Q3 Highlights – CANADA (Selected Information in CAD) CENTURY CASINO CALGARY In millions Q3 2018 Q3 2017 Change Net Operating Revenue 2.4 2.5 (5%) Operating Costs and Expenses 2.6 2.6 2% Earnings (Loss) from Operations (0.2) (0.0) (425%) Net Loss Attributable to Century Casinos, Inc. Shareholders (0.1) 0.0 (1411%) Adjusted EBITDA* — 0.3 (101%) Adjusted EBITDA Margin* 0% 10% As of September 30 , 2018 , the facility had 492 slot machines, 16 table games and 25 VLTs * Adjusted EBITDA and Adjusted EBITDA margin are non-GAAP financial measures. See Appendix A for the definition and reconciliation of Adjusted EBITDA and Adjusted EBITDA margin CENTURY CASINOS 17
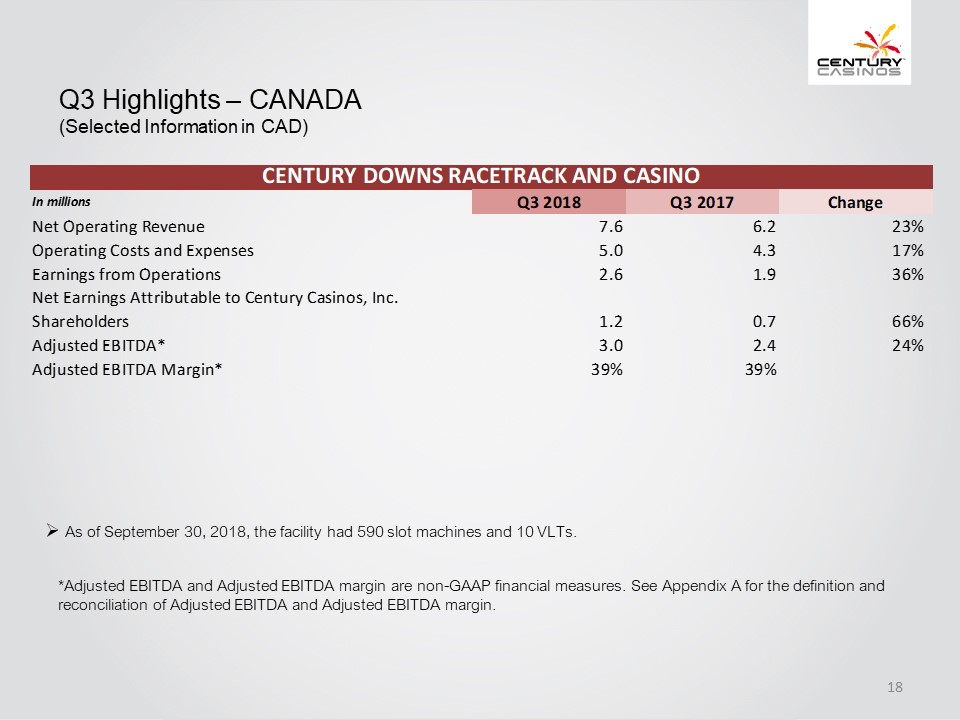
Q3 Highlights – CANADA (Selected Information in CAD) CENTURY DOWNS RACETRACK AND CASINO In millions Q3 2018 Q3 2017 Change Net Operating Revenue 7.6 6.2 23% Operating Costs and Expenses 5.0 4.3 17% Earnings from Operations 2.6 1.9 36% Net Earnings Attributable to Century Casinos, Inc. Shareholders 1.2 0.7 66% Adjusted EBITDA* 3.0 2.4 24% Adjusted EBITDA Margin* 39% 39% As of September 30 , 2018 , the facility had 590 slot machines and 10 VLTs *Adjusted EBITDA and Adjusted EBITDA margin are non-GAAP financial measures. See Appendix A for the definition and reconciliation of Adjusted EBITDA and Adjusted EBITDA margin CENTURY CASINOS 18
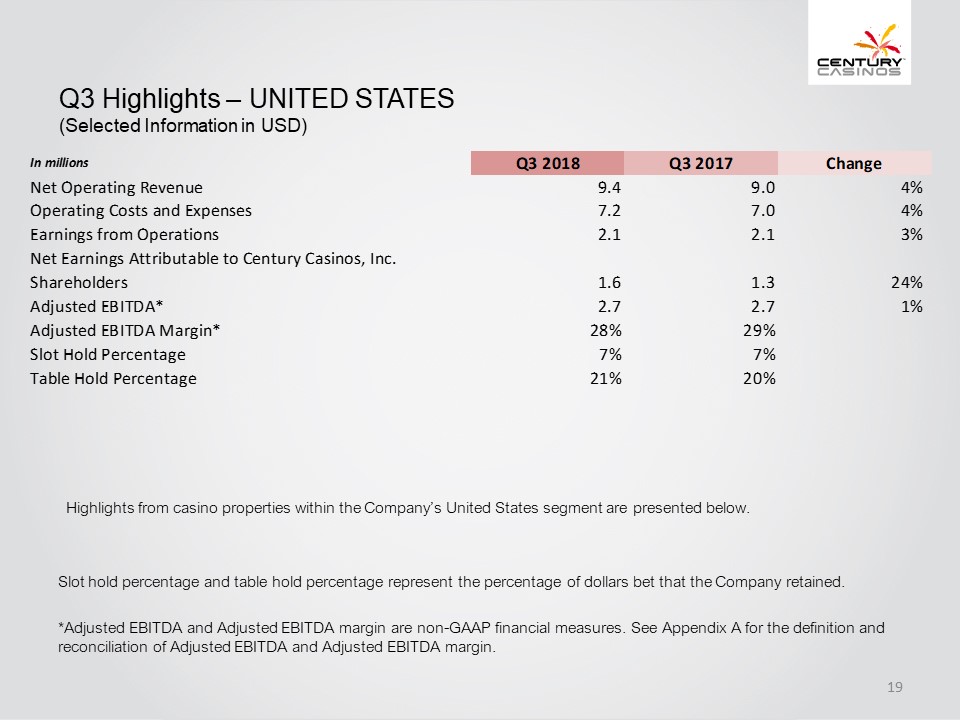
Q3 Highlights – UNITED STATES (Selected Information in USD). In millions Q3 2018 Q3 2017 Change Net Operating Revenue 9.4 9.0 4% Operating Costs and Expenses 7.2 7.0 4% Earnings from Operations 2.1 2.1 3% Net Earnings Attributable to Century Casinos, Inc. Shareholders 1.6 1.3 24% Adjusted EBITDA* 2.7 2.7 1% Adjusted EBITDA Margin* 28% 29% Slot Hold Percentage 7% 7% Table Hold Percentage 21% 20% Highlights from casino properties within the Company’s United States segment are presented below. Slot hold percentage and table hold percentage represent the percentage of dollars bet that the Company retained. * Adjusted EBITDA and Adjusted EBITDA margin are non-GAAP financial measures. See Appendix A for the definition and reconciliation of Adjusted EBITDA and Adjusted EBITDA margin CENTURY CASINOS 19
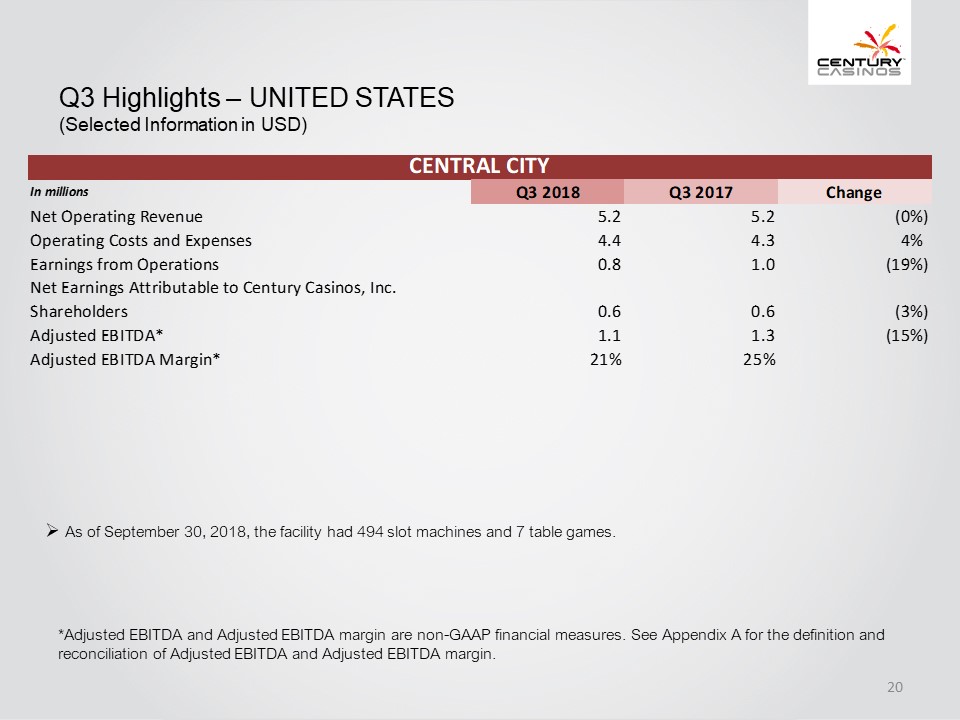
Q3 Highlights – UNITED STATES (Selected Information in USD) In millions Q3 2018 Q3 2017 Change Net Operating Revenue 5.2 5.2 (0%) Operating Costs and Expenses 4.4 4.3 4% Earnings from Operations 0.8 1.0 (19%) Net Earnings Attributable to Century Casinos, Inc. Shareholders 0.6 0.6 (3%) Adjusted EBITDA* 1.1 1.3 (15%) Adjusted EBITDA Margin* 21% 25% CENTRAL CITY As of September 30 , 2018 , the facility had 494 slot machines and 7 table games *Adjusted EBITDA and Adjusted EBITDA margin are non-GAAP financial measures. See Appendix A for the definition and reconciliation of Adjusted EBITDA and Adjusted EBITDA margin CENTURY CASINOS 20
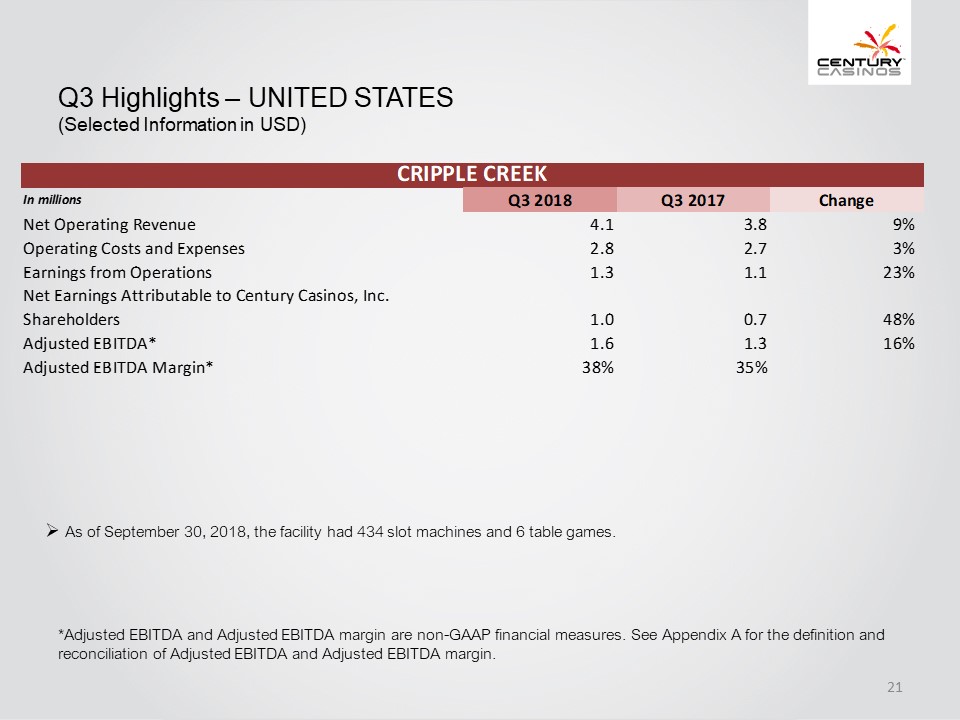
Q3 Highlights – UNITED STATES (Selected Information in USD) In millions Q3 2018 Q3 2017 Change Net Operating Revenue 4.1 3.8 9% Operating Costs and Expenses 2.8 2.7 3% Earnings from Operations 1.3 1.1 23% Net Earnings Attributable to Century Casinos, Inc. Shareholders 1.0 0.7 48% Adjusted EBITDA* 1.6 1.3 16% Adjusted EBITDA Margin* 38% 35% CRIPPLE CREEK As of September 30 , 2018 , the facility had 434 slot machines and 6 table games *Adjusted EBITDA and Adjusted EBITDA margin are non-GAAP financial measures. See Appendix A for the definition and reconciliation of Adjusted EBITDA and Adjusted EBITDA margin CENTURY CASINOS 21
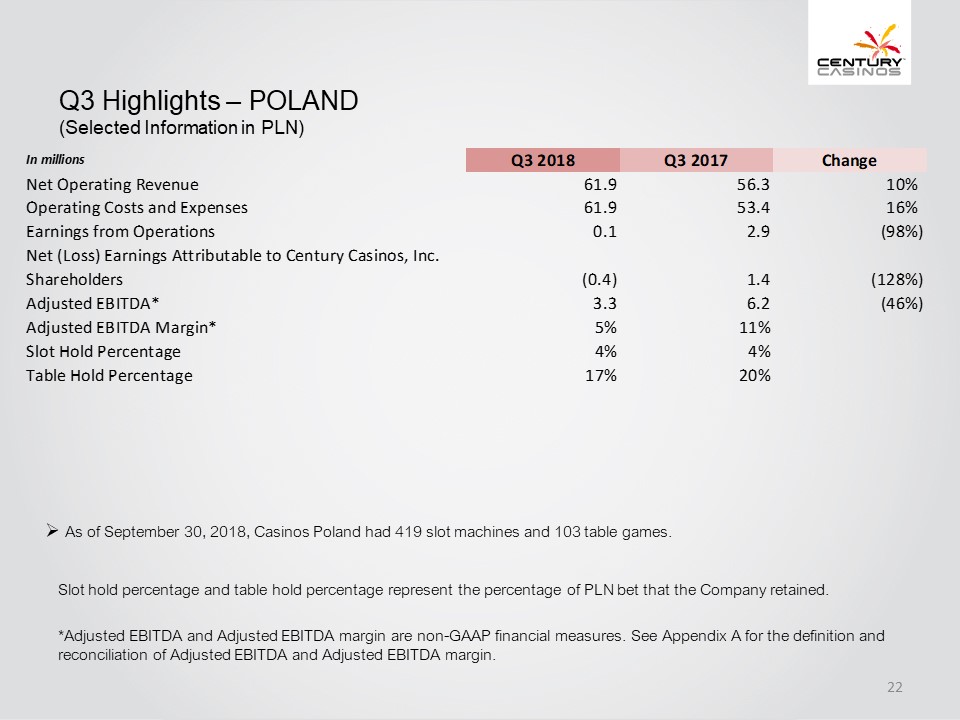
Q3 Highlights – POLAND (Selected Information in PLN) In millions Q3 2018 Q3 2017 Change Net Operating Revenue 61.9 56.3 10% Operating Costs and Expenses 61.9 53.4 16% Earnings from Operations 0.1 2.9 (98%) Net (Loss) Earnings Attributable to Century Casinos, Inc. Shareholders (0.4) 1.4 (128%) Adjusted EBITDA* 3.3 6.2 (46%) Adjusted EBITDA Margin* 5% 11% Slot Hold Percentage 4% 4% Table Hold Percentage 17% 20% As of September 30 , 2018 , Casinos Poland had 419 slot machines and 103 table games Slot hold percentage and table hold percentage represent the percentage of PLN bet that the Company retained. * Adjusted EBITDA and Adjusted EBITDA margin are non-GAAP financial measures. See Appendix A for the definition and reconciliation of Adjusted EBITDA and Adjusted EBITDA margin CENTURY CASINOS 22
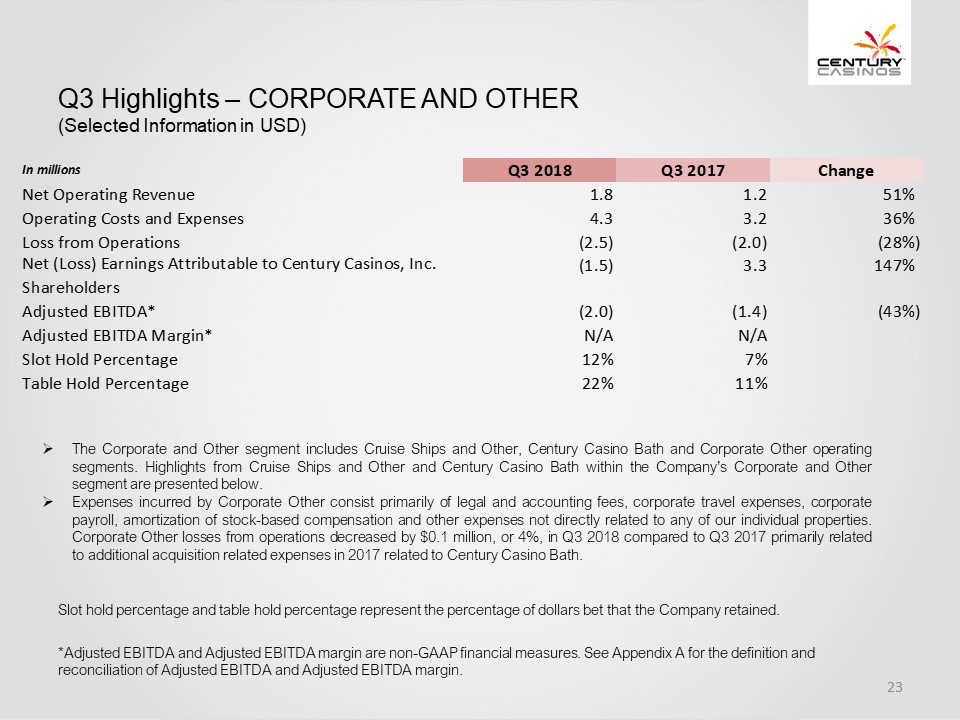
Q3 Highlights – CORPORATE AND OTHER (Selected Information in USD In millions Q3 2018 Q3 2017 Change Net Operating Revenue 1.8 1.2 51% Operating Costs and Expenses 4.3 3.2 36% Loss from Operations (2.5) (2.0) (28%) Net (Loss) Earnings Attributable to Century Casinos, Inc. Shareholders (1.5) 3.3 147% Adjusted EBITDA* (2.0) (1.4) (43%) Adjusted EBITDA Margin* N/A N/A Slot Hold Percentage 12% 7% Table Hold Percentage 22% 11% The Corporate and Other segment includes Cruise Ships and Other, Century Casino Bath and Corporate Other operating segments . Highlights from Cruise Ships and Other and Century Casino Bath within the Company’s Corporate and Other segment are presented below Expenses incurred by Corporate Other consist primarily of legal and accounting fees, corporate travel expenses, corporate payroll, amortization of stock-based compensation and other expenses not directly related to any of our individual properties . Corporate Other losses from operations decreased by $ 0 . 1 million, or 4 % , in Q 3 2018 compared to Q 3 2017 primarily related to additional acquisition related expenses in 2017 related to Century Casino Bath ) Slot hold percentage and table hold percentage represent the percentage of dollars bet that the Company retained. * Adjusted EBITDA and Adjusted EBITDA margin are non-GAAP financial measures. See Appendix A for the definition and reconciliation of Adjusted EBITDA and Adjusted EBITDA margin CENTURY CASINOS 23
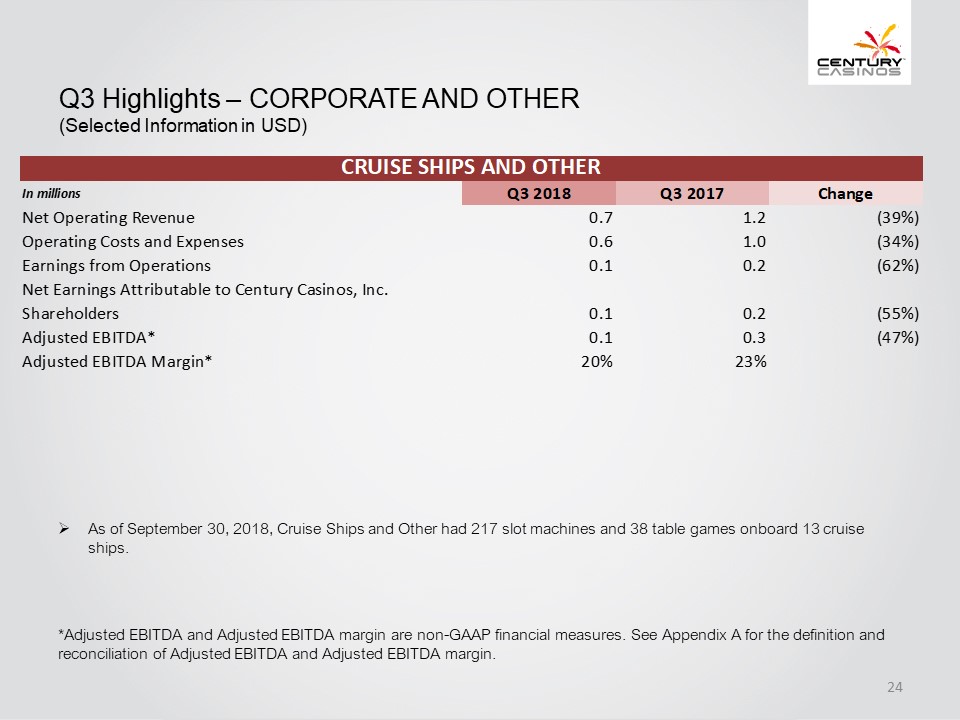
Q3 Highlights – CORPORATE AND OTHER (Selected Information in USD) CRUISE SHIPS AND OTHER In millions Q3 2018 Q3 2017 Change Net Operating Revenue 0.7 1.2 (39%) Operating Costs and Expenses 0.6 1.0 (34%) Earnings from Operations 0.1 0.2 (62%) Net Earnings Attributable to Century Casinos, Inc. Shareholders 0.1 0.2 (55%) Adjusted EBITDA* 0.1 0.3 (47%) Adjusted EBITDA Margin* 20% 23% As of September 30, 2018, Cruise Ships and Other had 217 slot machines and 38 table games onboard 13 cruise ships *Adjusted EBITDA and Adjusted EBITDA margin are non-GAAP financial measures. See Appendix A for the definition and reconciliation of Adjusted EBITDA and Adjusted EBITDA margin CENTURY CASINOS 24
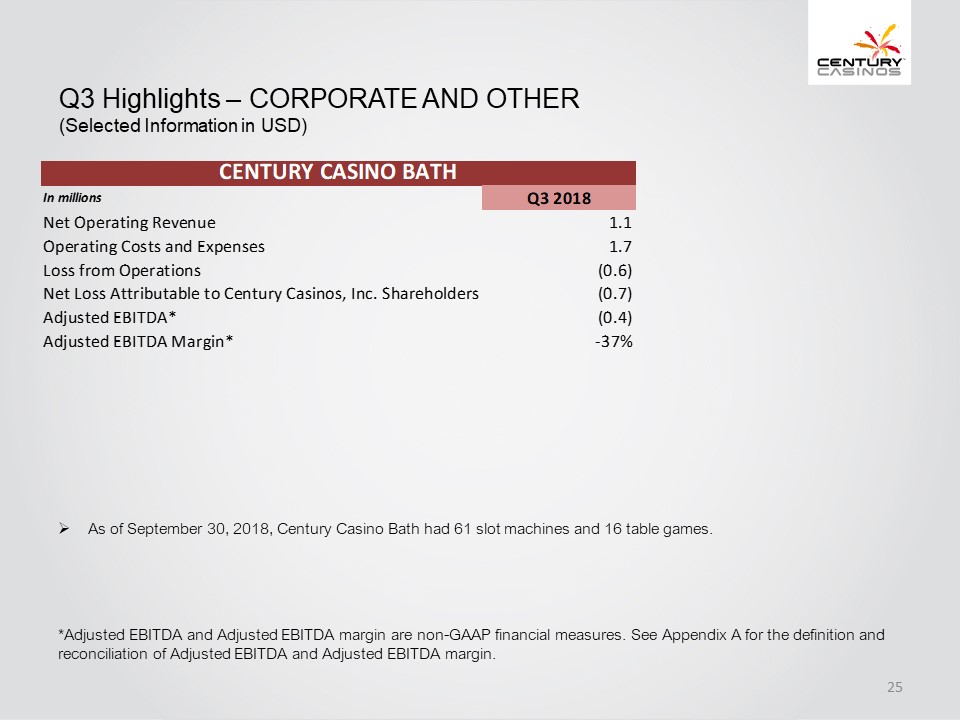
Q3 Highlights – CORPORATE AND OTHER (Selected Information in USD). CENTURY CASINO BATH In millions Q3 2018 Net Operating Revenue 1.1 Operating Costs and Expenses 1.7 Loss from Operations (0.6) Net Loss Attributable to Century Casinos, Inc. Shareholders (0.7) Adjusted EBITDA* (0.4) Adjusted EBITDA Margin* -37% As of September 30, 2018, Century Casino Bath had 61 slot machines and 16 table games *Adjusted EBITDA and Adjusted EBITDA margin are non-GAAP financial measures. See Appendix A for the definition and reconciliation of Adjusted EBITDA and Adjusted EBITDA margin CENTURY CASINOS 25
Q3 Highlights – ADDITIONAL PROJECTS UNDER DEVELOPMENT Century Mile In September 2016 , the Company was selected as the successful applicant by Horse Racing Alberta to own, build and operate a horse racing facility in the Edmonton market area, which the Company will operate as Century Mile Racetrack and Casino . Century Mile will be a one-mile horse racetrack and multi-level racing and entertainment center . The project is located on Edmonton International Airport land close to the city of Leduc, south of Edmonton and positioned off Queen Elizabeth II highway . The Company estimates that the project will cost approximately $ 46.4 million . Construction of the Century Mile project began in July 2017 . The Company estimates that the casino will open in April 2019 . The Company used $ 24.2 million of the $ 34.4 million received from its November 2017 common stock offering for the Century Mile project . The Company plans to finance the rest of the project through its credit agreement with Bank of Montreal (“BMO”), which was amended in August 2018 to increase the Company’s borrowing capacity by CAD 33 . 0 million ( $ 25.5 million based on the exchange rate in effect on September 30 , 2018 ), and with available cash . Bermuda In August 2017 , the Company announced that, together with Hamilton Properties Limited, it had submitted a casino license application to the Bermudan government for a casino at the Hamilton Princess Hotel & Beach Club in Hamilton, Bermuda . The Company’s subsidiary, Century Resorts Management GmbH (“CRM”), entered into a long-term management agreement with Hamilton Properties Limited pursuant to which the Company will assist with the license application and manage the operations of the casino for which it will receive a management fee, should the license be awarded . In September 2017 , the Bermuda Casino Gaming Commission granted a provisional casino gaming license, which is subject to certain conditions and approvals including the adoption of certain rules and regulations by the Bermudan government . CENTURY CASINOS 26
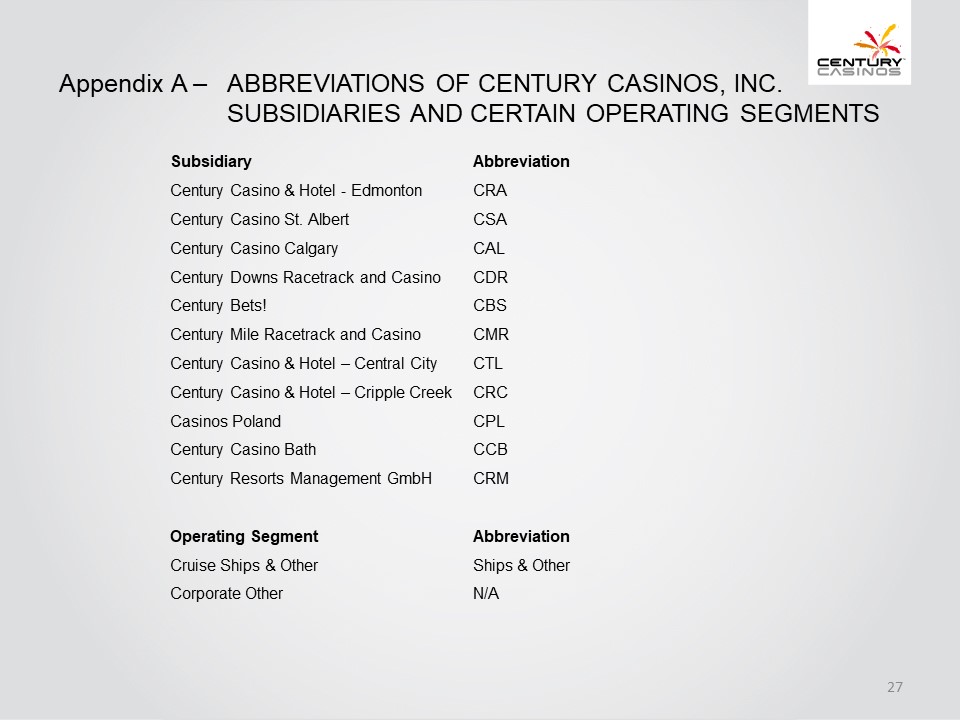
Appendix A – ABBREVIATIONS OF CENTURY CASINOS, INC. SUBSIDIARIES AND CERTAIN OPERATING SEGMENTS Subsidiary Abbreviation Century Casino & Hotel-Edmonton CRA Century Casino St. Albert CSA Century Casino Calgary CAL Century Downs Racetrack and Casino CDR Century Bets! CBS Century Mile Racetrack and Casino CMR Century Casino & Hotel – Central City CTL Century Casino & Hotel – Cripple Creek CRC Casinos Poland CPL Century Casino Bath CCB Century Resorts Management GmbH CRM Operating Segment Abbreviation Cruise Ships & Other Ships & Other Corporate Other N/A CENTURY CASINOS 27
Appendix A – NON-GAAP FINANCIAL MEASURES The Company supplements its condensed consolidated financial statements prepared in accordance with U.S . generally accepted accounting principles (“GAAP ”) by using the following non-GAAP financial measures, which management believes are useful in properly understanding the Company’s short-term and long-term financial trends . Management uses these non-GAAP financial measures to forecast and evaluate the operational performance of the Company as well as to compare results of current periods to prior periods on a consolidated basis. Adjusted EBITDA Adjusted EBITDA margin Constant currency results Net Debt Management believes presenting the non-GAAP financial measures used in this presentation provides investors greater transparency to the information used by management for financial and operational decision-making and allows investors to see the Company’s results “through the eyes” of management . Management also believes providing this information better enables our investors to understand the Company’s operating performance and evaluate the methodology used by management to evaluate and measure such performance . The adjustments made to GAAP financial measures result from facts and circumstances that vary in frequency and impact on the Company’s results of operations . The following is an explanation of each of the adjustments that management excludes in calculating its non-GAAP financial measures . CENTURY CASINOS 28
Appendix A – NON-GAAP FINANCIAL MEASURES The Company defines Adjusted EBITDA as net earnings (loss) attributable to Century Casinos, Inc . shareholders before interest expense (income), net, income taxes (benefit), depreciation, amortization, non-controlling interest net earnings (loss) and transactions, pre-opening expenses, acquisition costs, non-cash stock-based compensation charges, asset impairment costs, (gain) loss on disposition of fixed assets, discontinued operations, (gain) loss on foreign currency transactions and other, gain on business combination and certain other one-time items, such as acquisition and disposition costs and gain or loss . Intercompany transactions consisting primarily of management and royalty fees and interest, along with their related tax effects, are excluded from the presentation of net earnings (loss) and Adjusted EBITDA reported for each segment . Not all of the aforementioned items occur in each reporting period, but have been included in the definition based on historical activity . These adjustments have no effect on the consolidated results as reported under GAAP . Adjusted EBITDA is not considered a measure of performance recognized under GAAP . Management believes that Adjusted EBITDA is a valuable measure of the relative performance of the Company and its properties . The gaming industry commonly uses Adjusted EBITDA as a method of arriving at the economic value of a casino operation . Management uses Adjusted EBITDA to compare the relative operating performance of separate operating units by eliminating the above mentioned items associated with the varying levels of capital expenditures for infrastructure required to generate revenue and the often high cost of acquiring existing operations . Adjusted EBITDA is used by the Company’s lending institution to gauge operating performance . The Company’s computation of Adjusted EBITDA may be different from, and therefore may not be comparable to, similar measures used by other companies within the gaming industry . Please see the reconciliation of Adjusted EBITDA to net earnings (loss) attributable to Century Casinos, Inc . shareholders below . The Company defines Adjusted EBITDA margin as Adjusted EBITDA divided by net operating revenue . Management uses this margin as one of several measures to evaluate the efficiency of the Company’s casino operations . CENTURY CASINOS 29
Appendix A – NON-GAAP FINANCIAL MEASURES The impact of foreign exchange rates is highly variable and difficult to predict . The Company uses a Constant Currency basis to show the impact from foreign exchange rates on current period revenue compared to prior period revenue using the prior period’s foreign exchange rates . In order to properly understand the underlying business trends and performance of the Company’s ongoing operations, management believes that investors may find it useful to consider the impact of excluding changes in foreign exchange rates from the Company’s net operating revenue, earnings from operations and net earnings (loss) attributable to Century Casinos, Inc . shareholders . Constant currency results are calculated by dividing the current quarter or year to date local currency segment results excluding the local currency impact of foreign currency gains and losses, by the prior year’s average exchange rate for the quarter or year to date and comparing them to actual U . S . dollar results for the prior quarter or year to date . The average exchange rates for the current quarter and the prior year third quarter are reported in Item 1 of the Company’s Quarterly Report on Form 10-Q for the quarter ended September 30 , 2018 . Constant currency information is not a measure of financial performance under GAAP and should not be considered a substitute for net operating revenue, earnings from operations or net earnings attributable to Century Casinos, Inc . shareholders as determined in accordance with GAAP . The Company defines Net Debt as total long-term debt (including current portion) plus deferred financing costs minus cash and cash equivalents . Net Debt is not considered a liquidity measure recognized under GAAP . Management believes that Net Debt is a valuable measure of our overall financial situation . Net Debt provides investors with an indication of our ability to pay off all of our long-term debt if it became due simultaneously . CENTURY CASINOS 30
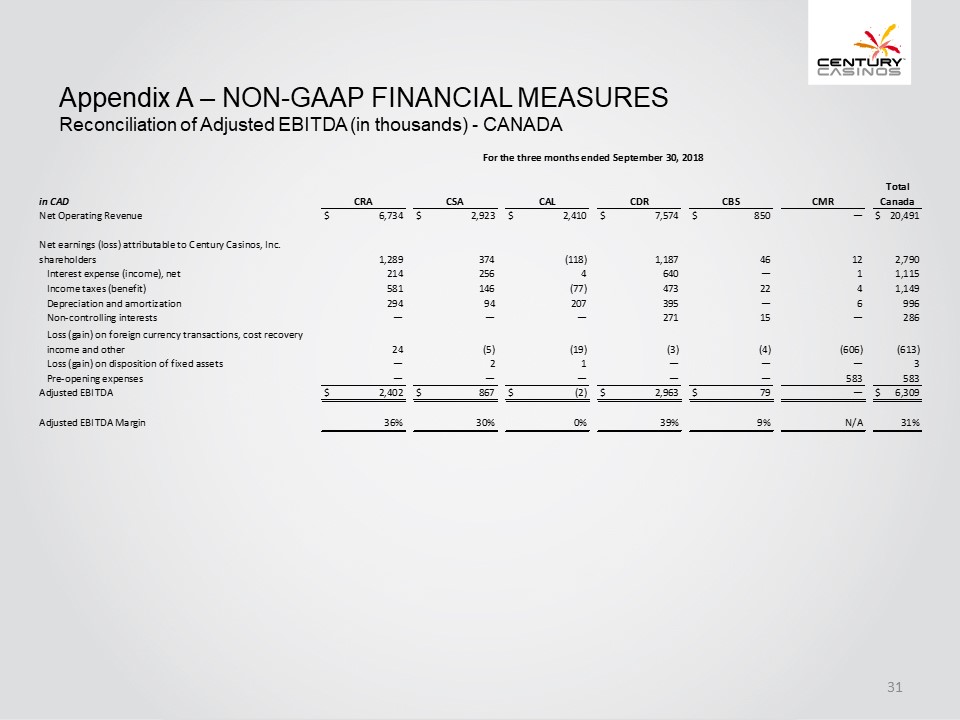
Appendix A – NON-GAAP FINANCIAL MEASURES Reconciliation of Adjusted EBITDA (in thousands)-CANADA For the three months ended September 30, 2018 in CAD CRA CSA CAL CDR CBS CMR Total Canada Net Operating Revenue 6,734$ 2,923$ 2,410$ 7,574$ 850$ — 20,491$ Net earnings (loss) attributable to Century Casinos, Inc. shareholders 1,289 374 (118) 1,187 46 12 2,790 Interest expense (income), net 214 256 4 640 — 11,115 Income taxes (benefit) 581 146 (77) 473 22 4 1,149 Depreciation and amortization 294 94 207 395 — 6 996 Non-controlling interests — — — 271 15 — 286 Loss (gain) on foreign currency transactions, cost recovery income and other 24 (5) (19) (3) (4) (606) (613) Loss (gain) on disposition of fixed assets — 2 1 — — — 3 Pre-opening expenses — — — — — 583 583 Adjusted EBITDA 2,402$ 867$ (2)$ 2,963$ 79$ — 6,309$ Adjusted EBITDA Margin 36% 30% 0% 39% 9% N/A 31% CENTURY CASINOS 31
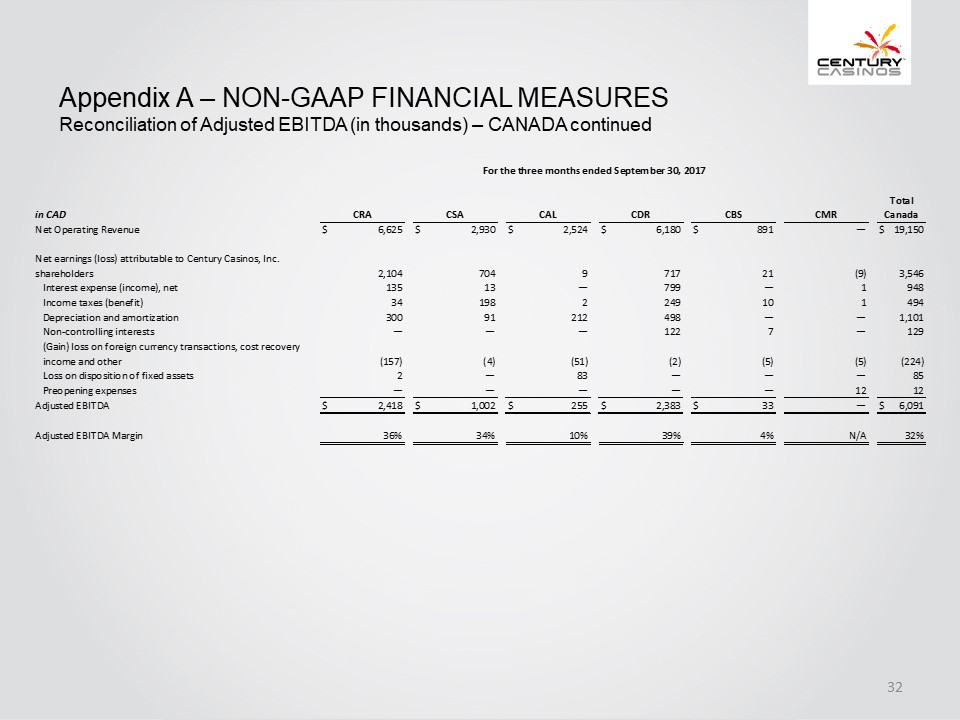
Appendix A – NON-GAAP FINANCIAL MEASURES Reconciliation of Adjusted EBITDA (in thousands) – CANADA continued For the three months ended September 30, 2017 in CAD CRA CSA CAL CDR CBS CMR Total Canada Net Operating Revenue 6,625$ 2,930$ 2,524$ 6,180$ 891$ — 19,150$ Net earnings (loss) attributable to Century Casinos, Inc. shareholders 2,104 704 9 717 21 (9) 3,546 Interest expense (income), net 135 13 — 799 — 1 948 Income taxes (benefit) 34 198 2 249 10 1 494 Depreciation and amortization 300 91 212 498 — — 1,101 Non-controlling interests — — — 122 7 — 129 (Gain) loss on foreign currency transactions, cost recovery income and other (157) (4) (51) (2) (5) (5) (224) Loss on disposition of fixed assets 2 — 83 — — — 85 Preopening expenses — — — — — 12 12 Adjusted EBITDA 2,418$ 1,002$ 255$ 2,383$ 33$ — 6,091$ Adjusted EBITDA Margin 36% 34% 10% 39% 4% N/A 32% CENTURY CASINOS 32
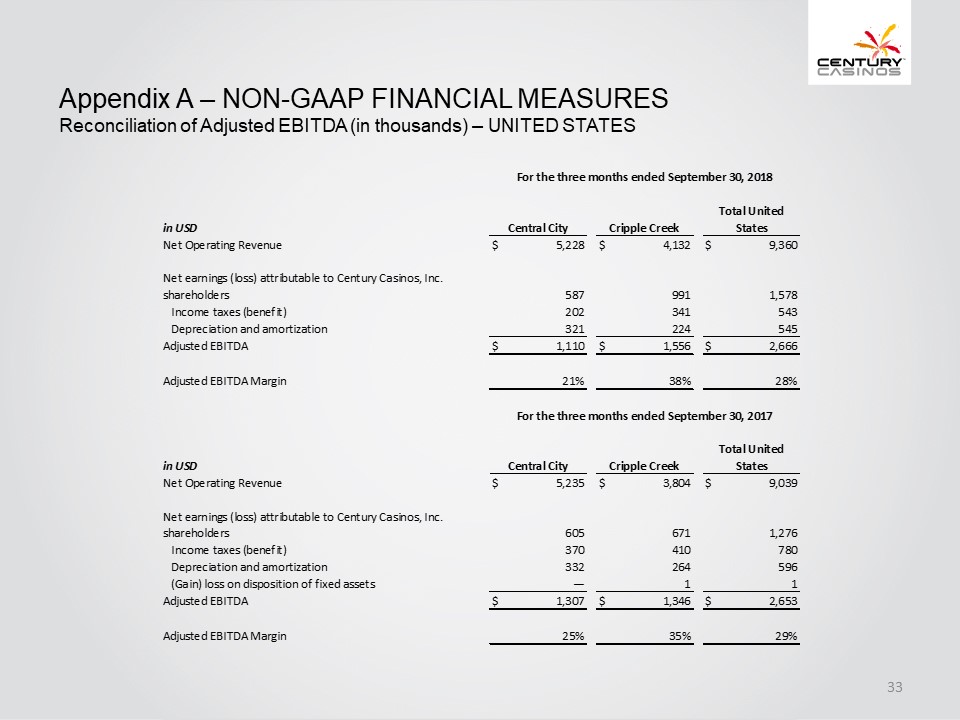
Appendix A – NON-GAAP FINANCIAL MEASURES Reconciliation of Adjusted EBITDA (in thousands) – UNITED STATES For the three months ended September 30, 2018 For the three months ended September 30, 2017 in USD Central City Cripple Creek Total United States Net Operating Revenue 5,228$ 4,132$ 9,360$ Net earnings (loss) attributable to Century Casinos, Inc. shareholders 587 991 1,578 Income taxes (benefit) 202 341 543 Depreciation and amortization 321 224 545 Adjusted EBITDA 1,110$ 1,556$ 2,666$ Adjusted EBITDA Margin 21% 38% 28% in USD Central City Cripple Creek Total United States Net Operating Revenue 5,235$ 3,804$ 9,039$ Net earnings (loss) attributable to Century Casinos, Inc. shareholders 605 671 1,276 Income taxes (benefit) 370 410 780 Depreciation and amortization 332 264 596 (Gain) loss on disposition of fixed assets — 1 1 Adjusted EBITDA 1,307$ 1,346$ 2,653$ Adjusted EBITDA Margin 25% 35% 29% CENTURY CASINOS 33
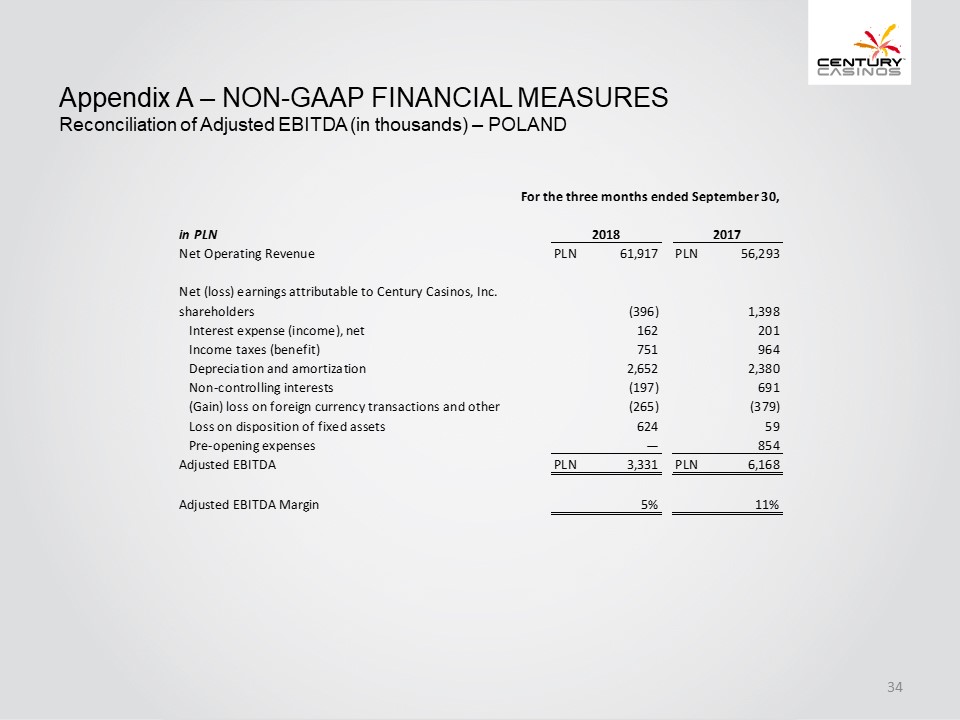
Appendix A – NON-GAAP FINANCIAL MEASURES Reconciliation of Adjusted EBITDA (in thousands) – POLAND For the three months ended September 30 in PLN 2018 2017 Net Operating Revenue 61,917 PLN 56,293 PLN Net (loss) earnings attributable to Century Casinos, Inc. shareholders (396) 1,398 Interest expense (income), net 162 201 Income taxes (benefit) 751 964 Depreciation and amortization 2,652 2,380 Non-controlling interests (197) 691 (Gain) loss on foreign currency transactions and other (265) (379) Loss on disposition of fixed assets 624 59 Pre-opening expenses — 854 Adjusted EBITDA 3,331 PLN 6,168 PLN Adjusted EBITDA Margin 5% 11% CENTURY CASINOS 34
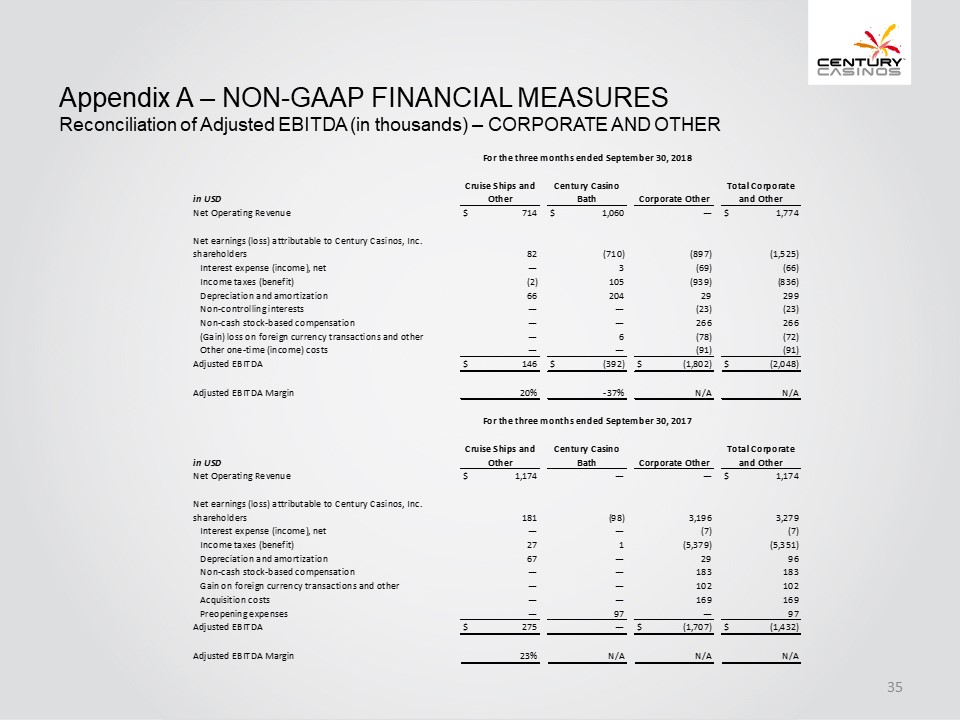
Appendix A – NON-GAAP FINANCIAL MEASURES Reconciliation of Adjusted EBITDA (in thousands) – CORPORATE AND OTHER For the three months ended September 30, 2018 For the three months ended September 30, 2017 in USD Cruise Ships and Other Century Casino Bath Corporate Other Total Corporate and Other Net Operating Revenue 714 $ 1,060 $ —1,774 $ Net earnings (loss) attributable to Century Casinos, Inc. shareholders 82(710) (897) (1,525) Interest expense (income), net—3 (69) (66) Income taxes (benefit) (2) 105 (939) (836) Depreciation and amortization 66 204 29 299 Non-controlling interests — — (23) (23) Non-cash stock-based compensation — — 266 266 (Gain) loss on foreign currency transactions and other—6 (78) (72) Other one-time (income) costs — — (91) (91) Adjusted EBITDA 146$ (392) $ (1,802) $ (2,048) $ Adjusted EBITDA Margin 20% 37% N/A N/A in USD Cruise Ships and Other Century Casino Bath Corporate Other Total Corporate and Other Net Operating Revenue 1,174 $ — — 1,174$ Net earnings (loss) attributable to Century Casinos, Inc. shareholders 181 (98) 3,196 3,279 Interest expense (income), net — — (7) (7) Income taxes (benefit) 271 (5,379) (5,351) Depreciation and amortization 67 — 29 96 Non-cash stock-based compensation — — 183 183 Gain on foreign currency transactions and other — — 102 102 Acquisition costs — — 169 169 Preopening expenses — 97 — 97 Adjusted EBITDA 275$ — (1,707)$ (1,432)$ Adjusted EBITDA Margin 23% N/A N/A N/A CENTURY CASINOS 35
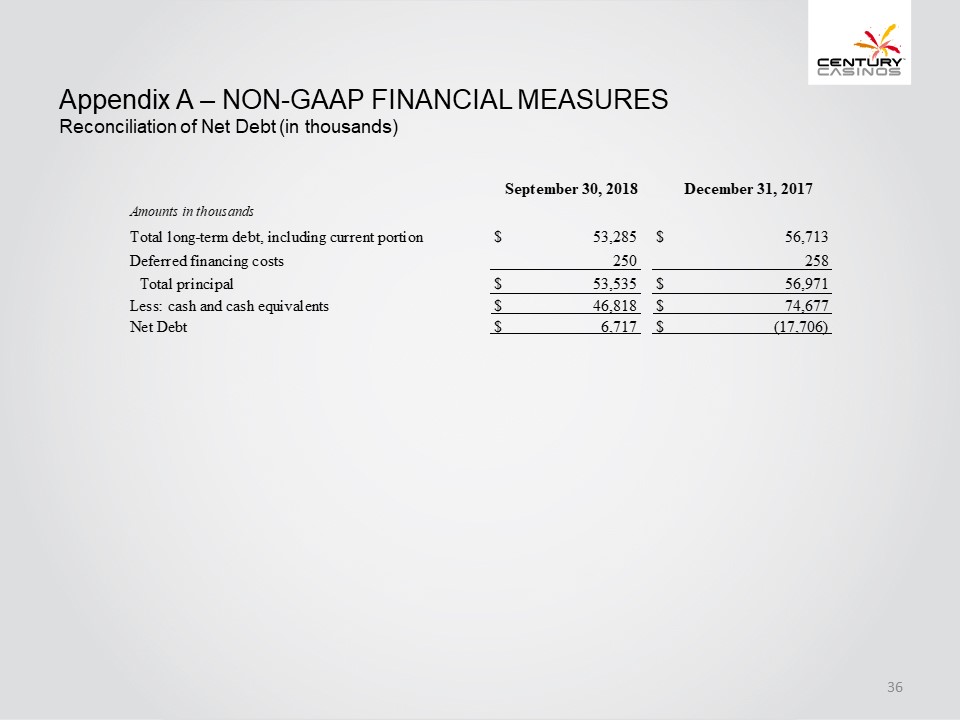
Appendix A – NON-GAAP FINANCIAL MEASURES Reconciliation of Net Debt (in thousands) September 30, 2018 December 31, 2017 Amounts in thousands Total long-term debt, including current portion $53,285 $56,713 Deferred financing costs 250 258 Total principal $53,535 $56,971 Less: cash and cash equivalents $46,818 $74,677 Net Debt $6,717 $(17,706) CENTURY CASINOS 36