Attached files
| file | filename |
|---|---|
| 8-K - 8-K - Garrison Capital Inc. | gars-8k_20181106.htm |
Earnings Presentation Third Quarter ended September 30, 2018 EXHIBIT 99.1
DISCLAIMER Some of the statements in this presentation constitute forward-looking statements, which relate to future events or our future performance or financial condition. The forward-looking statements contained in this presentation involve risks and uncertainties, including statements as to: our future operating results; changes in political, economic or industry conditions, the interest rate environment or conditions affecting the financial and capital markets, which could result in changes to the value of our assets; our business prospects and the prospects of our current and prospective portfolio companies; the impact of investments that we expect to make; the impact of increased competition; our contractual arrangements and relationships with third parties; the dependence of our future success on the general economy, including general economic trends, and its impact on the industries in which we invest; the ability of our portfolio companies to achieve their objectives; the relative and absolute performance of our investment adviser, including in identifying suitable investments for us; our expected financings and investments; the adequacy of our cash resources and working capital; our ability to make distributions to our stockholders; the effects of legislation and regulations and changes thereto; the timing of cash flows, if any, from the operations of our prospective portfolio companies; and the impact of future acquisitions and divestitures. We use words such as “anticipates,” “believes,” “expects,” “intends” and similar expressions to identify forward-looking statements. Actual results could differ materially from those implied or expressed in our forward-looking statements for any reason, and future results could differ materially from historical performance. We have based the forward-looking statements included in this presentation on information available to us on the date of this presentation, and we assume no obligation to update any such forward-looking statements. Although we undertake no obligation to revise or update any forward-looking statements, whether as a result of new information, future events or otherwise, you are advised to consult any additional disclosures that we may make directly to you or through reports that we have filed or in the future may file with the U.S. Securities and Exchange Commission, including annual reports on Form 10-K, quarterly reports on Form 10-Q and current reports on Form 8-K.
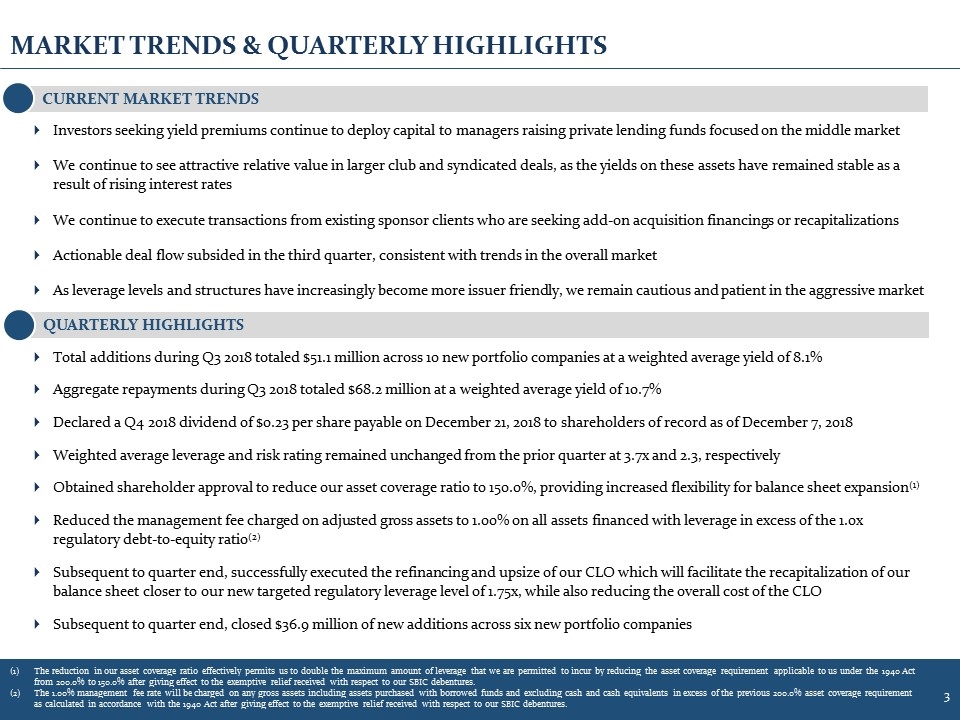
MARKET TRENDS & QUARTERLY HIGHLIGHTS Investors seeking yield premiums continue to deploy capital to managers raising private lending funds focused on the middle market We continue to see attractive relative value in larger club and syndicated deals, as the yields on these assets have remained stable as a result of rising interest rates We continue to execute transactions from existing sponsor clients who are seeking add-on acquisition financings or recapitalizations Actionable deal flow subsided in the third quarter, consistent with trends in the overall market As leverage levels and structures have increasingly become more issuer friendly, we remain cautious and patient in the aggressive market CURRENT MARKET TRENDS QUARTERLY HIGHLIGHTS Total additions during Q3 2018 totaled $51.1 million across 10 new portfolio companies at a weighted average yield of 8.1% Aggregate repayments during Q3 2018 totaled $68.2 million at a weighted average yield of 10.7% Declared a Q4 2018 dividend of $0.23 per share payable on December 21, 2018 to shareholders of record as of December 7, 2018 Weighted average leverage and risk rating remained unchanged from the prior quarter at 3.7x and 2.3, respectively Obtained shareholder approval to reduce our asset coverage ratio to 150.0%, providing increased flexibility for balance sheet expansion(1) Reduced the management fee charged on adjusted gross assets to 1.00% on all assets financed with leverage in excess of the 1.0x regulatory debt-to-equity ratio(2) Subsequent to quarter end, successfully executed the refinancing and upsize of our CLO which will facilitate the recapitalization of our balance sheet closer to our new targeted regulatory leverage level of 1.75x, while also reducing the overall cost of the CLO Subsequent to quarter end, closed $36.9 million of new additions across six new portfolio companies The reduction in our asset coverage ratio effectively permits us to double the maximum amount of leverage that we are permitted to incur by reducing the asset coverage requirement applicable to us under the 1940 Act from 200.0% to 150.0% after giving effect to the exemptive relief received with respect to our SBIC debentures. The 1.00% management fee rate will be charged on any gross assets including assets purchased with borrowed funds and excluding cash and cash equivalents in excess of the previous 200.0% asset coverage requirement as calculated in accordance with the 1940 Act after giving effect to the exemptive relief received with respect to our SBIC debentures.
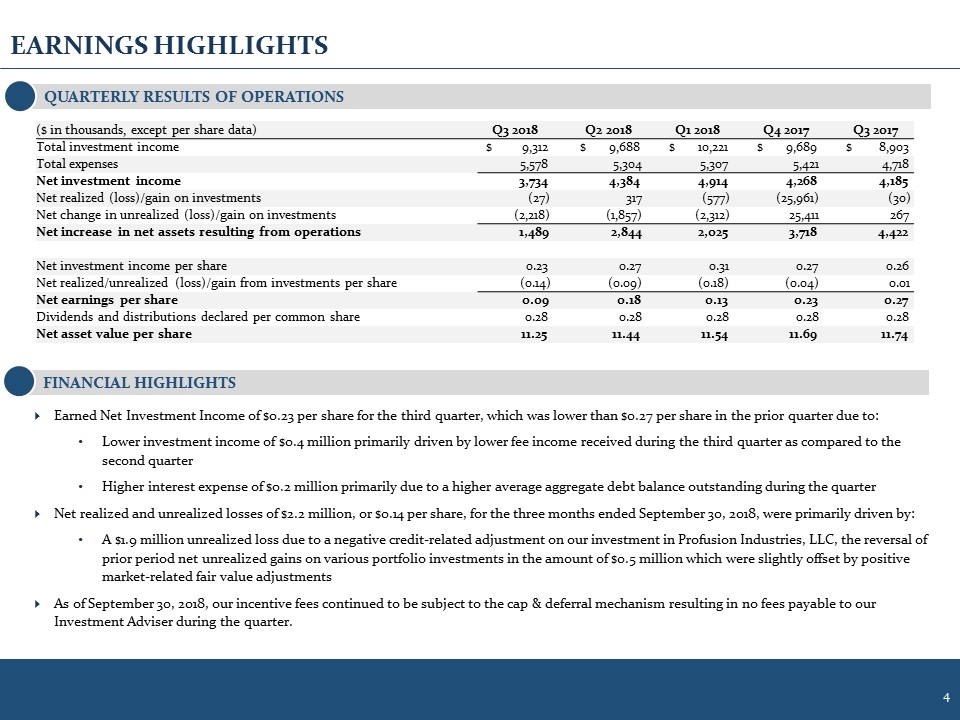
EARNINGS HIGHLIGHTS FINANCIAL HIGHLIGHTS Earned Net Investment Income of $0.23 per share for the third quarter, which was lower than $0.27 per share in the prior quarter due to: Lower investment income of $0.4 million primarily driven by lower fee income received during the third quarter as compared to the second quarter Higher interest expense of $0.2 million primarily due to a higher average aggregate debt balance outstanding during the quarter Net realized and unrealized losses of $2.2 million, or $0.14 per share, for the three months ended September 30, 2018, were primarily driven by: A $1.9 million unrealized loss due to a negative credit-related adjustment on our investment in Profusion Industries, LLC, the reversal of prior period net unrealized gains on various portfolio investments in the amount of $0.5 million which were slightly offset by positive market-related fair value adjustments As of September 30, 2018, our incentive fees continued to be subject to the cap & deferral mechanism resulting in no fees payable to our Investment Adviser during the quarter. QUARTERLY RESULTS OF OPERATIONS ($ in thousands, except per share data) Q3 2018 Q2 2018 Q1 2018 Q4 2017 Q3 2017 Total investment income $ 9,312 $ 9,688 $ 10,221 $ 9,689 $ 8,903 Total expenses 5,578 5,304 5,307 5,421 4,718 Net investment income 3,734 4,384 4,914 4,268 4,185 Net realized (loss)/gain on investments (27) 317 (577) (25,961) (30) Net change in unrealized (loss)/gain on investments (2,218) (1,857) (2,312) 25,411 267 Net increase in net assets resulting from operations 1,489 2,844 2,025 3,718 4,422 Net investment income per share 0.23 0.27 0.31 0.27 0.26 Net realized/unrealized (loss)/gain from investments per share (0.14) (0.09) (0.18) (0.04) 0.01 Net earnings per share 0.09 0.18 0.13 0.23 0.27 Dividends and distributions declared per common share 0.28 0.28 0.28 0.28 0.28 Net asset value per share 11.25 11.44 11.54 11.69 11.74
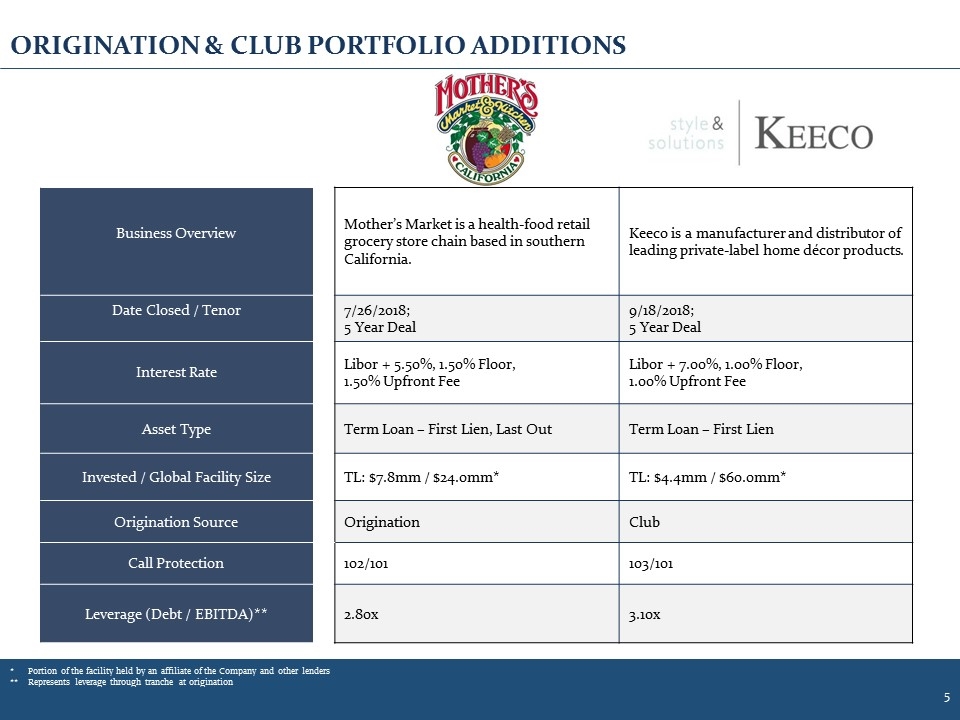
ORIGINATION & CLUB PORTFOLIO ADDITIONS Business Overview Mother’s Market is a health-food retail grocery store chain based in southern California. Keeco is a manufacturer and distributor of leading private-label home décor products. Date Closed / Tenor 7/26/2018; 5 Year Deal 9/18/2018; 5 Year Deal Interest Rate Libor + 5.50%, 1.50% Floor, 1.50% Upfront Fee Libor + 7.00%, 1.00% Floor, 1.00% Upfront Fee Asset Type Term Loan – First Lien, Last Out Term Loan – First Lien Invested / Global Facility Size TL: $7.8mm / $24.0mm* TL: $4.4mm / $60.0mm* Origination Source Origination Club Call Protection 102/101 103/101 Leverage (Debt / EBITDA)** 2.80x 3.10x *Portion of the facility held by an affiliate of the Company and other lenders ** Represents leverage through tranche at origination
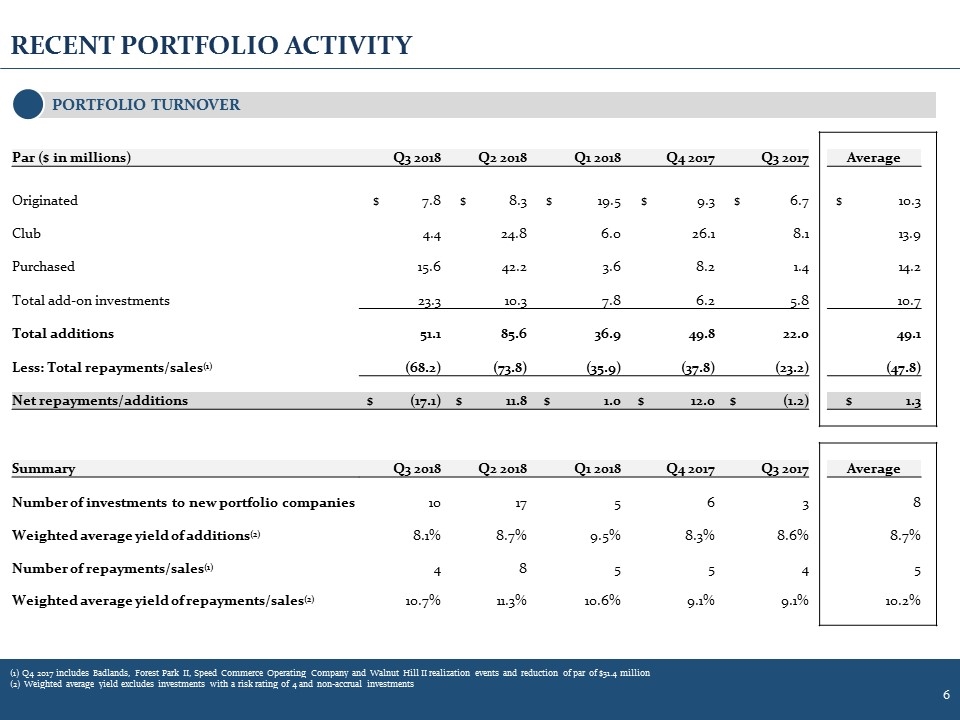
RECENT PORTFOLIO ACTIVITY (1) Q4 2017 includes Badlands, Forest Park II, Speed Commerce Operating Company and Walnut Hill II realization events and reduction of par of $31.4 million (2) Weighted average yield excludes investments with a risk rating of 4 and non-accrual investments PORTFOLIO TURNOVER Par ($ in millions) Q3 2018 Q2 2018 Q1 2018 Q4 2017 Q3 2017 Average Originated $ 7.8 $ 8.3 $ 19.5 $ 9.3 $ 6.7 $ 10.3 Club 4.4 24.8 6.0 26.1 8.1 13.9 Purchased 15.6 42.2 3.6 8.2 1.4 14.2 Total add-on investments 23.3 10.3 7.8 6.2 5.8 10.7 Total additions 51.1 85.6 36.9 49.8 22.0 49.1 Less: Total repayments/sales(1) (68.2) (73.8) (35.9) (37.8) (23.2) (47.8) Net repayments/additions $ (17.1) $ 11.8 $ 1.0 $ 12.0 $ (1.2) $ 1.3 Summary Q3 2018 Q2 2018 Q1 2018 Q4 2017 Q3 2017 Average Number of investments to new portfolio companies 10 17 5 6 3 8 Weighted average yield of additions(2) 8.1% 8.7% 9.5% 8.3% 8.6% 8.7% Number of repayments/sales(1) 4 8 5 5 4 5 Weighted average yield of repayments/sales(2) 10.7% 11.3% 10.6% 9.1% 9.1% 10.2%
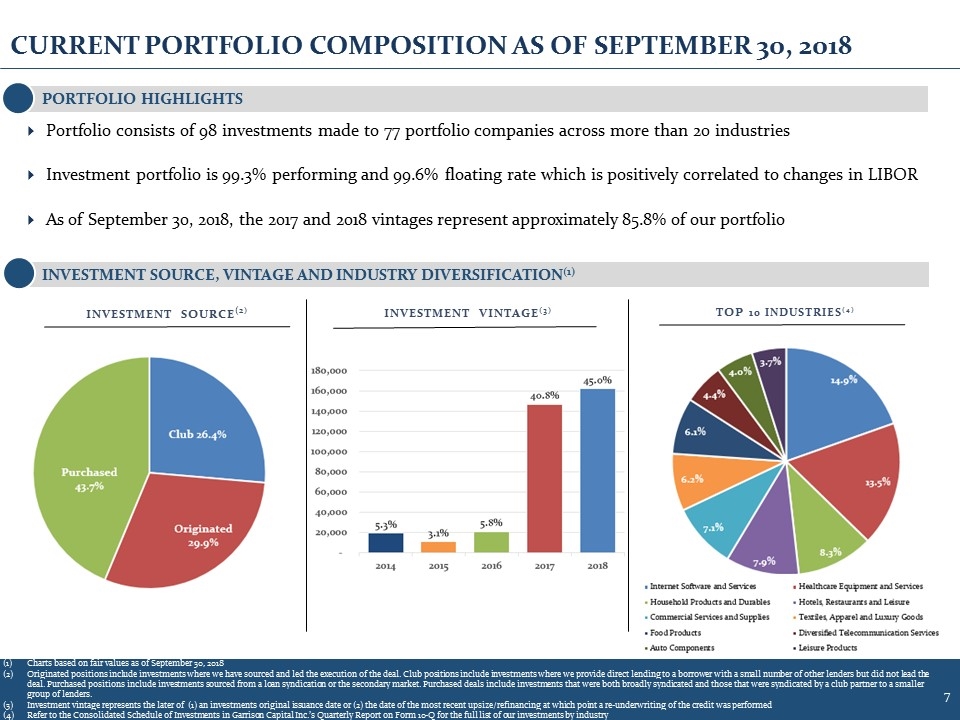
CURRENT PORTFOLIO COMPOSITION AS OF SEPTEMBER 30, 2018 Portfolio consists of 98 investments made to 77 portfolio companies across more than 20 industries Investment portfolio is 99.3% performing and 99.6% floating rate which is positively correlated to changes in LIBOR As of September 30, 2018, the 2017 and 2018 vintages represent approximately 85.8% of our portfolio INVESTMENT VINTAGE(3) PORTFOLIO HIGHLIGHTS INVESTMENT SOURCE, VINTAGE AND INDUSTRY DIVERSIFICATION(1) TOP 10 INDUSTRIES(4) Charts based on fair values as of September 30, 2018 Originated positions include investments where we have sourced and led the execution of the deal. Club positions include investments where we provide direct lending to a borrower with a small number of other lenders but did not lead the deal. Purchased positions include investments sourced from a loan syndication or the secondary market. Purchased deals include investments that were both broadly syndicated and those that were syndicated by a club partner to a smaller group of lenders. Investment vintage represents the later of (1) an investments original issuance date or (2) the date of the most recent upsize/refinancing at which point a re-underwriting of the credit was performed Refer to the Consolidated Schedule of Investments in Garrison Capital Inc.’s Quarterly Report on Form 10-Q for the full list of our investments by industry INVESTMENT SOURCE(2)
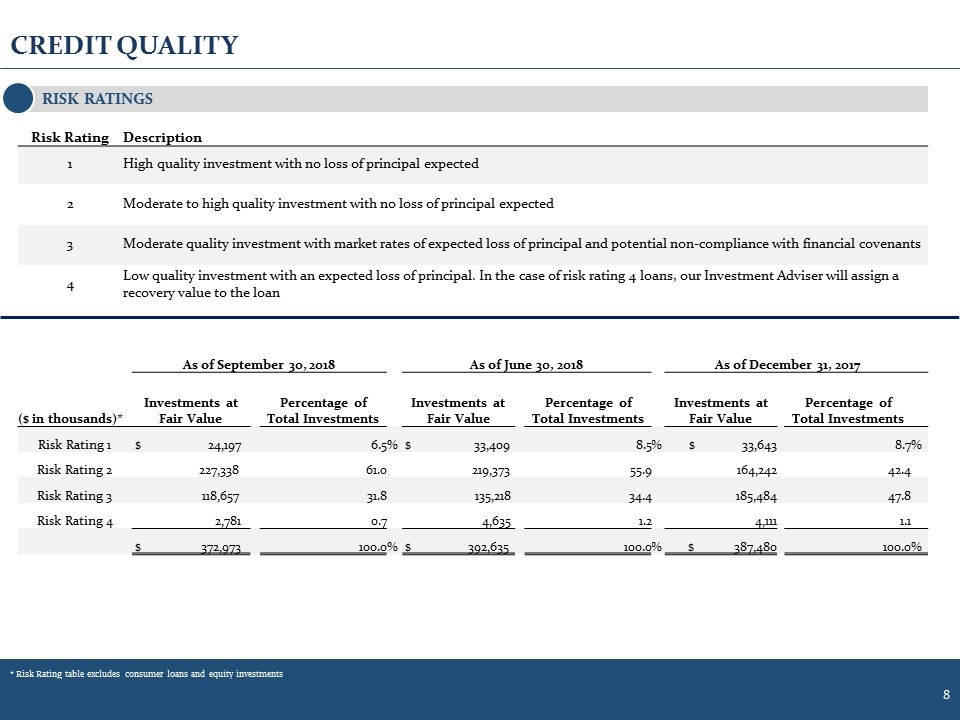
CREDIT QUALITY RISK RATINGS * Risk Rating table excludes consumer loans and equity investments As of September 30, 2018 As of June 30, 2018 As of December 31, 2017 ($ in thousands)* Investments at Fair Value Percentage of Total Investments Investments at Fair Value Percentage of Total Investments Investments at Fair Value Percentage of Total Investments Risk Rating 1 $ 24,197 6.5 % $ 33,409 8.5 % $ 33,643 8.7 % Risk Rating 2 227,338 61.0 219,373 55.9 164,242 42.4 Risk Rating 3 118,657 31.8 135,218 34.4 185,484 47.8 Risk Rating 4 2,781 0.7 4,635 1.2 4,111 1.1 $ 372,973 100.0 % $ 392,635 100.0 % $ 387,480 100.0 % Risk Rating Description 1 High quality investment with no loss of principal expected 2 Moderate to high quality investment with no loss of principal expected 3 Moderate quality investment with market rates of expected loss of principal and potential non-compliance with financial covenants 4 Low quality investment with an expected loss of principal. In the case of risk rating 4 loans, our Investment Adviser will assign a recovery value to the loan
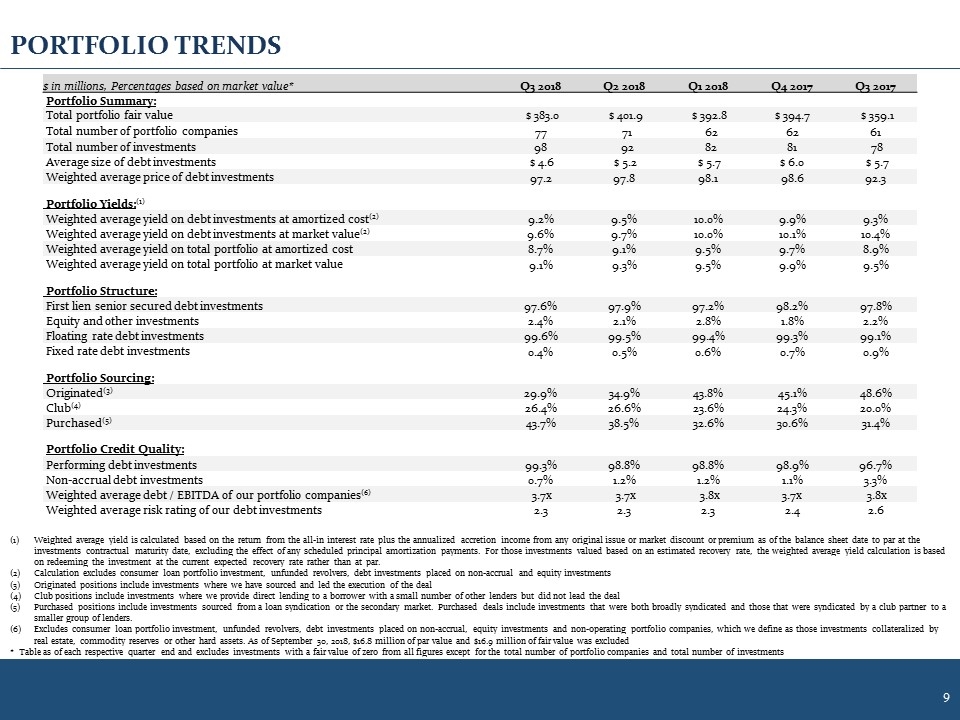
Weighted average yield is calculated based on the return from the all-in interest rate plus the annualized accretion income from any original issue or market discount or premium as of the balance sheet date to par at the investments contractual maturity date, excluding the effect of any scheduled principal amortization payments. For those investments valued based on an estimated recovery rate, the weighted average yield calculation is based on redeeming the investment at the current expected recovery rate rather than at par. Calculation excludes consumer loan portfolio investment, unfunded revolvers, debt investments placed on non-accrual and equity investments Originated positions include investments where we have sourced and led the execution of the deal Club positions include investments where we provide direct lending to a borrower with a small number of other lenders but did not lead the deal Purchased positions include investments sourced from a loan syndication or the secondary market. Purchased deals include investments that were both broadly syndicated and those that were syndicated by a club partner to a smaller group of lenders. Excludes consumer loan portfolio investment, unfunded revolvers, debt investments placed on non-accrual, equity investments and non-operating portfolio companies, which we define as those investments collateralized by real estate, commodity reserves or other hard assets. As of September 30, 2018, $16.8 million of par value and $16.9 million of fair value was excluded * Table as of each respective quarter end and excludes investments with a fair value of zero from all figures except for the total number of portfolio companies and total number of investments PORTFOLIO TRENDS $ in millions, Percentages based on market value* Q3 2018 Q2 2018 Q1 2018 Q4 2017 Q3 2017 Portfolio Summary: Total portfolio fair value $ 383.0 $ 401.9 $ 392.8 $ 394.7 $ 359.1 Total number of portfolio companies 77 71 62 62 61 Total number of investments 98 92 82 81 78 Average size of debt investments $ 4.6 $ 5.2 $ 5.7 $ 6.0 $ 5.7 Weighted average price of debt investments 97.2 97.8 98.1 98.6 92.3 Portfolio Yields:(1) Weighted average yield on debt investments at amortized cost(2) 9.2% 9.5% 10.0% 9.9% 9.3% Weighted average yield on debt investments at market value(2) 9.6% 9.7% 10.0% 10.1% 10.4% Weighted average yield on total portfolio at amortized cost 8.7% 9.1% 9.5% 9.7% 8.9% Weighted average yield on total portfolio at market value 9.1% 9.3% 9.5% 9.9% 9.5% Portfolio Structure: First lien senior secured debt investments 97.6% 97.9% 97.2% 98.2% 97.8% Equity and other investments 2.4% 2.1% 2.8% 1.8% 2.2% Floating rate debt investments 99.6% 99.5% 99.4% 99.3% 99.1% Fixed rate debt investments 0.4% 0.5% 0.6% 0.7% 0.9% Portfolio Sourcing: Originated(3) 29.9% 34.9% 43.8% 45.1% 48.6% Club(4) 26.4% 26.6% 23.6% 24.3% 20.0% Purchased(5) 43.7% 38.5% 32.6% 30.6% 31.4% Portfolio Credit Quality: Performing debt investments 99.3% 98.8% 98.8% 98.9% 96.7% Non-accrual debt investments 0.7% 1.2% 1.2% 1.1% 3.3% Weighted average debt / EBITDA of our portfolio companies(6) 3.7x 3.7x 3.8x 3.7x 3.8x Weighted average risk rating of our debt investments 2.3 2.3 2.3 2.4 2.6
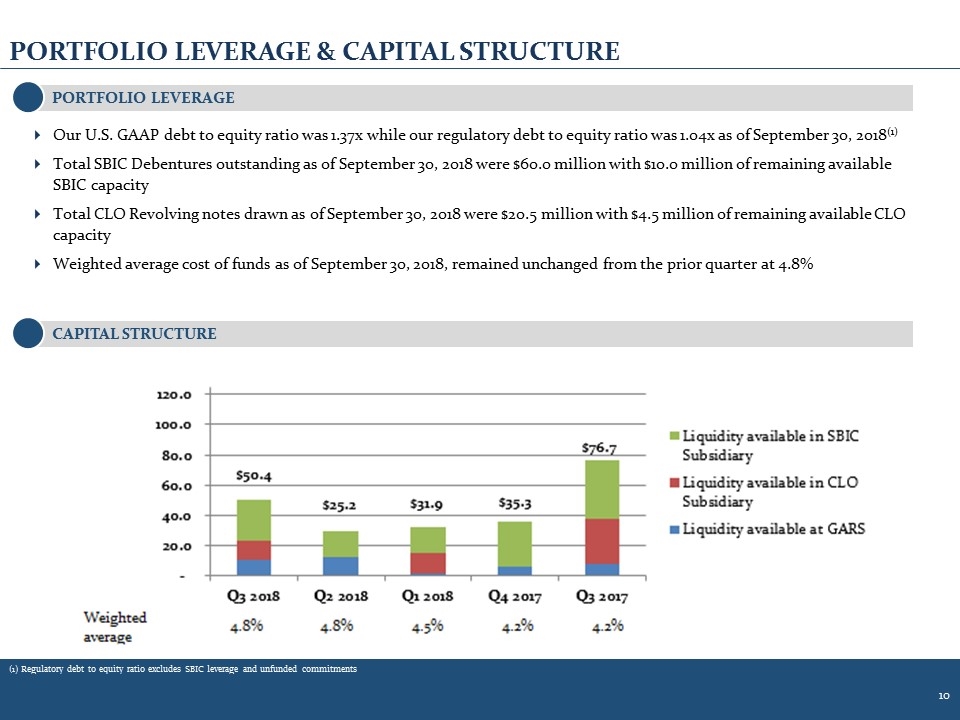
Our U.S. GAAP debt to equity ratio was 1.37x while our regulatory debt to equity ratio was 1.04x as of September 30, 2018(1) Total SBIC Debentures outstanding as of September 30, 2018 were $60.0 million with $10.0 million of remaining available SBIC capacity Total CLO Revolving notes drawn as of September 30, 2018 were $20.5 million with $4.5 million of remaining available CLO capacity Weighted average cost of funds as of September 30, 2018, remained unchanged from the prior quarter at 4.8% PORTFOLIO LEVERAGE & CAPITAL STRUCTURE CAPITAL STRUCTURE PORTFOLIO LEVERAGE (1) Regulatory debt to equity ratio excludes SBIC leverage and unfunded commitments
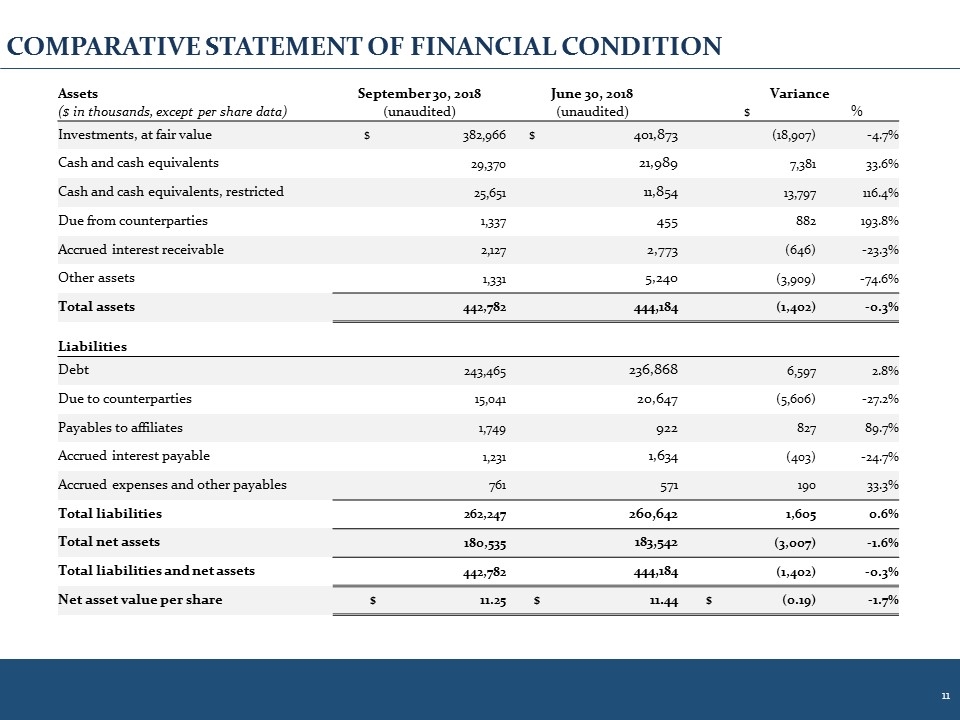
Assets September 30, 2018 June 30, 2018 Variance ($ in thousands, except per share data) (unaudited) (unaudited) $ % Investments, at fair value $ 382,966 $ 401,873 (18,907) -4.7% Cash and cash equivalents 29,370 21,989 7,381 33.6% Cash and cash equivalents, restricted 25,651 11,854 13,797 116.4% Due from counterparties 1,337 455 882 193.8% Accrued interest receivable 2,127 2,773 (646) -23.3% Other assets 1,331 5,240 (3,909) -74.6% Total assets 442,782 444,184 (1,402) -0.3% Liabilities Debt 243,465 236,868 6,597 2.8% Due to counterparties 15,041 20,647 (5,606) -27.2% Payables to affiliates 1,749 922 827 89.7% Accrued interest payable 1,231 1,634 (403) -24.7% Accrued expenses and other payables 761 571 190 33.3% Total liabilities 262,247 260,642 1,605 0.6% Total net assets 180,535 183,542 (3,007) -1.6% Total liabilities and net assets 442,782 444,184 (1,402) -0.3% Net asset value per share $ 11.25 $ 11.44 $ (0.19) -1.7% COMPARATIVE STATEMENT OF FINANCIAL CONDITION
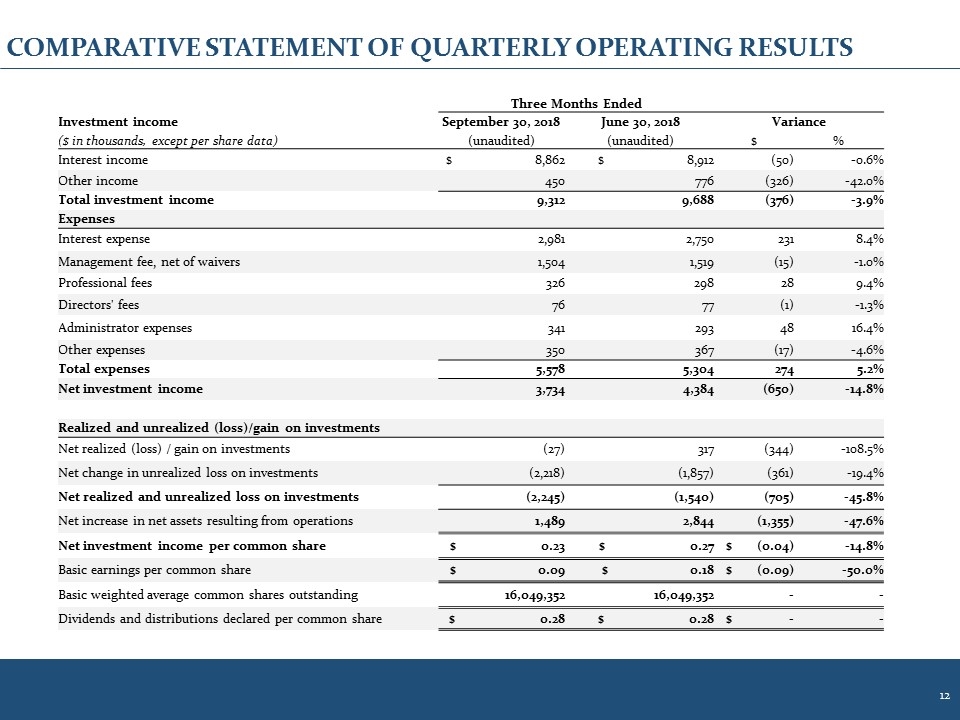
Three Months Ended Investment income September 30, 2018 June 30, 2018 Variance ($ in thousands, except per share data) (unaudited) (unaudited) $ % Interest income $ 8,862 $ 8,912 (50) -0.6% Other income 450 776 (326) -42.0% Total investment income 9,312 9,688 (376) -3.9% Expenses Interest expense 2,981 2,750 231 8.4% Management fee, net of waivers 1,504 1,519 (15) -1.0% Professional fees 326 298 28 9.4% Directors' fees 76 77 (1) -1.3% Administrator expenses 341 293 48 16.4% Other expenses 350 367 (17) -4.6% Total expenses 5,578 5,304 274 5.2% Net investment income 3,734 4,384 (650) -14.8% Realized and unrealized (loss)/gain on investments Net realized (loss) / gain on investments (27) 317 (344) -108.5% Net change in unrealized loss on investments (2,218) (1,857) (361) -19.4% Net realized and unrealized loss on investments (2,245) (1,540) (705) -45.8% Net increase in net assets resulting from operations 1,489 2,844 (1,355) -47.6% Net investment income per common share $ 0.23 $ 0.27 $ (0.04) -14.8% Basic earnings per common share $ 0.09 $ 0.18 $ (0.09) -50.0% Basic weighted average common shares outstanding 16,049,352 16,049,352 - - Dividends and distributions declared per common share $ 0.28 $ 0.28 $ - - COMPARATIVE STATEMENT OF QUARTERLY OPERATING RESULTS
GARRISON CAPITAL INC. 1290 Avenue of the Americas, 9th Floor New York, NY 10104 Tel: 212-372-9590 Fax: 212-372-9525 Contact Information CONTACT INFORMATION
