Attached files
| file | filename |
|---|---|
| EX-99.1 - EXHIBIT 99.1 - FIRST BANCSHARES INC /MS/ | tv506528_ex99-1.htm |
| EX-2.1 - EXHIBIT 2.1 - FIRST BANCSHARES INC /MS/ | tv506528_ex2-1.htm |
| 8-K - FORM 8-K - FIRST BANCSHARES INC /MS/ | tv506528_8k.htm |
Exhibit 99.2

November 6, 2018 Acquisition of FPB Financial Corp. “Growing in the Gulf South” Filed by The First Bancshares, Inc. Pursuant to Rule 425 under the Securities Act of 1933 Subject Company: The First Bancshares, Inc. Commission File No.: 000 - 22507

2 PARTICIPANTS IN THE TRANSACTION FBMS, FPB Financial Corp . (“FPBF”) and certain of their respective directors and executive officers may be deemed to be participants in the solicitation of proxies from the shareholders of FPBF in connection with the proposed transaction . Information about the directors and executive officers of FBMS may be found in the definitive proxy statement of FBMS filed with the SEC on April 11 , 2018 . Additional information regarding the interests of these participants and the directors and executive officers of FPBF will also be included in the proxy statement/prospectus regarding the proposed transaction when it becomes available . The definitive proxy statement can be obtained free of charge from the sources described above . This communication does not constitute an offer to sell or the solicitation of an offer to buy any securities or a solicitation of any vote or approval . ABOUT THE FIRST BANCSHARES, INC . The First Bancshares, Inc . (“FBMS” or the “Company”), headquartered in Hattiesburg, Mississippi, is the parent company of The First, A National Banking Association . Founded in 1996 , The First has operations in Mississippi, Louisiana, Alabama, Florida and Georgia . The Company’s stock is traded on NASDAQ Global Market under the symbol FBMS . Contact : Chandra Kidd, Corporate Secretary . NON - GAAP FINANCIAL MEASURES FBMS reports its results in accordance with United States generally accepted accounting principles (“GAAP”) . However, management believes that certain non - GAAP performance measures used in managing the business may provide meaningful information about underlying trends in its business . Non - GAAP financial measures should be viewed in addition to, and not as an alternative for, FBMS’ reported results prepared in accordance with GAAP . ADDITIONAL INFORMATION ABOUT THE MERGER & WHERE TO FIND IT In connection with the proposed merger of FBMS and FPBF, FBMS will file with the Securities and Exchange Commission (the “SEC”) a registration statement on Form S - 4 that will include a proxy statement of FPBF and a prospectus of FBMS, as well as other relevant documents concerning the proposed transaction . This communication does not constitute an offer to sell or the solicitation of an offer to buy any securities or a solicitation of any vote or approval . WE URGE INVESTORS AND SECURITY HOLDERS TO READ THE REGISTRATION STATEMENT ON FORM S - 4 , THE PROXY STATEMENT/PROSPECTUS INCLUDED WITHIN THE REGISTRATION STATEMENT ON FORM S - 4 AND ANY OTHER RELEVANT DOCUMENTS WHEN FILED WITH THE SEC IN CONNECTION WITH THE PROPOSED MERGER BECAUSE THEY WILL CONTAIN IMPORTANT INFORMATION ABOUT FBMS, FPBF AND THE PROPOSED MERGER . The proxy statement/prospectus will be sent to the shareholders of FPBF seeking the required shareholder approvals . Investors and security holders will be able to obtain free copies of the registration statement on Form S - 4 and the related proxy statement/prospectus, when filed, as well as other documents filed with the SEC by FBMS through the web site maintained by the SEC at www . sec . gov . Documents filed with the SEC by FBMS will also be available free of charge by directing a written request to The First Bancshares, Inc . , 6480 U . S . Highway 98 West, Hattiesburg, Mississippi 39402 Attn : Chandra Kidd, Corporate Secretary . FBMS’ telephone number is ( 601 ) 268 - 8998 . Safe Harbor
3 Caution Regarding Forward Looking Statements This presentation contains “forward - looking statements” as defined in the Private Securities Litigation Reform Act of 1995 , and is intended to be protected by the safe harbor provided by the same . These statements are subject to numerous risks and uncertainties . These risks and uncertainties include, but are not limited to, the following : competitive pressures among financial institutions increasing significantly ; economic conditions, either nationally or locally, in areas in which FBMS conducts operations being less favorable than expected ; legislation or regulatory changes which adversely affect the ability of the consolidated company to conduct business combinations or new operations ; and risks related to the proposed acquisition of FPB Financial Corp . including the risk that the proposed transaction does not close when expected or at all because required regulatory or other approvals and other conditions to closing are not received or satisfied on a timely basis or at all, the terms of the proposed transaction may need to be modified to satisfy such approvals or conditions, and the risk that anticipated benefits from the proposed transaction are not realized in the time frame anticipated or at all as a result of changes in general economic and market conditions or the inaccuracy of our transaction assumptions . For additional information concerning factors that could cause actual conditions, events or results to materially differ from those described in the forward - looking statements, please refer to the factors set forth under the headings “Risk Factors” and “Management’s Discussion and Analysis of Financial Condition and Results of Operations” in FBMS’ Annual Report on Form 10 - K for the year ended December 31 , 2017 , which is available online at www . sec . gov . No assurances can be given that any of the events anticipated by the forward - looking statements will occur, or if any of them do so, what impact they will have on the results of operations or financial condition of FBMS or FPBF . FBMS disclaims any obligation to update any factors or to announce publicly the result of revisions to any forward - looking statements included herein to reflect future events or developments, except to the extent required by law .

4 Transaction First Bancshares, Inc. (“FBMS”) acquires 100% of FPB Financial Corp.’s (“FPBF”) outstanding common stock Merger Consideration 100% stock consideration per share of FPBF common stock determined by the exchange ratio of 0.8300 Indicative Price Per Share (1) $30.83 Total Merger Value (1)(2) $86.1 million at announcement Total Consideration Mix (1)(2) 96.8% stock / 3.2% cash Price Protection (3) Fixed exchange ratio within 11.25% upside and downside price protection; floating exchange ratio if price protection is triggered Implied Pricing Multiples at Announcement (4) Price / Tangible Book Value: 190% Price / LTM EPS: 21.0x Price / YTD 2018 EPS (Annualized): 16.4x Price / Est. 2019 EPS w/ Cost Saves: 9.1x (5) Core Deposit Premium: 14.2% (6) Required Approvals Customary regulatory approvals and FPBF shareholder approval Expected Closing First quarter 2019 (1) Based on FBMS closing price of $37.14 as of November 5, 2018 (2) Based on 2,703,943 outstanding shares of FPBF common stock; Total merger value assumes all 198,275 warrants with a weighted average strike price of $16.75 per share are cashed out at $30.83 per share (3) Upper and lower price collars are set based on a maximum purchase price of $36.01 per share and minimum purchase price of $28 .7 3 per share (4) Based on per share values; Financial data as of September 30, 2018 (5) Assumes 100% of projected annual cost savings are realized, tax - effected at a 25.0% effective corporate tax rate (6) Core deposits defined as total deposits less time deposit accounts greater than $100,000 Source : S&P Global Market Intelligence; Company documents Transaction Terms

5 Financial Highlights General Corporate Information Overview of FPB Financial Corp. (1) Regulatory capital ratios reflect bank - level Source : S&P Global Market Intelligence; Company documents ▪ Holding company for Florida Parishes Bank • Bank founded in 1922 • FPBF founded in 1999 ▪ Headquartered in Hammond, Louisiana with all seven branches located in - state ▪ Branches in Hammond (Tangipahoa Parish), Metairie (Jefferson Parish), Covington (St. Tammany Parish), Mandeville ( St. Tammany Parish ), Ponchatoula (Tangipahoa Parish ) and Amite (Tangipahoa Parish ) ▪ 90 full time employees ▪ Led by Fritz Anderson II (Chairman & CEO), Ronnie Fugarino (President & Director) and Derek Shants (CFO & COO) YTD Ended ($ in thousands, except per share values) 12/31/2016 12/31/2017 9/30/2018 Balance Sheet Total Assets $299,516 $346,161 $382,659 Gross Loans $163,936 $221,377 $243,062 Total Deposits $253,399 $290,563 $317,719 Loans / Deposits 64.69% 76.19% 76.50% Total Equity (100% Tangible Common) $31,122 $42,112 $43,977 Capital Adequacy Tangible Equity / Tangible Assets 10.39% 12.17% 11.49% Tier 1 Leverage (1) 10.02% 9.70% 10.62% Tier 1 Capital (1) 15.65% 14.21% 16.30% Risk-Based Capital (1) 16.91% 15.47% 17.56% Performance Measures Yield on Loans 6.86% 6.53% 6.43% Yield on Interest-earning Assets 5.13% 4.83% 5.09% Cost of Deposits 0.39% 0.46% 0.56% Cost of Interest-bearing Liabilities 0.64% 0.70% 0.87% Net Interest Margin 4.67% 4.34% 4.48% Noninterest Income / Avg. Assets 1.35% 1.09% 0.87% Noninterest Expense / Avg. Assets 4.05% 3.94% 2.31% Efficiency Ratio 72.65% 77.43% 61.18% ROAA 1.02% 0.40% 1.46% ROAE 9.07% 3.24% 12.53% Net Income $2,642 $1,282 $4,034 For the Twelve Months Ended
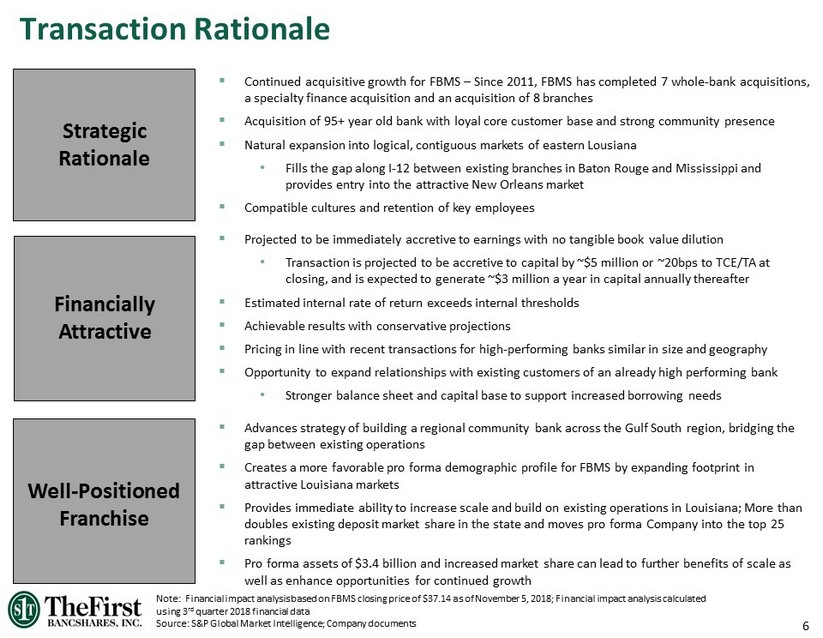
6 Note : Financial impact analysis based on FBMS closing price of $37.14 as of November 5, 2018; Financial impact analysis calculated using 3 rd quarter 2018 financial data Source : S&P Global Market Intelligence; Company documents Transaction Rationale ▪ Continued acquisitive growth for FBMS – Since 2011, FBMS has completed 7 whole - bank acquisitions, a specialty finance acquisition and an acquisition of 8 branches ▪ Acquisition of 95+ year old bank with loyal core customer base and strong community presence ▪ Natural expansion into logical, contiguous markets of eastern Lousiana • Fills the gap along I - 12 between existing branches in Baton Rouge and Mississippi and provides entry into the attractive New Orleans market ▪ Compatible cultures and retention of key employees Strategic Rationale ▪ Projected to be immediately accretive to earnings with no tangible book value dilution • Transaction is projected to be accretive to capital by ~$5 million or ~20bps to TCE/TA at closing, and is expected to generate ~$3 million a year in capital annually thereafte r ▪ Estimated internal rate of return exceeds internal thresholds ▪ Achievable results with conservative projections ▪ Pricing in line with recent transactions for high - performing banks similar in size and geography ▪ Opportunity to expand relationships with existing customers of an already high performing bank • Stronger balance sheet and capital base to support increased borrowing needs Financially Attractive Well - Positioned Franchise ▪ Advances strategy of building a regional community bank across the Gulf South region , bridging the gap between existing operations ▪ Creates a more favorable pro forma demographic profile for FBMS by expanding footprint in attractive Louisiana markets ▪ Provides immediate ability to increase scale and build on existing operations in Louisiana; More than doubles existing deposit market share in the state and moves pro forma Company into the top 25 rankings ▪ Pro forma assets of $ 3.4 billion and increased market share can lead to further benefits of scale as well as enhance opportunities for continued growth

7 Continued Growth in the Gulf South Total Assets: $ 3.4 Total Loans: $ 2.3 Total Deposits: $ 2.8 Gulf South Footprint FBMS 2019 EPS Accretion (Partial Year) ~2.6% 2020 EPS Accretion ~4.5% TBV Payback Period Accretive Day 1 Internal Rate of Return > 20% Pro Forma 2020E ROAA > 1.4% TCE/TA > 8.5% Pro Forma Leverage > 9.0% Pro Forma Tier 1 RBC > 11.5% Pro Forma TRBC > 14.5% Key Transaction Impacts ( 1) Note : Financial impact analysis based on FBMS closing price of $37.14 as of November 5, 2018; Financial impact and pro forma analysis calculated using 3 rd quarter 2018 financial data (1) Estimated impacts provided solely for illustrative purposes Source: S&P Global Market Intelligence; Company documents Consistent with expansion strategy first developed in 2009 ▪ Focused on expansion in MS, AL, LA and FL ▪ Compatible cultures, strong relationships with management team and retention of key employees ▪ Strong earnings momentum and balance sheet supported by simple capital structure Pro Forma Highlights ($Billion) FPBF Locations FBMS Locations Augusta Jacksonville Tampa Miami Mobile New Orleans Shreveport Jackson Montgomery Birmingham Atlanta Tallahassee Columbus Orlando Alabama Georgia Mississippi Louisiana Florida Florence Starkville Huntsville Panama City Dothan Albany Baton Rouge

8 ▪ All 7 FPBF branches are located within 30 miles of an FBMS branch; 3 FPBF branches are within 25 miles of FBMS branches Bridging an Attractive Footprint Source : S&P Global Market Intelligence FPBF Locations FBMS Locations

9 Bolstering Presence in Louisiana Investing in Louisiana Pro Forma Deposit Market Share (1) ▪ Louisiana is a state of opportunity with a collection of competitive advantages, including low business operating costs, a skilled workforce and robust infrastructure • R anked #5 in Area Development’s 2017 annual “Top States for Doing Business ” • Home to LED FastStart, the #1 ranked state workforce training program in the nation for the past 8 years in a row ▪ Louisiana’s Coastal Master Plan, a 50 - year blueprint for large - scale restoration and protection of coastal areas, calls for $50 billion to be spent on coastal projects ▪ Primary economic drivers: • Hospitality • Shipping – home to some of the largest ports in the nation • Petrochemical industry • Healthcare (1) Based on regulatory financial data as of June 30, 2018; Includes pending and recently completed M&A transactions Source: S&P Global Market Intelligence; Louisiana Economic Development Rank Institution (ST) Number of Branches Total Deposits in Market ($000) Total Market Share (%) 1 JPMorgan Chase & Co. (NY) 135 17,989,141$ 17.40% 2 Capital One Financial Corp. (VA) 121 17,524,878 16.95% 3 Hancock Whitney Corp. (MS) 110 12,952,562 12.53% 4 IBERIABANK Corp. (LA) 63 7,978,813 7.72% 5 Regions Financial Corp. (AL) 99 7,340,297 7.10% 6 Origin Bancorp Inc. (LA) 21 1,840,250 1.78% 7 Home Bancorp Inc. (LA) 35 1,642,421 1.59% 8 Bus. First Bancshares Inc. (LA) 24 1,600,417 1.55% 9 Red River Bancshares Inc. (LA) 23 1,576,929 1.53% 10 BancorpSouth Bank (MS) 29 1,508,050 1.46% 11 Gulf Coast B&TC (LA) 20 1,465,117 1.42% 12 First Guaranty Bancshares Inc. (LA) 22 1,418,590 1.37% 13 MidSouth Bancorp Inc. (LA) 32 1,330,361 1.29% 14 Investar Holding Corp. (LA) 21 1,231,743 1.19% 15 Pedestal Bancshares Inc. (LA) 24 1,010,447 0.98% 16 CB&T Holding Corp. (LA) 3 865,175 0.84% 17 First Trust Corp. (LA) 12 801,265 0.78% 18 Citizens National Bancshares (LA) 12 792,334 0.77% 19 One American Corp. (LA) 25 765,099 0.74% 20 Sabine Bancshares Inc. (LA) 47 737,100 0.71% 21 Jeff Davis Bancshares Inc. (LA) 23 733,376 0.71% 22 First Federal Bank of LA (LA) 17 629,818 0.61% 23 Financial Corp. of Louisiana (LA) 12 622,466 0.60% 24 Fidelity Bank (LA) 18 606,671 0.59% 25 Pro Forma Company 20 596,973 0.58% 42 FPB Financial Corp. (LA) 7 313,082 0.30% 45 First Bancshares Inc. (MS) 13 283,891 0.27% Remaining 99 Institutions 484 17,800,843 17.2% Total For Institutions In Market 1,452 103,361,136$ 100.0% State of Louisiana

10 Projected 2019 – 2024 Median Household Income Growth (%) Actual 2010 – 2019 Population Growth (%) Projected 2019 – 2024 Population Growth (%) 4.7% 10.7% 2.4% 14.3% 9.4% 3.7% 0.6% 6.6% 0.0% 4.0% 8.0% 12.0% 16.0% FBMS FPBF AL FL GA LA MS USA 2.5% 4.8% 1.5% 6.8% 5.2% 2.0% 0.4% 3.6% 0.0% 2.0% 4.0% 6.0% 8.0% FBMS FPBF AL FL GA LA MS USA Attractive Pro Forma Demographics Note : FBMS and FPBF demographics data weighted by county - level deposits Source: S&P Global Market Intelligence; Louisiana Economic Development ▪ FPBF operates in the Hammond and New Orleans - Metairie MSAs • Both MSAs are ranked top three in the state for actual and projected population growth • Ranked #1 region for “Healthcare Job Growth” in 2017 by U.S. Census Bureau • Hammond is home to Southeastern Louisiana University (~15,000 enrolled) • New Orleans ranked #5 city where “Entrepreneurship is Booming” in 2017 by Entrepreneur magazine • New Orleans ranked #1 in United States for international tourism by the National Travel and Tourism Office ▪ Louisiana has become a substantial hub for digital development • New Orleans edged out 30 other cities to be selected for DXC Technology’s new 2,000 job digital transformation center, the first of its kind in the U.S . 8.3% 7.2% 8.5% 10.3% 10.9% 2.6% 7.0% 8.8% 0.0% 4.0% 8.0% 12.0% 16.0% FBMS FPBF AL FL GA LA MS USA

11 ▪ Acquiring attractive, low - cost deposits in the Hammond and New Orleans - Metairie, Louisiana markets ▪ FPBF’s deposit base is 26.7% noninterest - bearing and consists of 86.9% core deposits (1 ) ▪ Pro forma cost of deposits of 0.52% ▪ FPBF’s loan portfolio is complementary to FBMS’ existing portfolio ▪ Pro forma loan yield of 6.62% (~15bps accretive to MRQ combined FBMS/FMB yield) ▪ Loan / Deposit ratio of 76.5% provides excess liquidity able to be deployed FPBF Historical Cost of Deposits Low Cost Deposits and High Yielding Loans Note : Financial data as of September 30, 2018; Historical loan yields per bank - level regulatory filings (1) Core deposits defined as total deposits less time deposit accounts greater than $100,000 Source: S&P Global Market Intelligence FPBF Historical Yield on Loans 0.39% 0.40% 0.39% 0.39% 0.46% 0.49% 0.48% 0.49% 0.54% 0.64% 0.00% 0.20% 0.40% 0.60% 0.80% 1.00% 6.96% 7.19% 6.87% 6.61% 6.52% 6.57% 6.42% 6.36% 6.55% 6.62% 0.00% 2.00% 4.00% 6.00% 8.00% 10.00%

12 (1) Percentage marks based on September 30, 2018 balances (2) Core deposits defined as total deposits less time deposit accounts greater than $100,000 Source: Internal estimates Transaction Assumptions Estimated Cost Savings ▪ $4.3 million pre - tax savings ▪ 37.5% of estimated FPBF noninterest expense in the first full combined year ▪ Assumes 80% realization in 2019 and 100% per year thereafter Transaction Expenses ▪ $7.8 million in pre - tax transaction expenses ▪ 9.1% of transaction value Credit Mark (1) ▪ $5.1 million pre - tax mark on total loans ▪ ~2.1% on gross loans Fixed Assets Mark (1) ▪ $4.0 million mark up on fixed assets ▪ ~35.9% of net book value Core Deposit Intangible (1)(2 ) ▪ $5.9 million CDI amortized straight - line over 10 years ▪ ~2.1% of core deposits ▪ 25.0% effective tax rate assumed Effective Tax Rate ▪ None modeled, but opportunities exist Revenue Synergies

13 x Experienced in successfully executing and integrating M&A transactions ▪ FBMS management has successfully executed multiple M&A transactions in their recent history ▪ Increases the probability of a smooth integration process for employees and customers ▪ Signed employment contracts with three FPBF executives ▪ Both parties share a common core operating system and regulator, aiding ease of integration x Extensive credit review ▪ Hired reputable third - party to review loans in all product lines, with particular focus on commercial real estate ▪ Analyzed approximately 70% of classified loans, 100 % of total loan relationships over $1.0 million and all loan balances over $870 thousand ▪ Estimated loan mark of approximately $5.1 million pre - tax x Comprehensive operational due diligence performed ▪ Detailed review of business plans, budgets, credit processes, among other aspects of the businesses ▪ In depth evaluation of personnel at both companies to build the most efficient team for the combined company x Pro forma capital ratios will be within regulatory well - capitalized guidelines Experienced Acquirer

14 $- $500 $1,000 $1,500 $2,000 $2,500 $3,000 $3,500 $4,000 2012Y 2013Y 2014Y 2015Y 2016Y 2017Y 1Q2018 2Q2018 2018 YTD PF Total Assets ($ Millions) Building Upon a Proven Track Record Note: Dates are as of transaction close, unless otherwise indicated Source: S&P Global Market Intelligence 4/30/2013 Acquired First Baldwin Bancshares, Inc. 7/1/2014 Acquired BCB Holding Company , Inc. 1/1/2017 Acquired Gulf Coast Community Bank 1/1/2017 Acquired Iberville Bank 10/24/2016 $63.3M Preferred Stock Offering 10/26/2017 $58.4M Common Stock Offering 5/1/2018 $66.0M Subordinated Debt Offering Executing Upon Growth Strategy – Total Assets Growth & Event Timeline 11/6/2018 Announced Acquisition of FPB Financial Corp. 4/1/2018 Acquired Sunshine Financial , Inc. Pro Forma Assets: $3,376 $721 3/22/2013 $20.0M Preferred Stock Offering 3/1/2018 Acquired South West Banc Shares, Inc. 12/14/2015 Acquired Mortgage Connection , LLC 10/31/2018 Acquired FMB Banking Corporation

15 Summary The First Bancshares, Inc.’s acquisition of FPB Financial Corp. represents continued execution on a multi - year strategic plan of building a regional community bank franchise in the Gulf South x Strategic expansion of a well - established footprint in the Louisiana market x Logical play into contiguous markets that bridges the distance gap between existing operations and provides entry into New Orleans x Pro forma company with $3.4 billion in assets x Creates significant growth opportunity through expected retention of proven lending team x Improves profitability outlook with no tangible book value dilution expected x Low risk profile with high familiarity given in - market acquisition x Opportunity for significant cost savings x Attractive pro forma loan and deposit portfolio

16 Appendix

17 Pro Forma Loans Note: Loan composition based on bank - level regulatory filings; Excludes purchase accounting adjustments (1) Includes acquisition of FMB Banking Corporation Source: S&P Global Market Intelligence; Data as of September 30, 2018 Loan Type Balance ($000) % of Total Loan Type Balance ($000) % of Total Loan Type Balance ($000) % of Total Construction & Land Dev. 268,760$ 12.9% Construction & Land Dev. 48,106$ 19.8% Construction & Land Dev. 316,866$ 13.6% 1-4 Family Residential 534,452 25.6% 1-4 Family Residential 92,088 37.9% 1-4 Family Residential 626,540 26.9% Multifamily 58,592 2.8% Multifamily 9,268 3.8% Multifamily 67,860 2.9% CRE: Oth. Income Producing 389,342 18.6% CRE: Oth. Income Producing 25,998 10.7% CRE: Oth. Income Producing 415,340 17.8% CRE: Owner-Occupied 412,528 19.8% CRE: Owner-Occupied 41,663 17.1% CRE: Owner-Occupied 454,191 19.5% Commercial & Industrial 303,129 14.5% Commercial & Industrial 19,508 8.0% Commercial & Industrial 322,637 13.8% Consumer & Other 120,863 5.8% Consumer & Other 6,431 2.6% Consumer & Other 127,294 5.5% Gross Loans 2,087,666$ 100.0% Gross Loans 243,062$ 100.0% Gross Loans 2,330,728$ 100.0% 84.4% 76.5% 83.5% 5.20% 6.62% 5.35%MRQ Yield on Loans: MRQ Yield on Loans: MRQ Yield on Loans: FBMS (1) FPB Financial Corp. Pro Forma Company Total Loans / Total Deposits: Total Loans / Total Deposits: Total Loans / Total Deposits: Const & Dev 12.9% 1 - 4 Fam Res 25.6% Multifam 2.8% CRE: Other 18.6% CRE: Own - Occ 19.8% C&I 14.5% Consr & Oth 5.8% Const & Dev 19.8% 1 - 4 Fam Res 37.9% Multifam 3.8% CRE: Other 10.7% CRE: Own - Occ 17.1% C&I 8.0% Consr & Oth 2.6% Const & Dev 13.6% 1 - 4 Fam Res 26.9% Multifam 2.9% CRE: Other 17.8% CRE: Own - Occ 19.5% C&I 13.8% Consr & Oth 5.5%

18 Pro Forma Deposits Note: Deposit composition based on bank - level regulatory filings; Excludes purchase accounting adjustments (1) Includes acquisition of FMB Banking Corporation (2) Core deposits defined as total deposits less time deposits accounts greater than $100,000 Source : S&P Global Market Intelligence; Data as of September 30, 2018 Deposit Type Balance ($000) % of Total Deposit Type Balance ($000) % of Total Deposit Type Balance ($000) % of Total Demand Deposits 511,701$ 20.7% Demand Deposits 102,475$ 32.3% Demand Deposits 614,176$ 22.0% NOW, ATS & Other Trans. 404,515 16.3% NOW, ATS & Other Trans. 85,376 26.9% NOW, ATS & Other Trans. 489,891 17.5% MMDA & Savings 1,067,158 43.1% MMDA & Savings 71,941 22.6% MMDA & Savings 1,139,099 40.8% Time Deposits < $100k 196,849 8.0% Time Deposits < $100k 16,196 5.1% Time Deposits < $100k 213,045 7.6% Time Deposits > $100k 294,312 11.9% Time Deposits > $100k 41,731 13.1% Time Deposits > $100k 336,043 12.0% Total Deposits 2,474,535$ 100.0% Total Deposits 317,719$ 100.0% Total Deposits 2,792,254$ 100.0% Total Noninterest-bearing Deposits: 22.9% Total Noninterest-bearing Deposits: 26.7% Total Noninterest-bearing Deposits: 23.3% Core Deposits (2) / Total Deposits: 88.1% Core Deposits (2) / Total Deposits: 86.9% Core Deposits (2) / Total Deposits: 88.0% 0.51% 0.64% 0.52%MRQ Cost of Deposits:MRQ Cost of Deposits:MRQ Cost of Deposits: FBMS (1) FPB Financial Corp. Pro Forma Company Demand Deposits 20.7% NOW, ATS & Other Trans. 16.3% MMDA & Savings 43.1% Time Dep. < $100k 8.0% Time Dep. > $100k 11.9% Demand Deposits 32.3% NOW, ATS & Other Trans. 26.9% MMDA & Savings 22.6% Time Dep. < $100k 5.1% Time Dep. > $100k 13.1% Demand Deposits 22.0% NOW, ATS & Other Trans. 17.5% MMDA & Savings 40.8% Time Dep. < $100k 7.6% Time Dep. > $100k 12.0%