Attached files
| file | filename |
|---|---|
| 8-K - 8-K - Antero Midstream Partners LP | a18-39381_18k.htm |
Legal Disclaimer No Offer or Solicitation This presentation discusses a previously announced proposed business combination transaction between Antero Midstream Partners LP (“Antero Midstream”) and Antero Midstream GP LP (“AMGP”). This presentation is for informational purposes only and does not constitute an offer to sell or the solicitation of an offer to buy any securities or a solicitation of any vote or approval, in any jurisdiction, pursuant to the transaction or otherwise, nor shall there be any sale, issuance, exchange or transfer of the securities referred to in this document in any jurisdiction in contravention of applicable law. No offer of securities shall be made except by means of a prospectus meeting the requirements of Section 10 of the Securities Act of 1933, as amended. Additional Information And Where To Find It In connection with the transaction, AMGP will file with the U.S. Securities and Exchange Commission (“SEC”) a registration statement on Form S-4, that will include a joint proxy statement of Antero Midstream and AMGP and a prospectus of AMGP. The transaction will be submitted to Antero Midstream unitholders and AMGP shareholders for their consideration. Antero Midstream and AMGP may also file other documents with the SEC regarding the transaction. The definitive joint proxy statement/prospectus will be sent to the shareholders of AMGP and unitholders of Antero Midstream. This presentation is not a substitute for the registration statement and joint proxy statement/prospectus that will be filed with the SEC or any other documents that AMGP or Antero Midstream may file with the SEC or send to shareholders of AMGP or unitholders of Antero Midstream in connection with the transaction. INVESTORS AND SECURITY HOLDERS OF ANTERO MIDSTREAM AND AMGP ARE URGED TO READ THE REGISTRATION STATEMENT AND THE JOINT PROXY STATEMENT/PROSPECTUS REGARDING THE TRANSACTION WHEN IT BECOMES AVAILABLE AND ALL OTHER RELEVANT DOCUMENTS THAT ARE FILED OR WILL BE FILED WITH THE SEC, AS WELL AS ANY AMENDMENTS OR SUPPLEMENTS TO THESE DOCUMENTS, CAREFULLY AND IN THEIR ENTIRETY BECAUSE THEY WILL CONTAIN IMPORTANT INFORMATION ABOUT THE TRANSACTION AND RELATED MATTERS. Investors and security holders will be able to obtain free copies of the registration statement and the joint proxy statement/prospectus (when available) and all other documents filed or that will be filed with the SEC by AMGP or Antero Midstream through the website maintained by the SEC at http://www.sec.gov. Copies of documents filed with the SEC by Antero Midstream will be made available free of charge on Antero Midstream’s website at http://investors.anteromidstream.com/investor-relations/AM, under the heading “SEC Filings,” or by directing a request to Investor Relations, Antero Midstream Partners LP, 1615 Wynkoop Street, Denver, Colorado 75219, Tel. No. (303) 357-7310. Copies of documents filed with the SEC by AMGP will be made available free of charge on AMGP’s website at http://investors.anteromidstreamgp.com/Investor-Relations/AMGP or by directing a request to Investor Relations, Antero Midstream GP LP, 1615 Wynkoop Street, Denver, Colorado 75219, Tel. No. (303) 357-7310. Participants In The Solicitation Antero Resources Corporation (“Antero Resources”), AMGP, Antero Midstream and the directors and executive officers of AMGP’s and Antero Midstream’s respective general partners and of Antero Resources may be deemed to be participants in the solicitation of proxies in respect to the proposed transaction. Information regarding the directors and executive officers of Antero Midstream’s general partner is contained in Antero Midstream’s 2018 Annual Report on Form 10- K filed with the SEC on February 13, 2018, and certain of its Current Reports on Form 8-K. You can obtain a free copy of this document at the SEC’s website at http://www.sec.gov or by accessing Antero Midstream’s website at http://www.anteromidstream.com. Information regarding the executive officers and directors of AMGP’s general partner is contained in AMGP’s 2018 Annual Report on Form 10-K filed with the SEC on February 13, 2018 and certain of its Current Reports on Form 8-K. You can obtain a free copy of this document at the SEC’s website at www.sec.gov or by accessing AMGP’s website at http://www.anteromidstream.com. Information regarding the executive officers and directors of Antero Resources is contained in Antero Resources’ 2018 Annual Report on Form 10-K filed with the SEC on February 13, 2018 and certain of its Current Reports on Form 8-K. You can obtain a free copy of this document at the SEC’s website at www.sec.gov or by accessing Antero Resources’ website at http:// www.anteroresources.com. Investors may obtain additional information regarding the interests of those persons and other persons who may be deemed participants in the proposed transaction by reading the joint proxy statement/prospectus regarding the proposed transaction when it becomes available. You may obtain free copies of this document as described above. Forward-Looking Statements This presentation includes “forward-looking statements” within the meaning of federal securities laws. Such forward-looking statements are subject to a number of risks and uncertainties, many of which are beyond the Antero Midstream’s and AMGP’s control. All statements, other than historical facts included in this presentation, are forward-looking statements. All forward-looking statements speak only as of the date of this presentation and are based upon a number of assumptions. Without limiting the generality of the foregoing, forward-looking statements contained in this presentation specifically include statements regarding the transaction, the extent of the accretion, if any, to AMGP shareholders and Antero Midstream unitholders, that the transaction will reduce AMGP’s tax payments through 2022 and that New AM does not expect to pay material cash taxes through at least 2024. Although the Partnership and AMGP each believe that the plans, intentions and expectations reflected in or suggested by the forward-looking statements are reasonable, there is no assurance that the assumptions underlying these forward-looking statements will be accurate or the plans, intentions or expectations expressed herein will be achieved. For example, future acquisitions, dispositions or other strategic transactions may materially impact the forecasted or targeted results described in this presentation. Therefore, actual outcomes and results could materially differ from what is expressed, implied or forecast in such statements. Nothing in this presentation is intended to constitute guidance with respect to Antero Resources. Antero Midstream and AMGP caution you that these forward-looking statements are subject to all of the risks and uncertainties, most of which are difficult to predict and many of which are beyond Antero Midstream’s and AMGP's control, incident to the gathering and processing and fresh water and waste water treatment businesses. These risks include, but are not limited to, the expected timing and likelihood of completion of the transaction, including the ability to obtain requisite regulatory, unitholder and shareholder approval and the satisfaction of the other conditions to the consummation of the proposed transaction, risks that the proposed transaction may not be consummated or the benefits contemplated therefrom may not be realized, the cost savings, tax benefits and any other synergies from the transaction may not be fully realized or may take longer to realize than expected, Antero Resources’ expected future growth, Antero Resources’ ability to meet its drilling and development plan, commodity price volatility, ability to execute the Partnership's business strategy, competition and government regulations, actions taken by third-party producers, operators, processors and transporters, inflation, environmental risks, drilling and completion and other operating risks, regulatory changes, the uncertainty inherent in projecting future rates of production, cash flow and access to capital, the timing of development expenditures, and the other risks described under “Risk Factors” in Antero Midstream’s Annual Report on Form 10-K for the year ended December 31, 2017. 2
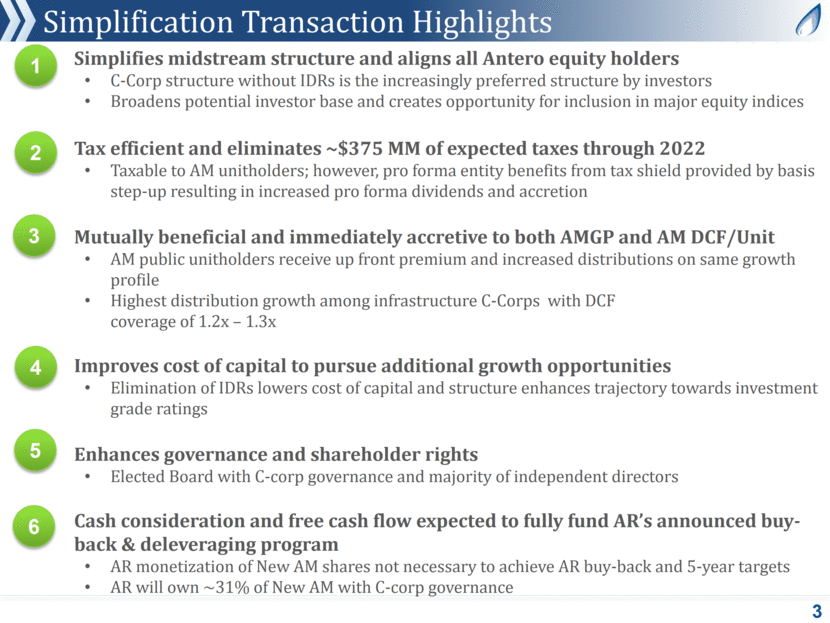
Simplification Transaction Highlights 3 1 2 Simplifies midstream structure and aligns all Antero equity holders C-Corp structure without IDRs is the increasingly preferred structure by investors Broadens potential investor base and creates opportunity for inclusion in major equity indices Tax efficient and eliminates ~$375 MM of expected taxes through 2022 Taxable to AM unitholders; however, pro forma entity benefits from tax shield provided by basis step-up resulting in increased pro forma dividends and accretion Mutually beneficial and immediately accretive to both AMGP and AM DCF/Unit AM public unitholders receive up front premium and increased distributions on same growth profile Highest distribution growth among infrastructure C-Corps with DCF coverage of 1.2x – 1.3x Improves cost of capital to pursue additional growth opportunities Elimination of IDRs lowers cost of capital and structure enhances trajectory towards investment grade ratings Enhances governance and shareholder rights Elected Board with C-corp governance and majority of independent directors Cash consideration and free cash flow expected to fully fund AR’s announced buy-back & deleveraging program AR monetization of New AM shares not necessary to achieve AR buy-back and 5-year targets AR will own ~31% of New AM with C-corp governance 3 4 5 6
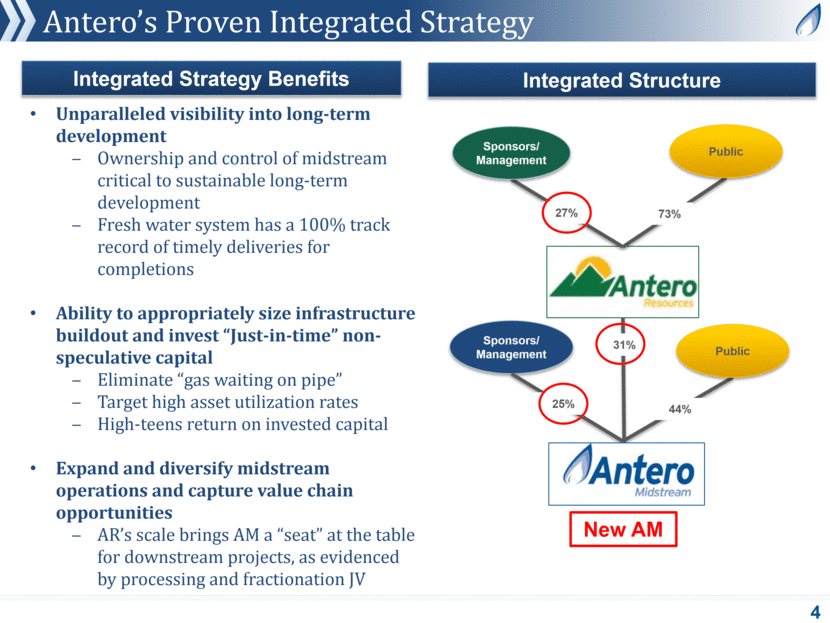
Antero’s Proven Integrated Strategy 4 Integrated Strategy Benefits Integrated Structure 27% 73% 31% Public Public Sponsors/ Management Sponsors/ Management 25% 44% New AM Unparalleled visibility into long-term development Ownership and control of midstream critical to sustainable long-term development Fresh water system has a 100% track record of timely deliveries for completions Ability to appropriately size infrastructure buildout and invest “Just-in-time” non-speculative capital Eliminate “gas waiting on pipe” Target high asset utilization rates High-teens return on invested capital Expand and diversify midstream operations and capture value chain opportunities AR’s scale brings AM a “seat” at the table for downstream projects, as evidenced by processing and fractionation JV
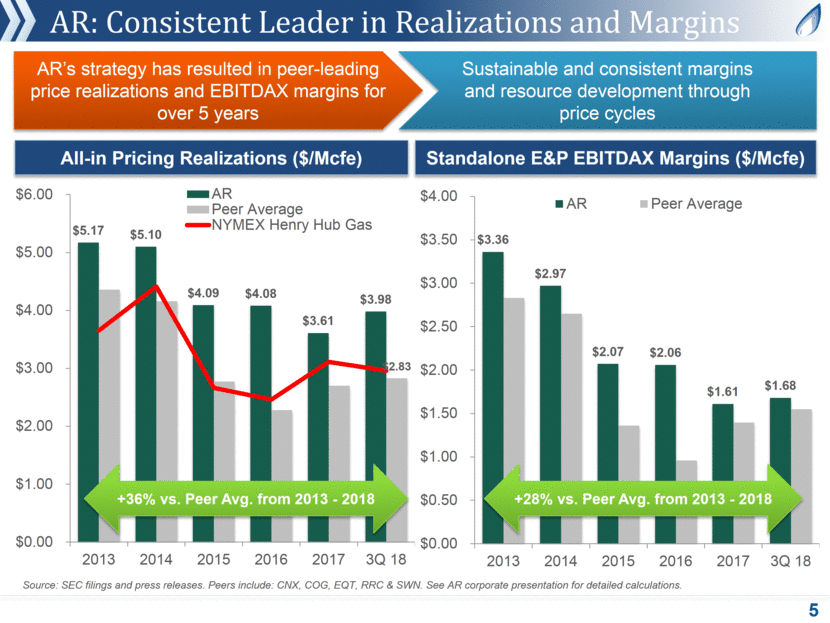
AR: Consistent Leader in Realizations and Margins 5 All-in Pricing Realizations ($/Mcfe) Standalone E&P EBITDAX Margins ($/Mcfe) AR’s strategy has resulted in peer-leading price realizations and EBITDAX margins for over 5 years Sustainable and consistent margins and resource development through price cycles +36% vs. Peer Avg. from 2013 - 2018 +28% vs. Peer Avg. from 2013 - 2018 Source: SEC filings and press releases. Peers include: CNX, COG, EQT, RRC & SWN. See AR corporate presentation for detailed calculations. $5.17 $5.10 $4.09 $4.08 $3.61 $3.98 $2.83 $0.00 $1.00 $2.00 $3.00 $4.00 $5.00 $6.00 2013 2014 2015 2016 2017 3Q 18 AR Peer Average NYMEX Henry Hub Gas $3.36 $2.97 $2.07 $2.06 $1.61 $1.68 $0.00 $0.50 $1.00 $1.50 $2.00 $2.50 $3.00 $3.50 $4.00 2013 2014 2015 2016 2017 3Q 18 AR Peer Average
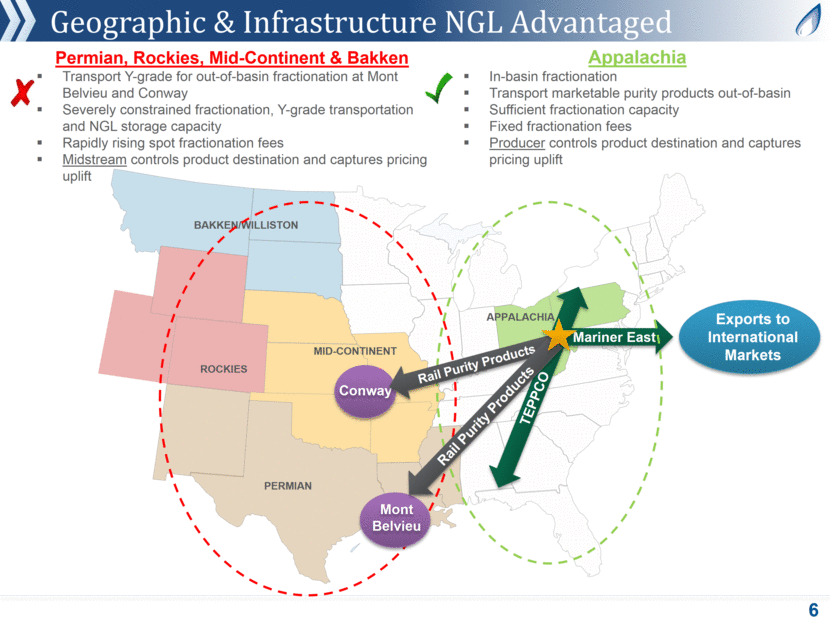
Geographic & Infrastructure NGL Advantaged 6 Mid-Continent Appalachia 31 Permian Rockies Bakken/Williston Mariner East TEPPCO Exports to International Markets Mont Belvieu Conway Appalachia In-basin fractionation Transport marketable purity products out-of-basin Sufficient fractionation capacity Fixed fractionation fees Producer controls product destination and captures pricing uplift Rail Purity Products Rail Purity Products Permian, Rockies, Mid-Continent & Bakken Transport Y-grade for out-of-basin fractionation at Mont Belvieu and Conway Severely constrained fractionation, Y-grade transportation and NGL storage capacity Rapidly rising spot fractionation fees Midstream controls product destination and captures pricing uplift
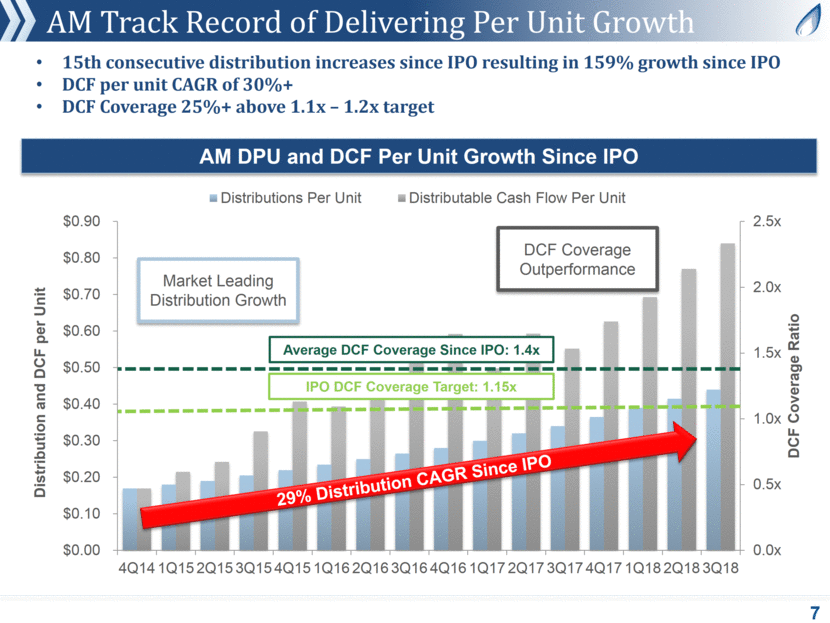
AM Track Record of Delivering Per Unit Growth 7 AM DPU and DCF Per Unit Growth Since IPO 15th consecutive distribution increases since IPO resulting in 159% growth since IPO DCF per unit CAGR of 30%+ DCF Coverage 25%+ above 1.1x – 1.2x target 29% Distribution CAGR Since IPO IPO DCF Coverage Target: 1.15x Market Leading Distribution Growth DCF Coverage Outperformance Average DCF Coverage Since IPO: 1.4x 0.0x 0.5x 1.0x 1.5x 2.0x 2.5x $0.00 $0.10 $0.20 $0.30 $0.40 $0.50 $0.60 $0.70 $0.80 $0.90 4Q14 1Q15 2Q15 3Q15 4Q15 1Q16 2Q16 3Q16 4Q16 1Q17 2Q17 3Q17 4Q17 1Q18 2Q18 3Q18 DCF Coverage Ratio Distribution and DCF per Unit Distributions Per Unit Distributable Cash Flow Per Unit
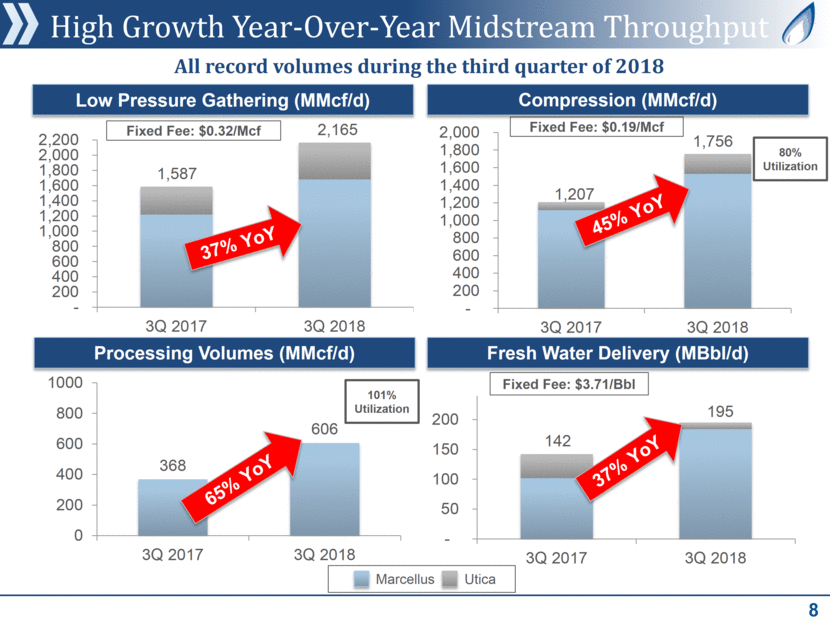
High Growth Year-Over-Year Midstream Throughput 8 Marcellus Utica 37% YoY Fixed Fee: $0.32/Mcf Fixed Fee: $0.19/Mcf Fixed Fee: $3.71/Bbl Low Pressure Gathering (MMcf/d) Compression (MMcf/d) Processing Volumes (MMcf/d) Fresh Water Delivery (MBbl/d) 45% YoY 37% YoY All record volumes during the third quarter of 2018 65% YoY 80% Utilization 101% Utilization 142 195 - 50 100 150 200 3Q 2017 3Q 2018 1,207 1,756 - 200 400 600 800 1,000 1,200 1,400 1,600 1,800 2,000 3Q 2017 3Q 2018 1,587 2,165 - 200 400 600 800 1,000 1,200 1,400 1,600 1,800 2,000 2,200 3Q 2017 3Q 2018 368 606 0 200 400 600 800 1000 3Q 2017 3Q 2018
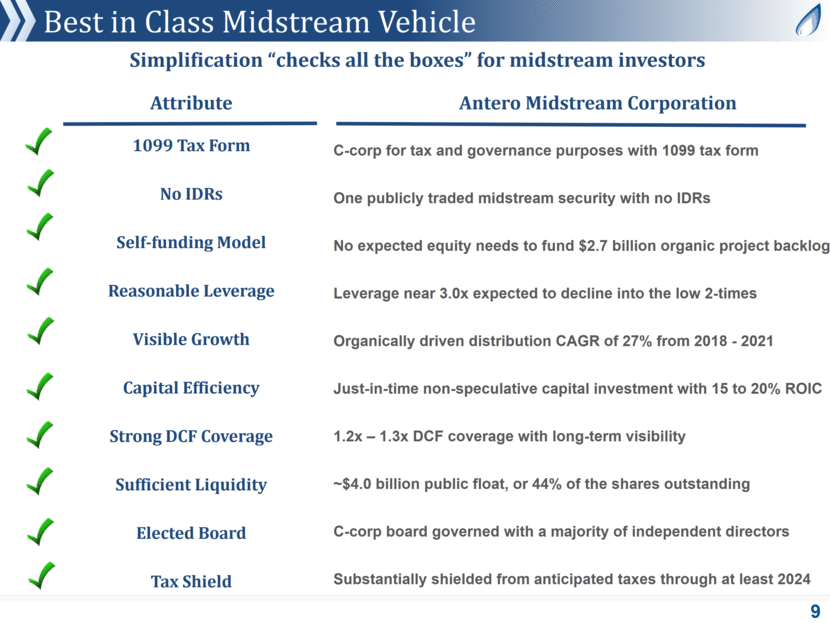
Best in Class Midstream Vehicle 9 Simplification “checks all the boxes” for midstream investors Attribute 1099 Tax Form No IDRs Self-funding Model Reasonable Leverage Visible Growth Capital Efficiency Strong DCF Coverage Sufficient Liquidity Elected Board Tax Shield C-corp for tax and governance purposes with 1099 tax form One publicly traded midstream security with no IDRs No expected equity needs to fund $2.7 billion organic project backlog Leverage near 3.0x expected to decline into the low 2-times Organically driven distribution CAGR of 27% from 2018 - 2021 1.2x – 1.3x DCF coverage with long-term visibility ~$4.0 billion public float, or 44% of the shares outstanding C-corp board governed with a majority of independent directors Substantially shielded from anticipated taxes through at least 2024 Just-in-time non-speculative capital investment with 15 to 20% ROIC Antero Midstream Corporation
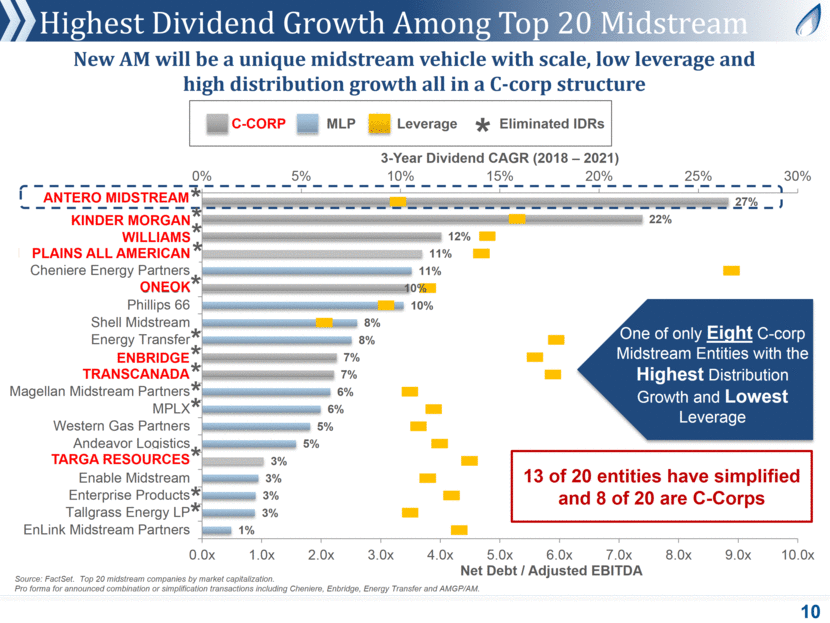
Highest Dividend Growth Among Top 20 Midstream 10 New AM will be a unique midstream vehicle with scale, low leverage and high distribution growth all in a C-corp structure C-CORP Leverage MLP ENBRIDGE ONEOK KINDER MORGAN TRANSCANADA WILLIAMS ANTERO MIDSTREAM * * * * * * * TARGA RESOURCES * * PLAINS ALL AMERICAN * Eliminated IDRs * Source: FactSet. Top 20 midstream companies by market capitalization. Pro forma for announced combination or simplification transactions including Cheniere, Enbridge, Energy Transfer and AMGP/AM. 13 of 20 entities have simplified and 8 of 20 are C-Corps One of only Eight C-corp Midstream Entities with the Highest Distribution Growth and Lowest Leverage * * * 4.1x 3.3x 4.0x 3.6x 4.3x 3.8x 3.4x 3.7x 3.3x 5.7x 5.4x 5.8x 1.9x 2.9x 3.6x 8.7x 4.5x 4.6x 5.1x 3.1x 1% 3% 3% 3% 3% 5% 5% 6% 6% 7% 7% 8% 8% 10% 10% 11% 11% 12% 22% 27% 0% 5% 10% 15% 20% 25% 30% 0.0x 1.0x 2.0x 3.0x 4.0x 5.0x 6.0x 7.0x 8.0x 9.0x 10.0x EnLink Midstream Partners Tallgrass Energy LP Enterprise Products Enable Midstream Targa Resources Andeavor Logistics Western Gas Partners MPLX Magellan Midstream Partners TransCanada Enbridge Energy Transfer Shell Midstream Phillips 66 ONEOK Cheniere Energy Partners Plains All American Pipeline Williams Kinder Morgan Antero Midstream 3 - Year Dividend CAGR (2018 – 2021) Net Debt / Adjusted EBITDA
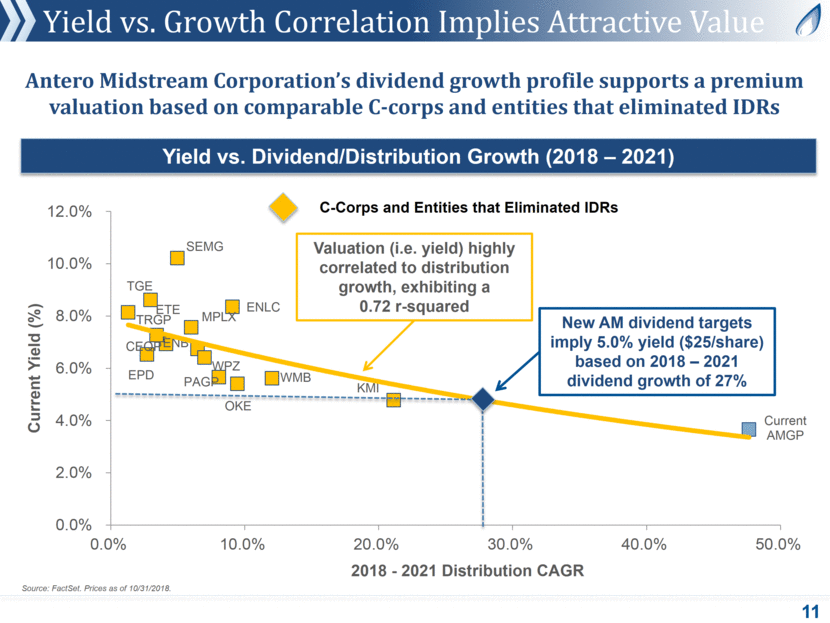
Yield vs. Growth Correlation Implies Attractive Value 11 Source: FactSet. Prices as of 10/31/2018. Yield vs. Dividend/Distribution Growth (2018 – 2021) New AM dividend targets imply 5.0% yield ($25/share) based on 2018 – 2021 dividend growth of 27% Antero Midstream Corporation’s dividend growth profile supports a premium valuation based on comparable C-corps and entities that eliminated IDRs Valuation (i.e. yield) highly correlated to distribution growth, exhibiting a 0.72 r-squared EPD CEQP MPLX KMI OKE SEMG TRGP ENB WMB PAGP WPZ ENLC Current AMGP ETE TGE 0.0% 2.0% 4.0% 6.0% 8.0% 10.0% 12.0% 0.0% 10.0% 20.0% 30.0% 40.0% 50.0% Current Yield (%) 2018 - 2021 Distribution CAGR C - Corps and Entities that Eliminated IDRs
Appendix
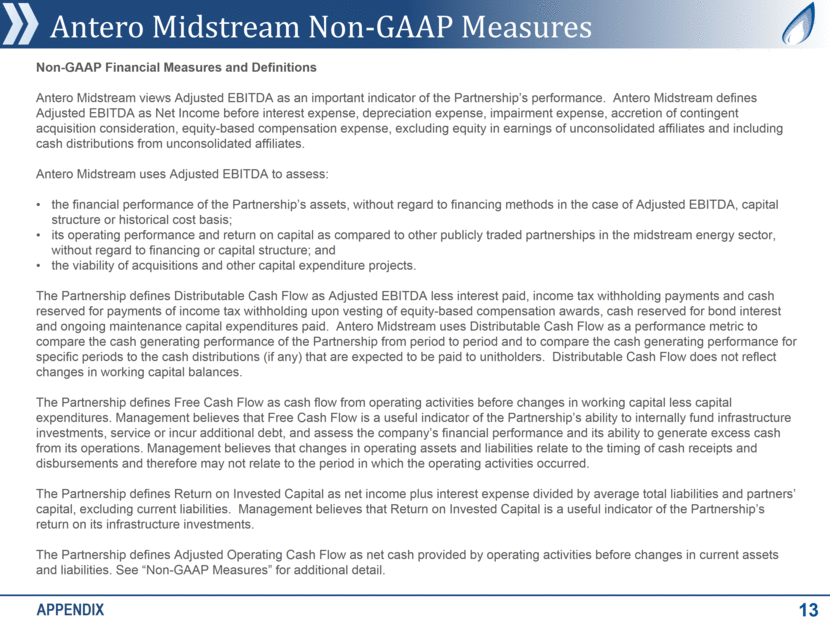
Antero Midstream Non-GAAP Measures APPENDIX 13 Non-GAAP Financial Measures and Definitions Antero Midstream views Adjusted EBITDA as an important indicator of the Partnership’s performance. Antero Midstream defines Adjusted EBITDA as Net Income before interest expense, depreciation expense, impairment expense, accretion of contingent acquisition consideration, equity-based compensation expense, excluding equity in earnings of unconsolidated affiliates and including cash distributions from unconsolidated affiliates. Antero Midstream uses Adjusted EBITDA to assess: the financial performance of the Partnership’s assets, without regard to financing methods in the case of Adjusted EBITDA, capital structure or historical cost basis; its operating performance and return on capital as compared to other publicly traded partnerships in the midstream energy sector, without regard to financing or capital structure; and the viability of acquisitions and other capital expenditure projects. The Partnership defines Distributable Cash Flow as Adjusted EBITDA less interest paid, income tax withholding payments and cash reserved for payments of income tax withholding upon vesting of equity-based compensation awards, cash reserved for bond interest and ongoing maintenance capital expenditures paid. Antero Midstream uses Distributable Cash Flow as a performance metric to compare the cash generating performance of the Partnership from period to period and to compare the cash generating performance for specific periods to the cash distributions (if any) that are expected to be paid to unitholders. Distributable Cash Flow does not reflect changes in working capital balances. The Partnership defines Free Cash Flow as cash flow from operating activities before changes in working capital less capital expenditures. Management believes that Free Cash Flow is a useful indicator of the Partnership’s ability to internally fund infrastructure investments, service or incur additional debt, and assess the company’s financial performance and its ability to generate excess cash from its operations. Management believes that changes in operating assets and liabilities relate to the timing of cash receipts and disbursements and therefore may not relate to the period in which the operating activities occurred. The Partnership defines Return on Invested Capital as net income plus interest expense divided by average total liabilities and partners’ capital, excluding current liabilities. Management believes that Return on Invested Capital is a useful indicator of the Partnership’s return on its infrastructure investments. The Partnership defines Adjusted Operating Cash Flow as net cash provided by operating activities before changes in current assets and liabilities. See “Non-GAAP Measures” for additional detail.
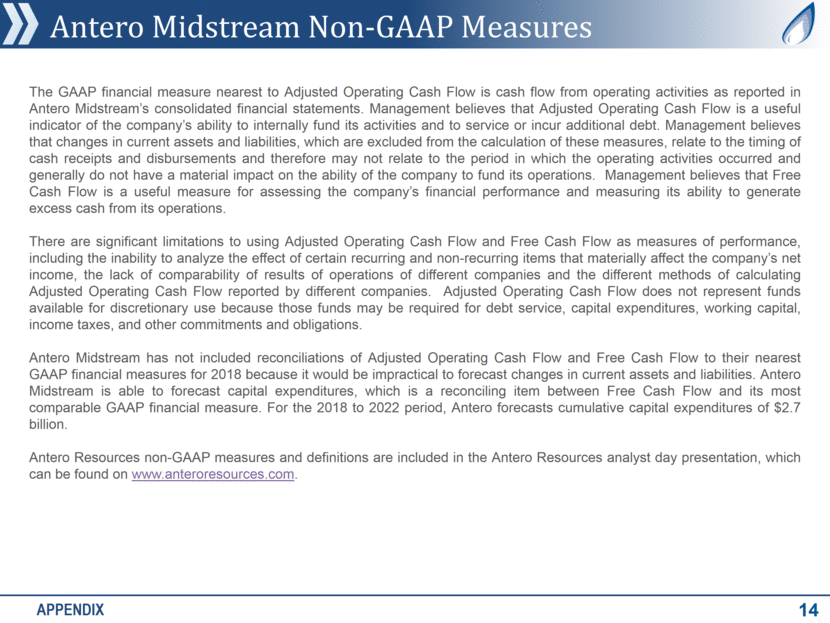
Antero Midstream Non-GAAP Measures APPENDIX 14 The GAAP financial measure nearest to Adjusted Operating Cash Flow is cash flow from operating activities as reported in Antero Midstream’s consolidated financial statements. Management believes that Adjusted Operating Cash Flow is a useful indicator of the company’s ability to internally fund its activities and to service or incur additional debt. Management believes that changes in current assets and liabilities, which are excluded from the calculation of these measures, relate to the timing of cash receipts and disbursements and therefore may not relate to the period in which the operating activities occurred and generally do not have a material impact on the ability of the company to fund its operations. Management believes that Free Cash Flow is a useful measure for assessing the company’s financial performance and measuring its ability to generate excess cash from its operations. There are significant limitations to using Adjusted Operating Cash Flow and Free Cash Flow as measures of performance, including the inability to analyze the effect of certain recurring and non-recurring items that materially affect the company’s net income, the lack of comparability of results of operations of different companies and the different methods of calculating Adjusted Operating Cash Flow reported by different companies. Adjusted Operating Cash Flow does not represent funds available for discretionary use because those funds may be required for debt service, capital expenditures, working capital, income taxes, and other commitments and obligations. Antero Midstream has not included reconciliations of Adjusted Operating Cash Flow and Free Cash Flow to their nearest GAAP financial measures for 2018 because it would be impractical to forecast changes in current assets and liabilities. Antero Midstream is able to forecast capital expenditures, which is a reconciling item between Free Cash Flow and its most comparable GAAP financial measure. For the 2018 to 2022 period, Antero forecasts cumulative capital expenditures of $2.7 billion. Antero Resources non-GAAP measures and definitions are included in the Antero Resources analyst day presentation, which can be found on www.anteroresources.com.
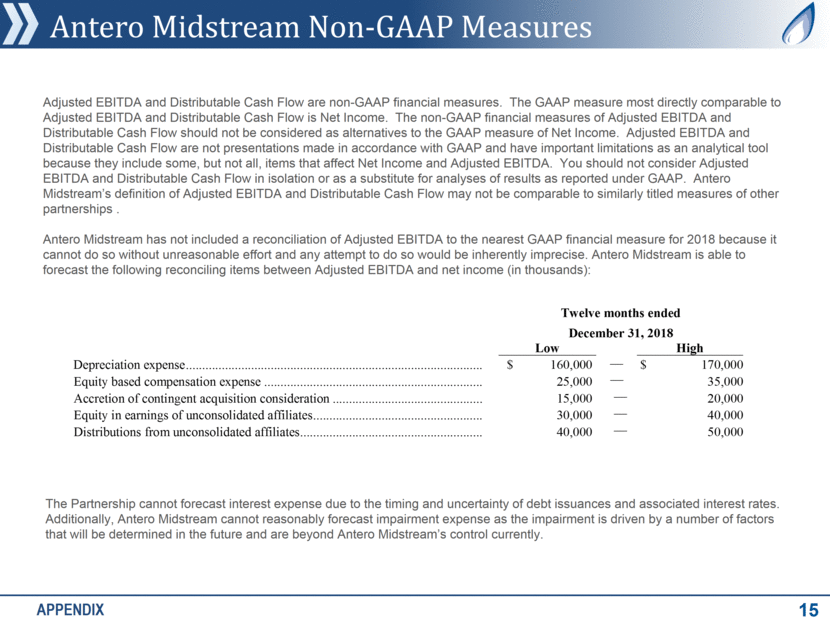
Antero Midstream Non-GAAP Measures APPENDIX 15 Adjusted EBITDA and Distributable Cash Flow are non-GAAP financial measures. The GAAP measure most directly comparable to Adjusted EBITDA and Distributable Cash Flow is Net Income. The non-GAAP financial measures of Adjusted EBITDA and Distributable Cash Flow should not be considered as alternatives to the GAAP measure of Net Income. Adjusted EBITDA and Distributable Cash Flow are not presentations made in accordance with GAAP and have important limitations as an analytical tool because they include some, but not all, items that affect Net Income and Adjusted EBITDA. You should not consider Adjusted EBITDA and Distributable Cash Flow in isolation or as a substitute for analyses of results as reported under GAAP. Antero Midstream’s definition of Adjusted EBITDA and Distributable Cash Flow may not be comparable to similarly titled measures of other partnerships . Antero Midstream has not included a reconciliation of Adjusted EBITDA to the nearest GAAP financial measure for 2018 because it cannot do so without unreasonable effort and any attempt to do so would be inherently imprecise. Antero Midstream is able to forecast the following reconciling items between Adjusted EBITDA and net income (in thousands): The Partnership cannot forecast interest expense due to the timing and uncertainty of debt issuances and associated interest rates. Additionally, Antero Midstream cannot reasonably forecast impairment expense as the impairment is driven by a number of factors that will be determined in the future and are beyond Antero Midstream’s control currently. T welve months ended December 31 , 2018 Low High Depreciation expense ................................ ................................ ........................... $ 160,000 — $ 170,000 Equity based compensation expense ................................ ................................ ... 25,000 — 35,000 Accretion of contingent acquisition consideration ................................ .............. 15,000 — 20,000 Equity in earnings of unconsolidated affiliates ................................ .................... 30,00 0 — 40,000 Distributions from unconsolidated affiliates ................................ ........................ 40,000 — 50,000
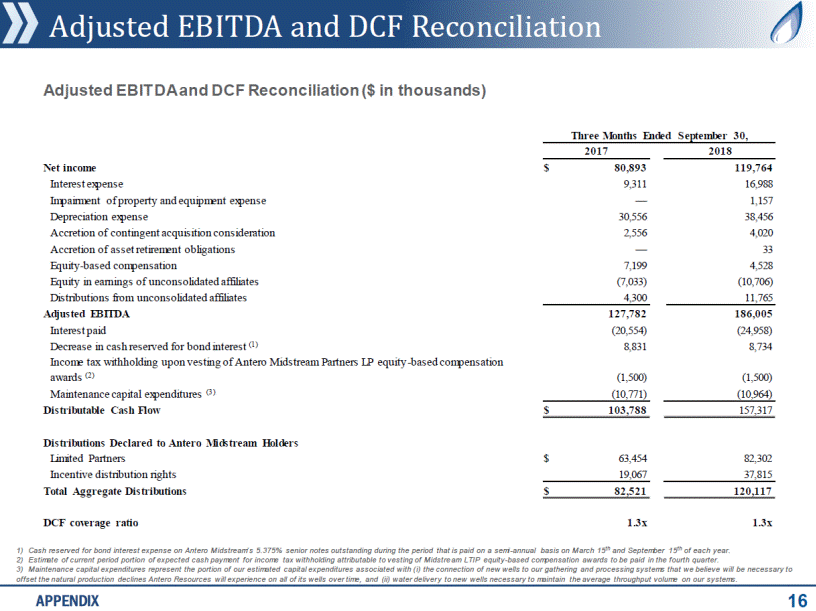
Adjusted EBITDA and DCF Reconciliation APPENDIX 16 Adjusted EBITDA and DCF Reconciliation ($ in thousands) 1) Cash reserved for bond interest expense on Antero Midstream’s 5.375% senior notes outstanding during the period that is paid on a semi-annual basis on March 15th and September 15th of each year. 2) Estimate of current period portion of expected cash payment for income tax withholding attributable to vesting of Midstream LTIP equity-based compensation awards to be paid in the fourth quarter. 3) Maintenance capital expenditures represent the portion of our estimated capital expenditures associated with (i) the connection of new wells to our gathering and processing systems that we believe will be necessary to offset the natural production declines Antero Resources will experience on all of its wells over time, and (ii) water delivery to new wells necessary to maintain the average throughput volume on our systems. Three Months Ended September 30, 2017 2018 Net income $ 80,893 119,764 Interest expense 9,311 16,988 Impairment of property and equipment expense — 1,157 Depreciation expense 30,556 38,456 Accretion of contingent acquisition consideration 2,556 4,020 Accretion of asset retirement obligations — 33 Equity-based compensation 7,199 4,528 Equity in earnings of unconsolidated affiliates (7,033) (10,706) Distributions from unconsolidated affiliates 4,300 11,765 Adjusted EBITDA 127,782 186,005 Interest paid (20,554) (24,958) Decrease in cash reserved for bond interest (1) 8,831 8,734 Income tax withholding upon vesting of Antero Midstream Partners LP equity-based compensation awards (2) (1,500) (1,500) Maintenance capital expenditures (3) (10,771) (10,964) Distributable Cash Flow $ 103,788 157,317 Distributions Declared to Antero Midstream Holders Limited Partners $ 63,454 82,302 Incentive distribution rights 19,067 37,815 Total Aggregate Distributions $ 82,521 120,117 DCF coverage ratio 1.3x 1.3x
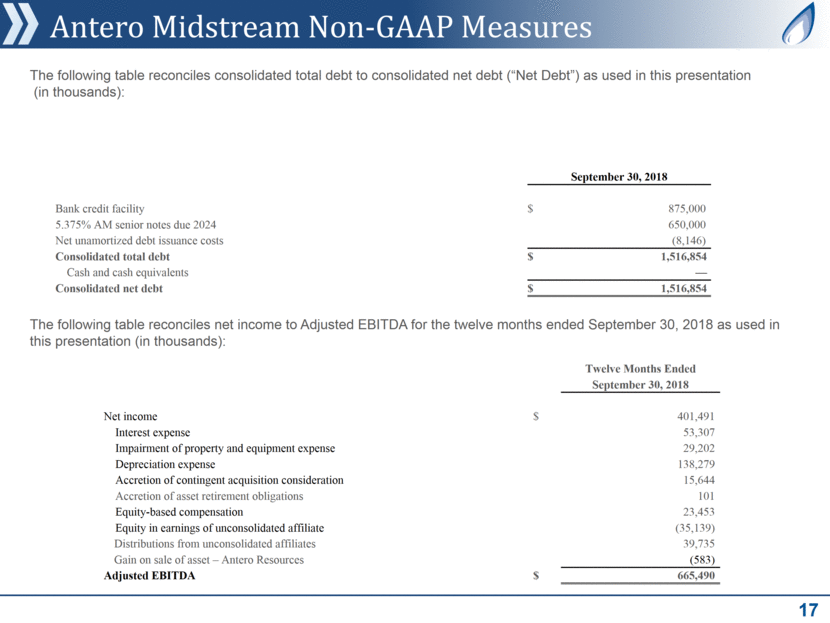
Antero Midstream Non-GAAP Measures 17 The following table reconciles net income to Adjusted EBITDA for the twelve months ended September 30, 2018 as used in this presentation (in thousands): The following table reconciles consolidated total debt to consolidated net debt (“Net Debt”) as used in this presentation (in thousands): September 30, 2018 Bank credit facility $ 875,000 5.375% AM senior notes due 2024 650,000 Net unamortized debt issuance costs (8,146) Consolidated total debt $ 1,516,854 Cash and cash equivalents — Consolidated net debt $ 1,516,854 Twelve Months Ended September 30, 2018 Net income $ 401,491 Interest expense 53,307 Impairment of property and equipment expense 29,202 Depreciation expense 138,279 Accretion of contingent acquisition consideration 15,644 Accretion of asset retirement obligations 101 Equity-based compensation 23,453 Equity in earnings of unconsolidated affiliate (35,139) Distributions from unconsolidated affiliates 39,735 Gain on sale of asset – Antero Resources (583) Adjusted EBITDA $ 665,490