Attached files
| file | filename |
|---|---|
| EX-99.1 - EXHIBIT 99.1 - MIDSOUTH BANCORP INC | a2018q3ex991.htm |
| 8-K - 8-K - MIDSOUTH BANCORP INC | a2018q38k.htm |
3Q18 Update
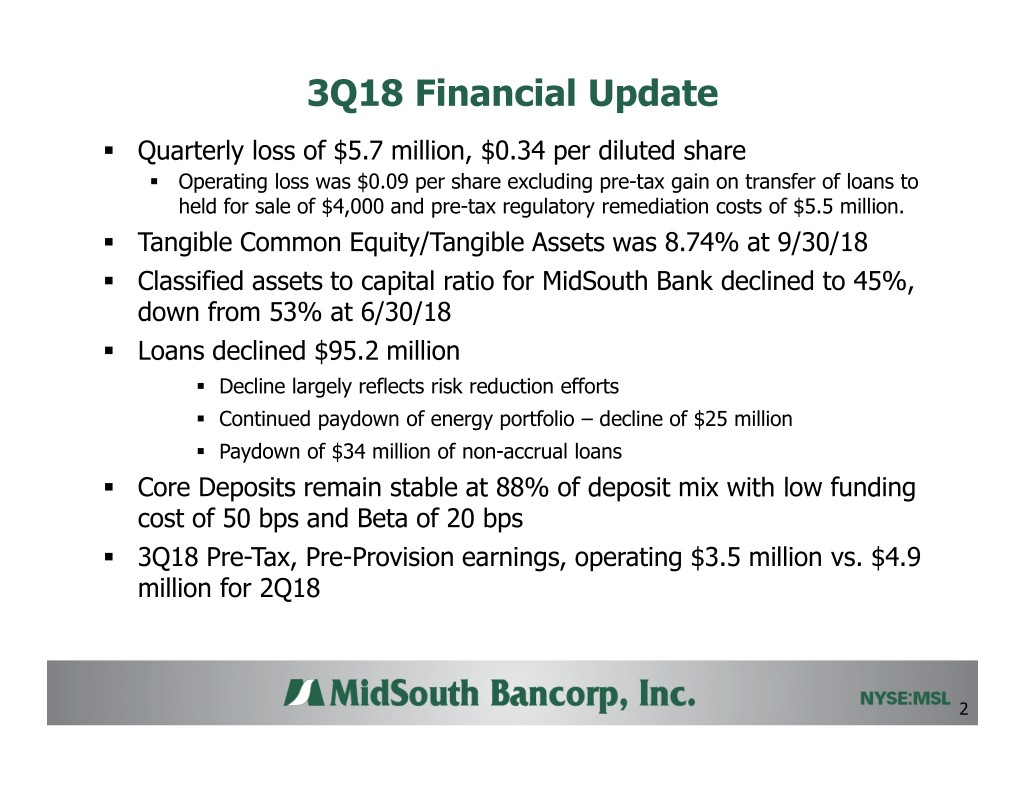
3Q18 Financial Update ° Quarterly loss of $5.7 million, $0.34 per diluted share ° Operating loss was $0.09 per share excluding pre-tax gain on transfer of loans to held for sale of $4,000 and pre-tax regulatory remediation costs of $5.5 million. ° Tangible Common Equity/Tangible Assets was 8.74% at 9/30/18 ° Classified assets to capital ratio for MidSouth Bank declined to 45%, down from 53% at 6/30/18 ° Loans declined $95.2 million ° Decline largely reflects risk reduction efforts ° Continued paydown of energy portfolio – decline of $25 million ° Paydown of $34 million of non-accrual loans ° Core Deposits remain stable at 88% of deposit mix with low funding cost of 50 bps and Beta of 20 bps ° 3Q18 Pre-Tax, Pre-Provision earnings, operating $3.5 million vs. $4.9 million for 2Q18 2
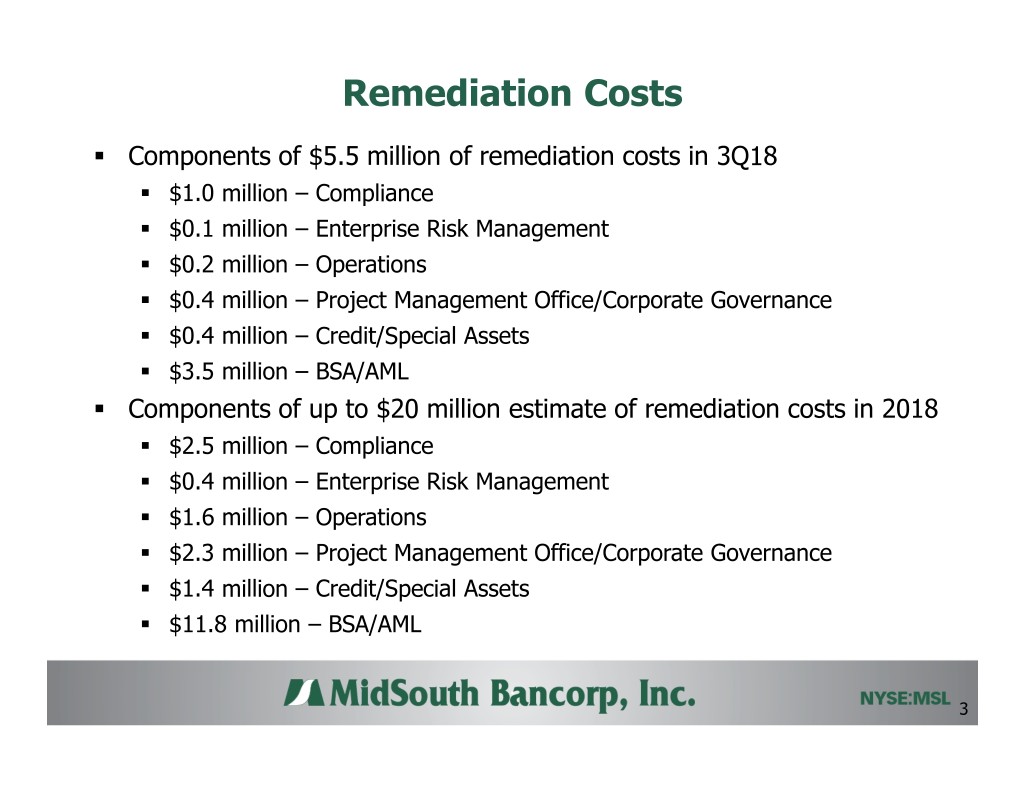
Remediation Costs ° Components of $5.5 million of remediation costs in 3Q18 ° $1.0 million – Compliance ° $0.1 million – Enterprise Risk Management ° $0.2 million – Operations ° $0.4 million – Project Management Office/Corporate Governance ° $0.4 million – Credit/Special Assets ° $3.5 million – BSA/AML ° Components of up to $20 million estimate of remediation costs in 2018 ° $2.5 million – Compliance ° $0.4 million – Enterprise Risk Management ° $1.6 million – Operations ° $2.3 million – Project Management Office/Corporate Governance ° $1.4 million – Credit/Special Assets ° $11.8 million – BSA/AML 3
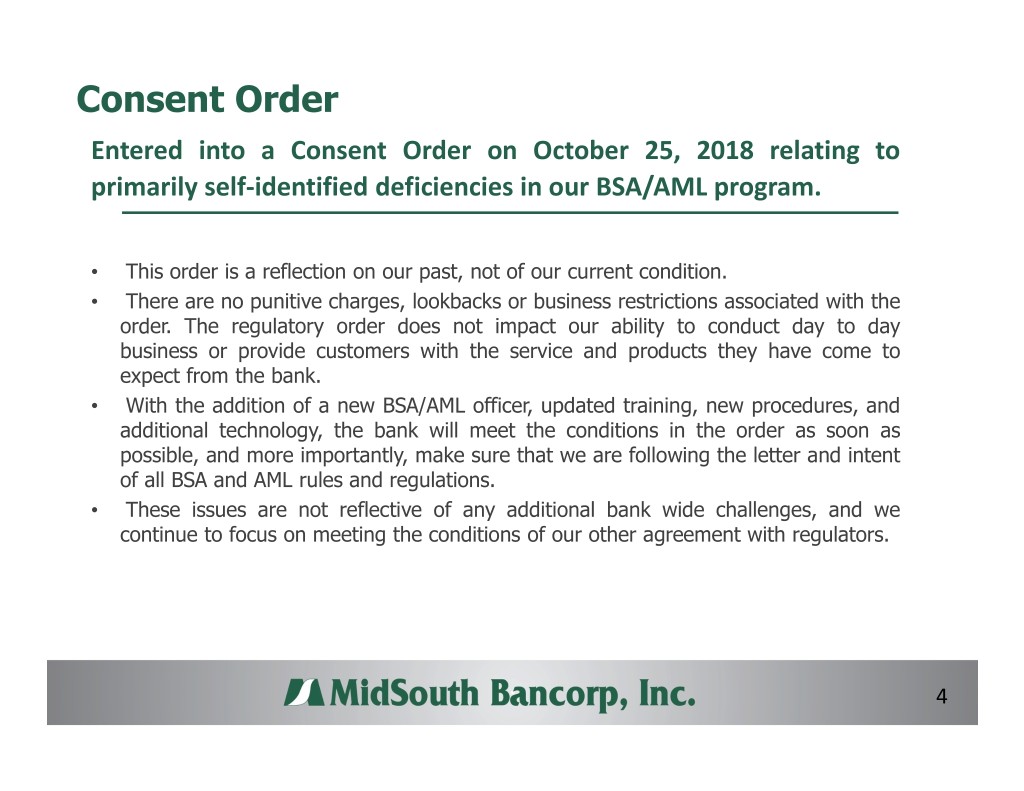
Consent Order Entered into a Consent Order on October 25, 2018 relating to primarily self-identified deficiencies in our BSA/AML program. • This order is a reflection on our past, not of our current condition. • There are no punitive charges, lookbacks or business restrictions associated with the order. The regulatory order does not impact our ability to conduct day to day business or provide customers with the service and products they have come to expect from the bank. • With the addition of a new BSA/AML officer, updated training, new procedures, and additional technology, the bank will meet the conditions in the order as soon as possible, and more importantly, make sure that we are following the letter and intent of all BSA and AML rules and regulations. • These issues are not reflective of any additional bank wide challenges, and we continue to focus on meeting the conditions of our other agreement with regulators. 4
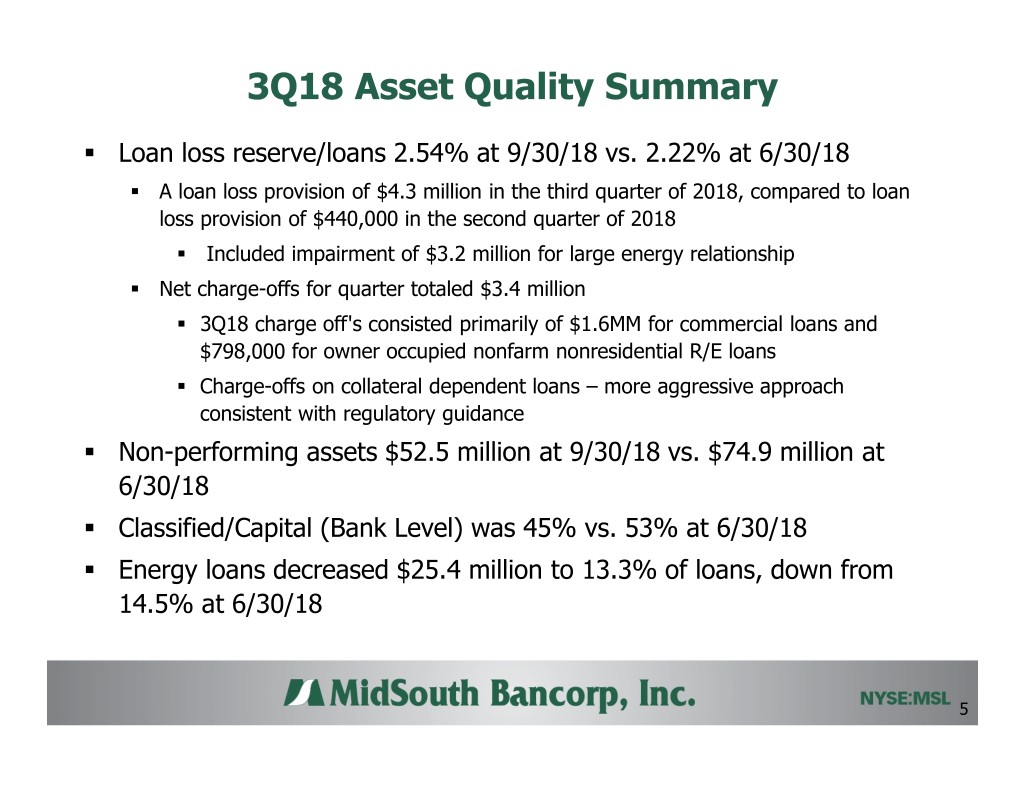
3Q18 Asset Quality Summary ° Loan loss reserve/loans 2.54% at 9/30/18 vs. 2.22% at 6/30/18 ° A loan loss provision of $4.3 million in the third quarter of 2018, compared to loan loss provision of $440,000 in the second quarter of 2018 ° Included impairment of $3.2 million for large energy relationship ° Net charge-offs for quarter totaled $3.4 million ° 3Q18 charge off's consisted primarily of $1.6MM for commercial loans and $798,000 for owner occupied nonfarm nonresidential R/E loans ° Charge-offs on collateral dependent loans – more aggressive approach consistent with regulatory guidance ° Non-performing assets $52.5 million at 9/30/18 vs. $74.9 million at 6/30/18 ° Classified/Capital (Bank Level) was 45% vs. 53% at 6/30/18 ° Energy loans decreased $25.4 million to 13.3% of loans, down from 14.5% at 6/30/18 5
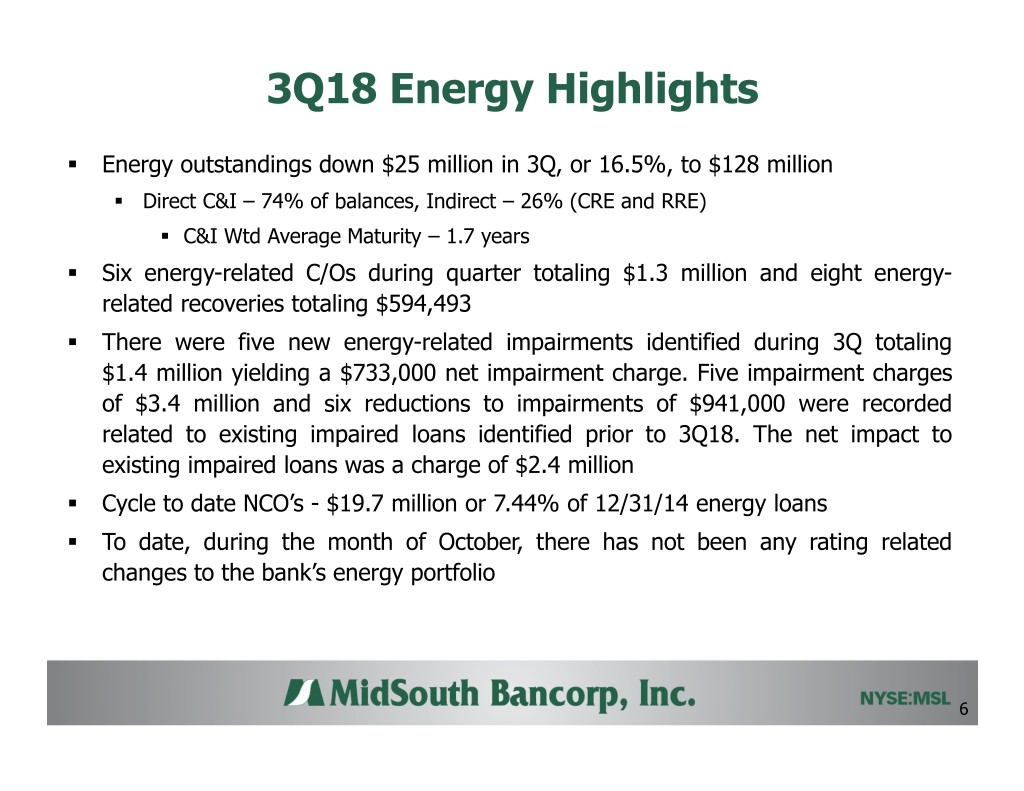
3Q18 Energy Highlights ° Energy outstandings down $25 million in 3Q, or 16.5%, to $128 million ° Direct C&I – 74% of balances, Indirect – 26% (CRE and RRE) ° C&I Wtd Average Maturity – 1.7 years ° Six energy-related C/Os during quarter totaling $1.3 million and eight energy- related recoveries totaling $594,493 ° There were five new energy-related impairments identified during 3Q totaling $1.4 million yielding a $733,000 net impairment charge. Five impairment charges of $3.4 million and six reductions to impairments of $941,000 were recorded related to existing impaired loans identified prior to 3Q18. The net impact to existing impaired loans was a charge of $2.4 million ° Cycle to date NCO’s - $19.7 million or 7.44% of 12/31/14 energy loans ° To date, during the month of October, there has not been any rating related changes to the bank’s energy portfolio 6
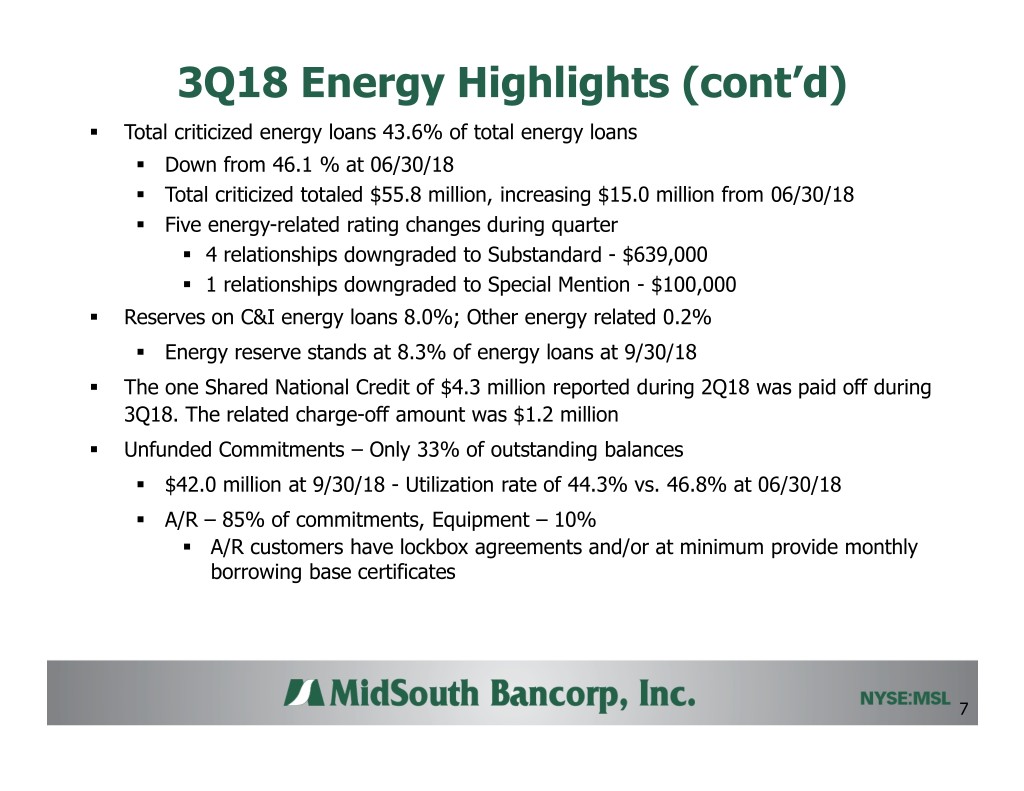
3Q18 Energy Highlights (cont’d) ° Total criticized energy loans 43.6% of total energy loans ° Down from 46.1 % at 06/30/18 ° Total criticized totaled $55.8 million, increasing $15.0 million from 06/30/18 ° Five energy-related rating changes during quarter ° 4 relationships downgraded to Substandard - $639,000 ° 1 relationships downgraded to Special Mention - $100,000 ° Reserves on C&I energy loans 8.0%; Other energy related 0.2% ° Energy reserve stands at 8.3% of energy loans at 9/30/18 ° The one Shared National Credit of $4.3 million reported during 2Q18 was paid off during 3Q18. The related charge-off amount was $1.2 million ° Unfunded Commitments – Only 33% of outstanding balances ° $42.0 million at 9/30/18 - Utilization rate of 44.3% vs. 46.8% at 06/30/18 ° A/R – 85% of commitments, Equipment – 10% ° A/R customers have lockbox agreements and/or at minimum provide monthly borrowing base certificates 7
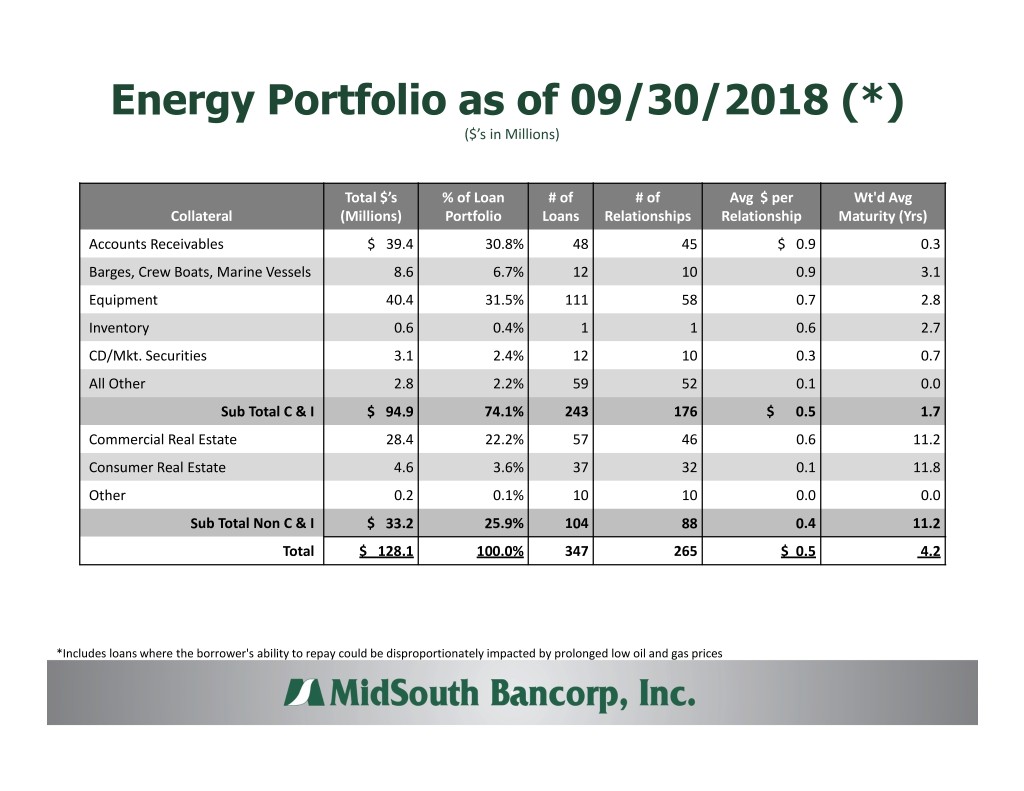
Energy Portfolio as of 09/30/2018 (*) ($’s in Millions) Total $’s % of Loan # of # of Avg $ per Wt'd Avg Collateral (Millions) Portfolio Loans Relationships Relationship Maturity (Yrs) Accounts Receivables $ 39.4 30.8% 48 45 $ 0.9 0.3 Barges, Crew Boats, Marine Vessels 8.6 6.7% 12 10 0.9 3.1 Equipment 40.4 31.5% 111 58 0.7 2.8 Inventory 0.6 0.4% 1 1 0.6 2.7 CD/Mkt. Securities 3.1 2.4% 12 10 0.3 0.7 All Other 2.8 2.2% 59 52 0.1 0.0 Sub Total C & I $ 94.9 74.1% 243 176 $ 0.5 1.7 Commercial Real Estate 28.4 22.2% 57 46 0.6 11.2 Consumer Real Estate 4.6 3.6% 37 32 0.1 11.8 Other 0.2 0.1% 10 10 0.0 0.0 Sub Total Non C & I $ 33.2 25.9% 104 88 0.4 11.2 Total $ 128.1 100.0% 347 265 $ 0.5 4.2 *Includes loans where the borrower's ability to repay could be disproportionately impacted by prolonged low oil and gas prices
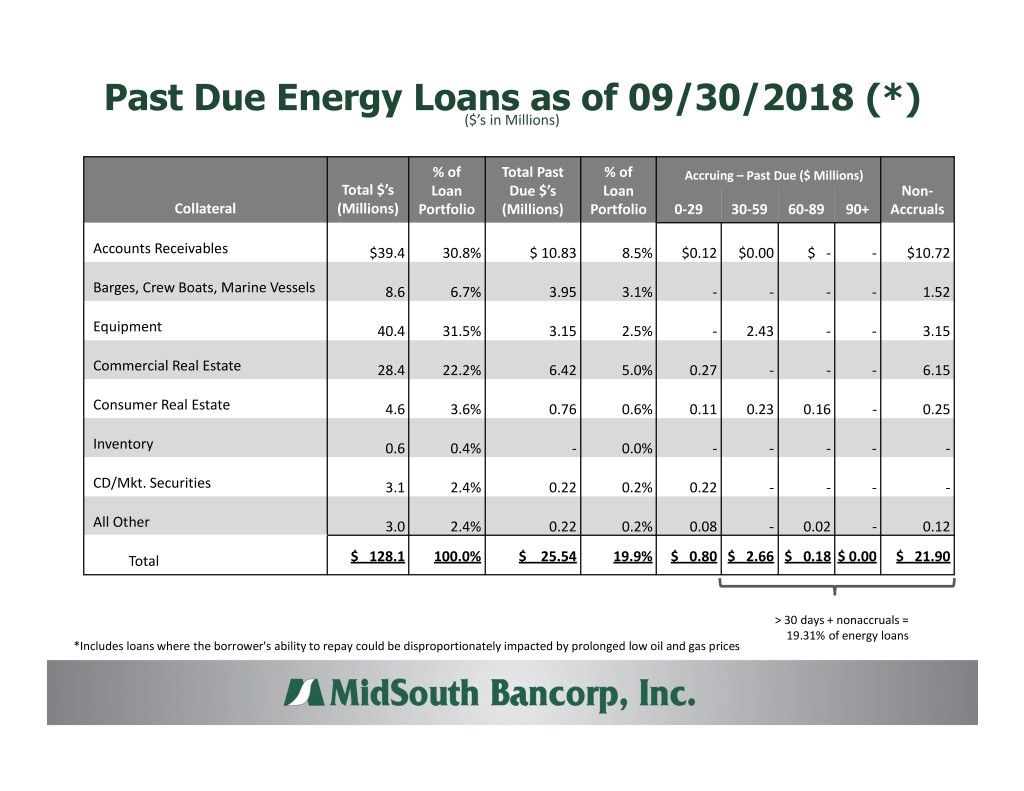
Past Due Energy Loans as of 09/30/2018 (*) ($’s in Millions) % of Total Past % of Accruing – Past Due ($ Millions) Total $’s Loan Due $’s Loan Non- Collateral (Millions) Portfolio (Millions) Portfolio 0-29 30-59 60-89 90+ Accruals Accounts Receivables $39.4 30.8% $ 10.83 8.5% $0.12 $0.00 $ - - $10.72 Barges, Crew Boats, Marine Vessels 8.6 6.7% 3.95 3.1% - - - - 1.52 Equipment 40.4 31.5% 3.15 2.5% - 2.43 - - 3.15 Commercial Real Estate 28.4 22.2% 6.42 5.0% 0.27 - - - 6.15 Consumer Real Estate 4.6 3.6% 0.76 0.6% 0.11 0.23 0.16 - 0.25 Inventory 0.6 0.4% - 0.0% - - - - - CD/Mkt. Securities 3.1 2.4% 0.22 0.2% 0.22 - - - - All Other 3.0 2.4% 0.22 0.2% 0.08 - 0.02 - 0.12 Total $ 128.1 100.0% $ 25.54 19.9% $ 0.80 $ 2.66 $ 0.18 $ 0.00 $ 21.90 > 30 days + nonaccruals = 19.31% of energy loans *Includes loans where the borrower's ability to repay could be disproportionately impacted by prolonged low oil and gas prices
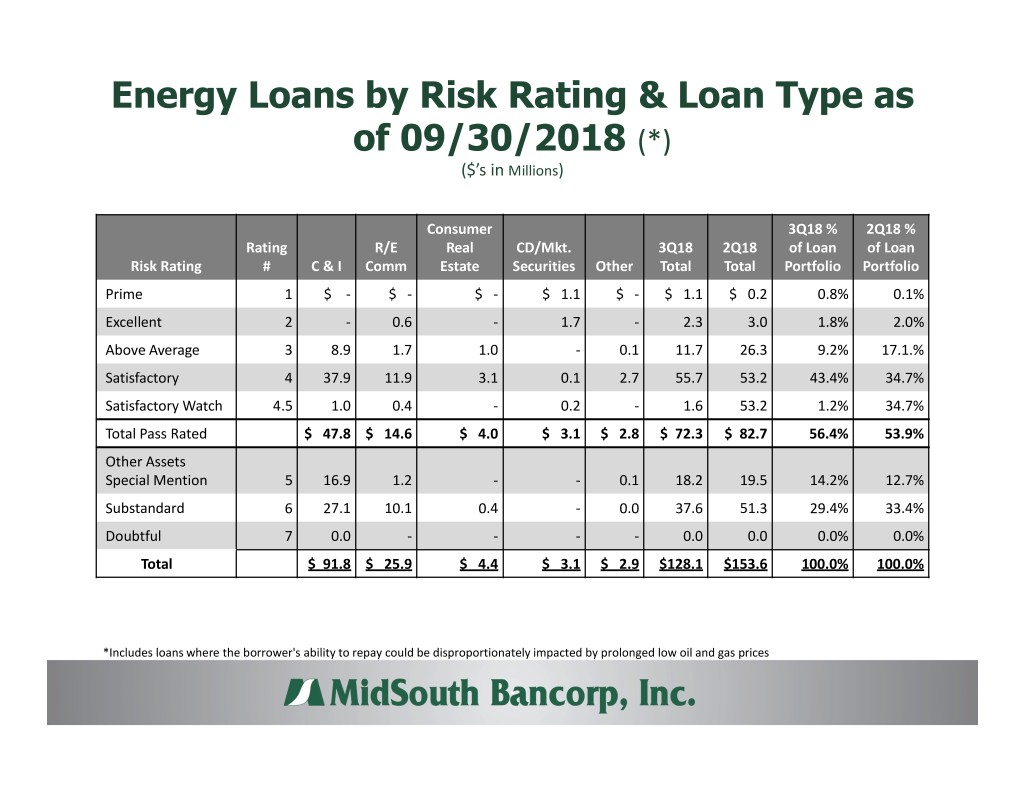
Energy Loans by Risk Rating & Loan Type as of 09/30/2018 (*) ($’s in Millions ) Consumer 3Q18 % 2Q18 % Rating R/E Real CD/Mkt. 3Q18 2Q18 of Loan of Loan Risk Rating # C & I Comm Estate Securities Other Total Total Portfolio Portfolio Prime 1 $ - $ - $ - $ 1.1 $ - $ 1.1 $ 0.2 0.8% 0.1% Excellent 2 - 0.6 - 1.7 - 2.3 3.0 1.8% 2.0% Above Average 3 8.9 1.7 1.0 - 0.1 11.7 26.3 9.2% 17.1.% Satisfactory 4 37.9 11.9 3.1 0.1 2.7 55.7 53.2 43.4% 34.7% Satisfactory Watch 4.5 1.0 0.4 - 0.2 - 1.6 53.2 1.2% 34.7% Total Pass Rated $ 47.8 $ 14.6 $ 4.0 $ 3.1 $ 2.8 $ 72.3 $ 82.7 56.4% 53.9% Other Assets Special Mention 5 16.9 1.2 - - 0.1 18.2 19.5 14.2% 12.7% Substandard 6 27.1 10.1 0.4 - 0.0 37.6 51.3 29.4% 33.4% Doubtful 7 0.0 - - - - 0.0 0.0 0.0% 0.0% Total $ 91.8 $ 25.9 $ 4.4 $ 3.1 $ 2.9 $128.1 $153.6 100.0% 100.0% *Includes loans where the borrower's ability to repay could be disproportionately impacted by prolonged low oil and gas prices
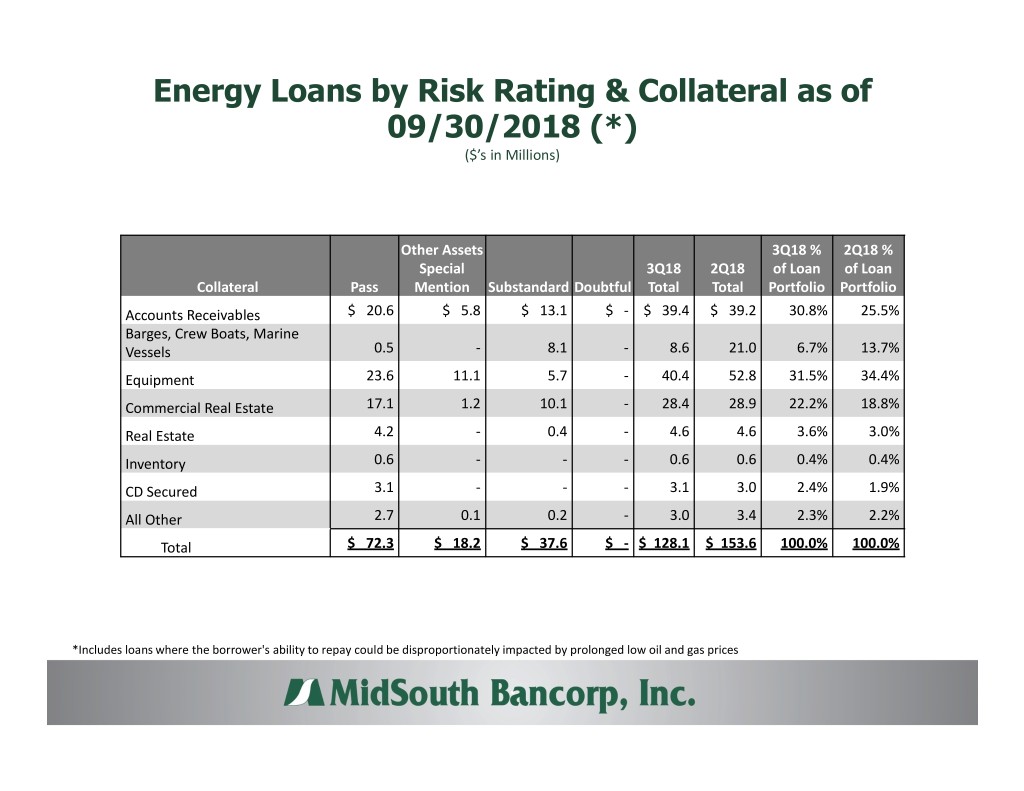
Energy Loans by Risk Rating & Collateral as of 09/30/2018 (*) ($’s in Millions) Other Assets 3Q18 % 2Q18 % Special 3Q18 2Q18 of Loan of Loan Collateral Pass Mention Substandard Doubtful Total Total Portfolio Portfolio Accounts Receivables $ 20.6 $ 5.8 $ 13.1 $ - $ 39.4 $ 39.2 30.8% 25.5% Barges, Crew Boats, Marine Vessels 0.5 - 8.1 - 8.6 21.0 6.7% 13.7% Equipment 23.6 11.1 5.7 - 40.4 52.8 31.5% 34.4% Commercial Real Estate 17.1 1.2 10.1 - 28.4 28.9 22.2% 18.8% Real Estate 4.2 - 0.4 - 4.6 4.6 3.6% 3.0% Inventory 0.6 - - - 0.6 0.6 0.4% 0.4% CD Secured 3.1 - - - 3.1 3.0 2.4% 1.9% All Other 2.7 0.1 0.2 - 3.0 3.4 2.3% 2.2% Total $ 72.3 $ 18.2 $ 37.6 $ - $ 128.1 $ 153.6 100.0% 100.0% *Includes loans where the borrower's ability to repay could be disproportionately impacted by prolonged low oil and gas prices
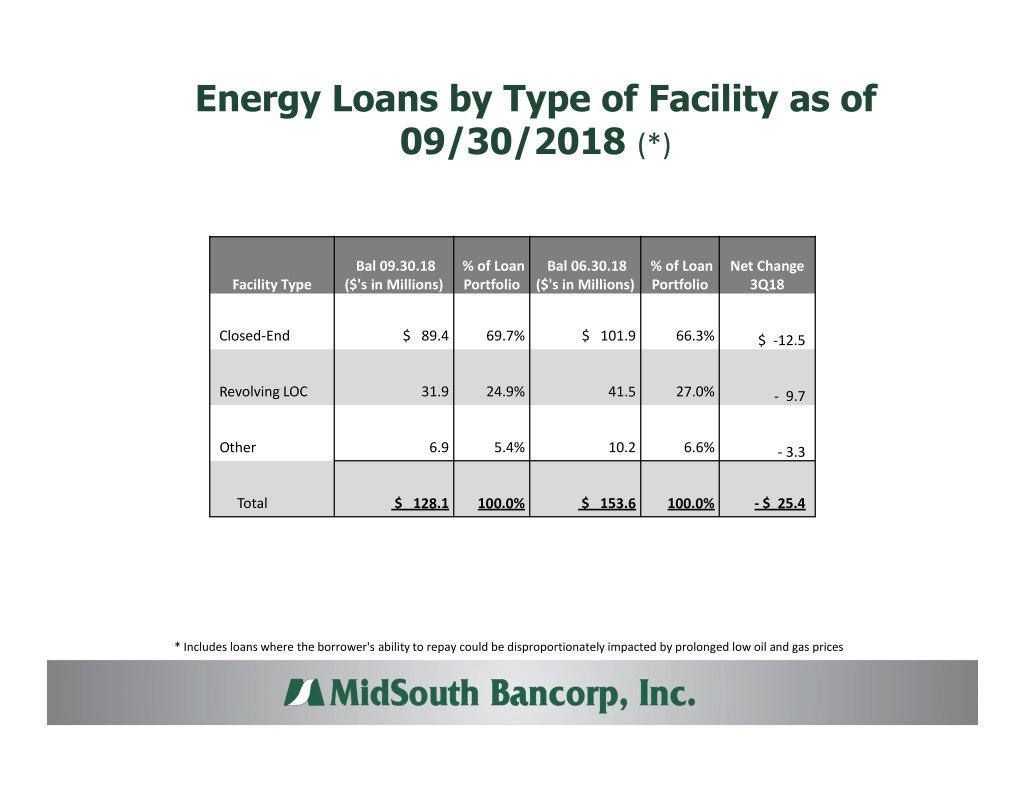
Energy Loans by Type of Facility as of 09/30/2018 (*) Bal 09.30.18 % of Loan Bal 06.30.18 % of Loan Net Change Facility Type ($'s in Millions) Portfolio ($'s in Millions) Portfolio 3Q18 Closed-End $ 89.4 69.7% $ 101.9 66.3% $ -12.5 Revolving LOC 31.9 24.9% 41.5 27.0% - 9.7 Other 6.9 5.4% 10.2 6.6% - 3.3 Total $ 128.1 100.0% $ 153.6 100.0% - $ 25.4 * Includes loans where the borrower's ability to repay could be disproportionately impacted by prolonged low oil and gas prices
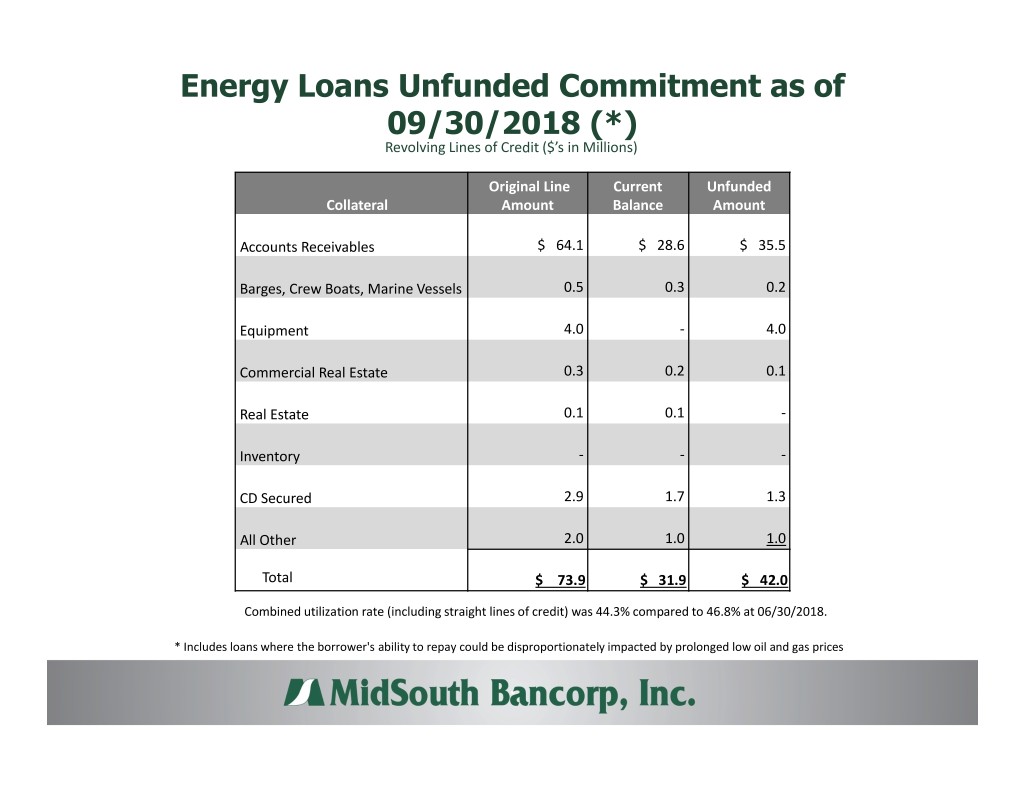
Energy Loans Unfunded Commitment as of 09/30/2018 (*) Revolving Lines of Credit ($’s in Millions) Original Line Current Unfunded Collateral Amount Balance Amount Accounts Receivables $ 64.1 $ 28.6 $ 35.5 Barges, Crew Boats, Marine Vessels 0.5 0.3 0.2 Equipment 4.0 - 4.0 Commercial Real Estate 0.3 0.2 0.1 Real Estate 0.1 0.1 - Inventory - - - CD Secured 2.9 1.7 1.3 All Other 2.0 1.0 1.0 Total $ 73.9 $ 31.9 $ 42.0 Combined utilization rate (including straight lines of credit) was 44.3% compared to 46.8% at 06/30/2018. * Includes loans where the borrower's ability to repay could be disproportionately impacted by prolonged low oil and gas prices
