Attached files
| file | filename |
|---|---|
| EX-99.2 - EXHIBIT 99.2 - INDEPENDENT BANK CORP /MI/ | ex99_2.htm |
| EX-99.1 - EXHIBIT 99.1 - INDEPENDENT BANK CORP /MI/ | ex99_1.htm |
| 8-K - 8-K - INDEPENDENT BANK CORP /MI/ | form8k.htm |
Exhibit 99.3

2 Cautionary Note Regarding Forward-Looking Statements This presentation may contain
“forward-looking statements” within the meaning of the U.S. Private Securities Litigation Reform Act of 1995. Any statements that are not historical facts, including statements about our expectations, beliefs, plans, strategies, predictions,
forecasts, objectives, or assumptions of future events or performance, may be forward-looking. These statements are often, but not always, made through the use of words or phrases such as “anticipates,” “believes,” “expects,” “can,” “could,”
“may,” “predicts,” “potential,” “opportunity,” “should,” “will,” “estimate,” “plans,” “projects,” “continuing,” “ongoing,” “expects,” “seeks,” “intends” and similar words or phrases. Accordingly, these statements involve estimates, known and
unknown risks, assumptions, and uncertainties that could cause actual strategies, actions, or results to differ materially from those expressed in them, and are not guarantees of timing, future results, events, or performance. Because
forward-looking statements are necessarily only estimates of future strategies, actions, or results, based on management’s current expectations, assumptions, and estimates on the date hereof, there can be no assurance that actual strategies,
actions or results will not differ materially from expectations. Therefore, readers are cautioned not to place undue reliance on such statements. Factors that could cause or contribute to such differences are changes in general economic,
political or industry conditions; changes in monetary and fiscal policies, including the interest rate policies of the Federal Reserve Board; volatility and disruptions in capital and credit markets; the interdependence of financial service
companies; changes in regulation or oversight; unfavorable developments concerning credit quality; any future acquisitions or divestitures; the effects of more stringent capital or liquidity requirements; declines or other changes in the
businesses or industries of Independent Bank Corporation's customers; the implementation of Independent Bank Corporation's strategies and business models; Independent Bank Corporation's ability to utilize technology to efficiently and
effectively develop, market and deliver new products and services; operational difficulties, failure of technology infrastructure or information security incidents; changes in the financial markets, including fluctuations in interest rates
and their impact on deposit pricing; competitive product and pricing pressures among financial institutions within Independent Bank Corporation's markets; changes in customer behavior; management's ability to maintain and expand customer
relationships; management's ability to retain key officers and employees; the impact of legal and regulatory proceedings or determinations; the effectiveness of methods of reducing risk exposures; the effects of terrorist activities and other
hostilities; the effects of catastrophic events; changes in accounting standards and the critical nature of Independent Bank Corporation's accounting policies. In addition, factors that may cause actual results to differ from expectations
regarding the recent acquisition of TCSB Bancorp, Inc. include, but are not limited to, the reaction to the transaction of customers, employees and counterparties; customer disintermediation; inflation; expected synergies, cost savings and
other financial benefits of the transaction might not be realized within the expected timeframes or might be less than projected; credit and interest rate risks associated with the parties' respective businesses, customers, borrowings,
repayment, investment, and deposit practices; general economic conditions, either nationally or in the market areas in which the parties operate or anticipate doing business, are less favorable than expected; new regulatory or legal
requirements or obligations; and other risks. Certain risks and important factors that could affect Independent Bank Corporation's future results are identified in its Annual Report on Form 10-K for the year ended December 31, 2017 and other
reports filed with the SEC, including among other things under the heading “Risk Factors” in such Annual Report on Form 10-K. Any forward-looking statement speaks only as of the date on which it is made, and Independent Bank Corporation
undertakes no obligation to update any forward-looking statement, whether to reflect events or circumstances after the date on which the statement is made, to reflect new information or the occurrence of unanticipated events, or otherwise.
3 Agenda Formal Remarks.William B. (Brad) Kessel, President and Chief Executive OfficerRobert N.
Shuster, Executive Vice President and Chief Financial OfficerQuestion and Answer session.Closing Remarks.Note: This presentation is available at www.IndependentBank.com in the Investor Relations area under the “Presentations” tab.
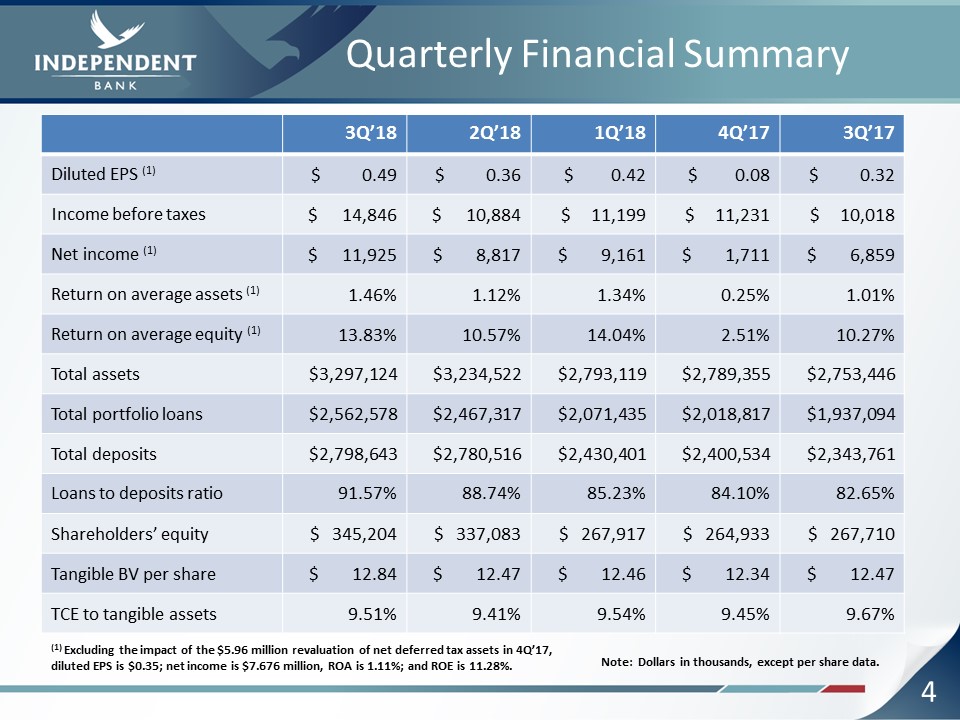
4 Quarterly Financial Summary 3Q’18 2Q’18 1Q’18 4Q’17 3Q’17 Diluted EPS (1) $ 0.49 $
0.36 $ 0.42 $ 0.08 $ 0.32 Income before taxes $ 14,846 $ 10,884 $ 11,199 $ 11,231 $ 10,018 Net income (1) $ 11,925 $ 8,817 $ 9,161 $ 1,711 $ 6,859 Return on average assets (1) 1.46% 1.12% 1.34% 0.25% 1.01% Return on
average equity (1) 13.83% 10.57% 14.04% 2.51% 10.27% Total assets $3,297,124 $3,234,522 $2,793,119 $2,789,355 $2,753,446 Total portfolio loans $2,562,578 $2,467,317 $2,071,435 $2,018,817 $1,937,094 Total
deposits $2,798,643 $2,780,516 $2,430,401 $2,400,534 $2,343,761 Loans to deposits ratio 91.57% 88.74% 85.23% 84.10% 82.65% Shareholders’ equity $ 345,204 $ 337,083 $ 267,917 $ 264,933 $ 267,710 Tangible BV per share $
12.84 $ 12.47 $ 12.46 $ 12.34 $ 12.47 TCE to tangible assets 9.51% 9.41% 9.54% 9.45% 9.67% Note: Dollars in thousands, except per share data. (1) Excluding the impact of the $5.96 million revaluation of net deferred tax assets in
4Q’17, diluted EPS is $0.35; net income is $7.676 million, ROA is 1.11%; and ROE is 11.28%.
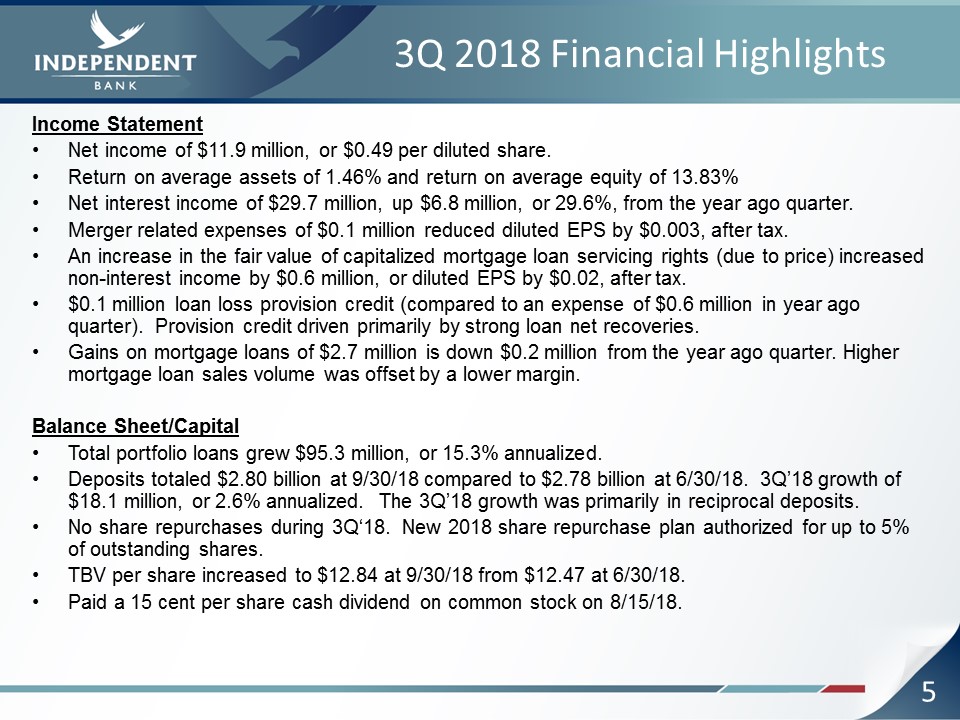
5 3Q 2018 Financial Highlights Income StatementNet income of $11.9 million, or $0.49 per diluted
share. Return on average assets of 1.46% and return on average equity of 13.83%Net interest income of $29.7 million, up $6.8 million, or 29.6%, from the year ago quarter.Merger related expenses of $0.1 million reduced diluted EPS by $0.003,
after tax.An increase in the fair value of capitalized mortgage loan servicing rights (due to price) increased non-interest income by $0.6 million, or diluted EPS by $0.02, after tax.$0.1 million loan loss provision credit (compared to an
expense of $0.6 million in year ago quarter). Provision credit driven primarily by strong loan net recoveries.Gains on mortgage loans of $2.7 million is down $0.2 million from the year ago quarter. Higher mortgage loan sales volume was offset
by a lower margin.Balance Sheet/CapitalTotal portfolio loans grew $95.3 million, or 15.3% annualized. Deposits totaled $2.80 billion at 9/30/18 compared to $2.78 billion at 6/30/18. 3Q’18 growth of $18.1 million, or 2.6% annualized. The 3Q’18
growth was primarily in reciprocal deposits.No share repurchases during 3Q‘18. New 2018 share repurchase plan authorized for up to 5% of outstanding shares. TBV per share increased to $12.84 at 9/30/18 from $12.47 at 6/30/18.Paid a 15 cent
per share cash dividend on common stock on 8/15/18.
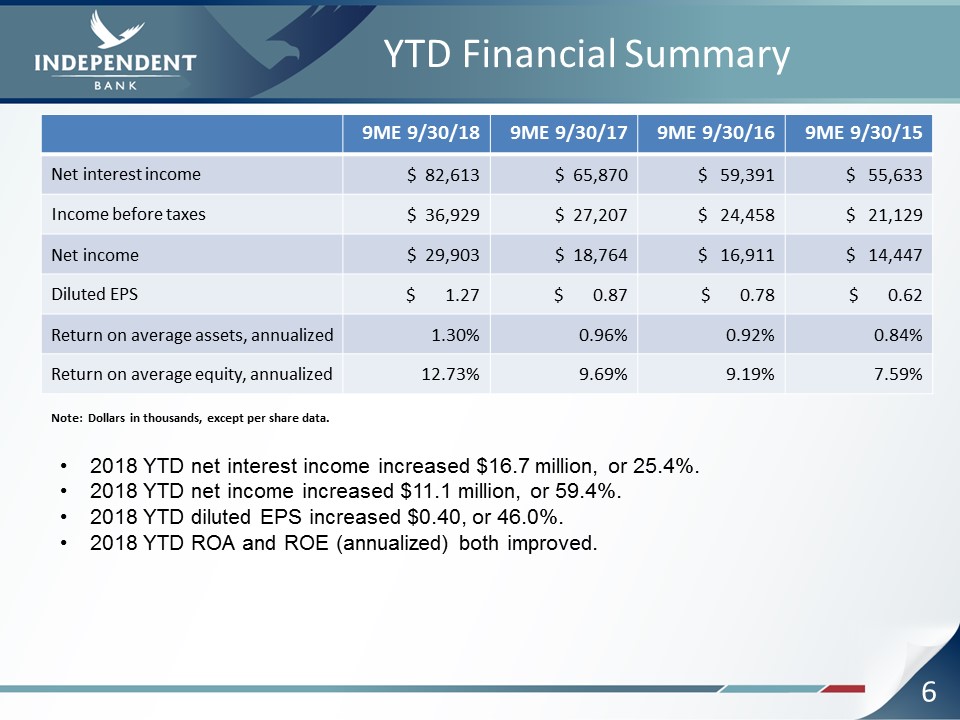
6 YTD Financial Summary 9ME 9/30/18 9ME 9/30/17 9ME 9/30/16 9ME 9/30/15 Net interest
income $ 82,613 $ 65,870 $ 59,391 $ 55,633 Income before taxes $ 36,929 $ 27,207 $ 24,458 $ 21,129 Net income $ 29,903 $ 18,764 $ 16,911 $ 14,447 Diluted EPS $ 1.27 $ 0.87 $ 0.78 $ 0.62 Return on average assets,
annualized 1.30% 0.96% 0.92% 0.84% Return on average equity, annualized 12.73% 9.69% 9.19% 7.59% Note: Dollars in thousands, except per share data. 2018 YTD net interest income increased $16.7 million, or 25.4%.2018 YTD net income
increased $11.1 million, or 59.4%.2018 YTD diluted EPS increased $0.40, or 46.0%.2018 YTD ROA and ROE (annualized) both improved.
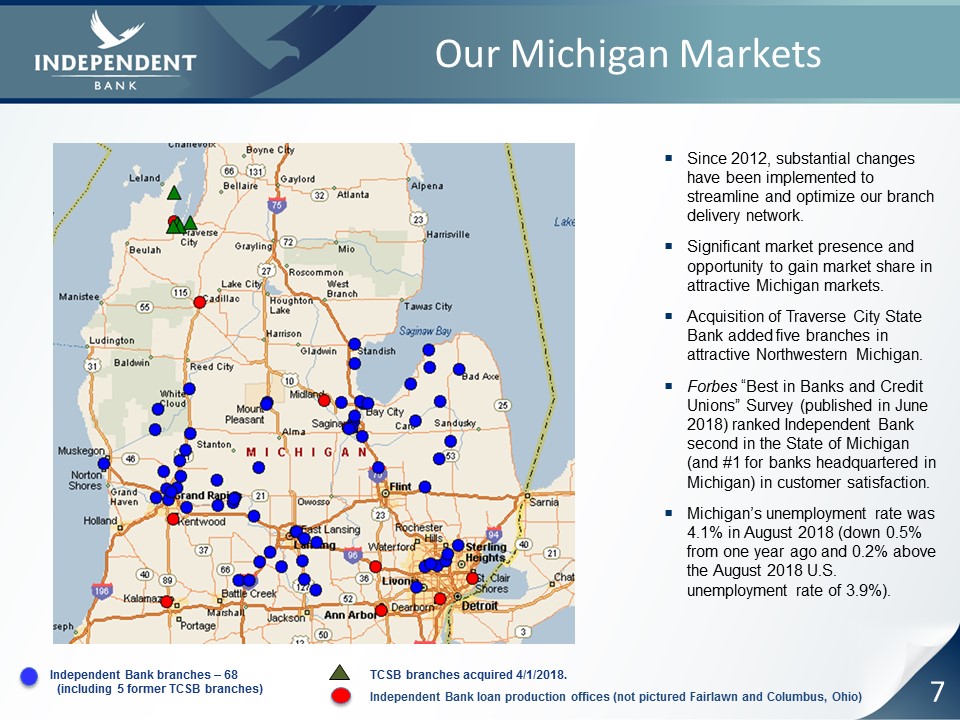
7 Our Michigan Markets Independent Bank branches – 68 (including 5 former TCSB branches) TCSB
branches acquired 4/1/2018. Since 2012, substantial changes have been implemented to streamline and optimize our branch delivery network.Significant market presence and opportunity to gain market share in attractive Michigan
markets.Acquisition of Traverse City State Bank added five branches in attractive Northwestern Michigan.Forbes “Best in Banks and Credit Unions” Survey (published in June 2018) ranked Independent Bank second in the State of Michigan (and #1
for banks headquartered in Michigan) in customer satisfaction.Michigan’s unemployment rate was 4.1% in August 2018 (down 0.5% from one year ago and 0.2% above the August 2018 U.S. unemployment rate of 3.9%). Independent Bank loan
production offices (not pictured Fairlawn and Columbus, Ohio)
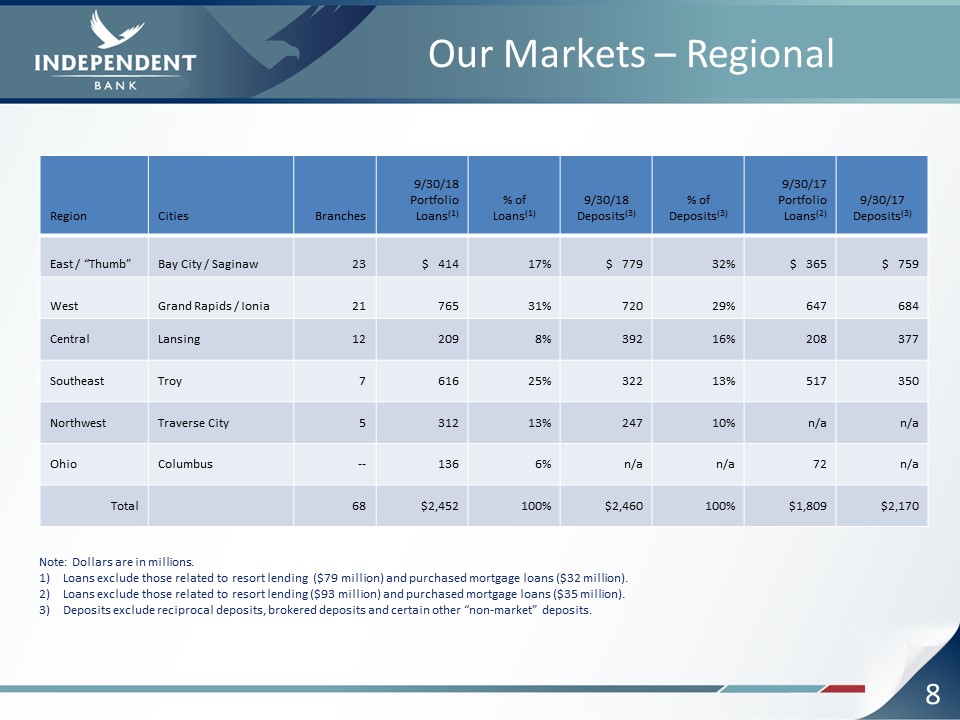
Our Markets – Regional Region Cities Branches 9/30/18Portfolio Loans(1) %
ofLoans(1) 9/30/18Deposits(3) % of Deposits(3) 9/30/17 Portfolio Loans(2) 9/30/17 Deposits(3) East / “Thumb” Bay City / Saginaw 23 $ 414 17% $ 779 32% $ 365 $ 759 West Grand Rapids /
Ionia 21 765 31% 720 29% 647 684 Central Lansing 12 209 8% 392 16% 208 377 Southeast Troy 7 616 25% 322 13% 517 350 Northwest Traverse
City 5 312 13% 247 10% n/a n/a Ohio Columbus -- 136 6% n/a n/a 72 n/a Total 68 $2,452 100% $2,460 100% $1,809 $2,170 Note: Dollars are in millions.Loans exclude those related to resort lending ($79 million) and
purchased mortgage loans ($32 million).Loans exclude those related to resort lending ($93 million) and purchased mortgage loans ($35 million). Deposits exclude reciprocal deposits, brokered deposits and certain other “non-market”
deposits. 8
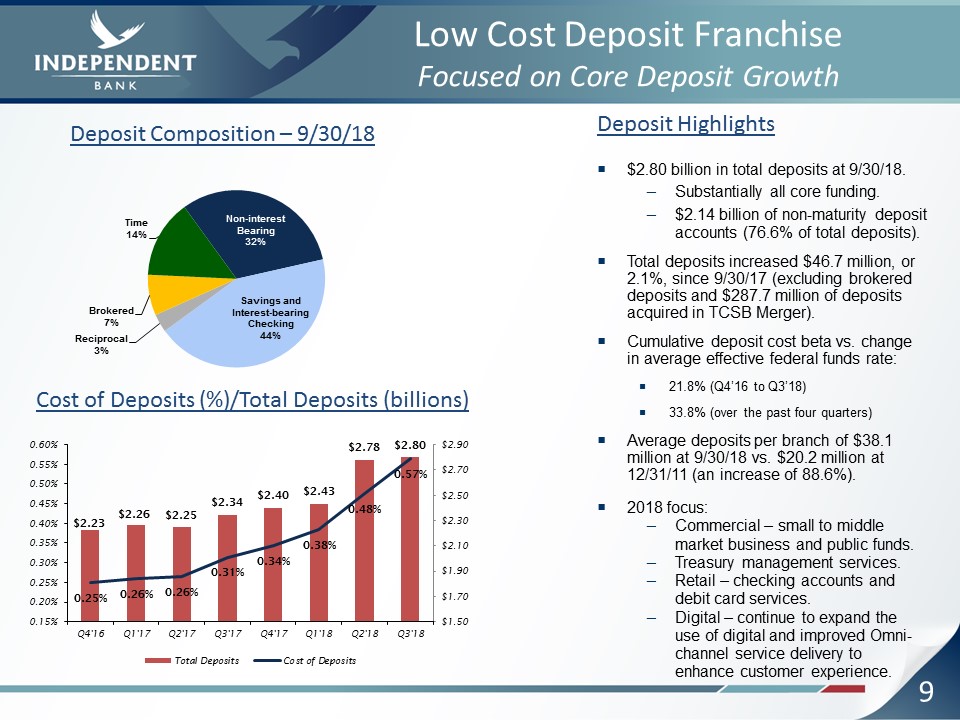
9 Low Cost Deposit Franchise Focused on Core Deposit Growth Deposit Highlights$2.80 billion in total
deposits at 9/30/18.Substantially all core funding.$2.14 billion of non-maturity deposit accounts (76.6% of total deposits).Total deposits increased $46.7 million, or 2.1%, since 9/30/17 (excluding brokered deposits and $287.7 million of
deposits acquired in TCSB Merger).Cumulative deposit cost beta vs. change in average effective federal funds rate: 21.8% (Q4’16 to Q3’18)33.8% (over the past four quarters)Average deposits per branch of $38.1 million at 9/30/18 vs. $20.2
million at 12/31/11 (an increase of 88.6%).2018 focus:Commercial – small to middle market business and public funds.Treasury management services.Retail – checking accounts and debit card services.Digital – continue to expand the use of
digital and improved Omni-channel service delivery to enhance customer experience. Deposit Composition – 9/30/18 Cost of Deposits (%)/Total Deposits (billions)
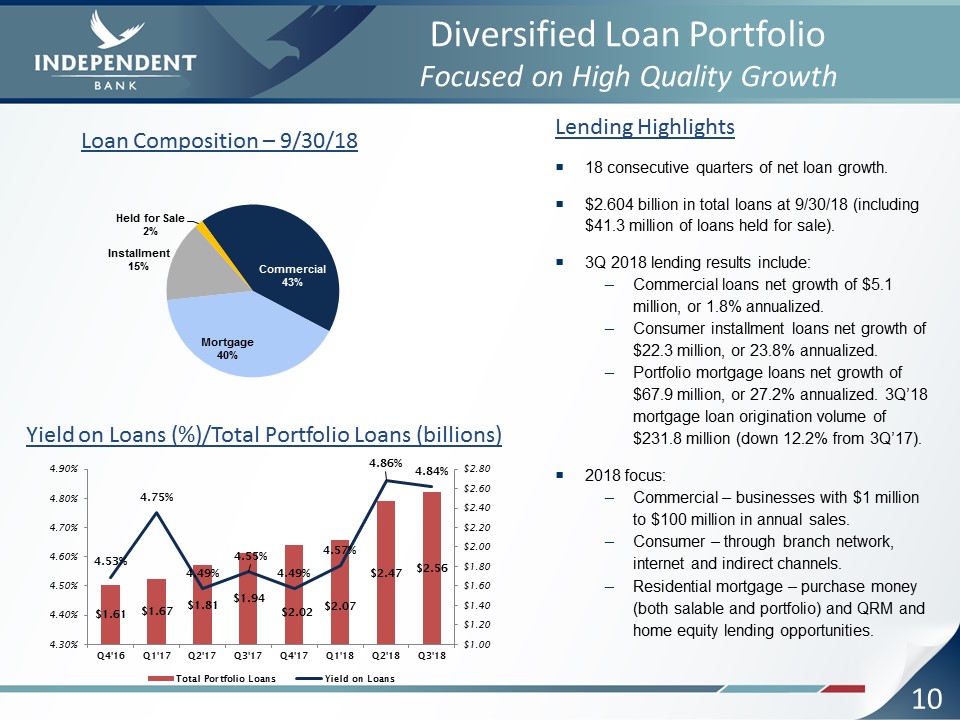
Diversified Loan PortfolioFocused on High Quality Growth Lending Highlights18 consecutive quarters of
net loan growth.$2.604 billion in total loans at 9/30/18 (including $41.3 million of loans held for sale).3Q 2018 lending results include:Commercial loans net growth of $5.1 million, or 1.8% annualized.Consumer installment loans net growth of
$22.3 million, or 23.8% annualized.Portfolio mortgage loans net growth of $67.9 million, or 27.2% annualized. 3Q’18 mortgage loan origination volume of $231.8 million (down 12.2% from 3Q’17).2018 focus:Commercial – businesses with $1 million
to $100 million in annual sales.Consumer – through branch network, internet and indirect channels.Residential mortgage – purchase money (both salable and portfolio) and QRM and home equity lending opportunities. Loan Composition –
9/30/18 Yield on Loans (%)/Total Portfolio Loans (billions) 10
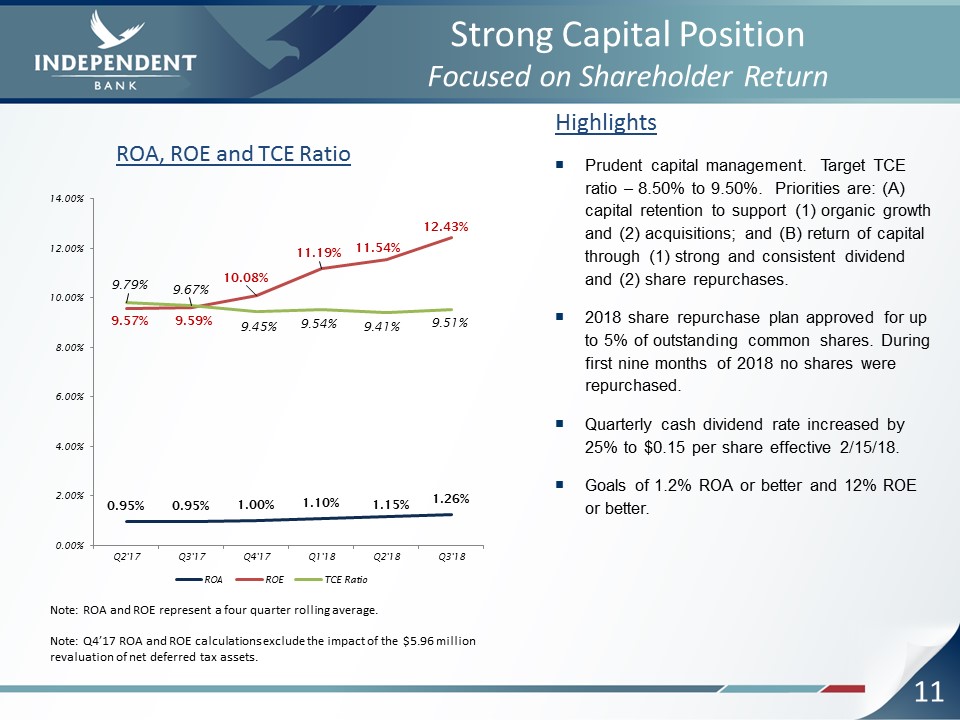
11 Strong Capital PositionFocused on Shareholder Return HighlightsPrudent capital management. Target
TCE ratio – 8.50% to 9.50%. Priorities are: (A) capital retention to support (1) organic growth and (2) acquisitions; and (B) return of capital through (1) strong and consistent dividend and (2) share repurchases.2018 share repurchase plan
approved for up to 5% of outstanding common shares. During first nine months of 2018 no shares were repurchased. Quarterly cash dividend rate increased by 25% to $0.15 per share effective 2/15/18.Goals of 1.2% ROA or better and 12% ROE or
better. Note: ROA and ROE represent a four quarter rolling average. ROA, ROE and TCE Ratio Note: Q4’17 ROA and ROE calculations exclude the impact of the $5.96 million revaluation of net deferred tax assets.
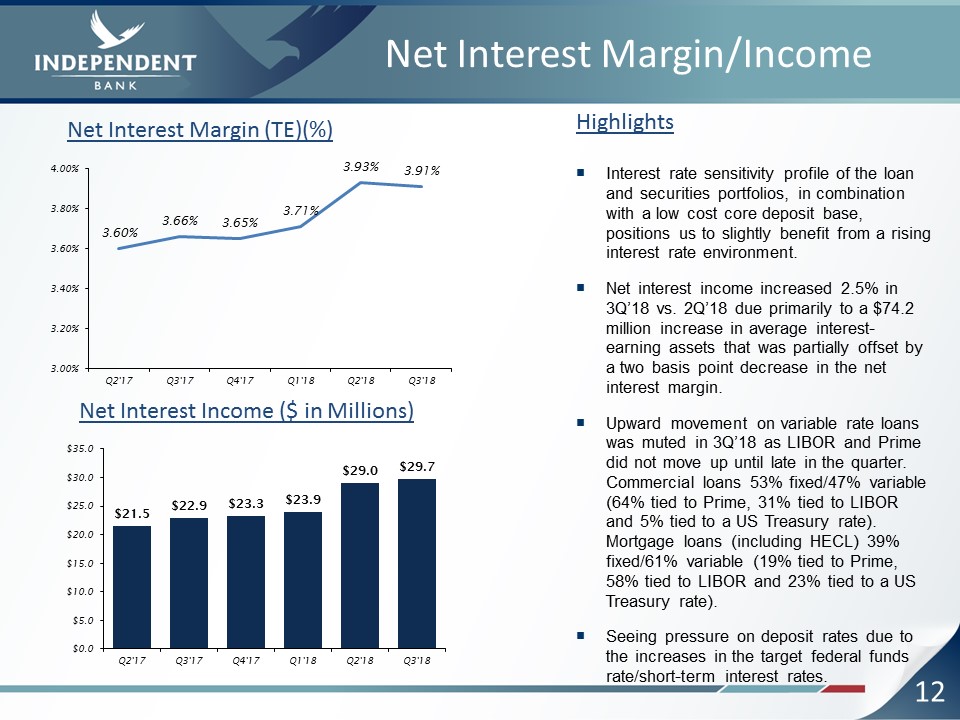
12 Net Interest Margin/Income HighlightsInterest rate sensitivity profile of the loan and securities
portfolios, in combination with a low cost core deposit base, positions us to slightly benefit from a rising interest rate environment.Net interest income increased 2.5% in 3Q’18 vs. 2Q’18 due primarily to a $74.2 million increase in average
interest-earning assets that was partially offset by a two basis point decrease in the net interest margin.Upward movement on variable rate loans was muted in 3Q’18 as LIBOR and Prime did not move up until late in the quarter. Commercial
loans 53% fixed/47% variable (64% tied to Prime, 31% tied to LIBOR and 5% tied to a US Treasury rate). Mortgage loans (including HECL) 39% fixed/61% variable (19% tied to Prime, 58% tied to LIBOR and 23% tied to a US Treasury rate). Seeing
pressure on deposit rates due to the increases in the target federal funds rate/short-term interest rates. Net Interest Margin (TE)(%) Net Interest Income ($ in Millions)
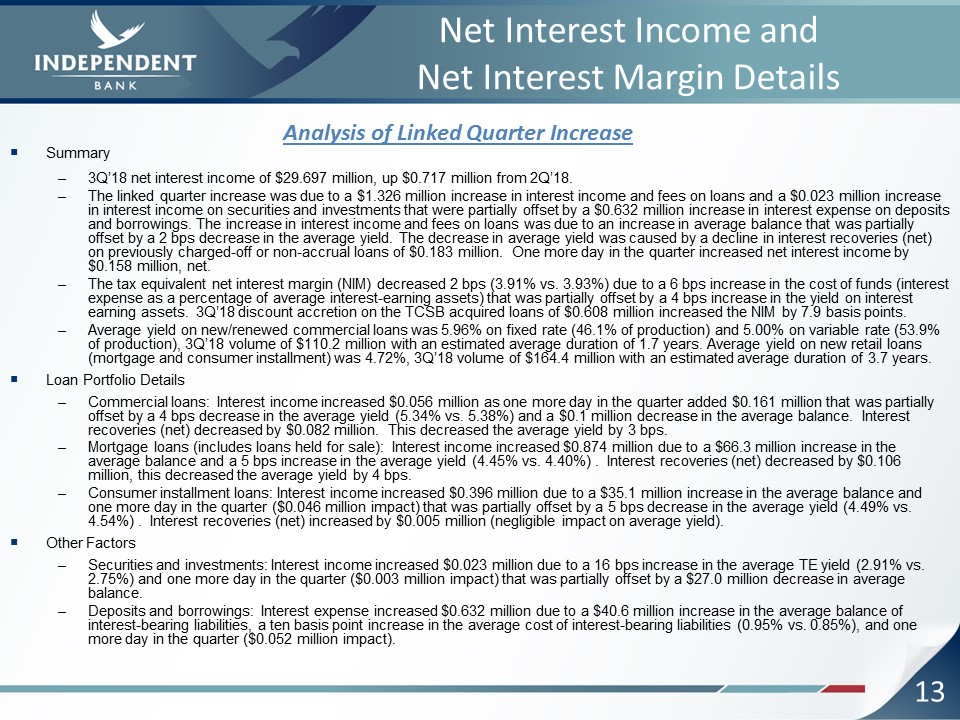
13 Net Interest Income and Net Interest Margin Details Summary3Q’18 net interest income of $29.697
million, up $0.717 million from 2Q’18. The linked quarter increase was due to a $1.326 million increase in interest income and fees on loans and a $0.023 million increase in interest income on securities and investments that were partially
offset by a $0.632 million increase in interest expense on deposits and borrowings. The increase in interest income and fees on loans was due to an increase in average balance that was partially offset by a 2 bps decrease in the average
yield. The decrease in average yield was caused by a decline in interest recoveries (net) on previously charged-off or non-accrual loans of $0.183 million. One more day in the quarter increased net interest income by $0.158 million, net. The
tax equivalent net interest margin (NIM) decreased 2 bps (3.91% vs. 3.93%) due to a 6 bps increase in the cost of funds (interest expense as a percentage of average interest-earning assets) that was partially offset by a 4 bps increase in the
yield on interest earning assets. 3Q’18 discount accretion on the TCSB acquired loans of $0.608 million increased the NIM by 7.9 basis points. Average yield on new/renewed commercial loans was 5.96% on fixed rate (46.1% of production) and
5.00% on variable rate (53.9% of production), 3Q’18 volume of $110.2 million with an estimated average duration of 1.7 years. Average yield on new retail loans (mortgage and consumer installment) was 4.72%, 3Q’18 volume of $164.4 million with
an estimated average duration of 3.7 years.Loan Portfolio DetailsCommercial loans: Interest income increased $0.056 million as one more day in the quarter added $0.161 million that was partially offset by a 4 bps decrease in the average yield
(5.34% vs. 5.38%) and a $0.1 million decrease in the average balance. Interest recoveries (net) decreased by $0.082 million. This decreased the average yield by 3 bps. Mortgage loans (includes loans held for sale): Interest income increased
$0.874 million due to a $66.3 million increase in the average balance and a 5 bps increase in the average yield (4.45% vs. 4.40%) . Interest recoveries (net) decreased by $0.106 million, this decreased the average yield by 4 bps.Consumer
installment loans: Interest income increased $0.396 million due to a $35.1 million increase in the average balance and one more day in the quarter ($0.046 million impact) that was partially offset by a 5 bps decrease in the average yield
(4.49% vs. 4.54%) . Interest recoveries (net) increased by $0.005 million (negligible impact on average yield).Other FactorsSecurities and investments: Interest income increased $0.023 million due to a 16 bps increase in the average TE yield
(2.91% vs. 2.75%) and one more day in the quarter ($0.003 million impact) that was partially offset by a $27.0 million decrease in average balance.Deposits and borrowings: Interest expense increased $0.632 million due to a $40.6 million
increase in the average balance of interest-bearing liabilities, a ten basis point increase in the average cost of interest-bearing liabilities (0.95% vs. 0.85%), and one more day in the quarter ($0.052 million impact). Analysis of Linked
Quarter Increase
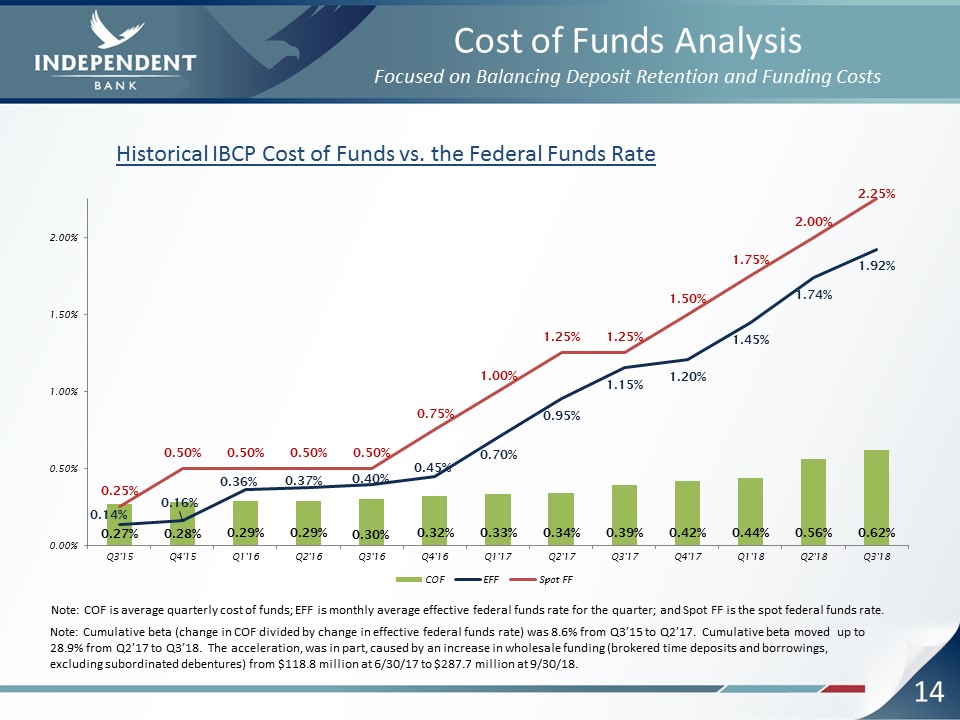
14 Cost of Funds AnalysisFocused on Balancing Deposit Retention and Funding Costs Note: COF is
average quarterly cost of funds; EFF is monthly average effective federal funds rate for the quarter; and Spot FF is the spot federal funds rate. Historical IBCP Cost of Funds vs. the Federal Funds Rate Note: Cumulative beta (change in COF
divided by change in effective federal funds rate) was 8.6% from Q3’15 to Q2’17. Cumulative beta moved up to 28.9% from Q2’17 to Q3’18. The acceleration, was in part, caused by an increase in wholesale funding (brokered time deposits and
borrowings, excluding subordinated debentures) from $118.8 million at 6/30/17 to $287.7 million at 9/30/18.
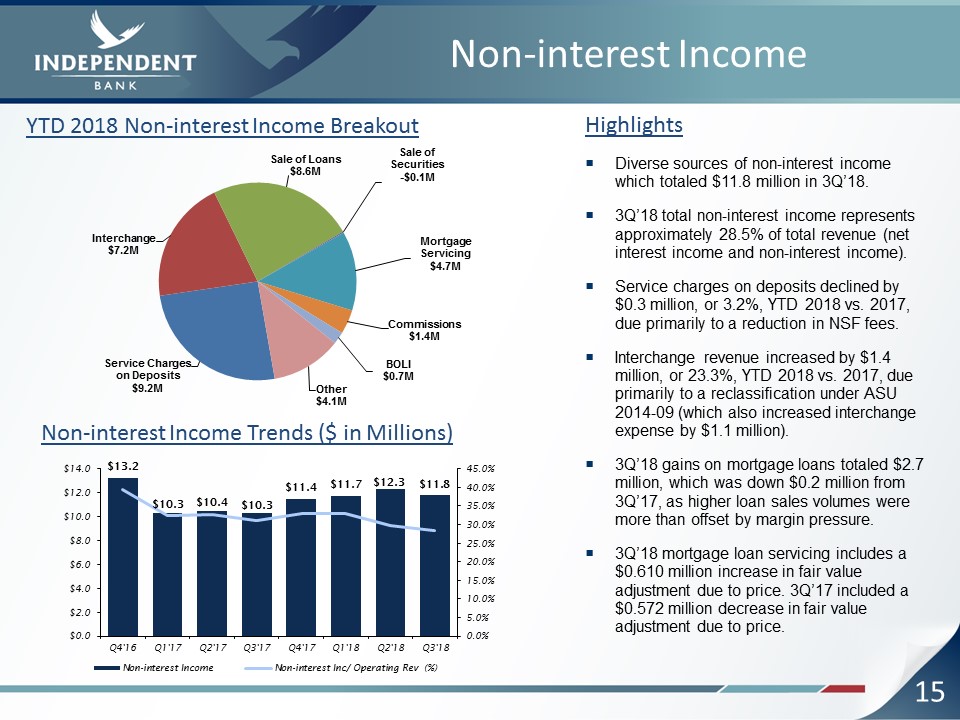
15 Non-interest Income HighlightsDiverse sources of non-interest income which totaled $11.8 million
in 3Q’18.3Q’18 total non-interest income represents approximately 28.5% of total revenue (net interest income and non-interest income).Service charges on deposits declined by $0.3 million, or 3.2%, YTD 2018 vs. 2017, due primarily to a
reduction in NSF fees.Interchange revenue increased by $1.4 million, or 23.3%, YTD 2018 vs. 2017, due primarily to a reclassification under ASU 2014-09 (which also increased interchange expense by $1.1 million).3Q’18 gains on mortgage loans
totaled $2.7 million, which was down $0.2 million from 3Q’17, as higher loan sales volumes were more than offset by margin pressure.3Q’18 mortgage loan servicing includes a $0.610 million increase in fair value adjustment due to price. 3Q’17
included a $0.572 million decrease in fair value adjustment due to price. YTD 2018 Non-interest Income Breakout Non-interest Income Trends ($ in Millions)
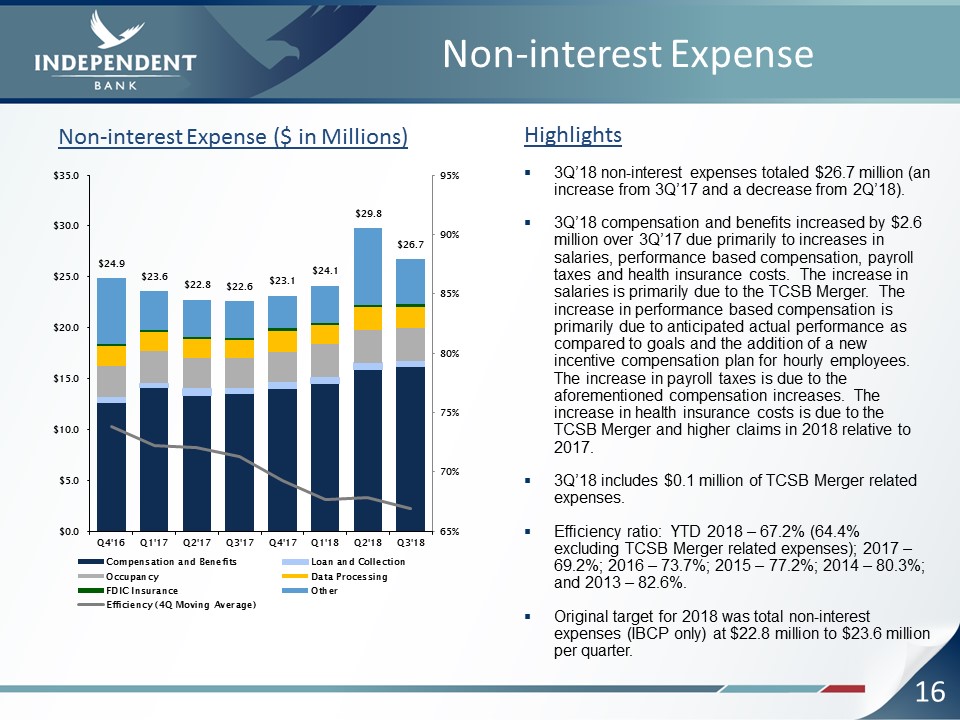
16 Non-interest Expense Highlights3Q’18 non-interest expenses totaled $26.7 million (an increase from
3Q’17 and a decrease from 2Q’18).3Q’18 compensation and benefits increased by $2.6 million over 3Q’17 due primarily to increases in salaries, performance based compensation, payroll taxes and health insurance costs. The increase in salaries
is primarily due to the TCSB Merger. The increase in performance based compensation is primarily due to anticipated actual performance as compared to goals and the addition of a new incentive compensation plan for hourly employees. The
increase in payroll taxes is due to the aforementioned compensation increases. The increase in health insurance costs is due to the TCSB Merger and higher claims in 2018 relative to 2017.3Q’18 includes $0.1 million of TCSB Merger related
expenses. Efficiency ratio: YTD 2018 – 67.2% (64.4% excluding TCSB Merger related expenses); 2017 – 69.2%; 2016 – 73.7%; 2015 – 77.2%; 2014 – 80.3%; and 2013 – 82.6%.Original target for 2018 was total non-interest expenses (IBCP only) at
$22.8 million to $23.6 million per quarter. Non-interest Expense ($ in Millions)
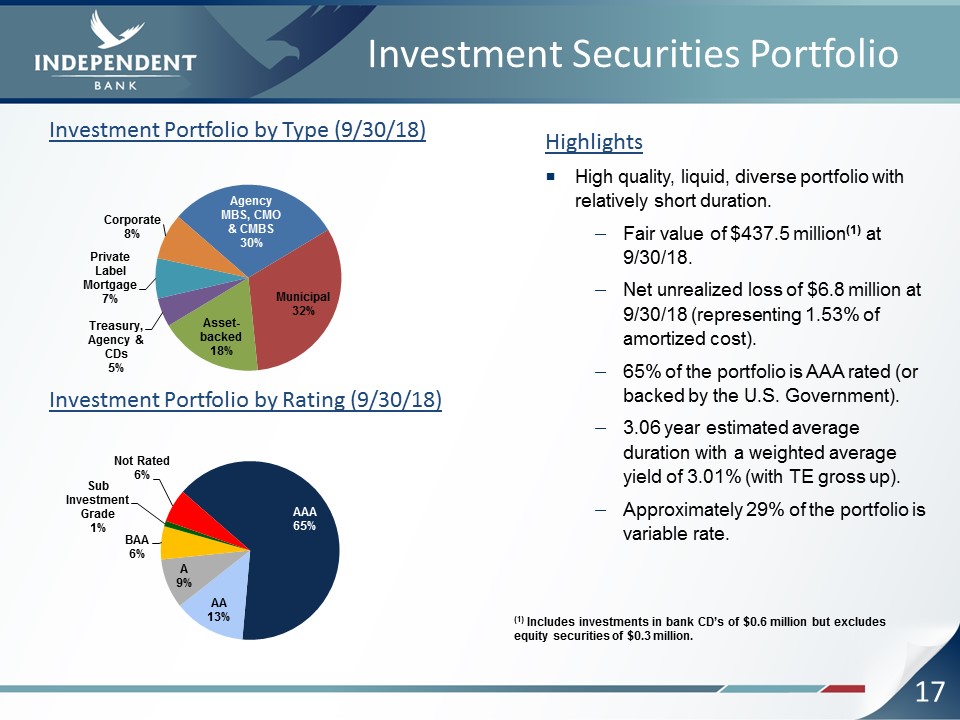
17 Investment Securities Portfolio HighlightsHigh quality, liquid, diverse portfolio with relatively
short duration.Fair value of $437.5 million(1) at 9/30/18.Net unrealized loss of $6.8 million at 9/30/18 (representing 1.53% of amortized cost).65% of the portfolio is AAA rated (or backed by the U.S. Government).3.06 year estimated average
duration with a weighted average yield of 3.01% (with TE gross up).Approximately 29% of the portfolio is variable rate. (1) Includes investments in bank CD’s of $0.6 million but excludes equity securities of $0.3 million. Investment
Portfolio by Type (9/30/18) Investment Portfolio by Rating (9/30/18)
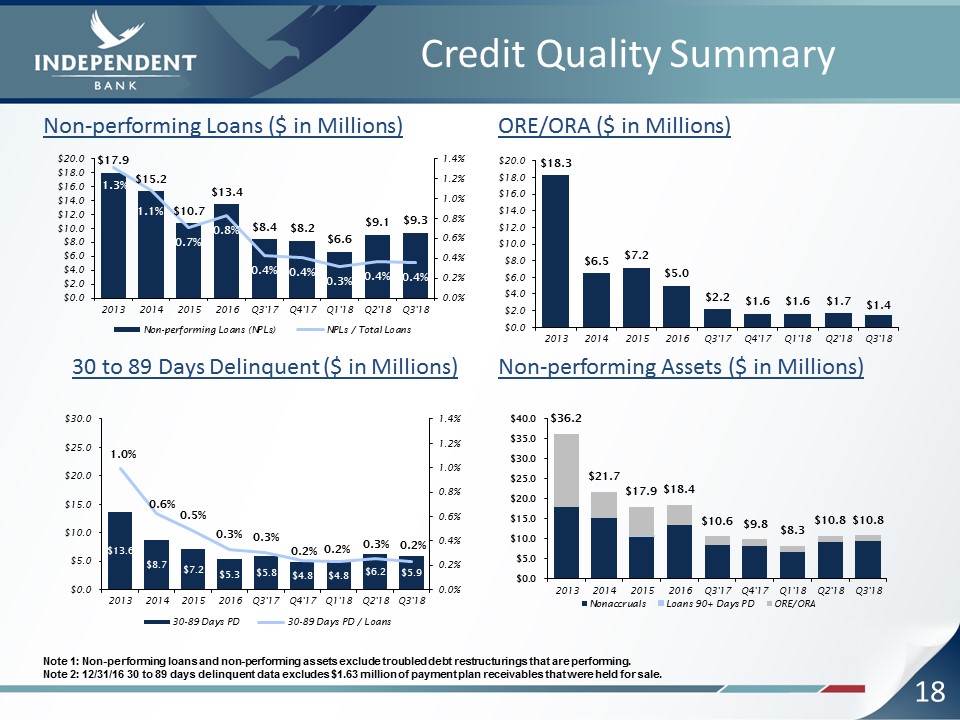
18 Credit Quality Summary Note 1: Non-performing loans and non-performing assets exclude troubled
debt restructurings that are performing.Note 2: 12/31/16 30 to 89 days delinquent data excludes $1.63 million of payment plan receivables that were held for sale. Non-performing Assets ($ in Millions) ORE/ORA ($ in Millions) Non-performing
Loans ($ in Millions) 30 to 89 Days Delinquent ($ in Millions)
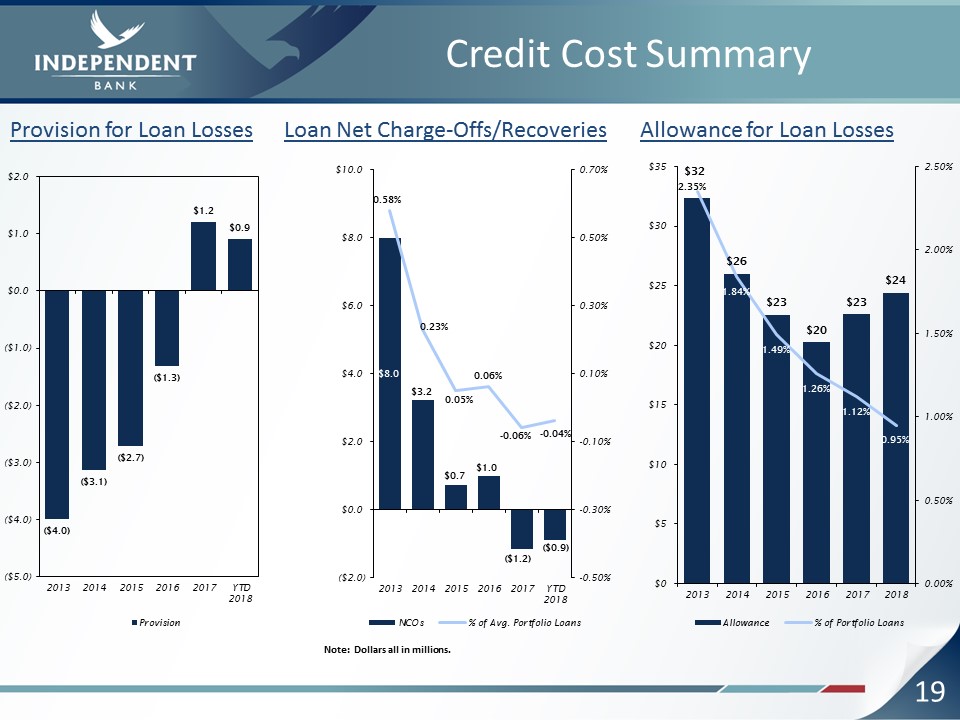
19 Credit Cost Summary Note: Dollars all in millions. Provision for Loan Losses Loan Net
Charge-Offs/Recoveries Allowance for Loan Losses
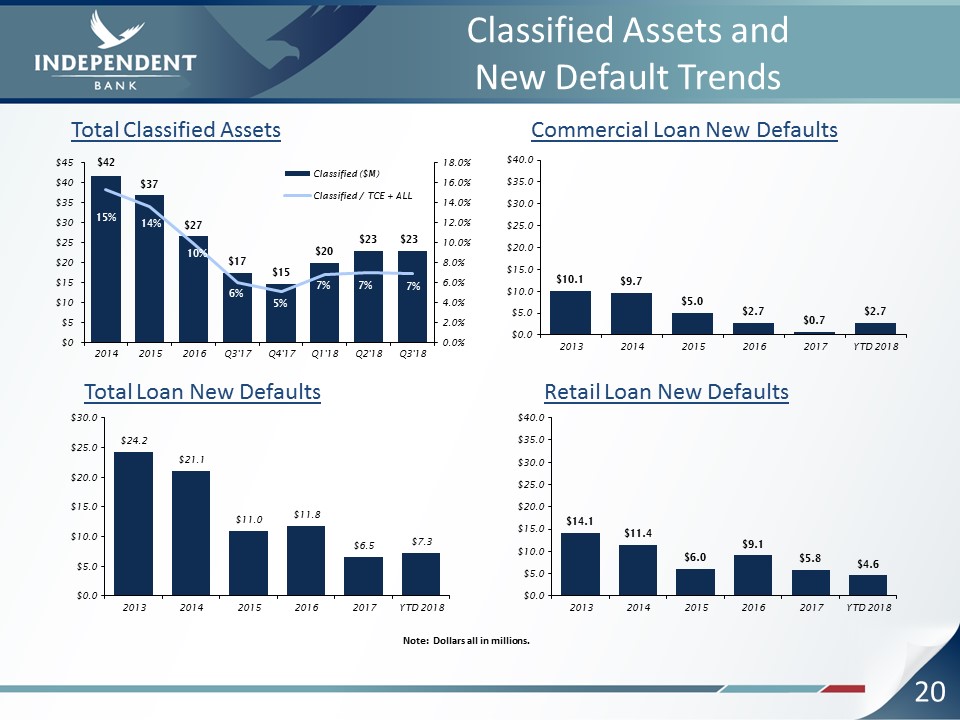
20 Classified Assets and New Default Trends Note: Dollars all in millions. Total Classified
Assets Commercial Loan New Defaults Total Loan New Defaults Retail Loan New Defaults
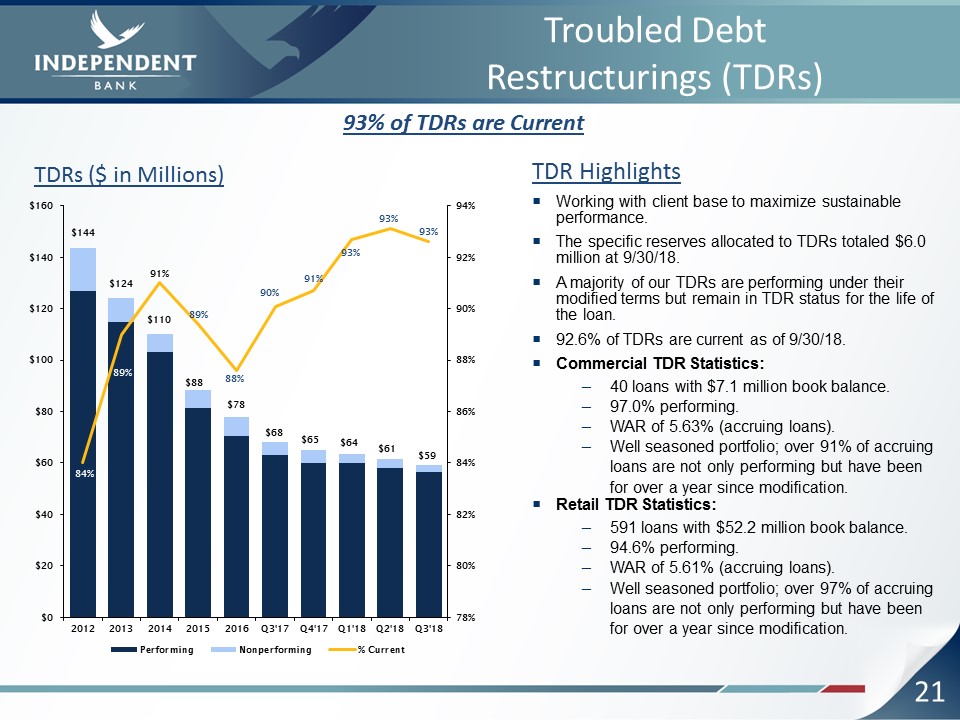
21 Troubled Debt Restructurings (TDRs) TDR HighlightsWorking with client base to maximize sustainable
performance.The specific reserves allocated to TDRs totaled $6.0 million at 9/30/18.A majority of our TDRs are performing under their modified terms but remain in TDR status for the life of the loan.92.6% of TDRs are current as of
9/30/18.Commercial TDR Statistics:40 loans with $7.1 million book balance.97.0% performing.WAR of 5.63% (accruing loans).Well seasoned portfolio; over 91% of accruing loans are not only performing but have been for over a year since
modification.Retail TDR Statistics:591 loans with $52.2 million book balance.94.6% performing.WAR of 5.61% (accruing loans).Well seasoned portfolio; over 97% of accruing loans are not only performing but have been for over a year since
modification. TDRs ($ in Millions) 93% of TDRs are Current
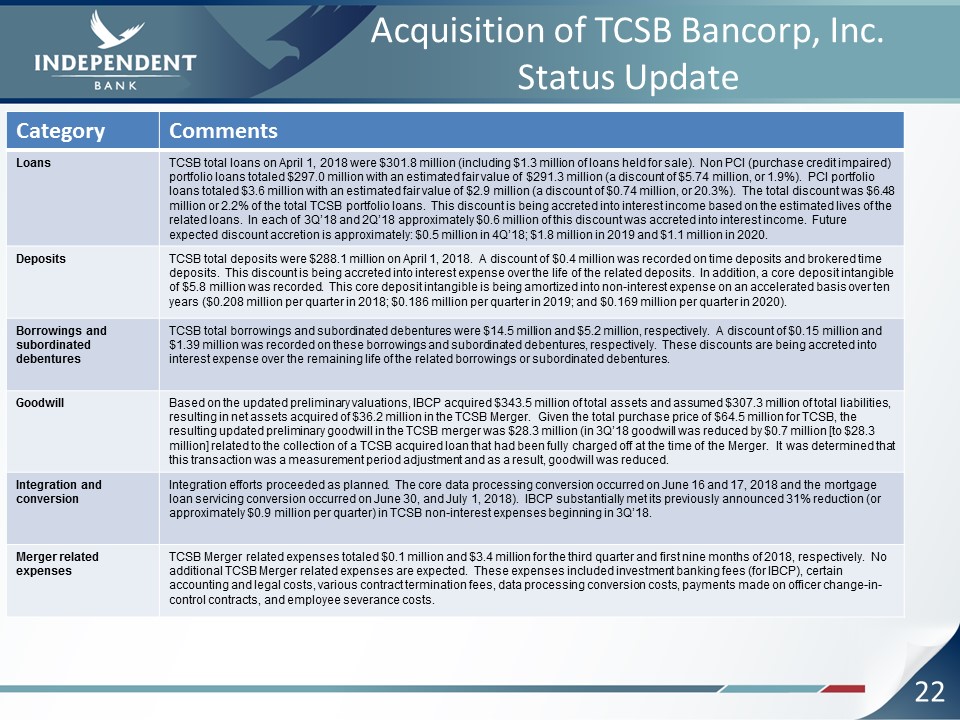
22 Acquisition of TCSB Bancorp, Inc.Status Update Category Comments Loans TCSB total loans on
April 1, 2018 were $301.8 million (including $1.3 million of loans held for sale). Non PCI (purchase credit impaired) portfolio loans totaled $297.0 million with an estimated fair value of $291.3 million (a discount of $5.74 million, or
1.9%). PCI portfolio loans totaled $3.6 million with an estimated fair value of $2.9 million (a discount of $0.74 million, or 20.3%). The total discount was $6.48 million or 2.2% of the total TCSB portfolio loans. This discount is being
accreted into interest income based on the estimated lives of the related loans. In each of 3Q’18 and 2Q’18 approximately $0.6 million of this discount was accreted into interest income. Future expected discount accretion is approximately:
$0.5 million in 4Q’18; $1.8 million in 2019 and $1.1 million in 2020. Deposits TCSB total deposits were $288.1 million on April 1, 2018. A discount of $0.4 million was recorded on time deposits and brokered time deposits. This discount is
being accreted into interest expense over the life of the related deposits. In addition, a core deposit intangible of $5.8 million was recorded. This core deposit intangible is being amortized into non-interest expense on an accelerated basis
over ten years ($0.208 million per quarter in 2018; $0.186 million per quarter in 2019; and $0.169 million per quarter in 2020). Borrowings and subordinated debentures TCSB total borrowings and subordinated debentures were $14.5 million
and $5.2 million, respectively. A discount of $0.15 million and $1.39 million was recorded on these borrowings and subordinated debentures, respectively. These discounts are being accreted into interest expense over the remaining life of the
related borrowings or subordinated debentures. Goodwill Based on the updated preliminary valuations, IBCP acquired $343.5 million of total assets and assumed $307.3 million of total liabilities, resulting in net assets acquired of $36.2
million in the TCSB Merger. Given the total purchase price of $64.5 million for TCSB, the resulting updated preliminary goodwill in the TCSB merger was $28.3 million (in 3Q’18 goodwill was reduced by $0.7 million [to $28.3 million] related to
the collection of a TCSB acquired loan that had been fully charged off at the time of the Merger. It was determined that this transaction was a measurement period adjustment and as a result, goodwill was reduced. Integration and
conversion Integration efforts proceeded as planned. The core data processing conversion occurred on June 16 and 17, 2018 and the mortgage loan servicing conversion occurred on June 30, and July 1, 2018). IBCP substantially met its
previously announced 31% reduction (or approximately $0.9 million per quarter) in TCSB non-interest expenses beginning in 3Q’18. Merger related expenses TCSB Merger related expenses totaled $0.1 million and $3.4 million for the third
quarter and first nine months of 2018, respectively. No additional TCSB Merger related expenses are expected. These expenses included investment banking fees (for IBCP), certain accounting and legal costs, various contract termination fees,
data processing conversion costs, payments made on officer change-in-control contracts, and employee severance costs.
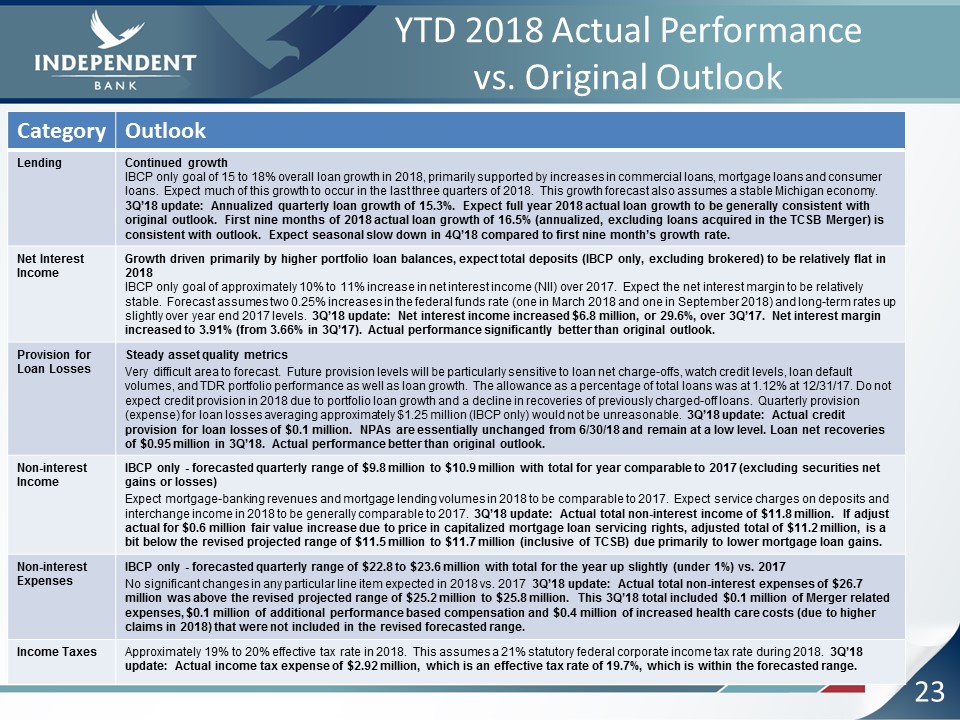
23 YTD 2018 Actual Performance vs. Original Outlook Category Outlook Lending Continued growthIBCP
only goal of 15 to 18% overall loan growth in 2018, primarily supported by increases in commercial loans, mortgage loans and consumer loans. Expect much of this growth to occur in the last three quarters of 2018. This growth forecast also
assumes a stable Michigan economy. 3Q’18 update: Annualized quarterly loan growth of 15.3%. Expect full year 2018 actual loan growth to be generally consistent with original outlook. First nine months of 2018 actual loan growth of 16.5%
(annualized, excluding loans acquired in the TCSB Merger) is consistent with outlook. Expect seasonal slow down in 4Q’18 compared to first nine month’s growth rate. Net Interest Income Growth driven primarily by higher portfolio loan
balances, expect total deposits (IBCP only, excluding brokered) to be relatively flat in 2018 IBCP only goal of approximately 10% to 11% increase in net interest income (NII) over 2017. Expect the net interest margin to be relatively stable.
Forecast assumes two 0.25% increases in the federal funds rate (one in March 2018 and one in September 2018) and long-term rates up slightly over year end 2017 levels. 3Q’18 update: Net interest income increased $6.8 million, or 29.6%, over
3Q’17. Net interest margin increased to 3.91% (from 3.66% in 3Q’17). Actual performance significantly better than original outlook. Provision for Loan Losses Steady asset quality metricsVery difficult area to forecast. Future provision
levels will be particularly sensitive to loan net charge-offs, watch credit levels, loan default volumes, and TDR portfolio performance as well as loan growth. The allowance as a percentage of total loans was at 1.12% at 12/31/17. Do not
expect credit provision in 2018 due to portfolio loan growth and a decline in recoveries of previously charged-off loans. Quarterly provision (expense) for loan losses averaging approximately $1.25 million (IBCP only) would not be
unreasonable. 3Q’18 update: Actual credit provision for loan losses of $0.1 million. NPAs are essentially unchanged from 6/30/18 and remain at a low level. Loan net recoveries of $0.95 million in 3Q’18. Actual performance better than original
outlook. Non-interest Income IBCP only - forecasted quarterly range of $9.8 million to $10.9 million with total for year comparable to 2017 (excluding securities net gains or losses)Expect mortgage-banking revenues and mortgage lending
volumes in 2018 to be comparable to 2017. Expect service charges on deposits and interchange income in 2018 to be generally comparable to 2017. 3Q’18 update: Actual total non-interest income of $11.8 million. If adjust actual for $0.6 million
fair value increase due to price in capitalized mortgage loan servicing rights, adjusted total of $11.2 million, is a bit below the revised projected range of $11.5 million to $11.7 million (inclusive of TCSB) due primarily to lower mortgage
loan gains. Non-interest Expenses IBCP only - forecasted quarterly range of $22.8 to $23.6 million with total for the year up slightly (under 1%) vs. 2017No significant changes in any particular line item expected in 2018 vs. 2017 3Q’18
update: Actual total non-interest expenses of $26.7 million was above the revised projected range of $25.2 million to $25.8 million. This 3Q’18 total included $0.1 million of Merger related expenses, $0.1 million of additional performance
based compensation and $0.4 million of increased health care costs (due to higher claims in 2018) that were not included in the revised forecasted range. Income Taxes Approximately 19% to 20% effective tax rate in 2018. This assumes a 21%
statutory federal corporate income tax rate during 2018. 3Q’18 update: Actual income tax expense of $2.92 million, which is an effective tax rate of 19.7%, which is within the forecasted range.
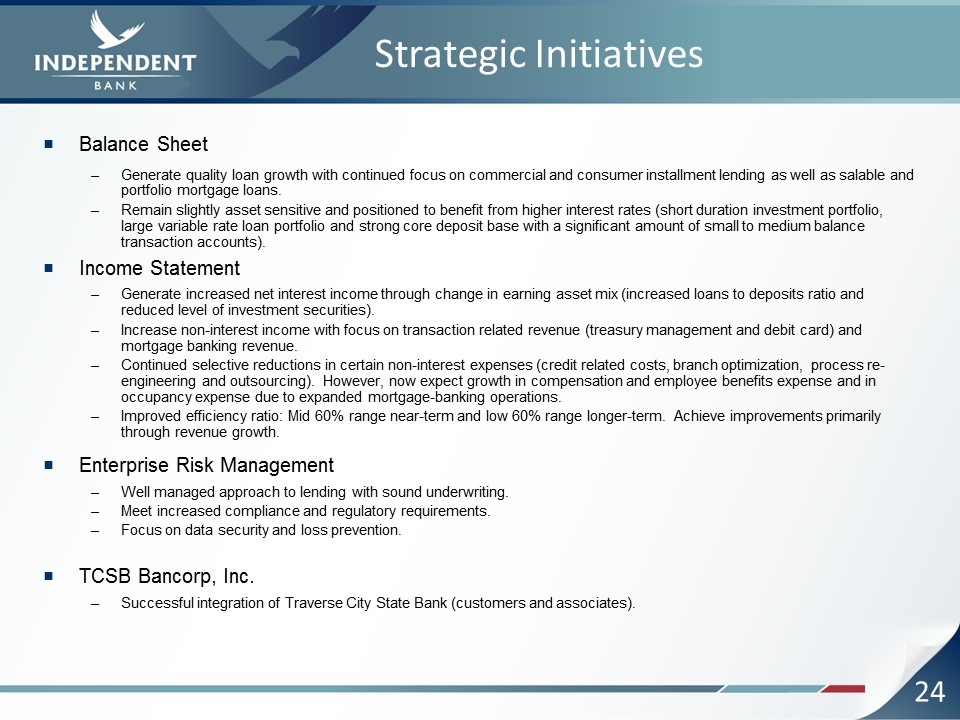
24 Strategic Initiatives Balance SheetGenerate quality loan growth with continued focus on
commercial and consumer installment lending as well as salable and portfolio mortgage loans.Remain slightly asset sensitive and positioned to benefit from higher interest rates (short duration investment portfolio, large variable rate loan
portfolio and strong core deposit base with a significant amount of small to medium balance transaction accounts). Income StatementGenerate increased net interest income through change in earning asset mix (increased loans to deposits ratio
and reduced level of investment securities).Increase non-interest income with focus on transaction related revenue (treasury management and debit card) and mortgage banking revenue.Continued selective reductions in certain non-interest
expenses (credit related costs, branch optimization, process re-engineering and outsourcing). However, now expect growth in compensation and employee benefits expense and in occupancy expense due to expanded mortgage-banking
operations.Improved efficiency ratio: Mid 60% range near-term and low 60% range longer-term. Achieve improvements primarily through revenue growth.Enterprise Risk ManagementWell managed approach to lending with sound underwriting.Meet
increased compliance and regulatory requirements.Focus on data security and loss prevention.TCSB Bancorp, Inc.Successful integration of Traverse City State Bank (customers and associates).
25 Q&A and Closing Remarks Question and Answer SessionClosing RemarksThank you for attending
!NASDAQ: IBCP