Attached files
| file | filename |
|---|---|
| EX-99.1 - EX-99.1 - VALMONT INDUSTRIES INC | a18-37100_1ex99d1.htm |
| 8-K - 8-K - VALMONT INDUSTRIES INC | a18-37100_18k.htm |

Forward-looking Statement Disclosure These slides contain (and the accompanying oral discussion will contain) “forward-looking statements” within the meaning of the Private Securities Litigation Reform Act of 1995. Such statements involve known and unknown risks, uncertainties and other factors that could cause the actual results of the Company to differ materially from the results expressed or implied by such statements, including general economic and business conditions, conditions affecting the industries served by the Company and its subsidiaries, conditions affecting the Company’s customers and suppliers, competitor responses to the Company’s products and services, the overall market acceptance of such products and services, the integration of acquisitions and other factors disclosed in the Company’s periodic reports filed with the Securities and Exchange Commission. Consequently such forward-looking statements should be regarded as the Company’s current plans, estimates and beliefs. The Company does not undertake and specifically declines any obligation to publicly release the results of any revisions to these forward-looking statements that may be made to reflect any future events or circumstances after the date of such statements or to reflect the occurrence of anticipated or unanticipated events. 2 October 24, 2018 Valmont Industries, Inc. Q3 2018 Earnings Presentation
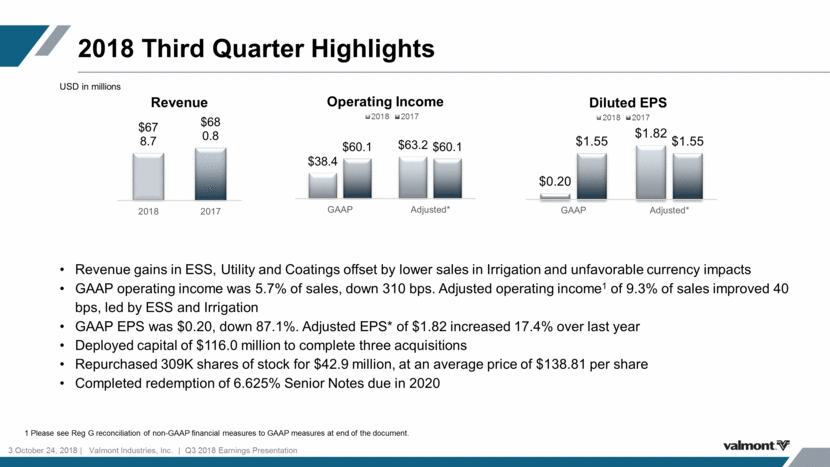
2018 Third Quarter Highlights 3 October 24, 2018 Valmont Industries, Inc. Q3 2018 Earnings Presentation 1 Please see Reg G reconciliation of non-GAAP financial measures to GAAP measures at end of the document. Revenue gains in ESS, Utility and Coatings offset by lower sales in Irrigation and unfavorable currency impacts GAAP operating income was 5.7% of sales, down 310 bps. Adjusted operating income1 of 9.3% of sales improved 40 bps, led by ESS and Irrigation GAAP EPS was $0.20, down 87.1%. Adjusted EPS* of $1.82 increased 17.4% over last year Deployed capital of $116.0 million to complete three acquisitions Repurchased 309K shares of stock for $42.9 million, at an average price of $138.81 per share Completed redemption of 6.625% Senior Notes due in 2020 USD in millions $38.4 $63.2 $60.1 $60.1 GAAP Adjusted* Operating Income 2018 2017 $0.20 $1.82 $1.55 $1.55 GAAP Adjusted* Diluted EPS 2018 2017
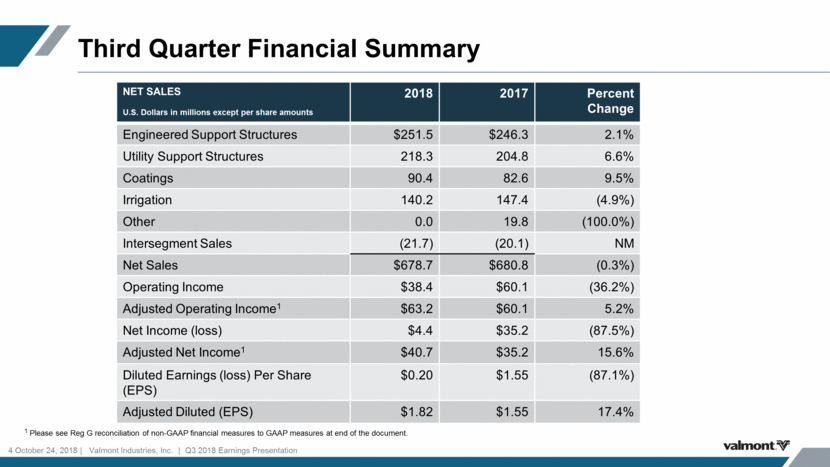
Third Quarter Financial Summary 4 October 24, 2018 Valmont Industries, Inc. Q3 2018 Earnings Presentation NET SALES U.S. Dollars in millions except per share amounts 2018 2017 Percent Change Engineered Support Structures $251.5 $246.3 2.1% Utility Support Structures 218.3 204.8 6.6% Coatings 90.4 82.6 9.5% Irrigation 140.2 147.4 (4.9%) Other 0.0 19.8 (100.0%) Intersegment Sales (21.7) (20.1) NM Net Sales $678.7 $680.8 (0.3%) Operating Income $38.4 $60.1 (36.2%) Adjusted Operating Income1 $63.2 $60.1 5.2% Net Income (loss) $4.4 $35.2 (87.5%) Adjusted Net Income1 $40.7 $35.2 15.6% Diluted Earnings (loss) Per Share (EPS) $0.20 $1.55 (87.1%) Adjusted Diluted (EPS) $1.82 $1.55 17.4% 1 Please see Reg G reconciliation of non-GAAP financial measures to GAAP measures at end of the document.
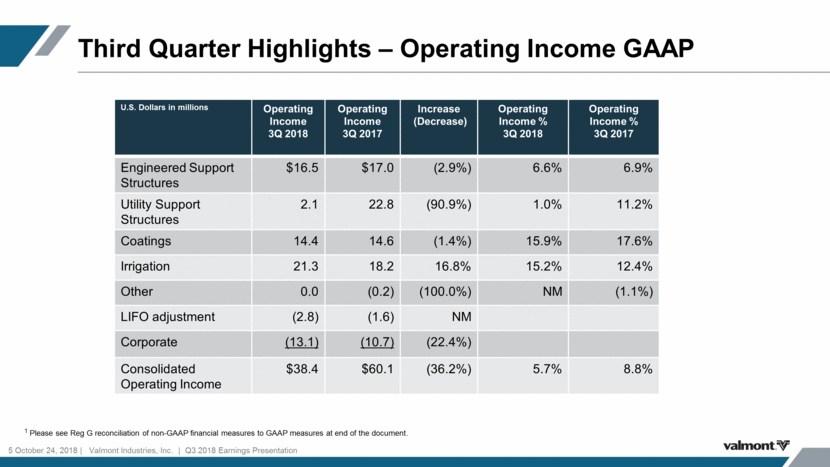
Third Quarter Highlights – Operating Income GAAP 5 October 24, 2018 Valmont Industries, Inc. Q3 2018 Earnings Presentation U.S. Dollars in millions Operating Income 3Q 2018 Operating Income 3Q 2017 Increase (Decrease) Operating Income % 3Q 2018 Operating Income % 3Q 2017 Engineered Support Structures $16.5 $17.0 (2.9%) 6.6% 6.9% Utility Support Structures 2.1 22.8 (90.9%) 1.0% 11.2% Coatings 14.4 14.6 (1.4%) 15.9% 17.6% Irrigation 21.3 18.2 16.8% 15.2% 12.4% Other 0.0 (0.2) (100.0%) NM (1.1%) LIFO adjustment (2.8) (1.6) NM Corporate (13.1) (10.7) (22.4%) Consolidated Operating Income $38.4 $60.1 (36.2%) 5.7% 8.8% 1 Please see Reg G reconciliation of non-GAAP financial measures to GAAP measures at end of the document.
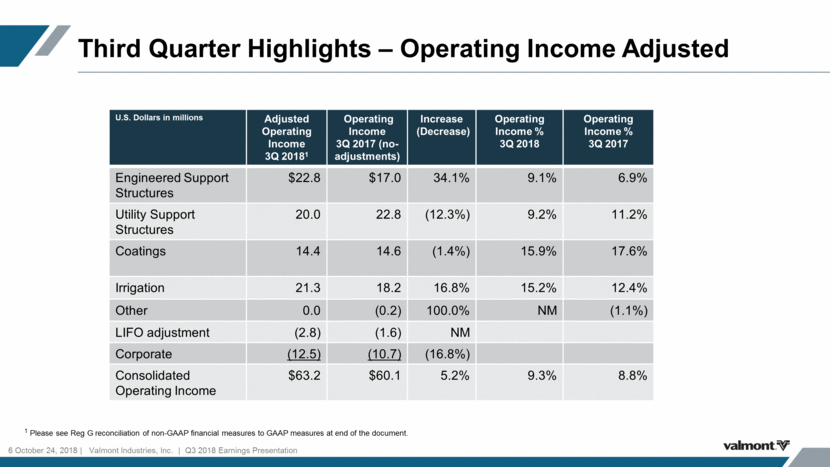
Third Quarter Highlights – Operating Income Adjusted 6 October 24, 2018 Valmont Industries, Inc. Q3 2018 Earnings Presentation U.S. Dollars in millions Adjusted Operating Income 3Q 20181 Operating Income 3Q 2017 (no-adjustments) Increase (Decrease) Operating Income % 3Q 2018 Operating Income % 3Q 2017 Engineered Support Structures $22.8 $17.0 34.1% 9.1% 6.9% Utility Support Structures 20.0 22.8 (12.3%) 9.2% 11.2% Coatings 14.4 14.6 (1.4%) 15.9% 17.6% Irrigation 21.3 18.2 16.8% 15.2% 12.4% Other 0.0 (0.2) 100.0% NM (1.1%) LIFO adjustment (2.8) (1.6) NM Corporate (12.5) (10.7) (16.8%) Consolidated Operating Income $63.2 $60.1 5.2% 9.3% 8.8% 1 Please see Reg G reconciliation of non-GAAP financial measures to GAAP measures at end of the document.
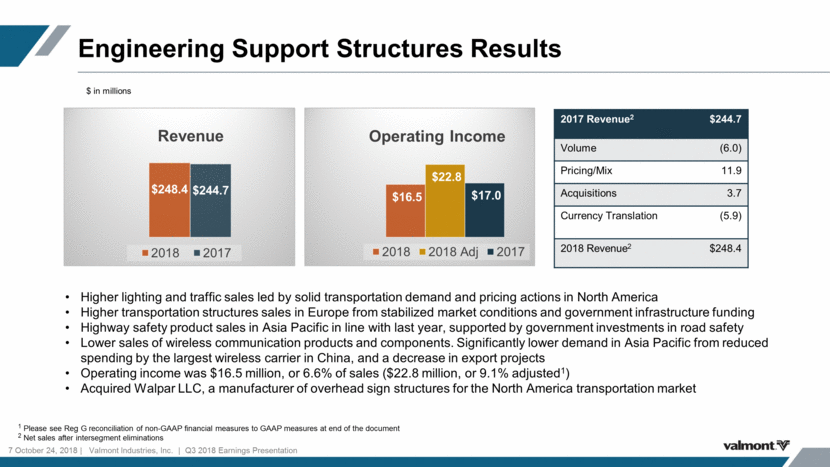
Engineering Support Structures Results 7 October 24, 2018 Valmont Industries, Inc. Q3 2018 Earnings Presentation 2017 Revenue2 $244.7 Volume (6.0) Pricing/Mix 11.9 Acquisitions 3.7 Currency Translation (5.9) 2018 Revenue2 $248.4 $ in millions Higher lighting and traffic sales led by solid transportation demand and pricing actions in North America Higher transportation structures sales in Europe from stabilized market conditions and government infrastructure funding Highway safety product sales in Asia Pacific in line with last year, supported by government investments in road safety Lower sales of wireless communication products and components. Significantly lower demand in Asia Pacific from reduced spending by the largest wireless carrier in China, and a decrease in export projects Operating income was $16.5 million, or 6.6% of sales ($22.8 million, or 9.1% adjusted1) Acquired Walpar LLC, a manufacturer of overhead sign structures for the North America transportation market 1 Please see Reg G reconciliation of non-GAAP financial measures to GAAP measures at end of the document 2 Net sales after intersegment eliminations $16.5 $22.8 $17.0 Operating Income 2018 2018 Adj 2017 $248.4 $244.7 Revenue 2018 2017
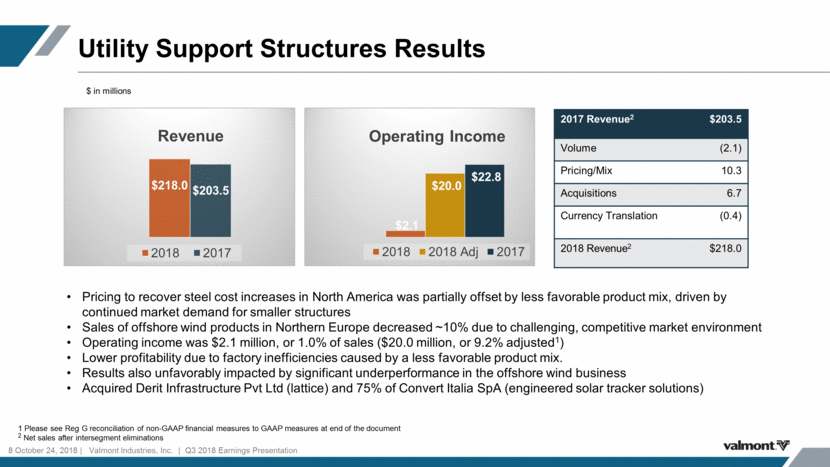
Utility Support Structures Results 8 October 24, 2018 Valmont Industries, Inc. Q3 2018 Earnings Presentation 2017 Revenue2 $203.5 Volume (2.1) Pricing/Mix 10.3 Acquisitions 6.7 Currency Translation (0.4) 2018 Revenue2 $218.0 $ in millions 1 Please see Reg G reconciliation of non-GAAP financial measures to GAAP measures at end of the document 2 Net sales after intersegment eliminations Pricing to recover steel cost increases in North America was partially offset by less favorable product mix, driven by continued market demand for smaller structures Sales of offshore wind products in Northern Europe decreased ~10% due to challenging, competitive market environment Operating income was $2.1 million, or 1.0% of sales ($20.0 million, or 9.2% adjusted1) Lower profitability due to factory inefficiencies caused by a less favorable product mix. Results also unfavorably impacted by significant underperformance in the offshore wind business Acquired Derit Infrastructure Pvt Ltd (lattice) and 75% of Convert Italia SpA (engineered solar tracker solutions) $2.1 $20.0 $22.8 Operating Income 2018 2018 Adj 2017 $218.0 $203.5 Revenue 2018 2017
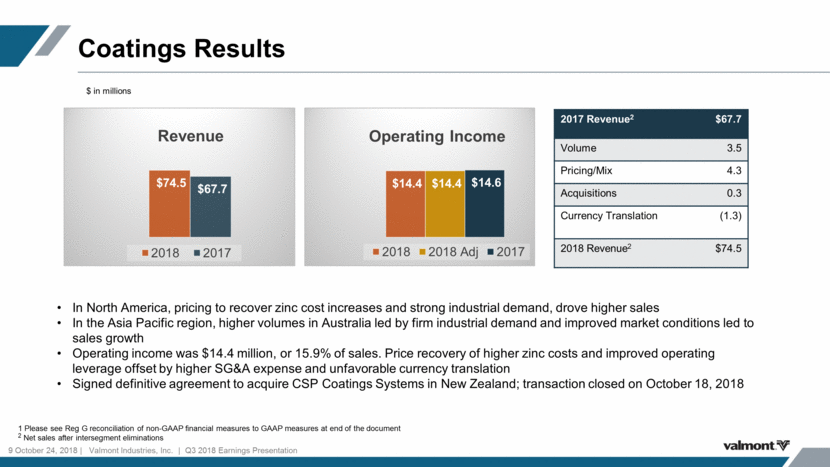
Coatings Results 9 October 24, 2018 Valmont Industries, Inc. Q3 2018 Earnings Presentation 2017 Revenue2 $67.7 Volume 3.5 Pricing/Mix 4.3 Acquisitions 0.3 Currency Translation (1.3) 2018 Revenue2 $74.5 $ in millions 1 Please see Reg G reconciliation of non-GAAP financial measures to GAAP measures at end of the document 2 Net sales after intersegment eliminations In North America, pricing to recover zinc cost increases and strong industrial demand, drove higher sales In the Asia Pacific region, higher volumes in Australia led by firm industrial demand and improved market conditions led to sales growth Operating income was $14.4 million, or 15.9% of sales. Price recovery of higher zinc costs and improved operating leverage offset by higher SG&A expense and unfavorable currency translation Signed definitive agreement to acquire CSP Coatings Systems in New Zealand; transaction closed on October 18, 2018 $14.4 $14.4 $14.6 Operating Income 2018 2018 Adj 2017 $74.5 $67.7 Revenue 2018 2017
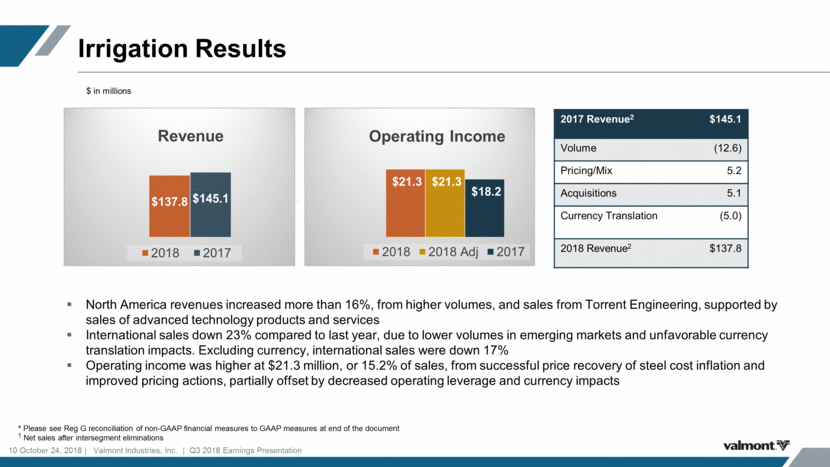
Irrigation Results 10 October 24, 2018 Valmont Industries, Inc. Q3 2018 Earnings Presentation 2017 Revenue2 $145.1 Volume (12.6) Pricing/Mix 5.2 Acquisitions 5.1 Currency Translation (5.0) 2018 Revenue2 $137.8 $ in millions North America revenues increased more than 16%, from higher volumes, and sales from Torrent Engineering, supported by sales of advanced technology products and services International sales down 23% compared to last year, due to lower volumes in emerging markets and unfavorable currency translation impacts. Excluding currency, international sales were down 17% Operating income was higher at $21.3 million, or 15.2% of sales, from successful price recovery of steel cost inflation and improved pricing actions, partially offset by decreased operating leverage and currency impacts * Please see Reg G reconciliation of non-GAAP financial measures to GAAP measures at end of the document 1 Net sales after intersegment eliminations $21.3 $21.3 $18.2 Operating Income 2018 2018 Adj 2017 $137.8 $145.1 Revenue 2018 2017
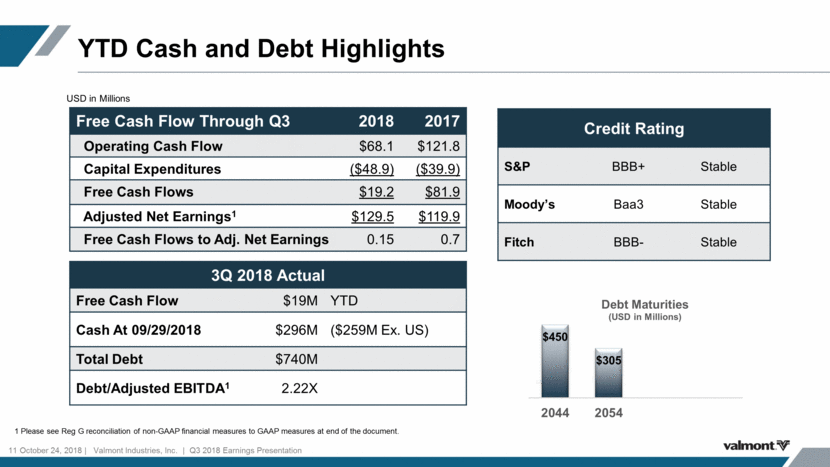
YTD Cash and Debt Highlights 11 October 24, 2018 Valmont Industries, Inc. Q3 2018 Earnings Presentation Free Cash Flow Through Q3 2018 2017 Operating Cash Flow $68.1 $121.8 Capital Expenditures ($48.9) ($39.9) Free Cash Flows $19.2 $81.9 Adjusted Net Earnings1 $129.5 $119.9 Free Cash Flows to Adj. Net Earnings 0.15 0.7 1 Please see Reg G reconciliation of non-GAAP financial measures to GAAP measures at end of the document. USD in Millions 3Q 2018 Actual Free Cash Flow $19M YTD Cash At 09/29/2018 $296M ($259M Ex. US) Total Debt $740M Debt/Adjusted EBITDA1 2.22X Credit Rating S&P BBB+ Stable Moody’s Baa3 Stable Fitch BBB- Stable $450 $305 2044 2054 Debt Maturities (USD in Millions)
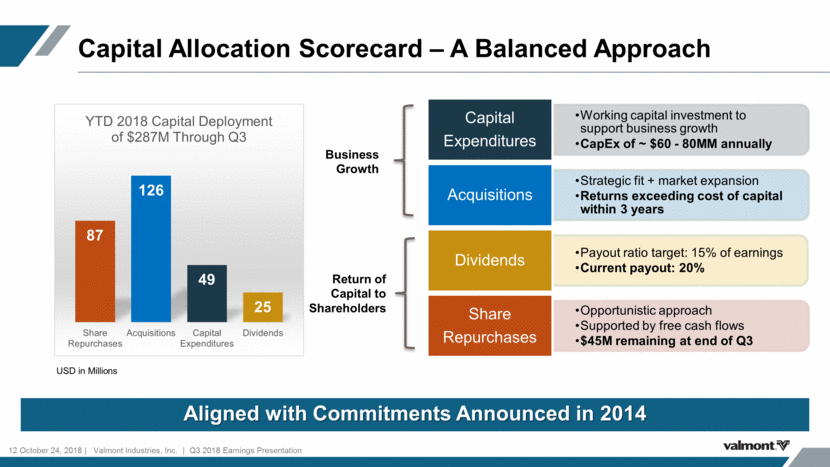
Capital Allocation Scorecard – A Balanced Approach Aligned with Commitments Announced in 2014 Business Growth Return of Capital to Shareholders USD in Millions 12 October 24, 2018 Valmont Industries, Inc. Q3 2018 Earnings Presentation Working capital investment to support business growth CapEx of ~ $60 - 80MM annually Capital Expenditures Strategic fit + market expansion Returns exceeding cost of capital within 3 years Acquisitions Payout ratio target: 15% of earnings Current payout: 20% Dividends Opportunistic approach Supported by free cash flows $45M remaining at end of Q3 Share Repurchases 87 126 49 25 Share Repurchases Acquisitions Capital Expenditures Dividends YTD 2018 Capital Deployment of $287M Through Q3
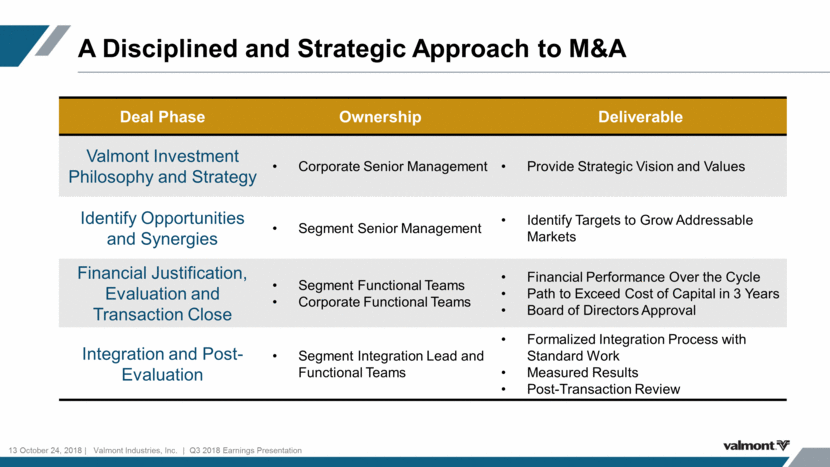
A Disciplined and Strategic Approach to M&A 13 October 24, 2018 Valmont Industries, Inc. Q3 2018 Earnings Presentation Deal Phase Ownership Deliverable Valmont Investment Philosophy and Strategy Corporate Senior Management Provide Strategic Vision and Values Identify Opportunities and Synergies Segment Senior Management Identify Targets to Grow Addressable Markets Financial Justification, Evaluation and Transaction Close Segment Functional Teams Corporate Functional Teams Financial Performance Over the Cycle Path to Exceed Cost of Capital in 3 Years Board of Directors Approval Integration and Post-Evaluation Segment Integration Lead and Functional Teams Formalized Integration Process with Standard Work Measured Results Post-Transaction Review
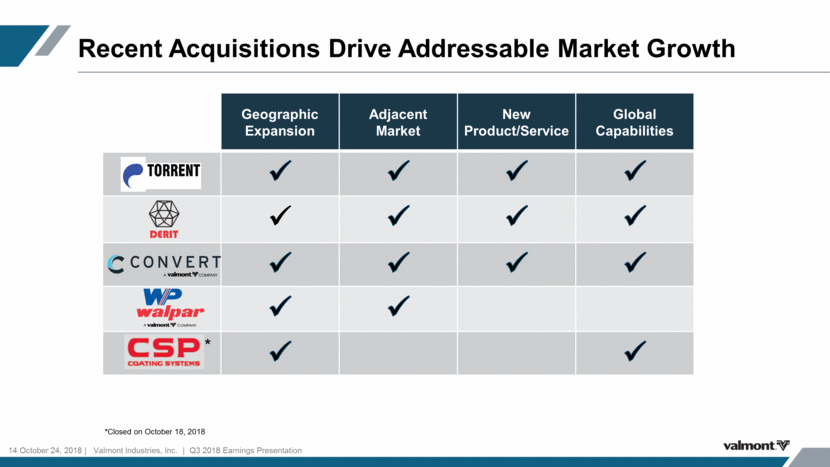
Recent Acquisitions Drive Addressable Market Growth Geographic Expansion Adjacent Market New Product/Service Global Capabilities * *Closed on October 18, 2018 14 October 24, 2018 Valmont Industries, Inc. Q3 2018 Earnings Presentation
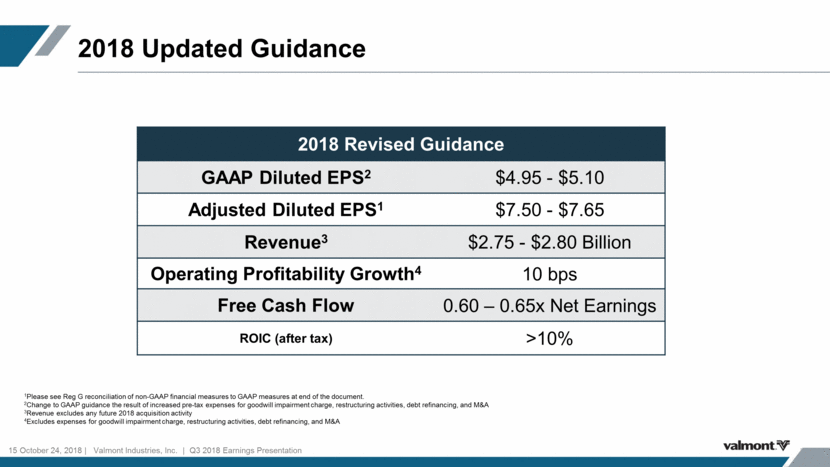
2018 Updated Guidance 15 October 24, 2018 Valmont Industries, Inc. Q3 2018 Earnings Presentation 2018 Revised Guidance GAAP Diluted EPS2 $4.95 - $5.10 Adjusted Diluted EPS1 $7.50 - $7.65 Revenue3 $2.75 - $2.80 Billion Operating Profitability Growth4 10 bps Free Cash Flow 0.60 – 0.65x Net Earnings ROIC (after tax) >10% 1Please see Reg G reconciliation of non-GAAP financial measures to GAAP measures at end of the document. 2Change to GAAP guidance the result of increased pre-tax expenses for goodwill impairment charge, restructuring activities, debt refinancing, and M&A 3Revenue excludes any future 2018 acquisition activity 4Excludes expenses for goodwill impairment charge, restructuring activities, debt refinancing, and M&A
ApPENDIX 16 October 24, 2018 Valmont Industries, Inc. Q3 2018 Earnings Presentation
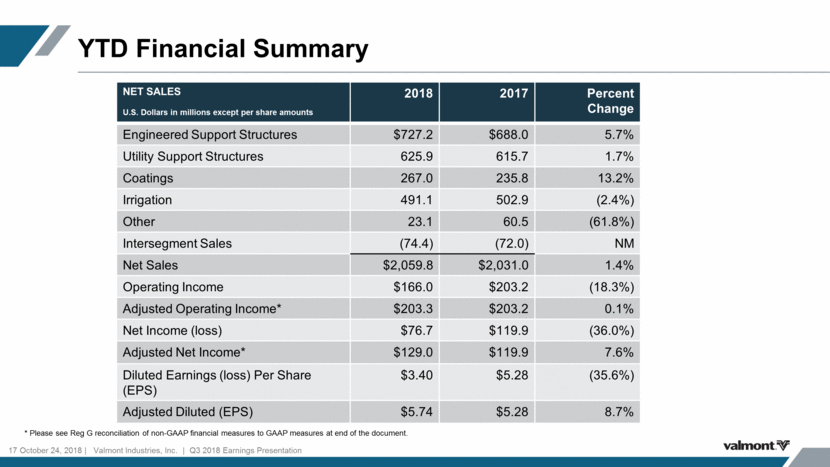
YTD Financial Summary 17 October 24, 2018 Valmont Industries, Inc. Q3 2018 Earnings Presentation NET SALES U.S. Dollars in millions except per share amounts 2018 2017 Percent Change Engineered Support Structures $727.2 $688.0 5.7% Utility Support Structures 625.9 615.7 1.7% Coatings 267.0 235.8 13.2% Irrigation 491.1 502.9 (2.4%) Other 23.1 60.5 (61.8%) Intersegment Sales (74.4) (72.0) NM Net Sales $2,059.8 $2,031.0 1.4% Operating Income $166.0 $203.2 (18.3%) Adjusted Operating Income* $203.3 $203.2 0.1% Net Income (loss) $76.7 $119.9 (36.0%) Adjusted Net Income* $129.0 $119.9 7.6% Diluted Earnings (loss) Per Share (EPS) $3.40 $5.28 (35.6%) Adjusted Diluted (EPS) $5.74 $5.28 8.7% * Please see Reg G reconciliation of non-GAAP financial measures to GAAP measures at end of the document.
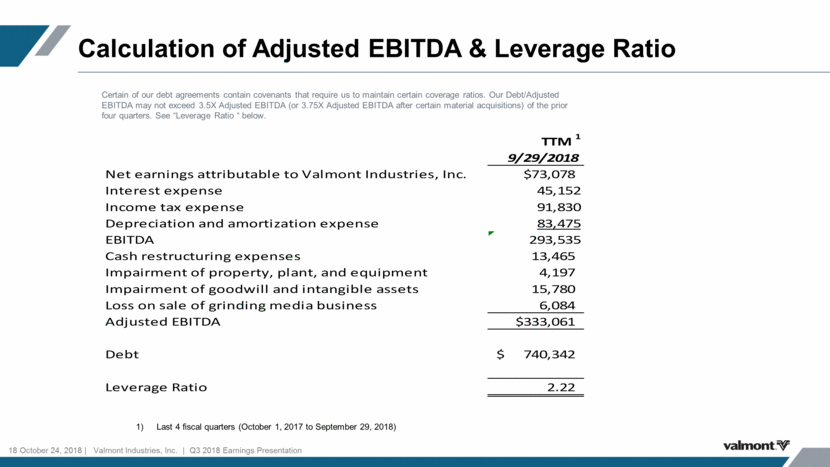
Calculation of Adjusted EBITDA & Leverage Ratio 18 October 24, 2018 Valmont Industries, Inc. Q3 2018 Earnings Presentation Last 4 fiscal quarters (October 1, 2017 to September 29, 2018) Certain of our debt agreements contain covenants that require us to maintain certain coverage ratios. Our Debt/Adjusted EBITDA may not exceed 3.5X Adjusted EBITDA (or 3.75X Adjusted EBITDA after certain material acquisitions) of the prior four quarters. See “Leverage Ratio “ below. TTM 1 9/29/2018 Net earnings attributable to Valmont Industries, Inc. $73,078 Interest expense 45,152 Income tax expense 91,830 Depreciation and amortization expense 83,475 EBITDA 293,535 Cash restructuring expenses 13,465 Impairment of property, plant, and equipment 4,197 Impairment of goodwill and intangible assets 15,780 Loss on sale of grinding media business 6,084 Adjusted EBITDA $333,061 Debt $ 740,342 Leverage Ratio 2.22
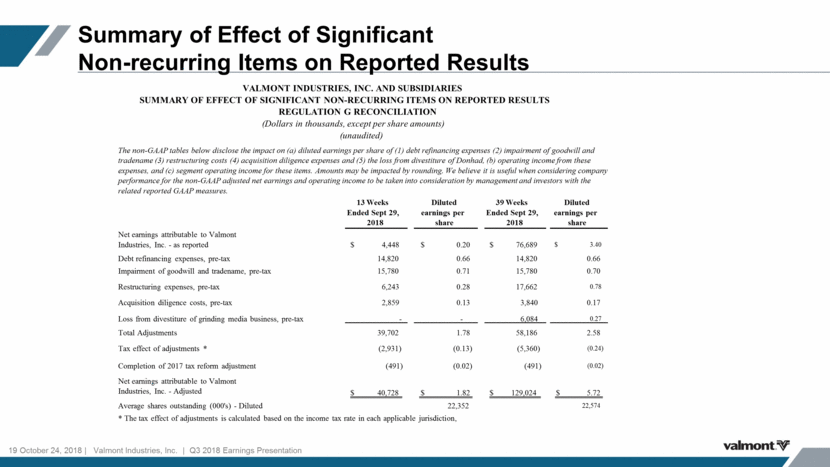
Summary of Effect of Significant Non-recurring Items on Reported Results 19 October 24, 2018 Valmont Industries, Inc. Q3 2018 Earnings Presentation 13 Weeks Ended Sept 29, 2018 Diluted earnings per share 39 Weeks Ended Sept 29, 2018 Diluted earnings per share Net earnings attributable to Valmont Industries, Inc. - as reported 4,448 $ 0.20 $ 76,689 $ 3.40 $ Debt refinancing expenses, pre-tax 14,820 0.66 14,820 0.66 Impairment of goodwill and tradename, pre-tax 15,780 0.71 15,780 0.70 Restructuring expenses, pre-tax 6,243 0.28 17,662 0.78 Acquisition diligence costs, pre-tax 2,859 0.13 3,840 0.17 Loss from divestiture of grinding media business, pre-tax - - 6,084 0.27 Total Adjustments 39,702 1.78 58,186 2.58 Tax effect of adjustments * (2,931) (0.13) (5,360) (0.24) Completion of 2017 tax reform adjustment (491) (0.02) (491) (0.02) Net earnings attributable to Valmont Industries, Inc. - Adjusted 40,728 $ 1.82 $ 129,024 $ 5.72 $ Average shares outstanding (000's) - Diluted 22,352 22,574 * The tax effect of adjustments is calculated based on the income tax rate in each applicable jurisdiction, VALMONT INDUSTRIES, INC. AND SUBSIDIARIES SUMMARY OF EFFECT OF SIGNIFICANT NON-RECURRING ITEMS ON REPORTED RESULTS REGULATION G RECONCILIATION (Dollars in thousands, except per share amounts) (unaudited) The non-GAAP tables below disclose the impact on (a) diluted earnings per share of (1) debt refinancing expenses (2) impairment of goodwill and tradename (3) restructuring costs (4) acquisition diligence expenses and (5) the loss from divestiture of Donhad, (b) operating income from these expenses, and (c) segment operating income for these items. Amounts may be impacted by rounding. We believe it is useful when considering company performance for the non-GAAP adjusted net earnings and operating income to be taken into consideration by management and investors with the related reported GAAP measures.
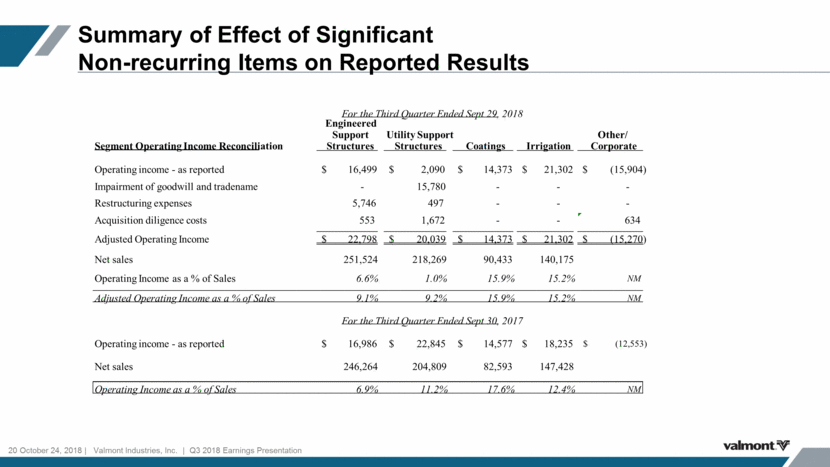
Summary of Effect of Significant Non-recurring Items on Reported Results 20 October 24, 2018 Valmont Industries, Inc. Q3 2018 Earnings Presentation Segment Operating Income Reconciliation Engineered Support Structures Utility Support Structures Coatings Irrigation Other/ Corporate Operating income - as reported 16,499 $ 2,090 $ 14,373 $ 21,302 $ (15,904) $ Impairment of goodwill and tradename - 15,780 - - - Restructuring expenses 5,746 497 - - - Acquisition diligence costs 553 1,672 - - 634 Adjusted Operating Income 22,798 $ 20,039 $ 14,373 $ 21,302 $ (15,270) $ Net sales 251,524 218,269 90,433 140,175 Operating Income as a % of Sales 6.6% 1.0% 15.9% 15.2% NM Adjusted Operating Income as a % of Sales 9.1% 9.2% 15.9% 15.2% NM Operating income - as reported 16,986 $ 22,845 $ 14,577 $ 18,235 $ (12,553) $ Net sales 246,264 204,809 82,593 147,428 Operating Income as a % of Sales 6.9% 11.2% 17.6% 12.4% NM For the Third Quarter Ended Sept 29, 2018 For the Third Quarter Ended Sept 30, 2017
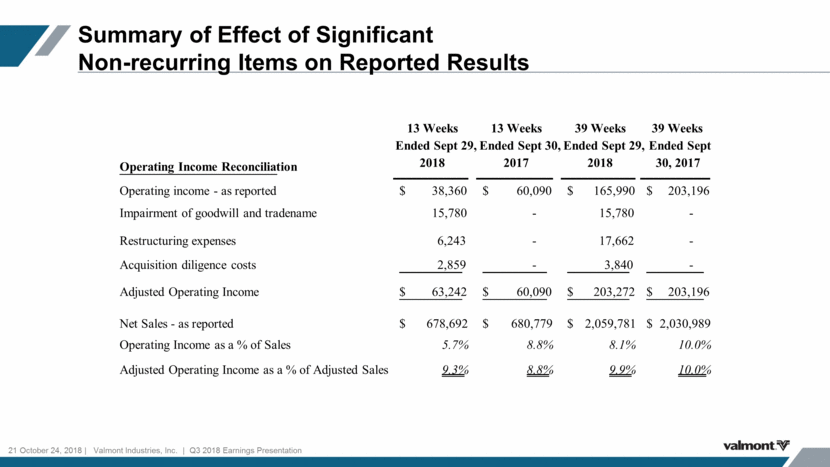
Summary of Effect of Significant Non-recurring Items on Reported Results 21 October 24, 2018 Valmont Industries, Inc. Q3 2018 Earnings Presentation Operating Income Reconciliation 13 Weeks Ended Sept 29, 2018 13 Weeks Ended Sept 30, 2017 39 Weeks Ended Sept 29, 2018 39 Weeks Ended Sept 30, 2017 Operating income - as reported 38,360 $ 60,090 $ 165,990 $ 203,196 $ Impairment of goodwill and tradename 15,780 - 15,780 - Restructuring expenses 6,243 - 17,662 - Acquisition diligence costs 2,859 - 3,840 - Adjusted Operating Income 63,242 $ 60,090 $ 203,272 $ 203,196 $ Net Sales - as reported 678,692 $ 680,779 $ 2,059,781 $ 2,030,989 $ Operating Income as a % of Sales 5.7% 8.8% 8.1% 10.0% Adjusted Operating Income as a % of Adjusted Sales 9.3% 8.8% 9.9% 10.0%
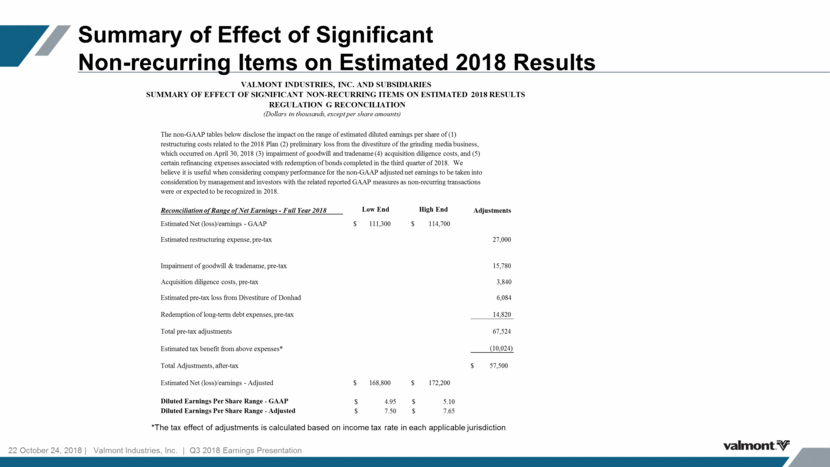
Summary of Effect of Significant Non-recurring Items on Estimated 2018 Results 22 October 24, 2018 Valmont Industries, Inc. Q3 2018 Earnings Presentation *The tax effect of adjustments is calculated based on income tax rate in each applicable jurisdiction Reconciliation of Range of Net Earnings - Full Year 2018 Low End High End Adjustments Estimated Net (loss)/earnings - GAAP $ 111,300 $ 114,700 Estimated restructuring expense, pre-tax 27,000 Impairment of goodwill & tradename, pre-tax 15,780 Acquisition diligence costs, pre-tax 3,840 Estimated pre-tax loss from Divestiture of Donhad 6,084 Redemption of long-term debt expenses, pre-tax 14,820 Total pre-tax adjustments 67,524 Estimated tax benefit from above expenses* (10,024) Total Adjustments, after-tax $ 57,500 Estimated Net (loss)/earnings - Adjusted $ 168,800 $ 172,200 Diluted Earnings Per Share Range - GAAP 4.95 $ 5.10 $ Diluted Earnings Per Share Range - Adjusted 7.50 $ 7.65 $ The non-GAAP tables below disclose the impact on the range of estimated diluted earnings per share of (1) restructuring costs related to the 2018 Plan (2) preliminary loss from the divestiture of the grinding media business, which occurred on April 30, 2018 (3) impairment of goodwill and tradename (4) acquisition diligence costs, and (5) certain refinancing expenses associated with redemption of bonds completed in the third quarter of 2018. We believe it is useful when considering company performance for the non-GAAP adjusted net earnings to be taken into consideration by management and investors with the related reported GAAP measures as non-recurring transactions were or expected to be recognized in 2018. VALMONT INDUSTRIES, INC. AND SUBSIDIARIES SUMMARY OF EFFECT OF SIGNIFICANT NON-RECURRING ITEMS ON ESTIMATED 2018 RESULTS REGULATION G RECONCILIATION (Dollars in thousands, except per share amounts)