Attached files
| file | filename |
|---|---|
| 8-K - 8-K - GenOn Energy, Inc. | a18-36256_18k.htm |
CONFIDENTIAL WORKING DRAFT – SUBJECT TO ONGOING REVIEW & REVISION Proposed cleansing materials REMA projections April 4, 2018

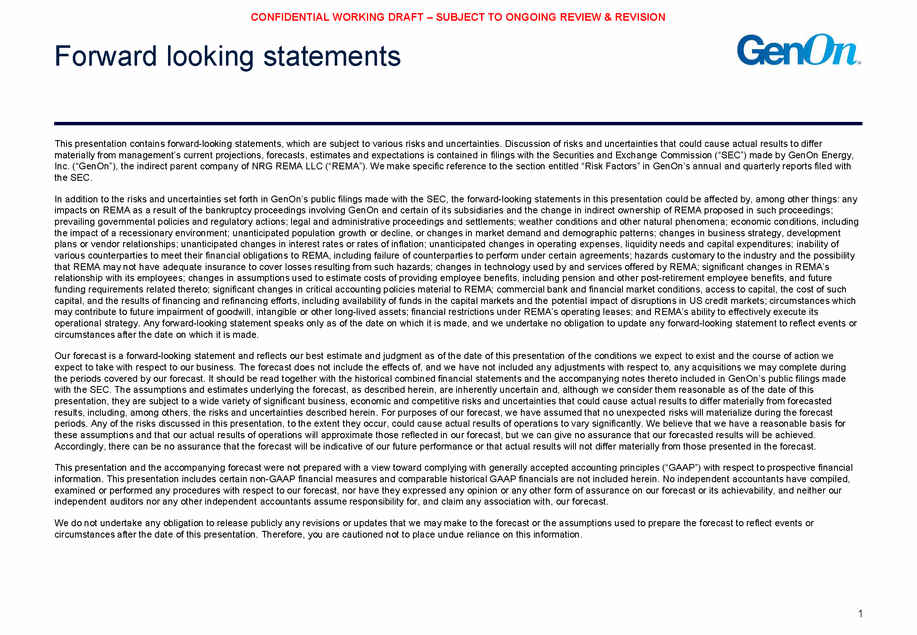
CONFIDENTIAL WORKING DRAFT – SUBJECT TO ONGOING REVIEW & REVISION Forward looking statements This presentation contains forward-looking statements, which are subject to various risks and uncertainties. Discussion of risks and uncertainties that could cause actual results to differ materially from management’s current projections, forecasts, estimates and expectations is contained in filings with the Securities and Exchange Commission (“SEC”) made by GenOn Energy, Inc. (“GenOn”), the indirect parent company of NRG REMA LLC (“REMA”). We make specific reference to the section entitled “Risk Factors” in GenOn’s annual and quarterly reports filed with the SEC. In addition to the risks and uncertainties set forth in GenOn’s public filings made with the SEC, the forward-looking statements in this presentation could be affected by, among other things: any impacts on REMA as a result of the bankruptcy proceedings involving GenOn and certain of its subsidiaries and the change in indirect ownership of REMA proposed in such proceedings; prevailing governmental policies and regulatory actions; legal and administrative proceedings and settlements; weather conditions and other natural phenomena; economic conditions, including the impact of a recessionary environment; unanticipated population growth or decline, or changes in market demand and demographic patterns; changes in business strategy, development plans or vendor relationships; unanticipated changes in interest rates or rates of inflation; unanticipated changes in operating expenses, liquidity needs and capital expenditures; inability of various counterparties to meet their financial obligations to REMA, including failure of counterparties to perform under certain agreements; hazards customary to the industry and the possibility that REMA may not have adequate insurance to cover losses resulting from such hazards; changes in technology used by and services offered by REMA; significant changes in REMA’s relationship with its employees; changes in assumptions used to estimate costs of providing employee benefits, including pension and other post-retirement employee benefits, and future funding requirements related thereto; significant changes in critical accounting policies material to REMA; commercial bank and financial market conditions, access to capital, the cost of such capital, and the results of financing and refinancing efforts, including availability of funds in the capital markets and the potential impact of disruptions in US credit markets; circumstances which may contribute to future impairment of goodwill, intangible or other long-lived assets; financial restrictions under REMA’s operating leases; and REMA’s ability to effectively execute its operational strategy. Any forward-looking statement speaks only as of the date on which it is made, and we undertake no obligation to update any forward-looking statement to reflect events or circumstances after the date on which it is made. Our forecast is a forward-looking statement and reflects our best estimate and judgment as of the date of this presentation of the conditions we expect to exist and the course of action we expect to take with respect to our business. The forecast does not include the effects of, and we have not included any adjustments with respect to, any acquisitions we may complete during the periods covered by our forecast. It should be read together with the historical combined financial statements and the accompanying notes thereto included in GenOn’s public filings made with the SEC. The assumptions and estimates underlying the forecast, as described herein, are inherently uncertain and, although we consider them reasonable as of the date of this presentation, they are subject to a wide variety of significant business, economic and competitive risks and uncertainties that could cause actual results to differ materially from forecasted results, including, among others, the risks and uncertainties described herein. For purposes of our forecast, we have assumed that no unexpected risks will materialize during the forecast periods. Any of the risks discussed in this presentation, to the extent they occur, could cause actual results of operations to vary significantly. We believe that we have a reasonable basis for these assumptions and that our actual results of operations will approximate those reflected in our forecast, but we can give no assurance that our forecasted results will be achieved. Accordingly, there can be no assurance that the forecast will be indicative of our future performance or that actual results will not differ materially from those presented in the forecast. This presentation and the accompanying forecast were not prepared with a view toward complying with generally accepted accounting principles (“GAAP”) with respect to prospective financial information. This presentation includes certain non-GAAP financial measures and comparable historical GAAP financials are not included herein. No independent accountants have compiled, examined or performed any procedures with respect to our forecast, nor have they expressed any opinion or any other form of assurance on our forecast or its achievability, and neither our independent auditors nor any other independent accountants assume responsibility for, and claim any association with, our forecast. We do not undertake any obligation to release publicly any revisions or updates that we may make to the forecast or the assumptions used to prepare the forecast to reflect events or circumstances after the date of this presentation. Therefore, you are cautioned not to place undue reliance on this information. 1
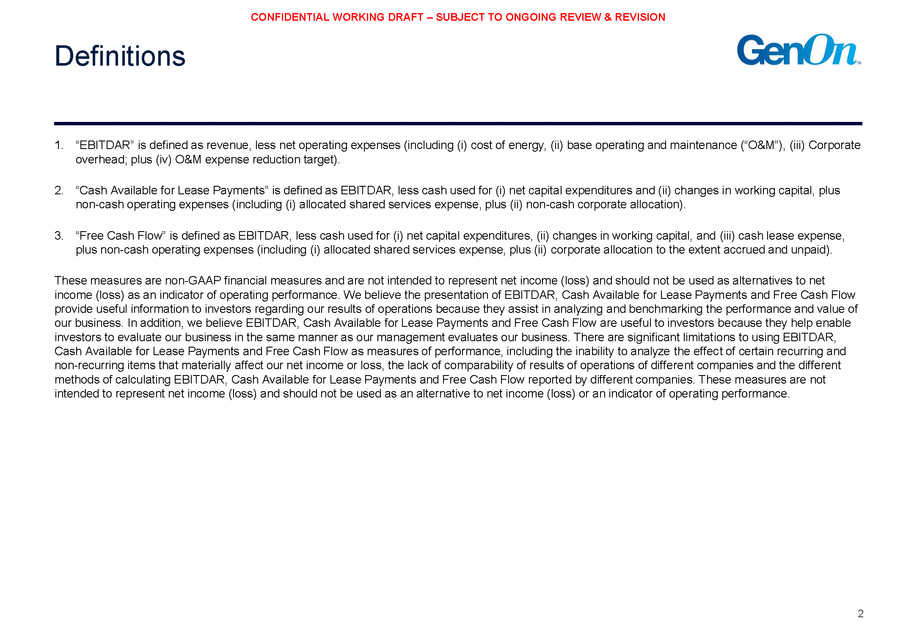
CONFIDENTIAL WORKING DRAFT – SUBJECT TO ONGOING REVIEW & REVISION Definitions 1. “EBITDAR” is defined as revenue, less net operating expenses (including (i) cost of energy, (ii) base operating and maintenance (“O&M”), (iii) Corporate overhead; plus (iv) O&M expense reduction target). 2. “Cash Available for Lease Payments” is defined as EBITDAR, less cash used for (i) net capital expenditures and (ii) changes in working capital, plus non-cash operating expenses (including (i) allocated shared services expense, plus (ii) non-cash corporate allocation). 3. “Free Cash Flow” is defined as EBITDAR, less cash used for (i) net capital expenditures, (ii) changes in working capital, and (iii) cash lease expense, plus non-cash operating expenses (including (i) allocated shared services expense, plus (ii) corporate allocation to the extent accrued and unpaid). These measures are non-GAAP financial measures and are not intended to represent net income (loss) and should not be used as alternatives to net income (loss) as an indicator of operating performance. We believe the presentation of EBITDAR, Cash Available for Lease Payments and Free Cash Flow provide useful information to investors regarding our results of operations because they assist in analyzing and benchmarking the performance and value of our business. In addition, we believe EBITDAR, Cash Available for Lease Payments and Free Cash Flow are useful to investors because they help enable investors to evaluate our business in the same manner as our management evaluates our business. There are significant limitations to using EBITDAR, Cash Available for Lease Payments and Free Cash Flow as measures of performance, including the inability to analyze the effect of certain recurring and non-recurring items that materially affect our net income or loss, the lack of comparability of results of operations of different companies and the different methods of calculating EBITDAR, Cash Available for Lease Payments and Free Cash Flow reported by different companies. These measures are not intended to represent net income (loss) and should not be used as an alternative to net income (loss) or an indicator of operating performance. 2
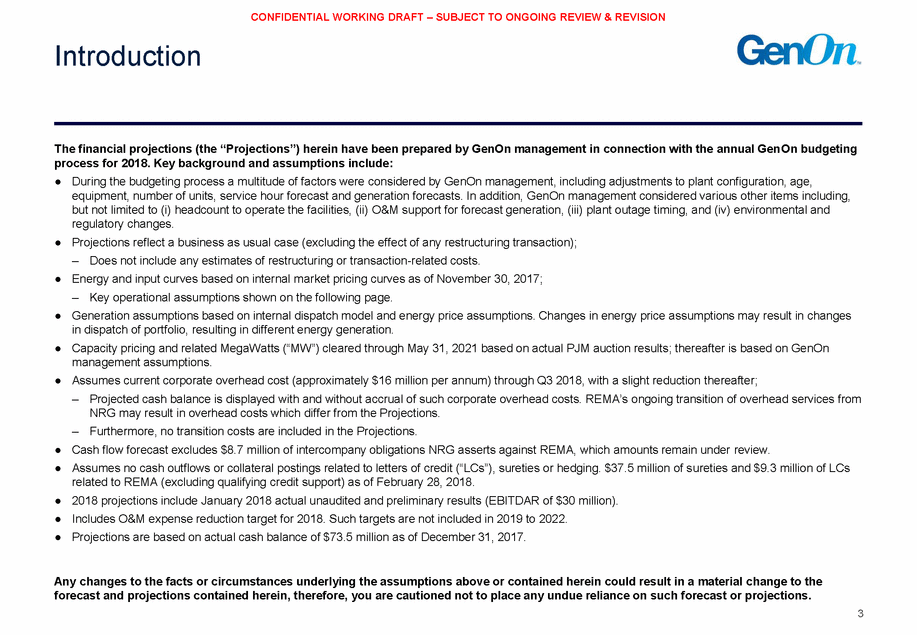
CONFIDENTIAL WORKING DRAFT – SUBJECT TO ONGOING REVIEW & REVISION Introduction The financial projections (the “Projections”) herein have been prepared by GenOn management in connection with the annual GenOn budgeting process for 2018. Key background and assumptions include: During the budgeting process a multitude of factors were considered by GenOn management, including adjustments to plant configuration, age, equipment, number of units, service hour forecast and generation forecasts. In addition, GenOn management considered various other items including, but not limited to (i) headcount to operate the facilities, (ii) O&M support for forecast generation, (iii) plant outage timing, and (iv) environmental and regulatory changes. Projections reflect a business as usual case (excluding the effect of any restructuring transaction); – Does not include any estimates of restructuring or transaction-related costs. Energy and input curves based on internal market pricing curves as of November 30, 2017; – Key operational assumptions shown on the following page. Generation assumptions based on internal dispatch model and energy price assumptions. Changes in energy price assumptions may result in changes in dispatch of portfolio, resulting in different energy generation. Capacity pricing and related MegaWatts (“MW”) cleared through May 31, 2021 based on actual PJM auction results; thereafter is based on GenOn management assumptions. Assumes current corporate overhead cost (approximately $16 million per annum) through Q3 2018, with a slight reduction thereafter; – Projected cash balance is displayed with and without accrual of such corporate overhead costs. REMA’s ongoing transition of overhead services from NRG may result in overhead costs which differ from the Projections. – Furthermore, no transition costs are included in the Projections. Cash flow forecast excludes $8.7 million of intercompany obligations NRG asserts against REMA, which amounts remain under review. Assumes no cash outflows or collateral postings related to letters of credit (“LCs”), sureties or hedging. $37.5 million of sureties and $9.3 million of LCs related to REMA (excluding qualifying credit support) as of February 28, 2018. 2018 projections include January 2018 actual unaudited and preliminary results (EBITDAR of $30 million). Includes O&M expense reduction target for 2018. Such targets are not included in 2019 to 2022. Projections are based on actual cash balance of $73.5 million as of December 31, 2017. Any changes to the facts or circumstances underlying the assumptions above or contained herein could result in a material change to the forecast and projections contained herein, therefore, you are cautioned not to place any undue reliance on such forecast or projections. 3
CONFIDENTIAL WORKING DRAFT – SUBJECT TO ONGOING REVIEW & REVISION Key operational assumptions Market Component 2018 2019 2020 2021 2022 Market Component 2018 2019 2020 2021 2022 PENLC 36.2 35.2 34.5 33.7 33.6 PENLC 26.2 26.4 25.9 25.7 25.7 ATSI 37.8 37.6 36.8 36.1 36.1 ATSI 27.1 27.4 26.7 26.5 26.7 Market Component 2018 2019 2020 2021 2022 Market Component 2018 2019 2020 2021 2022 PEPCO / Z6 NNY 12,180 13,420 13,380 13,230 13,210 UC RTO 164.8 100.0 76.5 100.0 100.0 Market Component 2018 2019 2020 2021 2022 2018 2019 2020 2021 2022 TRANSC Z6 NY 0.69 0.49 0.41 0.43 0.43 Conemaugh 1.86 1.80 1.90 1.96 2.43 Market Component 2018 2019 2020 2021 2022 Market Plant 2018 2019 2020 2021 2022 DUQ - DOM 18.4 18.5 18.1 17.4 16.9 Conemaugh 16.6 16.3 14.5 13.2 8.1 PEPCO - Z6 NNY 17.4 19.1 18.6 18.1 18.0 DAYTON - DOM 19.0 19.1 18.7 18.0 17.5 4 ATSI - DOM20.821.020.720.119.8 METED - M315.515.315.014.014.0 PENELC - M315.315.114.913.913.7 PJMKeystone16.315.914.413.18.1 PJMWEST - M316.316.115.614.614.4 Dark spreads ($/MWh) Spark spreads ($/MWh) TETCOM30.02(0.02)(0.05)(0.03)(0.04) NYMEXNG2.962.892.852.872.89 Keystone1.891.841.911.972.43 Coal delivered ($/MMBtu) Gas prices ($/MMBtu) ATSI / DOM15,56015,92015,99015,77015,480 PJMUC EMAAC225.4119.8187.9150.0150.0 PJMWEST / M312,48012,61012,58012,15012,060 Capacity ($MW/day) Implied heat rates (Btu / Kwh) PEPCO29.529.629.028.828.7 PEPCO40.940.039.138.438.3 PJMWEST27.126.926.326.126.0 PJMWEST37.236.235.234.534.4 Off-peak power pricing ($/MWh) On-peak power pricing ($/MWh)
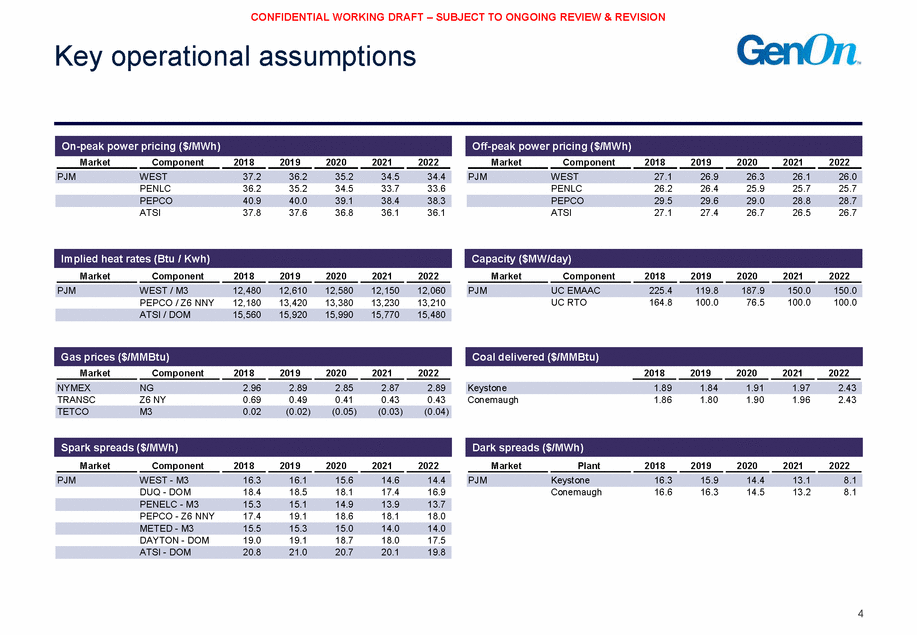
CONFIDENTIAL WORKING DRAFT – SUBJECT TO ONGOING REVIEW & REVISION Annual forecast summary (US$ in millions) 2018E 2019E 2020E 2021E 2022E $361 $400 $317 Keystone Conemaugh Shawville Gilbert Sayreville Other plants Corporate & other $84 82 114 26 13 31 12 $71 75 107 25 11 16 13 $67 66 101 24 9 11 13 $62 66 96 25 10 11 14 $55 51 87 23 11 12 14 $292 $285 $300 $253 $200 $100 $0 2018E 2019E 2020E 2021E 2022E $108 $120 $100 $80 $60 $40 $20 $0 ($20) 2018E 2019E 2020E 2021E 2022E Keystone Conemaugh Shawville Gilbert Sayreville Other plants / other Corporate overhead Management O&M challenge $25 22 25 13 11 22 (16) 8 $10 19 15 14 9 13 (13) – $11 7 12 15 7 8 (13) – $3 10 10 17 9 8 (13) – $1 (4) 9 14 9 9 (13) – 2018E 2019E 2020E 2021E 2022E $20 $16 $15 2018E 2019E 2020E 2021E 2022E $9 $10 Keystone Conemaugh Shawville Gilbert Sayreville Other plants $3 3 0 5 0 0 $5 1 – 0 – 0 $5 3 – 1 – – $8 7 – 0 – 0 $4 9 – 0 – – $5 $0 2018E 2019E 2020E 2021E 2022E 5 Total capex$11$7$9$16$12 KeystoneConemaughShawville GilbertSayrevilleOther plants $11 $12 $7 CapEx Total EBITDAR$108$66$47$44$26 $66 $47$44 $26 EBITDAR Total revenue$361$317$292$285$253 Revenue Build-up by plant
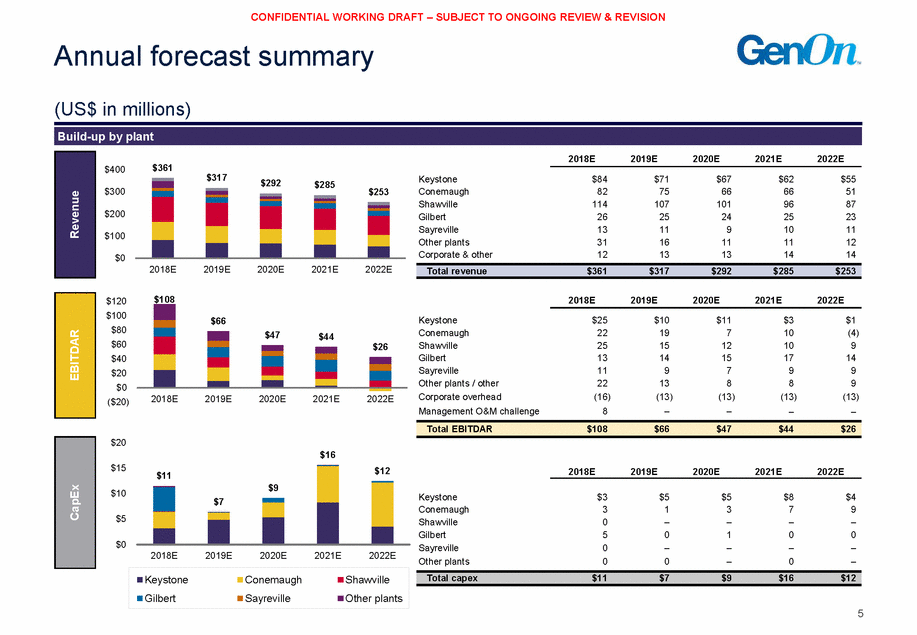
CONFIDENTIAL WORKING DRAFT – SUBJECT TO ONGOING REVIEW & REVISION Annual cash flow summary (US$ in millions) 2018 2019 2020 2021 2022 Keystone Conemaugh Shawville Gilbert Sayreville Other plants Total generation (TWh) Energy revenue Capacity revenue Other revenue Total revenue (-) COGS (-) O&M (-) Corporate overhead (+) Management O&M challenge EBITDAR (-) CapEx (-) in working capital / other (+) Unpaid corporate overhead Cash available for lease payments (-) Cash lease payments Free cash flow Beginning cash balance (+) change in cash Ending cash balance Ending cash balance if corp. overhead paid 2.1 2.0 2.3 0.0 0.0 (0.0) 2.0 2.2 2.4 0.1 0.0 (0.0) 2.0 2.0 2.5 0.0 0.0 (0.0) 1.8 2.0 2.3 0.0 0.0 (0.0) 1.5 1.3 2.0 0.0 0.0 (0.0) 6.4 $231 115 15 6.7 $212 89 16 6.5 $204 72 16 6.1 $189 79 17 4.8 $156 80 17 $361 ($167) (78) (16) 8 $317 ($164) (75) (13) – $292 ($162) (71) (13) – $285 ($154) (74) (13) – $253 ($138) (76) (13) – ($11) (4) 16 ($7) (2) 13 ($9) (3) 13 ($16) (0) 13 ($12) (1) 13 $108 (55) $70 (65) $47 (56) $41 (47) $25 (46) $74 53 $127 4 $131 (9) $122 (6) $117 (21) 6 $127 $131 $122 $117 $95 $111 $103 $81 $63 $29 $53 $4 ($9) ($6) ($21) $108 $66 $47 $44 $26 Free cash flow detail
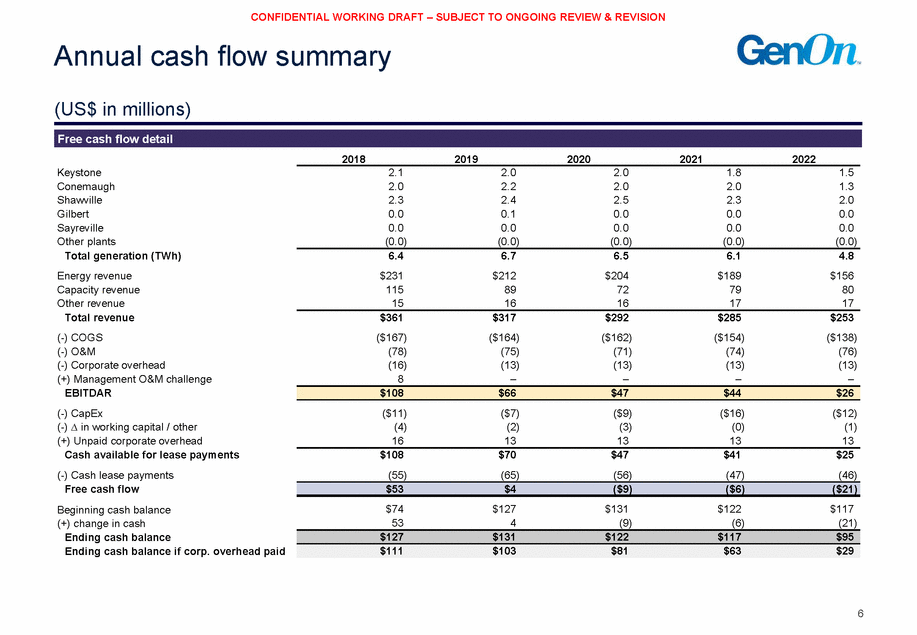
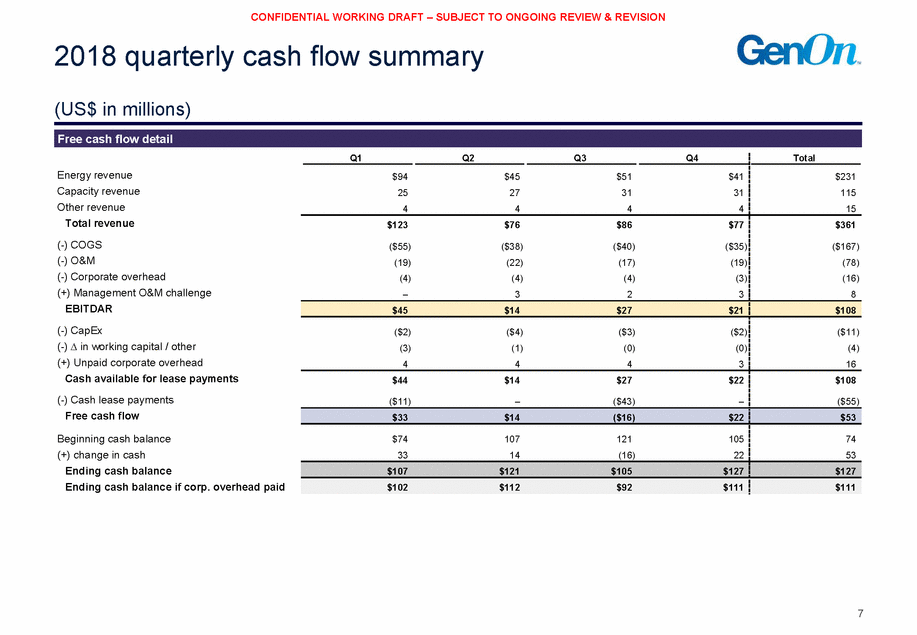
CONFIDENTIAL WORKING DRAFT – SUBJECT TO ONGOING REVIEW & REVISION 2018 quarterly cash flow summary (US$ in millions) Energy revenue Capacity revenue Other revenue Total revenue (-) COGS (-) O&M (-) Corporate overhead (+) Management O&M challenge EBITDAR (-) CapEx (-) in working capital / other (+) Unpaid corporate overhead Cash available for lease payments (-) Cash lease payments Free cash flow Beginning cash balance (+) change in cash Ending cash balance Ending cash balance if corp. overhead paid 7 Q1 Q2 Q3 Q4 Total $94 $45 $51 $41 25 27 31 31 4 4 4 4 $231 115 15 $123 $76 $86 $77 ($55) ($38) ($40) ($35) (19) (22) (17) (19) (4) (4) (4) (3) – 3 2 3 $361 ($167) (78) (16) 8 $45 $14 $27 $21 $108 ($2) ($4) ($3) ($2) (3) (1) (0) (0) 4 4 4 3 ($11) (4) 16 $44 $14 $27 $22 ($11) – ($43) – $108 ($55) $33 $14 ($16) $22 $53 $74 107 121 105 33 14 (16) 22 74 53 $107 $121 $105 $127 $127 $102 $112 $92 $111 $111 Free cash flow detail
