Attached files
UNITED STATES
SECURITIES AND EXCHANGE COMMISSION
Washington, D.C. 20549
FORM 10-K
(Mark One)
| ☑ | Annual Report Pursuant to Section 13 or 15(d) of the Securities Exchange Act of 1934 |
For the Fiscal Year Ended June 30, 2018
| ☐ | Transition Report Pursuant to Section 13 or 15(d) of the Securities Exchange Act of 1934 |
For the Transition Period From to .
Commission File number 001-34839
| Electromed, Inc. |
| (Exact Name of Registrant as Specified in its Charter) |
| Minnesota | 41-1732920 | |
| (State or other jurisdiction of | (IRS Employer | |
| incorporation or organization) | Identification No.) |
500 Sixth Avenue NW, New Prague, MN 56071
(Address of principal executive offices)
| (952) 758-9299 |
| (Registrant’s telephone number, including area code) |
Securities registered pursuant to Section 12(b) of the Act:
| Common Stock, $0.01 par value | NYSE American | |
| (Title of each class) | (Name of each exchange on which registered) |
Securities registered pursuant to Section 12(g) of the Exchange Act: None
Indicate by check mark if the registrant is a well-known seasoned issuer, as defined in Rule 405 of the Securities Act. Yes ☐ No ☑
Indicate by check mark if the registrant is not required to file reports pursuant to Section 13 or Section 15(d) of the Act. Yes ☐ No ☑
Indicate by check mark whether the registrant: (1) has filed all reports required to be filed by Section 13 or 15(d) of the Securities Exchange Act of 1934 during the preceding 12 months (or for such shorter period that the registrant was required to file such reports), and (2) has been subject to such filing requirements for the past 90 days. Yes ☑ No☐
Indicate by check mark whether the registrant has submitted electronically and posted on its corporate Website, if any, every Interactive Data File required to be submitted and posted pursuant to Rule 405 of Regulation S-T (§232.405 of this chapter) during the preceding 12 months (or for such shorter period that the registrant was required to submit and post such files). Yes ☑ No ☐
Indicate by check mark if disclosure of delinquent filers pursuant to Item 405 of Regulation S-K (§ 229.405 of this chapter) is not contained herein, and will not be contained, to the best of registrant’s knowledge, in definitive proxy or information statements incorporated by reference in Part III of this Form 10-K or any amendment to this Form 10-K. ☑
Indicate by check mark whether the registrant is a large accelerated filer, an accelerated filer, a non-accelerated filer, a smaller reporting company, or an emerging growth company. See the definitions of “large accelerated filer,” “accelerated filer”, “smaller reporting company” and “emerging growth company” in Rule 12b-2 of the Exchange Act.
| Large accelerated filer ☐ | Accelerated filer ☐ |
| Non-accelerated
filer ☐ (Do not check if smaller reporting company) |
Smaller reporting company ☑ Emerging growth company ☐ |
If an emerging growth company, indicate by check mark if the registrant has elected not to use the extended transition period for complying with any new or revised financial accounting standards provided pursuant to Section 13(a) of the Exchange Act. ☐
Indicate by check mark whether the registrant is a shell company (as defined in Rule 12b-2 of the Act). Yes ☐ No ☑
The aggregate market value of the common stock held by non-affiliates of the registrant as of December 31, 2017 was approximately $41,152,000 based upon the closing price of the registrant’s common stock, as reported on the NYSE American, on such date.
There were 8,329,826 shares of the registrant’s common stock outstanding as of September 21, 2018.
DOCUMENTS INCORPORATED BY REFERENCE
Portions of the Definitive Proxy Statement for the registrant’s Fiscal 2019 Annual Meeting of Shareholders, to be filed within 120 days of June 30, 2018, are incorporated by reference into Part III of this Form 10-K.
Electromed, Inc.
Index to Annual Report on Form 10-K
i
INFORMATION REGARDING FORWARD-LOOKING STATEMENTS
Statements contained in this Annual Report on Form 10-K that are not statements of historical fact should be considered forward-looking statements within the meaning of the safe harbor provisions of Section 27A of the Securities Act of 1933, as amended (the “Securities Act”), and Section 21E of the Securities Exchange Act of 1934, as amended (the “Exchange Act”). Forward-looking statements include, but are not limited to, statements regarding: our business strategy, including our intended level of investment in research and development and marketing activities; our expectations with respect to earnings, gross margins and sales growth, industry relationships, marketing strategies and international sales; estimated sizes of markets into which our products are or may be sold; our business strengths and competitive advantages; ability to grow additional sales or distribution channels; our intent to retain any earnings for use in operations rather than paying dividends; our expectation that our products will continue to qualify for reimbursement and payment under government and private insurance programs; our intellectual property plans and practices; the expected impact of applicable regulations on our business; our beliefs about our manufacturing processes; our expectations and beliefs with respect to our employees and our relationships with them; our belief that our current facilities are adequate to support our growth plans; our expectations with respect to ongoing compliance with the terms of our credit facility; our expectations regarding the ongoing availability of credit and our ability to renew our line of credit; the enhancements to our products and services; expected excise tax exemption for the SmartVest System; and our anticipated revenues, expenses, capital requirements and liquidity. Words such as “anticipate,” “believe,” “continue,” “could,” “estimate,” “expect,” “goal,” “intend,” “may,” “ongoing,” “plan,” “potential,” “project,” “should,” “target,” “will,” “would,” and similar expressions, including the negative of these terms, are intended to identify forward-looking statements but are not the exclusive means of identifying such statements. Although we believe these forward-looking statements are reasonable, they involve risks and uncertainties that may cause actual results to differ materially from those projected by such statements. Such statements involve known and unknown risks, uncertainties and other factors that may cause our actual results or our industry’s actual results, levels of activity, performance or achievements to be materially different from the information expressed or implied by the forward-looking statements.
Factors that could cause actual results to differ from those discussed in the forward-looking statements include, but are not limited to:
| ● | the competitive nature of our market; |
| ● | changes to Medicare, Medicaid, or private insurance reimbursement policies; |
| ● | changes to health care laws; |
| ● | changes affecting the medical device industry; |
| ● | our ability to develop new sales channels for our product; |
| ● | our need to maintain regulatory compliance and to gain future regulatory approvals and clearances; |
| ● | new drug or pharmaceutical discoveries; |
| ● | general economic and business conditions; |
| ● | our ability to renew our line of credit or obtain additional credit as necessary; |
| ● | our ability to protect and expand our intellectual property portfolio; and |
| ● | the risks associated with expansion into international markets. |
This list of factors is not exhaustive, however, and these or other factors, many of which are outside of our control, could have a material adverse effect on us and our results of operations. Therefore, you should consider these risk factors with caution and form your own critical and independent conclusions about the likely effect of these risk factors on our future performance. Forward-looking statements speak only as of the date on which the statements are made, and we undertake no obligation to update any forward-looking statement for any reason, even if new information becomes available or other events occur in the future. You should carefully review the disclosures and the risk factors described in this and other documents we file from time to time with the Securities and Exchange Commission (the “SEC”), including our Quarterly Reports on Form 10-Q and Current Reports on Form 8-K. All forward-looking statements attributable to us or persons acting on our behalf are expressly qualified in their entirety by the cautionary statements set forth herein.
ii
| Item 1. | Business. |
Overview
Electromed, Inc. (“we,” “our,” “us,” “Electromed” or the “Company”) develops, manufactures, markets and sells innovative products that provide airway clearance therapy, including the SmartVest® Airway Clearance System (“SmartVest System”) and related products, to patients with compromised pulmonary function with a commitment to excellence and compassionate service. Our goal is to make High Frequency Chest Wall Oscillation (“HFCWO”) treatments as effective, convenient, and comfortable as possible, so our patients, in their homes, will adhere to their prescribed treatment schedule, leading to improved airway clearance, enhanced respiratory function and reduced healthcare utilization. We employ a direct-to-patient and provider model, through which we obtain patient referrals from clinicians, manage insurance claims on behalf of our patients and their clinicians, deliver our solutions to patients and train them on proper use in their homes. This model allows us to directly approach patients and clinicians, whereby we disintermediate the traditional durable medical equipment (“DME”) channel and capture both the manufacturer and distributor margins. Electromed was incorporated in Minnesota in 1992. Our common stock is listed on the NYSE American under the ticker symbol “ELMD.”
The SmartVest System features a programmable air pulse generator, a therapy garment worn over the upper body and a connecting hose, which together provide safe, comfortable, and effective airway clearance therapy. The SmartVest System generates HFCWO, an airway clearance therapy. The garment repeatedly compresses and releases the upper body at frequencies from 5 to 20 cycles per second creating a “mini cough.” Each compression (or oscillation) produces pulsations that thin and loosen secretions from the surfaces of the lung airways, propelling them toward the mouth where they can be removed by normal coughing or suction.
HFCWO facilitates airway clearance by loosening and mobilizing respiratory secretions in a patient’s lungs. One factor of respiratory health is the ability to clear secretions from airways. Impaired airway clearance, when mucus cannot be expectorated, may result in labored breathing and/or inflammatory and immune systems boosting mucus production that invites bacteria trapped in stagnant secretions to cause infections. Studies show that HFCWO therapy is as effective an airway clearance method for patients who have compromised pulmonary function as traditional chest physical therapy (“CPT”) administered by a respiratory therapist. However, HFCWO can be self-administered, relieving a caregiver of participation in the therapy, and eliminating the attendant cost of an in-home care provider. We believe that HFCWO treatments are cost-effective primarily because they reduce a patient’s risk of respiratory infections and other secondary complications that are associated with impaired mucus transport and often result in costly hospital visits and repeated antibiotic use.
The SmartVest System is designed for patient comfort and ease of use which promotes compliance with prescribed treatment schedules, leading to improved airway clearance, enhanced respiratory function and a reduction in healthcare utilization. We offer a broad range of garments, referred to as vests and wraps, in sizes for children and adults that allow for tailored fit and function. User-friendly controls allow children and the elderly to administer their own daily therapy with minimal or no assistance. Our direct product support services provide patient and clinician education, training, and follow-up to ensure the product is integrated into each patient’s daily treatment regimen. Additionally, our reimbursement and billing departments assure we are working on behalf of the patient by processing their physician paperwork, providing clinical support as needed and billing Medicare or the applicable insurance provider on their behalf. We believe that the advantages of the SmartVest System and the Company’s customer services to the patient include:
| ● | improved quality of life; |
| ● | reduction in healthcare utilization; |
| ● | independence from a dedicated caregiver; |
| ● | consistent treatments at home; |
| ● | improved comfort during therapy; |
| ● | portability; and |
1
| ● | eligibility for reimbursement by private insurance, federal or state government programs or combinations of the foregoing. |
Our Products
Since 2000, we have marketed the SmartVest System and its predecessor products to patients suffering from cystic fibrosis, bronchiectasis and repeated episodes of pneumonia. Additionally, we offer our products to a patient population that includes neuromuscular disorders such as cerebral palsy, muscular dystrophies, amyotrophic lateral sclerosis (“ALS”), the combination of emphysema and chronic bronchitis commonly known as chronic obstructive pulmonary disease (“COPD”), and patients with post-surgical complications or who are ventilator dependent or have other conditions involving excess secretion and impaired mucus transport.
Our products are primarily sold into the home health care market for patients with chronic lung issues, including bronchiectasis, cystic fibrosis and neuromuscular disease. We also sell our products in acute care settings (e.g., hospitals and clinics) when the patient is in a post-surgical or intensive care unit or was admitted for a lung infection brought on by compromised airway clearance. Accordingly, our sales points of contact include adult pulmonology clinics, cystic fibrosis centers, neuromuscular clinics, pulmonary rehabilitation centers, hospitals and home health care centers.
We have received clearance from the U.S. Food and Drug Administration (“FDA”) to market the SmartVest System to promote airway clearance and improve bronchial drainage. In addition, Electromed is certified to apply the Conformité Européenne (“European Conformity” or “CE”) marking for HFCWO device sales in all European Union countries and approved for HFCWO device sales in other, select international countries. The SmartVest System is available only with a physician’s prescription.
As part of our growth strategies, we periodically evaluate opportunities involving products and services, especially those that may provide value to the respiratory homecare and institutional market.
The SmartVest System
The SmartVest System consists of an inflatable therapy garment, a programmable air pulse generator and a patented single-hose that delivers air pulses from the generator to the garment. The SmartVest System is currently available in two models – SV2100 and SQL® – both of which are sold into home care and institutional markets for use by patients and hospitals. Both models deliver the same clinically effective HFCWO therapy. Additionally, both systems are designed for maximum comfort and lifestyle convenience, so patients can readily fit HFCWO therapy into their daily routines:
| ● | Patented single-hose design: When the SmartVest System is in use, a single-hose delivers oscillations to the SmartVest garment, which we believe provides therapy in a more comfortable and unobtrusive manner than a two-hose system. Oscillations are delivered evenly from the base of the SmartVest garment, extending the forces upward and inward in strong but smooth cycles surrounding the chest. |
| ● | Open system design with active inflate – active deflate: The active inflate – active deflate mechanism of the SmartVest System provides patients a more comfortable treatment experience by working in unison with patients to allow them to take deep breaths and breathe more easily without feeling restricted. |
| ● | Soft-fabric garment is lightweight and comfortable: The SmartVest garment is lightweight and designed to resemble an article of clothing. Quick fit Velcro®-like closures allow for a secure, comfortable fit without bulky straps and buckles. The simple design creates a broad size adjustment range to ensure a properly tailored fit. The SmartVest garment is available in a variety of colors and sizes to accommodate pediatric and adult patients. |
| ● | Programmable generator with user-friendly device operation: The SmartVest System generator uses an internal programmable memory feature to manage air pulse frequency, air pulse pressure and treatment time to be set as prescribed by the patient’s physician. The air pulse frequency can be adjusted from 5 to 20 cycles per second and the air pulse pressure can be adjusted from 10 to 100% of a maximal pressure range. |
2
| ● | Patented Soft Start® and 360° garment oscillation coverage: Soft Start creates an upward flow of air that gently fills the garment while initiating the squeeze/release pulse, acclimating the patient to therapy and minimizing “vest creep.” All SmartVest garments provide 360° oscillation coverage, which delivers simultaneous treatment to all lobes of the lungs. |
The SmartVest SQL System
We designed the SmartVest SQL, our latest generation, with an array of features that make it easier to use and enable greater patient freedom as compared to the SmartVest SV2100. In addition to incorporating the unique benefits of the SV2100, the SmartVest SQL was designed to be significantly smaller, quieter, and lighter than its predecessor, and offers advanced generator programmability, including an enhanced pause feature with save, lock and restore functionality:
| ● | Smaller, quieter and lighter: The SmartVest SQL System is 25% smaller, 5db quieter and 30% lighter than the SmartVest SV2100. The SmartVest SQL is the lightest and overall quietest HFCWO generator on the market, weighing less than 16 pounds, making it easier for patients to use and integrate HFCWO therapy into their daily lives. |
| ● | Programmable ramp: The SmartVest SQL integrates fully programmable and adjustable ramp, which allows HFCWO therapy to start at a low frequency and pressure, ramp up, and then reduce the frequency and pressure during treatment. This allows clinicians greater flexibility to program patient-specific HFCWO therapy protocols. |
| ● | Enhanced programmability: The SmartVest SQL features new programmability options for saving, locking and restoring protocols, providing an extra layer of security. Further, an enhanced pause feature allows the physician to program dedicated time(s) for the patient to clear secretions. |
SmartVest Connect
In June 2017, we launched the SmartVest SQL with SmartVest Connect™ wireless technology, a personalized HFCWO therapy management portal for patients with compromised pulmonary function. The SmartVest SQL with wireless technology features built-in cellular connectivity, offering healthcare teams and patients access to treatment information to better collaborate in making patient-centered care decisions. SmartVest Connect is available to pediatric and cystic fibrosis patients using a wirelessly enabled SmartVest SQL system. We expanded SmartVest Connect availability to targeted adult pulmonary clinics throughout fiscal 2018.
| ● | Performance insights: SmartVest Connect enables patients to track progress of their therapy plan and includes a real-time SmartVest Score and easy-to-read goal reports that provide an in-depth look at performance. |
| ● | Treatment collaboration: Created to encourage patient engagement, SmartVest Connect provides feedback for patients to take an active role in their HFCWO therapy, fostering improved therapy adherence. |
| ● | Engineered for simplicity: SmartVest SQL with SmartVest Connect is simple, intuitive, and designed to automatically update following completion of a therapy session. |
Other Products
| ● | We market the Single Patient Use (“SPU”) SmartVest® and SmartVest Wrap® to health care providers, particularly those working in intensive care units. Hospitals issue the SPU SmartVest or SmartVest Wrap to an individual patient for the duration of the patient’s stay. Both SPU products facilitate continuity of care because they introduce the patient to our product line and may encourage use of the SmartVest System for home care, which can be provided to patients with a chronic condition upon discharge. Both SPU products also provide full coverage pulsation. |
| ● | The Aerobika® Oscillating Positive Expiratory Pressure (“OPEP”) device is sold in to the U.S. home care market through a distributor agreement with Monaghan Medical Corp. since early calendar year 2017. The Aerobika OPEP device is a drug-free, easy to use, hand-held device with a proprietary pressure-oscillation dynamic that provides intermittent resistance and creates positive pressure and oscillations simultaneously. The device opens weak or collapsed airways to mobilize and assist mucociliary clearance to the upper airways where it can be coughed out. After over a year of offering Aerobika® OPEP, we have determined that continuing to offer the product direct to patients is unlikely to serve a broader patient population as originally planned. We plan to discontinue distribution of the Aerobika OPEP device prior to December 1, 2018. |
3
Our Market
We estimate the total served U.S. market for HFCWO in 2017 was approximately $150 million to $170 million. We believe our business model is supported by many market trends related to an aging population and growing awareness by physicians of diseases and conditions for which patients can benefit from using HFCWO therapy. Indications for when HFCWO should be prescribed are not specific to any one disease. A physician may elect to prescribe HFCWO when he or she believes the patient will benefit from improved airway clearance and external chest manipulation is the treatment of choice to enhance mucus transport and improve bronchial drainage.
The SmartVest System is prescribed for patients with bronchiectasis, ALS, cerebral palsy, cystic fibrosis, muscular dystrophy, quadriplegia and the combination of emphysema and chronic bronchitis commonly known as chronic obstructive pulmonary disease (“COPD”). The estimated patient populations in 2017 for diseases and conditions routinely prescribed HFCWO therapy are listed below.
| ● | Bronchiectasis: We believe that bronchiectasis, an irreversible lung condition where the airways become damaged and abnormally widened from recurring inflammation or infection, represents the fastest growing diagnostic category and greatest potential for HFCWO growth in the United States. Bronchiectasis is currently under recognized and underdiagnosed. Several recent studies have estimated prevalence of bronchiectasis, which we believe are helpful for estimating a range of the market size. |
| ○ | Seitz (2012) estimated that 190,000 unique cases of bronchiectasis were diagnosed in Medicare patients in 2007 and bronchiectasis prevalence increased 8.7% annually between 2000 and 20071. Based on historic growth in prevalence and assuming a constant growth rate, the estimated number of bronchiectasis diagnoses in 2017 exceeded 440,000. |
| ○ | Martinez-Garcia (2013) indicated that prevalence of bronchiectasis is high in patients with moderate-to-severe COPD and has been associated with exacerbations and bacterial colonization. Ninety-nine patients in Global Initiative for Chronic Obstructive Lung Disease (GOLD) II, 85 in GOLD III, and 17 in GOLD IV stages were included in the study. Bronchiectasis was present in 115 patients (57.2%). Bronchiectasis was associated with an independent increased risk of all-cause mortality in patients with moderate-to-severe COPD.2 |
| ○ | Chalmers (2017) found that prevalence of bronchiectasis in patients with COPD ranged from a low of 4% to as high as 69% with mean prevalence of 54% in a recent systematic literature review. In many studies in patients with COPD, the presence of bronchiectasis was associated with reduced lung function, greater sputum production, more frequent exacerbations and increased mortality versus those with COPD alone.3 |
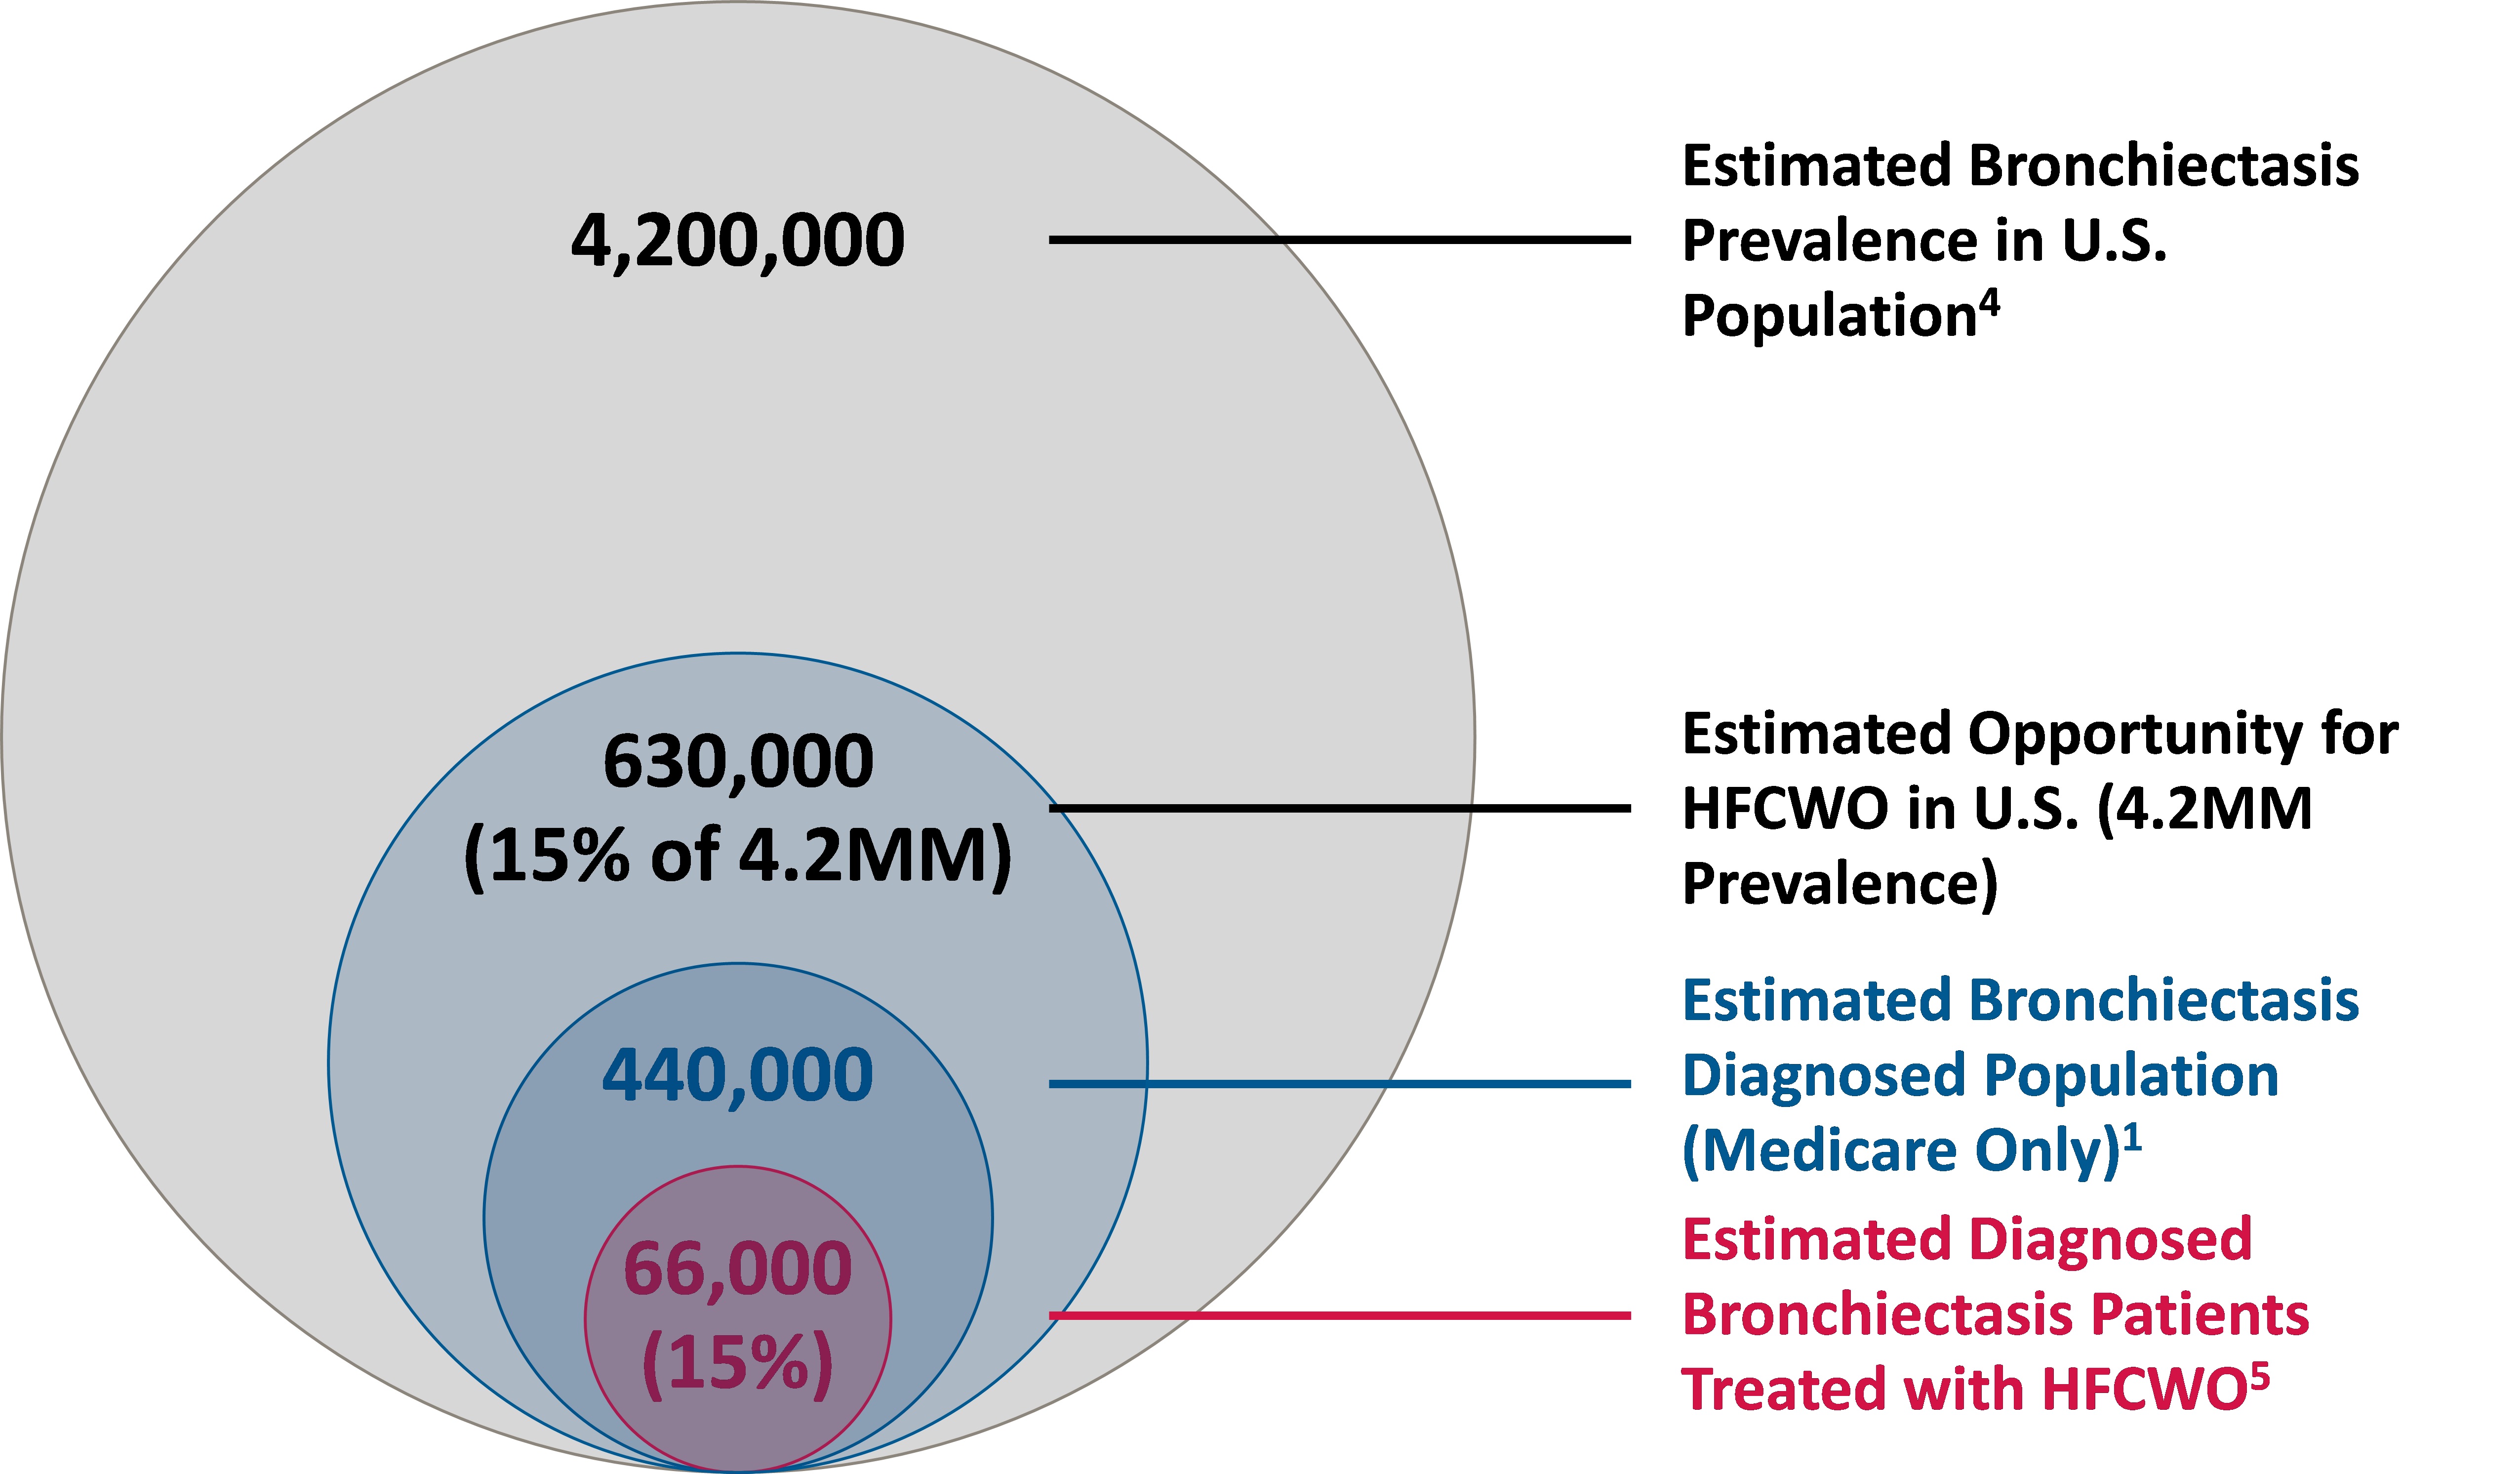
| ○ | Weycker (2017) projected approximately 4.2 million adults in the United States over 40 years may have bronchiectasis, suggesting there is a large pool of patients with undiagnosed disease.4 |
These clinical studies indicate a wide range of potential prevalence of bronchiectasis patients from a low of 440,000 to as high as 4.2 million patients in the United States. We also believe that it is difficult to estimate from these clinical studies which patients will need or benefit from HFCWO. A clinical study published in 2017 using data from the US bronchiectasis research registry indicated approximately 15% of the registered patients were prescribed HFCWO as part of their treatment plan.5 Using that study data, we estimate that, within the diagnosed Medicare population of 440,000, approximately 15% or 66,000 have been prescribed HFCWO. We believe that bronchiectasis is underdiagnosed in the U.S. based on clinical study evidence. We also believe that HFCWO is under prescribed for bronchiectasis patients. By applying approximately 15% HFCWO penetration of diagnosed Medicare patients to the Weycker clinical study to the estimated 4.2 million prevalence of bronchiectasis in the U.S., we derived that the HFCWO opportunity may be 630,000 forecasted units. (See Figure 1)
4
Bronchiectasis is experiencing a surge in clinical interest and awareness, including the relationship to COPD, commonly referred to as bronchiectasis COPD overlap syndrome (“BCOS”). A recent paper that evaluated the U.S. Bronchiectasis Research Registry (“BRR”) found that out of 1,826 patients with bronchiectasis enrolled between 2008 and 2014, 20% (n=350) also had COPD and 29% (n=515) also had asthma.5 Other studies have found that the overlap between bronchiectasis and COPD is currently observed in 27% to 57% of patients with COPD. 6–8
Estimated HFCWO Market Opportunity - Bronchiectasis Patients (U.S.) – Figure 1
1Seitz, A.E., et al. Trends in Bronchiectasis Among Medicare Beneficiaries in the United States, 2000 to 2007. Chest. 2012;142(2), 432–439.
2Martínez-García, M.A., et al. Prognostic Value of Bronchiectasis in Patients with Moderate-to-Severe Chronic Obstructive Pulmonary Disease. Am J Respir Crit Care Med. 2013;187(8):823–31.
3Chalmers J.D. and Sethi S. Raising awareness of bronchiectasis in primary care: overview of diagnosis and management strategies in adults. NPJ Prim Care Respir Med. 2017;27:18.
4Weycker D, Hansen G, Seifer F. Prevalence and incidence of noncystic fibrosis bronchiectasis among US adults in 2013. Chronic Respiratory Disease. 2017; 14(4):377-384.
5Aksamit T.R., et al. Bronchiectasis Research Registry C. Adult Patients With Bronchiectasis: A First Look at the US Bronchiectasis Research Registry. Chest. 2017;151:982-92
6Patel I.S., et al. Bronchiectasis, exacerbation indices, and inflammation in chronic obstructive pulmonary disease. Am J Respir Crit Care Med. 2004;170:400-7.
7O’Brien C, et al. Physiological and radiological characterisation of patients diagnosed with chronic obstructive pulmonary disease in primary care. Thorax. 2000;55:635-42.
8Bafadhel M, et al. The role of CT scanning in multidimensional phenotyping of COPD. Chest. 2011;140:634-42.
5
| ● | Neuromuscular and neuromotor disorders: A range of neuromuscular and neuromotor disorders — including ALS, cerebral palsy, Duchenne muscular dystrophy, and quadriplegia — can cause respiratory muscle weakness and compromised airway clearance. Effective airway clearance therapy is a critical aspect of respiratory care for people with neuromuscular or neuromotor disorders who lack respiratory muscle strength. Not all people with neuromuscular or neuromotor disorders will require airway clearance therapy. We estimate the total number of people in the U.S. with a neuromuscular or neuromotor disorder that may benefit from airway clearance therapy is approximately 250,000. |
| ● | Cystic Fibrosis: In the U.S., approximately 30,000 people are living with cystic fibrosis, and an estimated 1,000 new cases of cystic fibrosis are diagnosed each year. |
Marketing, Sales and Distribution
Our sales and marketing efforts are focused on building market awareness and acceptance of our products and services with physicians, clinicians, patients, and third-party payers. Because the sale of the SmartVest System requires a physician’s prescription, we market to physicians and health care providers as well as directly to patients. The vast majority of our revenue comes from domestic home care sales through a physician referral model. We have established our own domestic sales force, which we believe is able to provide superior education, support and training to our customers. Our direct U.S. sales force works with physicians and clinicians, primarily pulmonologists, in defined territories to help them understand our products and services and the value they provide to their respective patients. As of June 30, 2018, we had 50 field sales employees, including five regional sales managers, 42 clinical area managers (“CAMs”) and three clinical educators. We also have developed a network of approximately 300 respiratory therapists and health care professionals across the U.S. to assist with in-home SmartVest patient training on a non-exclusive independent contractor basis. These independent contractors are credentialed by the National Board for Respiratory Care as either Certified Respiratory Therapists or Registered Respiratory Therapists.
Of the $28.2 million of our revenue derived from the U.S. in fiscal 2018, approximately 94% represented home care and 6% represented institutional sales. Due to readmission penalties associated with the Patient Protection and Affordable Care Act, as reconciled by the Health Care and Education Reconciliation Act of 2010 (collectively the “PPACA”), for certain diseases and conditions including COPD and pneumonia, we believe opportunities for further growth exist for HFCWO therapy because the device used by a patient in an institution may influence the choice of device prescribed at discharge. We expect to achieve future sales, earnings, and overall market share growth with increasing home care referrals by educating and building awareness of diseases and conditions that may benefit from HFCWO, like bronchiectasis, with physicians and patients and the value of SmartVest Airway Clearance System’s differentiated features and benefits.
We generate sales leads through multiple channels that include visits to pulmonology clinics and medical centers, participation in medical conferences, maintenance of industry contacts in order to increase the visibility and acceptance of our products by physicians and health care professionals, participation with patient organizations such as the Cystic Fibrosis Foundation, as well as through patients by word of mouth and traffic to our website. We are currently evaluating opportunities to offer the SmartVest System through selected Home Medical Equipment (“HME”) distributors. The addition of a HME distribution network would expand our access to physicians and institutions in certain areas of the United States and would be expected to support our other growth strategies. In addition, we place advertisements in leading medical magazines and journals.
Additionally, because the availability of reimbursement is an important consideration for health care professionals and patients, we must also demonstrate the effectiveness of our products to public and private insurance providers. The availability of reimbursement exists primarily due to an established Healthcare Common Procedure Coding System (“HCPCS”) code for HFCWO. A HCPCS code is assigned to services and products by the Centers for Medicare and Medicaid Services (“CMS”). Because our product has an assigned HCPCS code, a claim can be billed for reimbursement using that code.
International Marketing
Approximately 1.7% and 2.8% of our net revenues were from sales outside the U.S. in our fiscal years ended June 30, 2018 and 2017 (“fiscal 2018” and “fiscal 2017”), respectively. We sell our products outside the U.S. primarily through independent distributors specializing in respiratory products. Through June 30, 2018, the majority of our distributors operated in exclusive territories. Our principal distributors are located in Europe, Southeast Asia, South and Central America and the Arab states of the Persian Gulf. Units are sold at a fixed contract price with payments made directly from the distributor, rather than being tied to reimbursement rates of a patient’s insurance provider as is the case for domestic sales. Our sales strategy outside the U.S. is to focus our corporate resources on maintaining our current distributors with less emphasis on contracting with new distributors.
6
Third-Party Reimbursement
In the U.S., individuals who use the SmartVest System generally will rely on third-party payers, including private payers and governmental payers such as Medicare and Medicaid, to cover and reimburse all or part of the cost of using the SmartVest System. Approximately half of our home care revenue is from commercial payers and one quarter is from each of the Medicare and Medicaid programs. Reimbursement for HFCWO therapy and the SmartVest System varies among public and private insurance providers.
A key strategy to grow sales is achieving world class customer service and support for our patients and clinicians. We do this with an established and effective reimbursement department working on behalf of the patient by processing physician paperwork, seeking insurance authorization and processing claims. The skill and knowledge gained and offered by our reimbursement department is an important factor in building our revenue and serving patients’ financial interests. Our payment terms generally allow patients to acquire the SmartVest System over a period of 1 to 15 months, which is consistent with reimbursement procedures followed by Medicare and other third parties. The payment amount we receive for any single referral may vary based on a number of factors, including Medicare and third-party reimbursement processes and policies. The patient retains the risk of reimbursement to the Company in the event of non-payment by third-party payers.
Our SmartVest System is reimbursed under HCPCS code E0483. Currently, the Medicare total allowable amount of reimbursement for this billing code is approximately $12,000. The allowed amount for state Medicaid programs range from approximately $8,000 to $12,000, which is similar to commercial payers. Actual reimbursement from third-party payers can vary and can be significantly less than the full allowable amount. Deductions from the allowable amount include co-payments, deductibles and/or maximums on durable medical equipment, decrease the reimbursement received from the third-party payer. Collecting a full allowable amount depends on our ability to obtain reimbursement from the patient’s secondary and/or supplemental insurance if the patient has additional coverage, or our ability to collect amounts from individual patients.
Most patients are able to qualify for reimbursement and payment from Medicare, Medicaid, private insurance or combinations of the foregoing. We expect that subsequent generations of HFCWO products also will qualify for reimbursement under Medicare Plan B and most major health plans. However, some third-party payers must also approve coverage for new or innovative devices or therapies before they will reimburse health care providers who use the medical devices or therapies. In addition, we face the risk that new or modified products could have a lower reimbursement rate, or that the levels of reimbursement currently available for our existing products could decrease, which would hamper our ability to market and sell that product. Consequently, our sales will continue to depend in part on the availability of coverage and reimbursement from third-party payers, even though our devices may have been cleared for marketing by the FDA. The manner in which reimbursement is sought and obtained varies based upon the type of payer involved and the setting in which the procedure is furnished.
Research and Development
Our research and development capabilities consist of full-time engineering staff and several consultants. We periodically engage consultants and contract engineering employees to supplement our development initiatives. Our team has a demonstrated record of developing new products that receive the appropriate product approvals and regulatory clearances around the world.
During fiscal 2018 and 2017, we incurred research and development expenses of approximately $251,000 and $597,000, or 0.9% and 2.3% of net revenues, respectively. As a percentage of sales, we expect spending on research and development expenses to increase during the fiscal year ended June 30, 2019 to a level more similar to fiscal 2017 as we work on enhancements to our SmartVest Connect wireless patient monitoring feature, and with engineering resources focusing on next generation product enhancements and other market opportunities.
7
Intellectual Property
As of June 30, 2018, we held 17 U.S. and 23 foreign issued patents covering the SmartVest System and its underlying technology and had 14 pending U.S. and foreign patent applications. These patents and patent applications offer coverage in the field of air pressure pulse delivery to a human in support of airway clearance. One of our U.S. patents will expire during our upcoming fiscal year ending June 30, 2019.
We generally pursue patent protection for patentable subject matter in our proprietary devices in foreign countries that we have identified as key markets for our products. These markets include the European Union, Canada, Japan, and other countries.
We also have received ten U.S. trademark and service mark registrations, one registration in each of Canada, Peru and Japan, one pending international registration and one through the Madrid Protocol for India.
Manufacturing
Our headquarters in New Prague, Minnesota includes a dedicated manufacturing and engineering facility of more than 10,000 square feet and we are certified on an annual basis to be compliant with ISO 13485 and ISO 9001 quality system standards. Our site has been audited regularly by the FDA and ISO, in accordance with their practices, and we maintain our operations in a manner consistent with their requirements for a medical device manufacturer. While components are outsourced to meet our detailed specifications, each SmartVest System is assembled, tested, and approved for final shipment at our manufacturing site in New Prague, consistent with FDA, Underwriters Laboratory (“UL”), and ISO standards. Many of our vendors are located within 100 miles of our headquarters, which enables us to closely monitor our component supply chain. We maintain established inventory levels for critical components and finished goods to assure continuity of supply.
Product Warranties
We provide a warranty on the SmartVest System that covers the cost of replacement parts and labor, or a new SmartVest System in the event we determine a full replacement is necessary. For home care SmartVest Systems initially purchased and currently located in the U.S. and Canada, we provide a lifetime warranty to the individual patient for whom the SmartVest System is prescribed. For sales to institutions within the U.S., and for all international sales, except Canadian home care, we provide a three-year warranty.
Competition
The original HFCWO technology was licensed to American Biosystems, Inc. (now Advanced Respiratory, Inc. (“ARI”), part of Hill-Rom Holdings, Inc.), which, until the introduction of our original MedPulse Respiratory Vest System® in 2000, was the only manufacturer of a product with HFCWO technology cleared for market by the FDA (ARI’s The Vest® Airway Clearance System). ARI has also received FDA 510(k) clearance for the Monarch™ Airway Clearance System, a mobile device that uses pulmonary oscillating discs. Respiratory Technologies, Inc., doing business as RespirTech, received FDA clearance to market their HFCWO product, the inCourage® Airway Clearance Therapy (the “inCourage System”). In August 2017, Royal Phillips acquired RespirTech. Both ARI and RespirTech employ a direct-to-patient model, and recently Royal Phillips announced plans to offer its HFCWO device through selected HME distributors.
The AffloVest® (the “AffloVest”) from International Biophysics Corporation (“IBC”) also participates in the same market as our SmartVest System. IBC received FDA 510(k) clearance for its device in 2013. IBC primarily sells its device through durable medical equipment (“DME”) companies who distribute home care medical devices and supplies. Clinical and cost-effective evidence, technology innovations, including wireless connectivity, and HFCWO product features and benefits, such as size, weight of the generator, reputation for patient and reimbursement services, and sales effectiveness of field personnel, have become the key drivers of HFCWO product sales.
Alternative products for administering pulmonary therapy include: Positive Expiratory Pressure (“PEP”); OPEP; Intrapulmonary Percussive Ventilation (“IPV”); CPT and breathing techniques. Physicians may prescribe some or all of these devices and techniques, depending upon each patient’s health status, severity of disease, compliance, or personal preference. We believe our primary competitive advantages over alternative treatments are patient comfort, ease of use, and the effectiveness of HFCWO treatment. Because HFCWO is not “technique dependent,” as compared to most other pulmonary therapy products, therapy begins automatically once power is provided and remains consistent and controlled for the duration of treatment.
8
Governmental Regulation
Medicare and Medicaid
Recent government and private sector initiatives in the U.S. and foreign countries aim at limiting the growth of health care costs, including price regulation, competitive pricing, coverage and payment policies, comparative effectiveness of therapies, technology assessments, and managed-care arrangements, and are causing the marketplace to put increased emphasis on the delivery of more cost-effective medical devices that result in better clinical outcomes. Government programs, including Medicare and Medicaid, have attempted to control costs by limiting the amount of reimbursement the program will pay for particular procedures or treatments, restricting coverage for certain products or services, and implementing other mechanisms designed to constrain utilization and contain costs. Many private insurance programs look to Medicare as a guide in setting coverage policies and payment amounts. These initiatives have created an increasing level of price sensitivity among our customers.
Home Medical Equipment Licensing
Although we do not fall under competitive bidding for Medicare, we often must satisfy the same licensing requirements as other DME providers that qualify for competitive bidding. In response to out-of-state businesses winning the competitive bidding process, which had a significant impact on small local DME businesses, many states have enacted regulations that require a DME provider to have an in-state business presence, specifically through state Home Medical Equipment (“HME”) licensing boards or through state Medicaid programs. In order to do business with any patients in the state or to be a provider for the state Medicaid program, a DME provider must have an in-state presence. In addition to Minnesota, our corporate headquarters, we have a licensed in-state presence in four other states. In-state presence requirements are different from state to state, but generally require a physical location that is staffed and open during regular business hours. We are licensed to do business in all states except for Hawaii.
Product Regulations
Our medical devices are subject to regulation by numerous government agencies, including the FDA and comparable foreign regulatory agencies. To varying degrees, each of these agencies requires us to comply with laws and regulations governing the development, testing, manufacturing, labeling, marketing, and distribution of our medical devices, and compliance with these laws and regulations entails significant costs for us. Our regulatory and quality assurance departments provide detailed oversight in their areas of responsibility to support required clearances and approvals to market our products.
In addition to the clearances and approvals discussed below, we obtained ISO 9001 and ISO 13485 certification in January 2005 and receive annual certification of our compliance with ISO quality standards.
FDA Requirements
We have received clearance from the FDA to market our products, including the SmartVest System. We may be required to obtain additional FDA clearance before marketing a new or modified product in the U.S., either through the 510(k) clearance process or the more complex premarket approval process. The process may be time consuming and expensive, particularly if human clinical trials are required. Failure to obtain such clearances or approvals could adversely affect our ability to grow our business.
Continuing Product Regulation
In addition to its approval processes for new products, the FDA may require testing and post-market surveillance programs to monitor the safety and effectiveness of previously cleared products that have been commercialized and may prevent or limit further marketing of products based on the results of post-mark surveillance results. At any time after marketing clearance of a product, the FDA may conduct periodic inspections to determine compliance with both the FDA’s Quality System Regulation (“QSR”) requirements and/or current medical device reporting regulations. Product approvals by the FDA can be withdrawn due to failure to comply with regulatory standards or the occurrence of unforeseen problems following initial market clearance. The failure to comply with regulatory standards or the discovery of previously unknown problems with a product or manufacturer could result in fines, delays or suspensions of regulatory clearances, seizures or recalls of products (with the attendant expenses), the banning of a particular device, an order to replace or refund the cost of any device previously manufactured or distributed, operating restrictions and criminal prosecution, as well as decreased sales as a result of negative publicity and product liability claims.
9
We must register annually with the FDA as a device manufacturer and, as a result, are subject to periodic FDA inspection for compliance with the FDA’s QSR requirements that require us to adhere to certain extensive regulations. In addition, the federal Medical Device Reporting regulations require us to provide information to the FDA whenever there is evidence that reasonably suggests that a device may have caused or contributed to a death or serious injury or, if a malfunction were to occur, could cause or contribute to a death or serious injury. We also must maintain certain certifications to sell products internationally, and we undergo periodic inspections by notified bodies to obtain and maintain these certifications.
Advertising and marketing of medical devices, in addition to being regulated by the FDA, are also regulated by the Federal Trade Commission and by state regulatory and enforcement authorities. Recently, promotional activities for FDA-regulated products of other companies have been the subject of enforcement action brought under health care reimbursement laws and consumer protection statutes. Competitors and others also can initiate litigation relating to advertising and /or marketing claims. If the FDA determines that our promotional or training materials constitute promotion of an unapproved or uncleared claim of use, we may need to modify our training or promotional materials or be subject to regulatory or enforcement actions that may result in civil fines or criminal penalties. Other federal, state or foreign enforcement authorities might take action if they determine that our promotional or training materials constitute promotion of an unapproved use, which could result in significant fines or penalties.
European Union and Other Regions
European Union rules require that medical products receive the right to affix the CE marking, demonstrating adherence to quality standards and compliance with relevant European Union Medical Device Directives (MDD). Products that bear CE marking can be imported to, sold or distributed within the European Union. We obtained clearance to use CE marking on our products in April 2005. Renewal of CE marking is required every five years, and our notified body performs an annual audit to ensure that we are in compliance with all applicable regulations. We have maintained our CE marking in good standing since originally receiving it and most recently renewed it in January 2015. We also require all of our distributors in the European Union and other regions to comply with their home country regulations in our distributor agreements.
The 2010 Healthcare Reform Legislation, medical device excise tax and Federal Physician Payments Sunshine Act
U.S. healthcare reform legislation, the PPACA, was enacted into law in March 2010. The PPACA imposes a 2.3% excise tax on certain domestic sales of medical devices by manufacturers. To the extent that third-party payers and institutions will not absorb increased costs represented by the tax because of reimbursement or contract limitations, we are not able to offset the tax with increased revenue.
Beginning with the third quarter of fiscal 2016, we realized a positive impact to operating profit with the adoption of the recent Consolidated Appropriations Act, 2016, which includes a two-year moratorium on the medical device excise tax effective as of January 1, 2016.
On May 22, 2018, we concluded an examination with the Internal Revenue Service (“IRS”) related to federal medical device excise taxes paid on revenue associated with our sales of the SmartVest during our tax periods ended June 30, 2014 through December 31, 2015. As a result, it was determined the SmartVest was eligible for the retail exemption from the medical device excise tax, resulting in the IRS agreeing to a refund of approximately $406,000. This refund has been recognized in fiscal 2018 results and payment was received in July 2018. Furthermore, we expect we will be exempt from the medical device tax after the conclusion of the current two-year medical device tax moratorium, which is scheduled to end on December 31, 2019.
10
Federal Physician Payments Sunshine Act
The Federal Physician Payments Sunshine Act (Section 6002 of the PPACA, the “Sunshine Act”) was adopted on February 1, 2013, to create transparency for the financial relationship between medical device companies and physicians and/or teaching hospitals. The Sunshine Act requires all manufacturers of drugs and medical devices to annually report to the CMS any payments or any other “transfers of value” made to physicians and teaching hospitals, including but not limited to consulting fees, grants, clinical research support, royalties, honoraria, and meals. This information is then posted on a public website so that consumers can learn how much was paid to their physician by drug and medical device companies. The Sunshine Act requires ongoing data collection and annual management and reporting by us.
Fraud and Abuse Laws
Federal health care laws apply to the marketing of our products and when we or our customers submit claims for items or services that are reimbursed under Medicare, Medicaid or other federally-funded health care programs. The principal applicable federal laws include:
| ● | the False Claims Act, which prohibits the submission of false or otherwise improper claims for payment to a federally-funded health care program; |
| ● | the Anti-Kickback Statute, which prohibits offers to pay or receive remuneration of any kind for the purpose of inducing or rewarding referrals of items or services reimbursable by a federal health care program; and |
| ● | the Stark Law, which prohibits physicians from profiting (actually or potentially) from their own referrals. |
There are often similar state false claims, anti-kickback, and anti-self referral and insurance laws that apply to state-funded Medicaid and other health care programs and private third-party payers. In addition, the U.S. Foreign Corrupt Practices Act can be used to prosecute companies in the U.S. for arrangements with physicians, or other parties outside the U.S. if the physician or party is a government official of another country and the arrangement violates the law of that country. Enforcement of all of these regulations has become increasingly stringent, particularly due to more prevalent use of the whistleblower provisions under the False Claims Act, which allow a private individual to bring actions on behalf of the federal government alleging that the defendant has submitted a false claim to the federal government and to share in any monetary recovery. If a governmental authority were to conclude that we are not in compliance with applicable laws and regulations, we and our officers and employees could be subject to severe criminal and civil penalties and disbarment from participation as a supplier of product to beneficiaries covered by Medicare or Medicaid.
HIPAA/HITECH and Other Privacy Regulations
Federal and state laws protect the confidentiality of certain patient health information, including patient records, and restrict the use and disclosure of such information. The Health Insurance Portability and Accountability Act of 1996 and its implementing regulations (“HIPAA”) and the Health Information Technology for Economic and Clinical Health Act (“HITECH”) set forth privacy and security standards that govern the use and disclosure of protected electronic health information by “covered entities”, which include healthcare providers, health plans and healthcare clearinghouses. Because we provide our products directly to patients and bill third-party payers such as Medicare, Medicaid, and insurance companies, we are a “covered entity” and must comply with these standards. Failure to comply with HIPAA/HITECH or any state or foreign laws regarding personal data protection may result in significant fines or penalties and/or negative publicity. In addition to federal regulations issued under HIPAA/HITECH, some states have enacted privacy and security statutes or regulations that, in some cases, are more stringent than those issued under HIPAA/HITECH. In those cases, it may be necessary to modify our planned operations and procedures to comply with the more stringent state laws. If we fail to comply with applicable state laws and regulations, we could be subject to additional sanctions.
The HIPAA/HITECH health care fraud and false statement statutes also prohibit, among other things, knowingly and willfully executing, or attempting to execute, a scheme to defraud any health care benefit program, including private payers, and knowingly and willfully falsifying, concealing or covering up a material fact or making any materially false, fictitious or fraudulent statement or representation in connection with the delivery of or payment for health care benefits, items or services.
11
Environmental Laws
We are subject to various environmental laws and regulations both within and outside the U.S. Like other medical device companies, our operations involve the use of substances regulated under environmental laws, primarily manufacturing, sterilization, and disposal processes. We do not expect that compliance with environmental protection laws will have a material impact on our results of operations, financial position, or cash flows.
Employees
As of June 30, 2018, we had 132 employees. Thirteen of our employees are respiratory therapists licensed by appropriate state professional organizations, including all of the employees in our Patient Services Department. We also retain approximately 300 respiratory therapists and health care professionals on a non-exclusive independent contractor basis to provide training to our customers in the U.S. None of our employees are covered by a collective bargaining agreement. We believe our relations with our employees are good.
| Item 1A. | Risk Factors. |
As a smaller reporting company, we are not required to provide disclosure pursuant to this item.
| Item 1B. | Unresolved Staff Comments. |
As a smaller reporting company, we are not required to provide disclosure pursuant to this item.
| Item 2. | Properties. |
We own our principal headquarters and manufacturing facilities, consisting of approximately 24,000 square feet, which are located on an approximately 2.3-acre parcel in New Prague, Minnesota. This owned property is subject to a mortgage (see Note 5 to the Financial Statements, included in Part II, Item 8, of this Annual Report on Form 10-K for further information). We also lease approximately 20,000 square feet of warehouse and office space in a building adjacent to our manufacturing facilities. We believe that our current facilities are satisfactory for our long-term growth plans.
| Item 3. | Legal Proceedings. |
We may be party to legal actions, proceedings, or claims in the ordinary course of business. We are not aware of any actual or threatened litigation that would have a material adverse effect on our financial condition or results of operations.
| Item 4. | Mine Safety Disclosures. |
None.
| Item 5. | Market For Registrant’s Common Equity, Related Stockholder Matters and Issuer Purchases of Equity Securities. |
Market Information
Our common stock is listed on the NYSE American under the symbol “ELMD”. The following table sets forth the high and low sales prices of our common stock by quarter during fiscal 2018 and 2017.
| High | Low | |||
| Fiscal Year Ended June 30, 2018: | ||||
| First Quarter (ended September 30, 2017) | $7.96 | $5.15 | ||
| Second Quarter (ended December 31, 2017) | $7.75 | $4.90 | ||
| Third Quarter (ended March 31, 2018) | $6.49 | $5.00 | ||
| Fourth Quarter (ended June 30, 2018) | $5.95 | $4.60 | ||
| Fiscal Year Ended June 30, 2017: | ||||
| First Quarter (ended September 30, 2016) | $6.26 | $3.77 | ||
| Second Quarter (ended December 31, 2016) | $5.13 | $3.38 | ||
| Third Quarter (ended March 31, 2017) | $5.47 | $3.68 | ||
| Fourth Quarter (ended June 30, 2017) | $5.88 | $4.12 |
12
As of September 21, 2018, there were 81 registered holders of our common stock.
Dividends
We have never paid cash dividends on any of our common stock. We currently intend to retain any earnings for use in operations and do not anticipate paying cash dividends in the foreseeable future. Currently, the agreement governing our credit facility restricts our ability to pay dividends.
Recent Sales of Unregistered Equity Securities
None.
Purchase of Equity Securities by the Company and Affiliated Purchasers
None.
| Item 6. | Selected Financial Data. |
As a smaller reporting company, we are not required to provide disclosure pursuant to this item.
| Item 7. | Management’s Discussion and Analysis of Financial Condition and Results of Operations. |
The following discussion and analysis of our financial condition and results of operations should be read in conjunction with our financial statements and the accompanying notes included elsewhere in this Report. The forward-looking statements include statements that reflect management’s beliefs, plans, objectives, goals, expectations, anticipations and intentions with respect to our future development plans, capital resources and requirements, results of operations, and future business performance. Our actual results could differ materially from those anticipated in the forward-looking statements included in this discussion as a result of certain factors, including, but not limited to, those discussed in the section entitled “Information Regarding Forward-Looking Statements” immediately preceding Part I of this Report.
Overview
Electromed, Inc. (“we,” “our,” “us,” “Electromed” or the “Company”) develops and provides innovative airway clearance products applying High Frequency Chest Wall Oscillation (“HFCWO”) technologies in pulmonary care for patients of all ages.
We manufacture, market and sell products that provide HFCWO, including the SmartVest® Airway Clearance System (“SmartVest System”) that includes our newest generation SmartVest SQL® and previous generation SV2100, and related products, to patients with compromised pulmonary function. The SmartVest SQL is smaller, quieter and lighter than our previous product, with enhanced programmability and ease of use. Our products are sold in both the home health care market and the institutional market for use by patients in hospitals, which we refer to as “institutional sales.” The SmartVest SQL has been sold in the domestic home care market since the fiscal quarter ended March 31, 2014. In June 2017, we launched the SmartVest SQL with SmartVest Connect™ wireless technology.
The SmartVest System is often eligible for reimbursement from major private insurance providers, health maintenance organizations (“HMOs”), state Medicaid systems, and the federal Medicare system, which is an important consideration for patients considering an HFCWO course of therapy. For domestic sales, the SmartVest System may be reimbursed under the Medicare-assigned billing code for HFCWO devices if the patient has cystic fibrosis, bronchiectasis (including chronic bronchitis or COPD that has resulted in a diagnosis of bronchiectasis), or any one of certain enumerated neuromuscular diseases, and can demonstrate that another less expensive physical or mechanical treatment did not adequately mobilize retained secretions. Private payers consider a variety of sources, including Medicare, as guidelines in setting their coverage policies and payment amounts.
13
We employ a direct-to-patient and provider model, through which we obtain patient referrals from clinicians, manage insurance claims on behalf of our patients and their clinicians, deliver our solutions to patients and train them on proper use in their homes. This model allows us to directly approach patients and clinicians, whereby we disintermediate the traditional durable medical equipment channel and capture both the manufacturer and distributor margins.
Our primary goals for the fiscal year ending June 30, 2019, include:
| ● | delivering profitable growth; |
| ● | growing quality referrals and increasing the rate of reimbursement on referrals; and |
| ● | maintaining the highest standards of integrity, respect and privacy. |
Our key growth strategies for the fiscal year ending June 30, 2019 include:
| ● | focus on increasing referrals in the largest, fastest growing segments: adult pulmonology/bronchiectasis; |
| ● | increase sales productivity through deeper clinic penetration and market share growth; |
| ● | enhance reimbursement support to provide best-in-class customer care; |
| ● | expand and promulgate the body of clinical evidence to increase utilization of SmartVest for patients with bronchiectasis; |
| ● | continue to develop innovative device features that appeal to patients; and |
| ● | grow institutional market share to support home care growth. |
Critical Accounting Policies and Estimates
During the preparation of our financial statements, we are required to make estimates, assumptions and judgments that affect reported amounts. Those estimates and assumptions affect our reported amounts of assets and liabilities, our disclosure of contingent assets and liabilities, and our reported revenues and expenses. We update these estimates, assumptions and judgments as appropriate, which in most cases is at least quarterly. We use our technical accounting knowledge, cumulative business experience, judgment and other factors in the selection and application of our accounting policies. While we believe the estimates, assumptions and judgments we use in preparing our financial statements are appropriate, they are subject to factors and uncertainties regarding their outcome and therefore, actual results may materially differ from these estimates. The following is a summary of our primary critical accounting policies and estimates. See also Note 1 to the Financial Statements, included in Part II, Item 8, of this Report.
Revenue Recognition and Allowance for Doubtful Accounts
Revenues are primarily recognized upon shipment when evidence of a sales arrangement exists, delivery has occurred, and the selling price is determinable with collectability reasonably assured. Revenues from direct patient sales are recorded at the amount to be received from patients under their arrangements with third-party payers, including private insurers, prepaid health plans, Medicare and Medicaid. In addition, we record an estimate for selling price adjustments that often arise from changes in a patient’s insurance coverage, changes in a patient’s state of domicile, insurance company coverage limitations or patient death. We periodically review originally billed amounts and our collection history and make changes to the estimation process by considering any changes in recent collection or sales allowance experience but have not made material adjustments to previously recorded revenues and receivables.
Other than the installment sales as discussed below, we expect to receive payment on the majority of accounts receivable within one year and therefore classify all receivables as current assets. However, in some instances, payment for direct patient sales can be delayed or interrupted resulting in a portion of collections occurring later than one year. In the event receivables are expected to be paid over longer intervals than one year, we recognize revenue under the installment method.
14
Certain third-party reimbursement agencies pay us on a monthly installment basis, which can span from 18 to 60 months. California and New York Medicaid constitute the majority of our installment method sales. Due to the length of time over which reimbursement is received, we believe that the inherent uncertainty of collection due to external factors noted above precludes us from making a reasonable estimate of revenue at the time the product is shipped. In certain circumstances, the patient must periodically attest that the unit continues to be utilized as a prerequisite to continued reimbursement coverage. Therefore, we believe the installment method is appropriate for these sales. If the third-party reimbursement agency discontinues payment and we determine no further payments will be made from the patient, the carrying value of the account receivable is written off as a period adjustment against the previously recognized sales. Under the installment method, we do not record accounts receivable or revenue at the time of product shipment. We defer the revenue associated with the sale and, as each installment is received, that amount is recognized as revenue. Deferred costs associated with the sale are amortized to cost of revenue ratably over the estimated period in which collections are scheduled to occur.
Accounts receivable are also net of an allowance for doubtful accounts, which are accounts from which payment is not expected to be received although product was provided and revenue was earned. Management determines the allowance for doubtful accounts by regularly evaluating individual customer receivables and considering a customer’s financial condition and credit history. Receivables are written off when deemed uncollectible. Recoveries of receivables previously written off are recorded when received.
We request that customers return previously-sold units that are no longer in use to us in order to limit the possibility that such units would be resold by unauthorized parties or used by individuals without a prescription. The customer is under no obligation to return the product; however, we do reclaim the majority of previously sold units upon the discontinuance of patient usage. We are certified to recondition and resell returned SmartVest units. Returned units are typically reconditioned and resold and continue to be used for demonstration equipment and warranty replacement parts.
Valuation of Long-Lived and Intangible Assets
Long-lived assets, primarily property and equipment and finite-life intangible assets, are evaluated for impairment whenever events or changes in circumstances indicate the carrying value of an asset may not be recoverable. In evaluating recoverability, the following factors, among others, are considered: a significant change in the circumstances used to determine the amortization period, an adverse change in legal factors or in the business climate, a transition to a new product or service strategy, a significant change in customer base, and a realization of failed marketing efforts. The recoverability of an asset or asset group is measured by a comparison of the unamortized balance of the asset or asset group to future undiscounted cash flows. If we believe the unamortized balance is unrecoverable, we would recognize an impairment charge necessary to reduce the unamortized balance to the estimated fair value of the asset group. The amount of such impairment would be charged to operations at the time of determination.
Property and equipment are stated at cost less accumulated depreciation. We use the straight-line method for depreciating property and equipment over their estimated useful lives, which range from 3 to 39 years. Our finite-life intangibles consist of patents and trademarks and their carrying costs include the original cost of obtaining the patents, periodic renewal fees, and other costs associated with maintaining and defending patent and trademark rights. Patents and trademarks are amortized over their estimated useful lives, generally 15 and 12 years, respectively, using the straight-line method.
Allowance for Excess and Slow-Moving Inventory
An allowance for potentially slow-moving or excess inventories is made based on our analysis of inventory levels on hand and comparing it to expected future production requirements, sales forecasts and current estimated market values.
Income Taxes
We recognize deferred tax assets and liabilities based on the differences between the financial statement carrying amounts and the tax basis of assets and liabilities. We provide a valuation allowance for deferred tax assets if we determine, based on the weight of available evidence, that it is more likely than not that some or all of the deferred tax assets will not be realized. We would reverse a valuation allowance if we determine, based on the weight of all available evidence, including when cumulative losses become positive income, that it is more likely than not that some or all of the deferred tax assets will be realized.
15
Warranty Reserve
We provide a warranty on the SmartVest System that covers the cost of replacement parts and labor, or a new SmartVest System in the event we determine a full replacement is necessary. For home care SmartVest Systems initially purchased and currently located in the U.S. and Canada, we provide a lifetime warranty to the individual patient for whom the SmartVest System is prescribed. For sales to institutions within the U.S., and for all international sales, except Canadian home care, we provide a three-year warranty. We estimate, based upon a review of historical warranty claim experience, the costs that may be incurred under our warranty policies and record a liability in the amount of such estimate at the time a product is sold. The warranty cost is based upon future product performance and durability, and is estimated largely based upon historical experience. We estimate the average useful life of our products to be approximately five years. Factors that affect our warranty liability include the number of units sold, historical and anticipated rates of warranty claims, the product’s useful life, and cost per claim. At our discretion, based upon the cost to either repair or replace a product, we have occasionally replaced such products covered under warranty with a new or refurbished model. We periodically assess the adequacy of our recorded warranty liability and make adjustments to the accrual as claims data and historical experience warrant.
Share-Based Compensation
Share-based payment awards consist of options and restricted stock issued to employees and directors for services. Expense for options is estimated using the Black-Scholes pricing model at the date of grant and expense for restricted stock is determined by the closing price on the day the grant is made. The portion of the award that is ultimately expected to vest is recognized on a straight-line basis over the requisite service or vesting period of the award. In determining the fair value of our share-based payment awards, we make various assumptions using the Black-Scholes pricing model, including expected risk-free interest rate, stock price volatility, life and forfeitures. See Note 7 to the Financial Statements included in Part II, Item 8, of this Report for a description of these assumptions.
Results of Operations
Fiscal Year Ended June 30, 2018 Compared to Fiscal Year Ended June 30, 2017
Revenues
Revenue for the twelve-month periods are summarized in the table below (dollar amounts in thousands).
| Twelve Months Ended June 30, | ||||||||||||||||
| 2018 | 2017 | Increase (Decrease) | ||||||||||||||
| Total Revenue | $ | 28,698 | $ | 25,861 | $ | 2,837 | 11.0 | % | ||||||||
| Home Care Revenue | 26,612 | 23,387 | 3,225 | 13.8 | % | |||||||||||
| Institutional Revenue | 1,585 | 1,758 | (173 | ) | (9.8 | %) | ||||||||||
| International Revenue | 501 | 716 | (215 | ) | (30.0 | %) | ||||||||||
Home Care Revenue. Our home care revenue increased by 13.8%, or approximately $3,225,000, for the fiscal year ended June 30, 2018 (“fiscal 2018”), compared to the fiscal year ended June 30, 2017 (“fiscal 2017”). Home care revenue increased year-over-year predominantly due to growth in approvals as a result of continued improvements in our reimbursement operations that led to a greater referral to approval percentage and a higher average selling price per device.
During fiscal 2017, we entered into a settlement agreement with the Centers for Medicare and Medicaid Services with respect to approximately 700 Medicare fee-for-service claims submitted between calendar years 2012 through 2015, resulting in approximately $703,000 of net recognized revenue. This benefit was partially offset by the retroactive repayment of previously collected and recognized revenue to a state Medicaid program totaling approximately $212,000. The repayment resulted from the state Medicaid program’s reinterpretation of its reimbursement process and a reduction in its allowable payments. We believe the repayment was a one-time event and is not reflective of other state Medicaid reimbursement processes.
16
Institutional Revenue. Institutional revenue decreased by 9.8%, or approximately $173,000, in fiscal 2018 compared to fiscal 2017. Institutional revenue includes sales to distributors, group purchasing organization (“GPO”) members, and other institutions. The decrease in institutional revenue was a result of a decrease in the number of units and single patient use garments sold compared to the same period in the prior year. During our second half of fiscal 2018, we implemented changes to improve our institutional revenue opportunity by hiring a new sales leader with a proven track record in institutional sales, developed a new sales plan targeting selected hospital systems and expanding the breadth of business proposals to better meet the needs of the different institutions we are targeting. During the second half of fiscal 2018 we achieved approximately $971,000 in institutional sales and we believe we are positioned to reverse the negative growth in the coming year.
International Revenue. International revenue was approximately $501,000 in fiscal 2018 compared to $716,000 in fiscal 2017. International revenue growth is not a focus for us and our corporate resources are only focused on supporting and maintaining our current distributors.
Gross Profit
Gross profit increased to $22,856,000 during fiscal 2018, or 79.6% of net revenues, from approximately $20,568,000, or 79.5% of net revenues, during fiscal 2017. The increase in gross profit was primarily related to increases in domestic home care revenue. The increase in gross profit as a percentage of net revenue was driven by a higher revenue per new device placement as compared to the same period in the prior year, which was partially offset by the additional cost to manufacture the SmartVest SQL with SmartVest Connect ™ wireless technology.
During fiscal 2017 and the fiscal year ended June 30, 2016 (“fiscal 2016”), we lowered the cost of our SmartVest SQL to a cost significantly lower than our previous products. This shortened the time in which we expect to phase out sales of our SV2100 product. Because of this, we recorded an additional reserve on certain SV2100 parts that may no longer be utilized in production, of $100,000 and $30,000 during fiscal 2018 and 2017, respectively. As we continue to phase out sales of the SV2100, we will continue to monitor and refine our reserve estimate if circumstances change.
We believe that as we continue to grow sales we will be able to continue to leverage manufacturing costs, and that gross margins, over the long-term, will continue to be in a range slightly below 80%, although there can be fluctuations on a short-term basis related to average reimbursement based on the mix of referrals during any given period. Factors such as diagnoses that are not assured of reimbursement, insurance programs with lower allowable reimbursement amounts (for example, state Medicaid programs), and whether an individual patient meets prerequisite medical criteria for reimbursement, may have an effect on average reimbursement received on a short-term basis.
Operating Expenses
Selling, General and Administrative Expenses. Selling, general and administrative (“SG&A”) expenses for fiscal 2018 were approximately $19,596,000, compared to approximately $16,402,000 for the prior year, an increase of approximately $3,194,000, or 19.5%.
SG&A payroll and compensation-related expenses increased by approximately $2,293,000, or 24.8%, to approximately $11,544,000. The increase during fiscal 2018 was due primarily to additional sales employees, higher share-based equity compensation expense, annual salary increases, and additional sales incentives on higher revenue, which were partially offset by lower management bonuses. For fiscal 2018, we had 11.4 net additional field sales full time equivalents (“FTEs”) and 2.8 net additional general and administrative FTEs, an increase of 33.5% and 5.1%, respectively, as compared to the prior fiscal year.
Professional and legal fees increased by approximately $522,000 to approximately $1,977,000 in fiscal 2018, compared to approximately $1,455,000 in fiscal 2017. These fees are primarily for services related to shareowner services and reporting requirements, legal costs, general and administrative temporary labor, information technology (“IT”) security and backup, and consulting fees. The increase in professional fees was primarily due to increases in fees for IT and accounting consulting fees, and general and administrative temporary labor.
17
Recruiting fees were approximately $632,000 in fiscal 2018, representing an increase of approximately $153,000, or 31.9%, as compared to the same period in the prior year. The increase in recruiting fees was due primarily to adding more employees in sales as compared to the prior year.
Travel, meals and entertainment expenses were approximately $2,181,000 for fiscal 2018 compared to $1,759,000 in the prior year, an increase of approximately $422,000, or 24.0%. The increase was due primarily to additional sales personnel, which was partially offset by an overall decrease in the average travel expense per salesperson.
SG&A expenses included a loss on the abandonment of certain domestic and foreign patents with net values of approximately $4,000 during fiscal 2018 as compared to $133,000 recognized in fiscal 2017. The majority of the pending patents that were abandoned related to the initial development of our SmartVest SQL technology. During a review of our patent portfolio it was determined that certain patents proved redundant to a subsequent SQL patent filing and were therefore abandoned. A smaller portion of expense was related to patents that covered technology that we considered outdated and are no longer in use.
Also, during fiscal 2018, we concluded an examination with the Internal Revenue Service (“IRS”) related to federal medical device excise taxes paid on revenue associated with the sales of the SmartVest System during the tax periods ended June 30, 2014 through December 31, 2015. As a result, it was determined the SmartVest System was eligible for the retail exemption from the medical device excise tax, resulting in the IRS agreeing to a refund of approximately $406,000, which is included as a reduction of SG&A expense during fiscal 2018. The refund was received from the IRS in July 2018. Furthermore, we expect the SmartVest System we will be exempt from the medical device tax after the conclusion of the current two-year medical device tax moratorium, which is scheduled to end on December 31, 2019.
Research and Development Expenses. Research and development (“R&D”) expenses were approximately $251,000 and $597,000, or 0.9% and 2.3% of net revenues, for fiscal 2018 and 2017, respectively. The year-over-year decrease in R&D expenses was driven by a higher level of costs in the prior year related to the development of our wireless technology. We began developing the SmartVest Connect wireless technology during fiscal 2016 and launched the new feature in June 2017. We believe this innovation is strengthening our patient and clinician partnerships, leading to greater therapy adherence and improved quality of life for individuals with compromised pulmonary function. During fiscal 2017, we capitalized approximately $223,000 related to software development in conjunction with this project. In fiscal 2018, our lower R&D spend was due primarily to our engineering team support of the SmartVest Connect wireless technology launch and subsequent ongoing support. We expect spending on research and development to increase in fiscal 2019 from fiscal 2018 levels as we work on enhancements to our SmartVest Connect wireless patient monitoring feature, initiate early stage design work on next generation product enhancements and evaluate other market opportunities. Certain expenses related to our innovation investments are not always captured in R&D expenses. These expenses may be included in cost of sales as in the case of depreciation of tooling, or for SG&A, in the case of professional fees or higher labor expense, as we improve our internal processes or enhance our customer service.
Interest Income (expense), net
Net interest income was approximately $20,000 during fiscal 2018 while net interest expense was $50,000 during the prior fiscal year. The increase in interest income was due to $20,000 interest received from the IRS as a result of the medical device excise tax refund, higher interest rates on savings, lower deferred financing costs, a lower effective interest rate on outstanding borrowings and a lower level of debt as compared to the prior year.
Income Tax Expense
On December 22, 2017, the U.S. government enacted comprehensive tax legislation commonly referred to as the Tax Cuts and Jobs Act (the “Tax Act”). The Tax Act significantly revised future and ongoing U.S. corporate tax obligations by, among other things, lowering U.S. corporate income tax rates. Since we have a June 30 fiscal year-end, the lower corporate income tax rate will be phased in, resulting in a blended U.S. statutory federal rate of approximately 28% for fiscal 2018, and 21% for subsequent fiscal years. The Tax Act also eliminated the domestic production manufacturing deduction effective for our tax year beginning July 1, 2018.
18
For fiscal 2018, we recorded a current income tax expense of $1,126,000. Estimated income tax expense during fiscal 2018 includes a current tax expense of $1,260,000 and a deferred benefit of $134,000. Estimated income tax expense for fiscal 2018 includes a discrete deferred tax expense of approximately $181,000 as a result of re-measuring certain deferred tax assets and liabilities based on the rates at which they are expected to reverse in future periods under the Tax Act. Additionally, a discrete tax benefit of approximately $27,000 was recognized during fiscal 2018 as a result of greater federal and state R&D tax credits than what was originally estimated in our tax provision for fiscal 2017.
Estimated income tax expense during fiscal 2017 includes a current tax expense of $1,439,000, a deferred benefit of $117,000 and a discrete tax benefit of $32,000 as a result of the lapse of the statute of limitations on uncertain tax positions.
The effective tax rates were 37.2% and 36.7% for fiscal 2018 and 2017, respectively. The effective tax rates differ from the statutory federal rate due to the effect of state income taxes, R&D tax credits, the domestic production activities deduction and other permanent items that are non-deductible for tax purposes relative to the amount of taxable income.
Net Income/Loss
Net income for fiscal 2018 was approximately $1,902,000, compared to net income of approximately $2,229,000 in fiscal 2017. The year-over-year decrease in net income was driven primarily by higher SG&A expenses related to hiring additional new employees, which was partially offset by an increase in gross profit driven by higher revenue, the medical device excise tax refund and lower R&D expenses as compared to the prior year. Additionally, net income during fiscal 2018 was affected by discrete tax events, including the $181,000 re-measurement of certain deferred tax assets and liabilities.
Liquidity and Capital Resources
Cash Flows and Sources of Liquidity
Cash Flows from Operating Activities
For fiscal 2018, our net cash provided by operating activities was approximately $2,442,000. Our net income of approximately $1,902,000 was adjusted for non-cash expenses of approximately $1,555,000, an increase in accounts payable and accrued liabilities of $556,000, a decrease in inventory of $235,000 and an increase in income tax payable of $241,000. It also was offset by increases in accounts receivable of approximately $1,613,000 and an increase in prepaid expenses and other assets of $433,000.
Cash Flows from Investing Activities
For fiscal 2018, cash used in investing activities was approximately $572,000. Cash used in investing activities primarily consisted of approximately $526,000 in expenditures for property and equipment and $46,000 in payments for patent and trademark costs.
Cash Flows from Financing Activities
For fiscal 2018, cash provided by financing activities was approximately $12,000, consisting of $62,000 in proceeds received from stock options that were exercised and $50,000 of principal payments on long-term debt.
Adequacy of Capital Resources
Our primary working capital requirements relate to adding employees to our sales force and support functions, continuing R&D efforts, and supporting general corporate needs, including financing equipment purchases and other capital expenditures incurred in the ordinary course of business. Based on our current operational performance, we believe our working capital of approximately $17,469,000 and available borrowings under our existing credit facility will provide adequate liquidity for our fiscal year ending June 30, 2019.
19
Effective December 18, 2017, we renewed our credit facility, which provides us with a revolving line of credit and a term loan. Interest on borrowings on the line of credit accrues at the prime rate and is payable monthly. The amount eligible for borrowing on the line of credit is limited to the lesser of $2,500,000 or 57.00% of eligible accounts receivable, and the line of credit expires on December 18, 2018, if not renewed. At June 30, 2018, the maximum $2,500,000 was available under the line of credit and the applicable interest rate (the prime rate) was 5.00%. Payment obligations under the line of credit are secured by a security interest in substantially all of our tangible and intangible assets.
In connection with the credit facility, we also have a term loan, which had an outstanding principal balance of approximately $1,103,000 and $1,154,000 as of June 30, 2018 and 2017, respectively. The term loan was refinanced effective December 18, 2016, reducing the interest rate from 5.00% to 3.88%. The unamortized debt issuance cost associated with this debt was approximately $2,000 and $6,000 as of June 30, 2018 and 2017, respectively. The term loan bears interest at 3.88%, with monthly payments of principal and interest of approximately $7,900 and a final payment of principal and interest of approximately $1,085,000 due on the maturity date of December 18, 2018. Payment obligations under the term loan are secured by a mortgage on the Company’s real property.
The documents governing our line of credit and term loan contain certain financial and nonfinancial covenants that include a minimum tangible net worth of not less than $10,125,000 and restrictions on our ability to incur certain additional indebtedness or pay dividends. We were in compliance with these covenants as of June 30, 2018.
Any failure to comply with these covenants in the future may result in an event of default, which if not cured or waived, could result in the lender accelerating the maturity of our indebtedness, preventing access to additional funds under the line of credit and/or term loan, requiring prepayment of outstanding indebtedness under either arrangement, or refusing to renew the line of credit. If the maturity of the indebtedness is accelerated or the line of credit is not renewed, sufficient cash resources to satisfy the debt obligations may not be available and we may not be able to continue operations as planned. The indebtedness under the line of credit and term loan are secured by a security interest in substantially all of our tangible and intangible assets and a mortgage on our real property, respectively. If we are unable to repay such indebtedness, the lender could foreclose on these assets.
We spent approximately $526,000 and $619,000 on property and equipment during fiscal 2018 and 2017, respectively. We currently expect to finance planned equipment purchases with cash flows from operations or borrowings under our credit facility. We may need to incur additional debt if we have an unforeseen need for additional capital equipment or if our operating performance does not generate adequate cash flows.
Off-Balance Sheet Arrangements
We have no off-balance sheet arrangements.
New Accounting Pronouncements
In May 2014, the Financial Accounting Standards Board (“FASB”) issued guidance creating Accounting Standards Codification (“ASC”) Section 606, “Revenue from Contracts with Customers.” The new section will replace ASC Section 605, “Revenue Recognition,” and replaces all revenue guidance for specialized transactions and industries. The new section is intended to conform revenue accounting principles to concurrently issued International Financial Reporting Standards with previously differing treatment between U.S. practice and that of much of the rest of the world, as well as to enhance disclosures related to disaggregated revenue information. Entities will have the option to apply the standard retrospectively to all prior periods presented (“full retrospective”), or to apply it retrospectively only to contracts existing at the effective date (“modified retrospective”), with the cumulative effect of the standard recorded as an adjustment to beginning retained earnings. The updated guidance is effective for public business entities for fiscal years beginning after December 15, 2017, and interim periods within that year. We have adopted this guidance effective July 1, 2018, utilizing the full retrospective method.
We have substantially completed our assessment of our systems, available data and processes that will be affected by the implementation of this new revenue recognition guidance. As a result of the implementation of this standard, we expect to record an adjustment to increase retained earnings as of July 1, 2017 to reflect the cumulative effect of adoption of the new standard. At this time, we estimate this increase to be approximately $0.8 million. This adjustment reflects the acceleration of $1.4 million in revenues, partially offset by $0.4 million in deferred taxes, $0.1 million in costs of revenues and $0.1 million in selling, general and administrative costs. The July 1, 2017 balance sheet will include an increase of $1.4 million in accounts receivable, a $0.1 million increase in inventory, a $0.1 million decrease in other current assets, a $0.1 million decrease in other long-term assets, a $0.4 million decrease in deferred income taxes, a $0.1 million increase in accrued compensation and a $0.8 million increase in retained earnings.
20
In addition, we will record an adjustment to restate fiscal 2018 to comparative operating results under the new guidance in our quarterly and annual financial statement during the fiscal year ending June 30, 2019, which will include additional required disclosures. The adjustment will result in a decrease in revenues of approximately $0.4 million and a decrease in currently reported net income of approximately $0.1 million for fiscal 2018.
The adjustments to retained earnings as of July 1, 2017 and to restate operating results for our fiscal 2018 comparative annual period were primarily driven by changes in our accounting for sales that are:
| ● | subject to reimbursement from certain third-party agencies on a monthly installment basis. Previously, we deferred revenue at the time of sale and, as each installment became billable and other criteria was met, revenue was recognized. |
| ● | subject to reimbursement under contracts where coverage is unconfirmed, payments are in appeal or are due from the patient, and where variable consideration is estimable. Previously, we fully deferred revenue at the time of sale until fixed and determinable. |
Under the new guidance, we will estimate variable consideration in the transaction price at contract inception based on historical experience and other relevant factors and recognize revenue at the time of sale.
In July 2015, FASB issued ASU 2015-11, “Inventory (Topic 330) Related to Simplifying the Measurement of Inventory,” which applies to all inventory except that which is measured using last-in, first-out (“LIFO”) or the retail inventory method. Inventory measured using first-in, first-out (“FIFO”) or average cost is within the scope of the new guidance and should be measured at the lower of cost and net realizable value. Net realizable value is the estimated selling price in the ordinary course of business, less reasonably predictable cost of completion, disposal, and transportation. Subsequent measurement is unchanged for inventory measured using LIFO or the retail inventory method. The amendments are effective for public business entities for fiscal years beginning after December 15, 2016, including interim periods within those fiscal years. The new guidance is applied prospectively, and earlier application is permitted as of the beginning of an interim or annual reporting period. We adopted ASU 2015-11 effective July 1, 2017, which had no material impact on our financial statements or financial statement disclosures.
In February 2016, FASB issued ASU 2016-02, “Leases.” This standard requires the recognition of all lease transactions with terms in excess of 12 months on the balance sheet as a lease liability and a right-of-use asset (as defined in the standard). ASU 2016-02 will be effective for fiscal years beginning after December 15, 2018, including interim periods within those fiscal years, with earlier application permitted. Upon adoption, the lessee will apply the new standard retrospectively to all periods presented or retrospectively using a cumulative effect adjustment in the year of adoption. ASU 2016-02 is not expected to have a material impact on our financial statements or financial statement disclosures upon adoption based on current facts and circumstances.
In March 2016, FASB issued ASU 2016-09, “Compensation—Stock Compensation (Topic 718): Improvements to Employee Share-Based Payment Accounting,” which reduces complexity in accounting standards related to share-based payment transactions, including, among others, (1) accounting for income taxes, (2) classification of excess tax benefits on the statement of cash flow, (3) forfeitures, and (4) statutory tax withholding requirements. ASU 2016-09 is effective for annual reporting periods beginning on or after December 15, 2016, and interim periods within those annual periods. We adopted ASU 2016-09 effective July 1, 2017, which had no material impact on our previously reported financial statements included in our Annual Report on Form 10-K for fiscal 2017. We have elected to continue to recognize estimated forfeitures as stock-based compensation expense.
| Item 7A. | Quantitative and Qualitative Disclosures About Market Risk. |
As a smaller reporting company, we are not required to provide disclosure pursuant to this item.
21
| Item 8. | Financial Statements and Supplementary Data. |
Index to Financial Statements
F-1
Report of Independent Registered Public Accounting Firm
To the Shareholders and the Board of Directors of Electromed, Inc.
Opinion on the Financial Statements
We have audited the accompanying balance sheets of Electromed, Inc. (the Company) as of June 30, 2018 and 2017, the related statements of operations, shareholders’ equity and cash flows for the years then ended, and the related notes to the financial statements (collectively, the financial statements). In our opinion, the financial statements present fairly, in all material respects, the financial position of the Company as of June 30, 2018 and 2017, and the results of its operations and its cash flows for the years then ended, in conformity with accounting principles generally accepted in the United States of America.
Basis for Opinion
These financial statements are the responsibility of the Company’s management. Our responsibility is to express an opinion on the Company’s financial statements based on our audits. We are a public accounting firm registered with the Public Company Accounting Oversight Board (United States) (PCAOB) and are required to be independent with respect to the Company in accordance with U.S. federal securities laws and the applicable rules and regulations of the Securities and Exchange Commission and the PCAOB.
We conducted our audits in accordance with the standards of the PCAOB. Those standards require that we plan and perform the audit to obtain reasonable assurance about whether the financial statements are free of material misstatement, whether due to error or fraud. The Company is not required to have, nor were we engaged to perform, an audit of its internal control over financial reporting. As part of our audits we are required to obtain an understanding of internal control over financial reporting but not for the purpose of expressing an opinion on the effectiveness of the Company’s internal control over financial reporting. Accordingly, we express no such opinion.
Our audits included performing procedures to assess the risks of material misstatement of the financial statements, whether due to error or fraud, and performing procedures that respond to those risks. Such procedures included examining, on a test basis, evidence regarding the amounts and disclosures in the financial statements. Our audits also included evaluating the accounting principles used and significant estimates made by management, as well as evaluating the overall presentation of the financial statements. We believe that our audits provide a reasonable basis for our opinion.
/s/ RSM US LLP
We have served as the Company’s auditor since 2010.
Duluth, Minnesota
September 25, 2018
F-2
Electromed, Inc.
Balance
Sheets
June 30, 2018 and 2017
| June 30, | ||||||||
| 2018 | 2017 | |||||||
| Assets | ||||||||
| Current Assets | ||||||||
| Cash | $ | 7,455,844 | $ | 5,573,709 | ||||
| Accounts receivable (net of allowances for doubtful accounts of $45,000) | 11,563,208 | 9,949,759 | ||||||
| Inventories | 2,360,693 | 2,559,485 | ||||||
| Prepaid expenses and other current assets | 832,202 | 393,319 | ||||||
| Total current assets | 22,211,947 | 18,476,272 | ||||||
| Property and equipment, net | 3,091,242 | 3,303,233 | ||||||
| Finite-life intangible assets, net | 649,103 | 721,276 | ||||||
| Other assets | 91,912 | 99,868 | ||||||
| Deferred income taxes | 594,000 | 460,000 | ||||||
| Total assets | $ | 26,638,204 | $ | 23,060,649 | ||||
| Liabilities and Shareholders’ Equity | ||||||||
| Current Liabilities | ||||||||
| Current maturities of long-term debt | $ | 1,101,043 | $ | 50,703 | ||||
| Accounts payable | 810,644 | 663,376 | ||||||
| Accrued compensation | 1,209,738 | 946,623 | ||||||
| Income tax payable | 397,390 | 156,524 | ||||||
| Warranty reserve | 760,000 | 640,000 | ||||||
| Other accrued liabilities | 464,357 | 438,748 | ||||||
| Total current liabilities | 4,743,172 | 2,895,974 | ||||||
| Long-term debt, less current maturities and net of debt issuance costs | — | 1,097,125 | ||||||
| Total liabilities | 4,743,172 | 3,993,099 | ||||||
| Commitments and Contingencies | ||||||||
| Shareholders’ Equity | ||||||||
| Common stock, $0.01 par value; authorized: 13,000,000 shares; 8,288,659 and 8,230,167 issued and outstanding at June 30, 2018 and June 30, 2017, respectively | 82,887 | 82,302 | ||||||
| Additional paid-in capital | 14,953,103 | 14,028,602 | ||||||
| Retained earnings | 6,859,042 | 4,956,646 | ||||||
| Total shareholders’ equity | 21,895,032 | 19,067,550 | ||||||
| Total liabilities and shareholders’ equity | $ | 26,638,204 | $ | 23,060,649 | ||||
See
Notes to Financial Statements.
F-3
Electromed, Inc.
Statements
of Operations
Years Ended June 30, 2018 and 2017
| Years Ended June 30, | ||||||||
| 2018 | 2017 | |||||||
| Net revenues | $ | 28,697,622 | $ | 25,861,144 | ||||
| Cost of revenues | 5,841,601 | 5,292,715 | ||||||
| Gross profit | 22,856,021 | 20,568,429 | ||||||
| Operating expenses | ||||||||
| Selling, general and administrative | 19,596,053 | 16,402,214 | ||||||
| Research and development | 251,443 | 596,876 | ||||||
| Total operating expenses | 19,847,496 | 16,999,090 | ||||||
| Operating income | 3,008,525 | 3,569,339 | ||||||
| Interest income (expense), net | 19,871 | (49,867 | ) | |||||
| Net income before income taxes | 3,028,396 | 3,519,472 | ||||||
| Income tax expense | 1,126,000 | 1,290,000 | ||||||
| Net income | $ | 1,902,396 | $ | 2,229,472 | ||||
| Income per share: | ||||||||
| Basic | $ | 0.23 | $ | 0.27 | ||||
| Diluted | $ | 0.22 | $ | 0.26 | ||||
| Weighted-average common shares outstanding: | ||||||||
| Basic | 8,207,365 | 8,168,152 | ||||||
| Diluted | 8,620,102 | 8,461,120 | ||||||
See
Notes to Financial Statements.
F-4
Electromed,
Inc.
Statements of Shareholders’ Equity
Years Ended June 30, 2018 and 2017
| Common Stock | Additional Paid-in Capital | Retained Earnings | Total |
|||||||||||||||||
| Shares | Amount | |||||||||||||||||||
| Balance at June 30, 2016 | 8,187,112 | $ | 81,871 | $ | 13,549,551 | $ | 2,727,174 | $ | 16,358,596 | |||||||||||
| Net income | — | — | — | 2,229,472 | 2,229,472 | |||||||||||||||
| Issuance of restricted stock | 43,055 | 431 | (431 | ) | — | — | ||||||||||||||
| Share-based compensation expense | — | — | 479,482 | — | 479,482 | |||||||||||||||
| Balance at June 30, 2017 | 8,230,167 | 82,302 | 14,028,602 | 4,956,646 | 19,067,550 | |||||||||||||||
| Net income | — | — | — | 1,902,396 | 1,902,396 | |||||||||||||||
| Issuance of restricted stock | 40,000 | 400 | (400 | ) | — | — | ||||||||||||||
| Issuance of common stock upon exercise of options | 18,492 | 185 | 62,227 | 62,412 | ||||||||||||||||
| Share-based compensation expense | — | — | 862,674 | — | 862,674 | |||||||||||||||
| Balance at June 30, 2018 | 8,288,659 | $ | 82,887 | $ | 14,953,103 | $ | 6,859,042 | $ | 21,895,032 | |||||||||||
See
Notes to Financial Statements.
F-5
Electromed, Inc.
Statements of Cash Flows
Years Ended June 30, 2018 and 2017
| Years Ended June 30, | ||||||||
| 2018 | 2017 | |||||||
| Cash Flows From Operating Activities | ||||||||
| Net income | $ | 1,902,396 | $ | 2,229,472 | ||||
| Adjustments to reconcile net income to net cash provided by operating activities: | ||||||||
| Depreciation | 676,426 | 636,709 | ||||||
| Amortization of finite-life intangible assets | 113,601 | 118,418 | ||||||
| Amortization of debt issuance costs | 6,351 | 13,067 | ||||||
| Share-based compensation expense | 862,674 | 479,482 | ||||||
| Deferred income taxes | (134,000 | ) | (117,000 | ) | ||||
| Loss on disposal of property and equipment | 25,990 | 3,302 | ||||||
| Loss on disposal of intangible assets | 4,122 | 132,724 | ||||||
| Changes in operating assets and liabilities: | ||||||||
| Accounts receivable | (1,613,449 | ) | (2,338,322 | ) | ||||
| Inventories | 234,594 | (28,334 | ) | |||||
| Prepaid expenses and other assets | (433,363 | ) | 49,864 | |||||
| Income tax receivable | — | 192,685 | ||||||
| Income tax payable | 240,866 | 156,524 | ||||||
| Accounts payable and accrued liabilities | 555,992 | (337,470 | ) | |||||
| Net cash provided by operating activities | 2,442,200 | 1,191,121 | ||||||
| Cash Flows From Investing Activities | ||||||||
| Expenditures for property and equipment | (526,227 | ) | (618,763 | ) | ||||
| Expenditures for finite-life intangible assets | (45,550 | ) | (68,385 | ) | ||||
| Net cash used in investing activities | (571,777 | ) | (687,148 | ) | ||||
| Cash Flows From Financing Activities | ||||||||
| Principal payments on long-term debt including capital lease obligations | (50,700 | ) | (48,747 | ) | ||||
| Issuance of common stock upon exercise of options | 62,412 | — | ||||||
| Payments of deferred financing fees | — | (4,872 | ) | |||||
| Net cash provided by (used in) financing activities | 11,712 | (53,619 | ) | |||||
| Net increase in cash | 1,882,135 | 450,354 | ||||||
| Cash | ||||||||
| Beginning of period | 5,573,709 | 5,123,355 | ||||||
| End of period | $ | 7,455,844 | $ | 5,573,709 | ||||
| Supplemental Disclosures of Cash Flow Information | ||||||||
| Cash paid for interest | $ | 46,002 | $ | 59,233 | ||||
| Cash paid for income taxes | 1,019,134 | 1,089,791 | ||||||
See Notes to Financial Statements.
F-6
Electromed,
Inc.
Notes to Financial Statements
Note 1. Nature of Business and Summary of Significant Accounting Policies
Nature of business: Electromed, Inc. (the “Company”) develops, manufactures and markets innovative airway clearance products that apply High Frequency Chest Wall Oscillation (“HFCWO”) therapy in pulmonary care for patients of all ages. The Company markets its products in the U.S. to the home health care and institutional markets for use by patients in personal residences, hospitals and clinics. The Company also sells internationally both directly and through distributors. International sales were approximately $501,000 and $716,000 for the fiscal years ended June 30, 2018 (“fiscal 2018”) and 2017 (“fiscal 2017”), respectively. Since its inception, the Company has operated in a single industry segment: developing, manufacturing and marketing medical equipment.
A summary of the Company’s significant accounting policies follows:
Use of estimates: Management uses estimates and assumptions in preparing the financial statements in accordance with U.S. generally accepted accounting principles (“U.S. GAAP”). Those estimates and assumptions affect the reported amounts of assets and liabilities, the disclosure of contingent assets and liabilities, and the reported revenues and expenses. Actual results could vary from the estimates that were used. The Company believes the critical accounting policies that require the most significant assumptions and judgments in the preparation of its financial statements include revenue recognition and the related estimation of selling price adjustments, allowance for doubtful accounts, inventory obsolescence, share-based compensation, income taxes and the warranty reserve.
Revenue recognition: The Company recognizes revenue when persuasive evidence of a sales arrangement exists, delivery of goods occurs through the transfer of title and risks and rewards of ownership, the selling price is fixed or determinable, and collectability is reasonably assured. Revenues are primarily recognized upon shipment.
Direct patient sales are recorded at amounts to be received from patients under reimbursement arrangements with third-party payers, including private insurers, prepaid health plans, Medicare and Medicaid. In addition, the Company records an estimate for selling price adjustments that often arise from changes in a patient’s insurance coverage, changes in a patient’s domicile, insurance company coverage limitations or patient death. Other than the installment sales as discussed below, the Company expects to receive payment on the vast majority of accounts receivable within one year and therefore has classified all accounts receivable as current. However, in some instances, payment for direct patient sales can be delayed or interrupted, resulting in a portion of collections occurring later than one year.
During fiscal 2017, the Company entered into a settlement agreement with the Centers for Medicare and Medicaid Services with respect to approximately 700 Medicare fee-for-service claims submitted between calendar years 2012 through 2015, resulting in approximately $703,000 of net recognized revenue.
Certain third-party reimbursement agencies pay the Company on a monthly installment basis, which can span over several years. Due to the length of time over which cash is collected and the inherent uncertainty of collectability with these installment sales, the Company cannot make a reasonable estimate of revenue at the time of sale and does not record accounts receivable or revenue at the time of product shipment. Under the installment method, the Company defers the revenue associated with the sale and, as each installment is received, that amount is recognized as revenue. Deferred costs associated with the sale are amortized to cost of revenue ratably over the estimated period in which collections are scheduled to occur.
Sales made under the installment method were approximately as follows:
| Years Ended June 30, | ||||||||
| 2018 | 2017 | |||||||
| Revenue recognized under installment sales | $ | 1,202,000 | $ | 1,246,000 | ||||
| Amortized cost of revenues recognized | 114,000 | 161,000 | ||||||
F-7
Unrecognized installment method sales were approximately as follows:
| June 30, | ||||||||
| 2018 | 2017 | |||||||
| Estimated unrecognized sales, net of discounts | $ | 1,443,000 | $ | 1,814,000 | ||||
| Unamortized costs of revenues included in prepaid and other current assets and other assets | 169,000 | 209,000 | ||||||
Shipping and handling expense: Shipping and handling charges incurred by the Company are included in cost of goods sold and were $409,000 and $363,000 for fiscal 2018 and 2017, respectively.
Cash: The Company maintains its cash in bank deposit accounts that, at times, may exceed federally insured limits. The Company has not experienced any losses in these accounts.
Accounts receivable: The Company’s accounts receivable balance is comprised of amounts due from individuals, institutions and distributors. Balances due from individuals are typically remitted to the Company by third-party reimbursement agencies such as Medicare, Medicaid and private insurance companies. Accounts receivable are carried at amounts estimated to be received from patients under reimbursement arrangements with third-party payers. Accounts receivable are also net of an allowance for doubtful accounts. Management determines the allowance for doubtful accounts by regularly evaluating individual customer receivables and considering a customer’s financial condition and credit history. Receivables are written off when deemed uncollectible. Recoveries of receivables previously written off are recorded when received. The allowance for doubtful accounts was approximately $45,000 as of June 30, 2018 and 2017.
Inventories: Inventories are stated at the lower of cost (first-in, first-out method) or net realizable value. Work in process and finished goods are carried at standard cost, which approximates actual cost, and includes materials, labor and allocated overhead. Standard costs are reviewed at least quarterly by management, or more often in the event circumstances indicate a change in cost has occurred. The reserve for obsolescence is determined by analyzing the inventory on hand and comparing it to expected future sales.
Property and equipment: Property and equipment are stated at cost less accumulated depreciation. Depreciation is computed using the straight-line method over the estimated useful lives of the assets. Leasehold improvements and assets acquired under capital leases are depreciated over the shorter of their estimated useful lives or the remaining lease term. The Company retains ownership of demonstration equipment in the possession of both inside and outside sales representatives, who use the equipment in the sales process.
Finite-life intangible assets: Finite-life intangible assets include patents and trademarks. These intangible assets are amortized on a straight-line basis over their estimated useful lives, as described in Note 4.
Long-lived assets: Long-lived assets, primarily property and equipment and finite-life intangible assets are evaluated for impairment whenever events or changes in circumstances indicate the carrying value of an asset or asset group may not be recoverable. In evaluating recoverability, the following factors, among others, are considered: a significant change in the circumstances used to determine the amortization period, an adverse change in legal factors or in the business climate, a transition to a new product or service strategy, a significant change in customer base, and a realization of failed marketing efforts. The recoverability of an asset or asset group is measured by a comparison of the carrying value of the asset to future undiscounted cash flows.
If the Company believes the carrying value is unrecoverable, it would recognize an impairment charge necessary to reduce the unamortized balance to the estimated fair value of the asset or asset group. The amount of such impairment would be charged to operations in the current period.
Warranty liability: The Company provides a lifetime warranty on products sold to patients in the U.S. and Canada and a three-year warranty for institutional sales within the U.S., as well as for all international sales. The Company estimates the costs that may be incurred under its warranty and records a liability in the amount of such costs at the time the product is sold. Factors that affect the Company’s warranty liability include the number of units sold, historical and anticipated rates of warranty claims, the product’s useful life, and cost per claim. The Company periodically assesses the adequacy of its recorded warranty liability and adjusts the amounts as necessary.
F-8
Changes in the Company’s warranty liability were approximately as follows:
| Years Ended June 30, | ||||||||
| 2018 | 2017 | |||||||
| Beginning warranty reserve | $ | 640,000 | $ | 660,000 | ||||
| Accrual for products sold | 273,000 | 129,000 | ||||||
| Expenditures and costs incurred for warranty claims | (153,000 | ) | (149,000 | ) | ||||
| Ending warranty reserve | $ | 760,000 | $ | 640,000 | ||||
Income taxes: Deferred taxes are provided on a liability method whereby deferred tax assets are recognized for deductible temporary differences and operating loss and tax credit carryforwards and deferred tax liabilities are recognized for taxable temporary differences. Temporary differences are the differences between the reported amounts of assets and liabilities and their tax bases. Deferred tax assets are reduced by a valuation allowance when, in the opinion of management, it is more likely than not that some portion or all of the deferred tax assets will not be realized. The Company would reverse a valuation allowance if it determined, based on the weight of all available evidence, including when cumulative losses become positive income, that it is more likely than not that some or all of the deferred tax assets will be realized. Deferred tax assets and liabilities are adjusted for the effects of changes in tax laws and rates on the date of enactment.
The Company recognizes tax liabilities when the Company believes that certain positions may not be fully sustained upon review by tax authorities. Benefits from tax positions are measured at the largest amount of benefit that is greater than 50 percent likely of being realized upon settlement. To the extent that the final tax outcome of these matters is different than the amounts recorded, such differences impact income tax expense in the period in which such determination is made. Interest and penalties, if any, related to accrued liabilities for potential tax assessments are included in income tax expense.
Research and development: Research and development costs include costs of research activities as well as engineering and technical efforts required to develop new products or make improvements to existing products. Research and development costs are expensed as incurred.
Advertising costs: Advertising costs are charged to expense when incurred. Advertising, marketing and trade show costs for the fiscal years 2018 and 2017, were approximately $474,000 and $380,000, respectively.
Share-based payments: Share-based payment awards consist of options and restricted stock issued to employees for services, and to non-employees in lieu of payment for services. Expense for options is estimated using the Black-Scholes pricing model at the date of grant and expense for restricted stock is determined by the closing price on the day the grant is made. Expense is recognized on a straight-line basis over the requisite service or vesting period of the award, or at the time services are provided for non-employee awards.
Fair value of financial instruments: The carrying values of cash, accounts receivable, accounts payable and accrued expenses approximate their fair value due to the short-term nature of these instruments. The carrying value of long-term debt is the remaining amount due to debtors under borrowing arrangements. To estimate the fair value of debt, the Company estimates the interest rate necessary to secure financing to replace its debt. At June 30, 2018, the fair value of long-term debt was not significantly different than its carrying value.
Basic and diluted earnings per share: Net income is presented on a per share basis for both basic and diluted common shares. Basic net income per common share is computed using the weighted-average number of common shares outstanding during the period, excluding any restricted stock awards which have not vested. The diluted net income per common share calculation includes outstanding restricted stock grants and assumes that all stock options were exercised and converted into common stock at the beginning of the period, unless their effect is anti-dilutive. Common stock equivalents of 187,834 shares and 177,500 shares were excluded from the calculation of diluted earnings per share for the fiscal years ended June 30, 2018 and 2017, respectively, as their impact was antidilutive. See Note 7 for information on stock options.
F-9
New Accounting Pronouncements: In May 2014, the Financial Accounting Standards Board (“FASB”) issued guidance creating Accounting Standards Codification (“ASC”) Section 606, “Revenue from Contracts with Customers.” The new section will replace ASC Section 605, “Revenue Recognition,” and replaces all revenue guidance for specialized transactions and industries. The new section is intended to conform revenue accounting principles to concurrently issued International Financial Reporting Standards with previously differing treatment between U.S. practice and that of much of the rest of the world, as well as to enhance disclosures related to disaggregated revenue information. Entities will have the option to apply the standard retrospectively to all prior periods presented (“full retrospective”), or to apply it retrospectively only to contracts existing at the effective date (“modified retrospective”), with the cumulative effect of the standard recorded as an adjustment to beginning retained earnings. The updated guidance is effective for public business entities for fiscal years beginning after December 15, 2017, and interim periods within that year. The Company adopted this guidance effective July 1, 2018, utilizing the full retrospective method.
The Company has substantially completed its assessment of our systems, available data and processes that will be affected by the implementation of this new revenue recognition guidance. As a result of the implementation of this standard, the Company expects to record an adjustment to increase retained earnings as of July 1, 2017 to reflect the cumulative effect of adoption of the new standard. At this time, the Company estimates this increase to be approximately $0.8 million. This adjustment reflects the acceleration of $1.4 million in revenues, partially offset by $0.4 million in deferred taxes, $0.1 million in costs of revenues and $0.1 million in selling, general and administrative costs. The July 1, 2017 balance sheet will include an increase of $1.4 million in accounts receivable, a $0.1 million increase in inventory, a $0.1 million decrease in other current assets, a $0.1 million decrease in other long-term assets, a $0.4 million decrease in deferred income taxes, a $0.1 million increase in accrued compensation and a $0.8 million increase in retained earnings.
In addition, the Company will record an adjustment to restate fiscal 2018 to comparative operating results under the new guidance in its quarterly and annual financial statements during the fiscal year ending June 30, 2019, which will include additional required disclosures. The adjustment will result in a decrease in revenues of approximately $0.4 million and a decrease in currently reported net income of approximately $0.1 million for fiscal 2018.
The adjustments to retained earnings as of July 1, 2017 and to restate operating results for its fiscal 2018 comparative annual period were primarily driven by changes in our accounting for sales that are:
| ● | subject to reimbursement from certain third-party agencies on a monthly installment basis. Previously, the Company deferred revenue at the time of sale and, as each installment became billable and other criteria was met, revenue was recognized. |
| ● | subject to reimbursement under contracts where coverage is unconfirmed, payments are in appeal or are due from the patient, and where variable consideration is estimable. Previously, the Company fully deferred revenue at the time of sale until fixed and determinable. |
Under the new guidance, the Company will estimate variable consideration in the transaction price at contract inception based on historical experience and other relevant factors and recognize revenue at the time of sale.
In July 2015, FASB issued ASU 2015-11, “Inventory (Topic 330) Related to Simplifying the Measurement of Inventory,” which applies to all inventory except that which is measured using last-in, first-out (“LIFO”) or the retail inventory method. Inventory measured using first-in, first-out (“FIFO”) or average cost is within the scope of the new guidance and should be measured at the lower of cost and net realizable value. Net realizable value is the estimated selling price in the ordinary course of business, less reasonably predictable cost of completion, disposal, and transportation. Subsequent measurement is unchanged for inventory measured using LIFO or the retail inventory method. The amendments are effective for public business entities for fiscal years beginning after December 15, 2016, including interim periods within those fiscal years. The new guidance is applied prospectively, and earlier application is permitted as of the beginning of an interim or annual reporting period. The Company adopted ASU 2015-11 effective July 1, 2017, which had no material impact on its financial statements or financial statement disclosures.
In February 2016, FASB issued ASU 2016-02, “Leases.” This standard requires the recognition of all lease transactions with terms in excess of 12 months on the balance sheet as a lease liability and a right-of-use asset (as defined in the standard). ASU 2016-02 will be effective for fiscal years beginning after December 15, 2018, including interim periods within those fiscal years, with earlier application permitted. Upon adoption, the lessee will apply the new standard retrospectively to all periods presented or retrospectively using a cumulative effect adjustment in the year of adoption. ASU 2016-02 is not expected to have a material impact on the Company’s financial statements or financial statement disclosures upon adoption based on current facts and circumstances.
F-10
In March 2016, FASB issued ASU 2016-09, “Compensation—Stock Compensation (Topic 718): Improvements to Employee Share-Based Payment Accounting,” which reduces complexity in accounting standards related to share-based payment transactions, including, among others, (1) accounting for income taxes, (2) classification of excess tax benefits on the statement of cash flow, (3) forfeitures, and (4) statutory tax withholding requirements. ASU 2016-09 is effective for annual reporting periods beginning on or after December 15, 2016, and interim periods within those annual periods. The Company adopted ASU 2016-09 effective July 1, 2017, which had no material impact on its previously reported financial statements included in the Company’s Annual Report on Form 10-K for fiscal 2017. The Company has elected to continue to recognize estimated forfeitures as stock-based compensation expense.
Note 2. Inventories
The components of inventories at June 30, 2018 and 2017 were approximately as follows:
| June 30, | ||||||||
| 2018 | 2017 | |||||||
| Parts inventory | $ | 1,388,000 | $ | 1,789,000 | ||||
| Work in process | 621,000 | 205,000 | ||||||
| Finished goods | 632,000 | 745,000 | ||||||
| Less: Reserve for obsolescence | (280,000 | ) | (180,000 | ) | ||||
| Total | $ | 2,361,000 | $ | 2,559,000 | ||||
Note 3. Property and Equipment
Property and equipment, including assets under capital leases, were approximately as follows:
| Estimated
Useful Lives (Years) | June 30, | |||||||||||
| 2018 | 2017 | |||||||||||
| Building and building improvements | 15-39 | $ | 2,263,000 | $ | 2,236,000 | |||||||
| Land | N/A | 200,000 | 200,000 | |||||||||
| Land improvements | 15 | 166,000 | 166,000 | |||||||||
| Equipment | 3-7 | 3,131,000 | 2,982,000 | |||||||||
| Demonstration and rental equipment | 3 | 1,071,000 | 959,000 | |||||||||
| 6,831,000 | 6,543,000 | |||||||||||
| Less: Accumulated depreciation | (3,740,000 | ) | (3,240,000 | ) | ||||||||
| Net property and equipment | $ | 3,091,000 | $ | 3,303,000 | ||||||||
During fiscal 2018 and 2017, the Company impaired or disposed of certain property and equipment, no longer in use, with a net value of approximately $26,000 and $3,000, respectively, which was included as an expense in cost of goods sold or selling, general and administrative expense on the statements of operations.
Note 4. Finite-life Intangible Assets
The carrying value of patents and trademarks includes the original cost of obtaining the patents, periodic renewal fees, and other costs associated with maintaining and defending patent and trademark rights. Patents and trademarks are amortized over their estimated useful lives, generally 15 and 12 years, respectively. During fiscal 2018 and 2017, the Company abandoned certain domestic and foreign patents with a net value of approximately $4,000 and $133,000, respectively, which was included as an expense in selling, general and administrative expense on the statements of operations. The majority of the pending patents that were abandoned related to the initial development of the Company’s SQL SmartVest technology. During a review of the Company’s patent portfolio it was determined that certain patents proved redundant to a subsequent SQL patent filing and were therefore abandoned. A smaller portion of expense was related to patents that covered technology that management considered outdated and was no longer in use. Accumulated amortization was approximately $902,000 and $790,000 at June 30, 2018 and 2017, respectively.
F-11
The activity and net balances of finite-life intangible assets were approximately as follows:
| Years Ended June 30, | |||||||||
| 2018 | 2017 | ||||||||
| Balance, beginning | $ | 721,000 | $ | 904,000 | |||||
| Additions | 46,000 | 68,000 | |||||||
| Abandonments | (4,000 | ) | (133,000 | ) | |||||
| Amortization expense | (114,000 | ) | (118,000 | ) | |||||
| Balance, ending | $ | 649,000 | $ | 721,000 | |||||
Based on the carrying value as of June 30, 2018, future amortization is expected to be as follows:
|
Fiscal years ending June 30: |
|||
| 2019 | $ | 114,000 | |
| 2020 | 113,000 | ||
| 2021 | 113,000 | ||
| 2022 | 79,000 | ||
| 2023 | 17,000 | ||
| Thereafter | 213,000 | ||
| Total | $ | 649,000 |
Note 5. Financing Arrangements
The Company has a credit facility that provides for a revolving line of credit and a term loan. Effective December 18, 2017, the Company renewed its $2,500,000 revolving line of credit. There was no outstanding principal balance on the line of credit as of June 30, 2018 or June 30, 2017. Interest on borrowings under the line of credit, if any, would accrue at the prime rate (5.00% at June 30, 2018) and is payable monthly. The amount eligible for borrowing on the line of credit is limited to the lesser of $2,500,000 or 57.00% of eligible accounts receivable and the line of credit expires on December 18, 2018, if not renewed. At June 30, 2018, the maximum $2,500,000 was eligible for borrowing. The line of credit is secured by a security interest in substantially all of the tangible and intangible assets of the Company.
In connection with the credit facility, the Company also has a term loan, which had an outstanding principal balance of approximately $1,103,000 and $1,154,000 as of June 30, 2018 and 2017, respectively. The term loan was refinanced effective December 18, 2016, reducing the interest rate from 5.00% to 3.88%. The unamortized debt issuance cost associated with this debt was approximately $2,000 and $6,000 as of June 30, 2018 and June 30, 2017, respectively. The term loan bears interest at 3.88%, with monthly payments of principal and interest of approximately $7,900 and a final payment of principal and interest of approximately $1,085,000 due on the maturity date of December 18, 2018. Payment obligations under the term loan are secured by a mortgage on the Company’s real property.
The documents governing the line of credit and term loan contain certain financial and nonfinancial covenants that include a minimum tangible net worth covenant of not less than $10,125,000 and restrictions on the Company’s ability to incur certain additional indebtedness or pay dividends.
Long-term debt consisted of approximately the following as of June 30, 2018 and 2017:
| June 30, | ||||||||
| 2018 | 2017 | |||||||
| Mortgage note payable with bank, due in monthly installments of $7,932, including interest at 3.88%, remaining due December 2018, secured by land and building | $ | 1,103,000 | $ | 1,154,000 | ||||
| Less: Current portion | (1,101,000 | ) | (51,000 | ) | ||||
| Less: Debt issuance costs, net | (2,000 | ) | (6,000 | ) | ||||
| Long-term debt | $ | — | $ | 1,097,000 | ||||
Approximate future maturities of long-term debt, net of debt issuance costs, as of June 30, 2018 were $1,101,000, due December 2018.
Note 6. Common Stock
Authorized shares: The Company’s Articles of Incorporation, as amended, have established 15,000,000 authorized shares of capital stock consisting of 13,000,000 shares of common stock, par value $0.01 per share, and 2,000,000 shares of undesignated stock.
F-12
Note 7. Share-Based Payments
Share-based compensation expense for fiscal 2018 and 2017 was approximately $863,000 and $479,000, respectively, related to employee options and restricted stock awards. At June 30, 2018, the Company had approximately $597,000 of unrecognized compensation expense related to non-vested equity awards, which is expected to be recognized over a weighted-average period of 0.9 years.
Employee options: The Company has historically granted stock options to employees as long-term incentive compensation. Options expire ten years from the grant date and vest over a period of up to five years. In November 2017, the Company’s shareholders approved the 2017 Omnibus Incentive Plan (the “2017 Plan”) which supersedes the 2014 Equity Incentive Plan (the “2014 Plan”). The 2017 Plan allows the Company’s Board of Directors to grant stock options, stock appreciation rights, restricted stock, restricted stock units and other stock-based awards, as well as cash incentive awards to all employees, non-employee directors, and advisors or consultants of the Company. The vesting schedule and term for each award are determined by the Board upon each grant. The maximum number of shares of common stock available for issuance under the 2017 Plan is 900,000. There were 883,059 options granted under the 2014 Plan and prior plans outstanding as of June 30, 2018. There were 19,000 options and 10,000 restricted shares issued under the 2017 Plan outstanding and 871,000 shares available for grant under the 2017 Plan as of June 30, 2018.
The Company recognizes compensation expense related to share-based payment transactions in the financial statements based on the estimated fair value of the award issued. The fair value of each option is estimated using the Black-Scholes pricing model at the time of award grant. The Company estimates the expected life of options based on the expected holding period by the option holder. The risk-free interest rate is based upon observed U.S. Treasury interest rates for the expected term of the options. The Company makes assumptions with respect to expected stock price volatility based upon the volatility of its stock price. Forfeitures are estimated at the time of grant and revised in subsequent periods if actual forfeitures differ from initial estimates. Forfeitures are estimated based on the percentage of awards expected to vest, taking into consideration the seniority level of the award recipient.
The following assumptions were used to estimate the fair value of options granted:
| Years Ended June 30, | ||||||||
| 2018 | 2017 | |||||||
| Risk-free interest rate | 1.77-2.61 | % | 1.14-1.27 | % | ||||
| Expected term (years) | 6 | 6 | ||||||
| Expected volatility | 125.2-176.5 | % | 100.5-105.8 | % | ||||
The following table presents employee option activity for fiscal 2018 and 2017:
Number of Shares | Weighted- Average Grant Date Fair Value | Weighted- Average Exercise Price | Weighted- Average Remaining Contractual Life (in Years) | |||||||||||||
| Options outstanding at June 30, 2016 | 599,800 | $ | 1.70 | $ | 2.62 | 5.38 | ||||||||||
| Granted | 176,500 | 3.09 | 3.91 | — | ||||||||||||
| Canceled or Forfeited | (28,666 | ) | 2.46 | 3.14 | — | |||||||||||
| Options outstanding at June 30, 2017 | 747,634 | 2.00 | 2.91 | 5.31 | ||||||||||||
| Granted | 201,250 | 5.05 | 5.65 | — | ||||||||||||
| Exercised | (18,492 | ) | 2.13 | 3.38 | — | |||||||||||
| Canceled or Forfeited | (28,333 | ) | 3.44 | 4.07 | — | |||||||||||
| Options outstanding at June 30, 2018 | 902,059 | 2.63 | 3.47 | 5.31 | ||||||||||||
| Options exercisable at June 30, 2018 | 706,233 | 2.11 | 3.00 | 4.36 | ||||||||||||
F-13
The aggregate intrinsic value of options outstanding was $1,802,000 and options exercisable were $1,714,000 at June 30, 2018. There were 18,492 options exercised during the year ended June 30, 2018 while there were no options exercised during the year ended June 30, 2017.
Restricted stock: The 2014 Plan permitted, and the 2017 Plan permits the Personnel and Compensation Committee of the Board of Directors to grant other stock-based awards, including restricted stock. The Company makes restricted stock grants to key employees and non-employee directors that vest over six months to three years.
The Company issued restricted stock awards to employees totaling 30,000 during each of the years ended June 30, 2018 and 2017, with a vesting term of one to three years and a fair value of $5.53 and $3.82 per share, respectively. During the fiscal 2018 and 2017, the Company issued restricted stock awards to directors totaling 10,000 and 13,055 shares of common stock, respectively, with a vesting term of six months and a fair value of $5.77 and $3.83 per share, respectively. Restricted stock transactions during the years ended June 30, 2018 and 2017 are summarized as follows:
| Shares of Restricted Stock | Weighted-Average
Grant Date Fair Value per Share | ||||||||
| Outstanding at June 30, 2016 | 19,999 | — | |||||||
| Granted | 43,055 | $ | 3.82 | ||||||
| Vested | (33,056 | ) | $ | 3.21 | |||||
| Outstanding at June 30, 2017 | 29,998 | $ | 3.15 | ||||||
| Granted | 40,000 | $ | 5.59 | ||||||
| Vested | (40,000 | ) | $ | 4.23 | |||||
| Outstanding at June 30, 2018 | 29,998 | $ | 4.96 | ||||||
Note 8. Income Taxes
Components of the provision for income taxes for fiscal 2018 and 2017 were as follows:
| Years Ended June 30, | ||||||||
| 2018 | 2017 | |||||||
| Current: | ||||||||
| Current Federal | $ | 1,035,000 | $ | 1,196,000 | ||||
| Current State | 225,000 | 211,000 | ||||||
| Total Current | 1,260,000 | 1,407,000 | ||||||
| Deferred: | ||||||||
| Deferred Federal | (65,000 | ) | (108,000 | ) | ||||
| Deferred State | (69,000 | ) | (9,000 | ) | ||||
| Total Deferred | (134,000 | ) | (117,000 | ) | ||||
| Total Income Tax Expense | $ | 1,126,000 | $ | 1,290,000 | ||||
The total income tax expense differed from the expected tax expense, computed by applying the federal statutory rate to the Company’s pretax income, as follows:
| Years Ended June 30, | ||||||||
| 2018 | 2017 | |||||||
| Tax expense at statutory federal rate | $ | 834,000 | $ | 1,197,000 | ||||
| State income tax expense, net of federal tax effect | 115,000 | 131,000 | ||||||
| Remeasurement of deferred taxes under U.S. tax reform | 181,000 | — | ||||||
| Change in uncertain tax positions | — | (32,000 | ) | |||||
| Other permanent items | (4,000 | ) | (6,000 | ) | ||||
| Income tax expense | $ | 1,126,000 | $ | 1,290,000 | ||||
F-14
The effective tax rates for fiscal 2018 and 2017 were 37.2% and 36.7% respectively.
On December 22, 2017, the U.S. government enacted comprehensive tax legislation commonly referred to as the Tax Cuts and Jobs Act (the “Tax Act”). The Tax Act significantly revised future and ongoing U.S. corporate tax obligations by, among other things, lowering U.S. corporate income tax rates. Since the Company has a June 30 fiscal year-end, the lower corporate income tax rate will be phased in, resulting in a blended U.S. statutory federal rate of approximately 28% for fiscal 2018, and 21% for subsequent fiscal years. The Tax Act also eliminated the domestic production manufacturing deduction effective for the Company’s tax year beginning July 1, 2018. During the year ended June 30, 2018, these changes under the Tax Act resulted in a net income tax expense of approximately $181,000.
The significant components of deferred income taxes were as follows:
| June 30, | ||||||||
| 2018 | 2017 | |||||||
| Deferred tax assets (liabilities): | ||||||||
| Accounts receivable reserves | $ | 52,000 | $ | 143,000 | ||||
| Accrued liabilities | 273,000 | 280,000 | ||||||
| Property and equipment | (317,000 | ) | (534,000 | ) | ||||
| Finite-life intangible assets | 2,000 | 6,000 | ||||||
| Stock options | 443,000 | 443,000 | ||||||
| Tax credits and net operating loss carryforwards | 63,000 | 46,000 | ||||||
| Other | 78,000 | 76,000 | ||||||
| Net deferred tax assets | $ | 594,000 | $ | 460,000 | ||||
The Company has net state tax credit carryforwards of $63,000 and which if unused, will begin to expire in years 2025 and 2033.
The Company applies the accounting standard for uncertain tax positions pursuant to which a more-likely-than-not threshold is utilized to determine the recognition and derecognition of uncertain tax positions. Once the more-likely-than-not threshold is met, the amount of benefit to be recognized is the largest amount of tax benefit that is greater than 50 percent likely of being ultimately realized upon settlement. It further requires that a change in judgment related to the expected ultimate resolution of uncertain tax positions be recognized in earnings in the period of such a change. The Company does not believe there will be significant changes to the estimates in the next 12-month period. Due to the complexity of some of these uncertainties, the ultimate settlement may result in payments that are different from the Company’s current estimate of tax liabilities, resulting in the recognition of additional charges or benefits to income tax expense.
Changes in the Company’s unrecognized tax benefits were approximately as follows:
| Years Ended June 30, | ||||||||
| 2018 | 2017 | |||||||
| Beginning balance of unrecognized tax benefits | $ | — | $ | 32,000 | ||||
| Lapse of statute of limitations | — | (32,000 | ) | |||||
| Ending balance of unrecognized tax benefits | $ | — | $ | — | ||||
The Company recognizes interest and penalties accrued related to unrecognized tax benefits in income tax expense. During the fiscal year ended June 30, 2017 the amount of recognized interest expense, net of tax benefit, and accrued interest on a gross basis was insignificant. The Company is subject to U.S. federal income tax as well as income tax of multiple state jurisdictions. With limited exceptions, tax years prior to fiscal year ended June 30, 2015 are no longer open to federal, state and local examination by taxing authorities.
F-15
Note 9. Commitments and Contingencies and Subsequent Events
Operating leases: The Company has five leases for office and warehouse space that require monthly payments that include base rent and the Company’s share of common expenses, including property taxes. These leases have escalating payments ranging from approximately $450 to $9,900 per month and expire through July 2019. The Company has a lease for office equipment that requires payments of approximately $1,500 per month through December 2021. Rent expense for the years ended June 30, 2018 and 2017, was approximately $190,000 and $175,000, respectively.
Approximate future minimum operating lease payments as of June 30, 2018, were as follows:
Fiscal years ending June 30: |
|||
| 2019 | $ | 198,000 | |
| 2020 | 18,000 | ||
| 2021 | 9,000 | ||
| Total | $ | 225,000 |
Litigation: The Company may occasionally be party to actions, proceedings, claims or disputes arising in the ordinary course of business. The Company insures its business risks where possible to mitigate the financial impact of individual claims and establishes reserves for an estimate of any probable cost of settlement or other disposition.
401(k) Profit Sharing Plan: The Company has an employee benefit plan under Section 401(k) of the Internal Revenue Code covering all employees who are 21 years of age or older and have at least 1,000 hours of service with the Company. The Company matches each employee’s salary reduction contribution, not to exceed four percent of annual compensation. Total employer contributions to this plan for the years ended June 30, 2018 and 2017, were approximately $285,000 and $248,000, respectively.
Employment Agreements: The Company has entered into formal employment agreements with its President and Chief Executive Officer and its Chief Financial Officer. These agreements provide the officers with, among other things, one to one and one half year of base salary upon a termination without cause or in the event the employee resigns for good reason or within twelve months of a change in control.
F-16
| Item 9. | Changes in and Disagreements With Accountants on Accounting and Financial Disclosure. |
None.
| Item 9A. | Controls and Procedures. |
Evaluation of Disclosure Controls and Procedures
Our principal executive officer and principal financial officer evaluated the effectiveness of our disclosure controls and procedures, as defined in Rule 13a-15(e) and Rule 15d-15(e) of the Exchange Act, as of the end of the period subject to this Annual Report on Form 10-K. Based on this evaluation, our principal executive officer and principal financial officer concluded that our disclosure controls and procedures were effective.
Management’s Report on Internal Control over Financial Reporting
Our management is responsible for establishing and maintaining adequate internal control over financial reporting, as such term is defined in Rules 13a-15(f) and 15d-15(f) of the Exchange Act. Internal control over financial reporting refers to the process designed by, or under the supervision of, our President and Chief Executive Officer and our Chief Financial Officer, and effected by our Board of Directors, management and other personnel, to provide reasonable assurance regarding the reliability of financial reporting and the preparation of financial statements for external purposes in accordance with generally accepted accounting principles, and includes those policies and procedures that:
(1) Pertain to the maintenance of records that in reasonable detail accurately and fairly reflect the transactions and dispositions of our assets;
(2) Provide reasonable assurance that transactions are recorded as necessary to permit preparation of financial statements in accordance with generally accepted accounting principles, and that our receipts and expenditures are being made only in accordance with authorization of our management and directors; and
(3) Provide reasonable assurance regarding prevention or timely detection of unauthorized acquisition, use, or disposition of our assets that could have a material effect on the financial statements.
Because of its inherent limitations, internal control over financial reporting cannot provide absolute assurance of preventing and detecting misstatements on a timely basis. It is possible to design into the process safeguards to reduce, though not eliminate, the risk that misstatements are not prevented or detected on a timely basis. Management is responsible for establishing and maintaining adequate internal control over financial reporting for the Company.
Our management conducted an evaluation of the effectiveness of our internal control over financial reporting based on the framework set forth in the report entitled Internal Control-Integrated Framework published by the Committee of Sponsoring Organizations of the Treadway Commission in 2013. Based on this assessment, management has concluded that, as of June 30, 2018, our internal control over financial reporting was effective.
This Annual Report on Form 10-K does not include an attestation report of our independent registered public accounting firm regarding internal control over financial reporting. Management’s report was not subject to attestation by the Company’s independent registered public accounting firm pursuant to Section 989G of the Dodd-Frank Wall Street Reform and Consumer Protection Act, which exempts smaller reporting companies from the auditor attestation requirement.
Changes in Internal Control Over Financial Reporting
There were no changes in our internal control over financial reporting that occurred during the fourth quarter of fiscal 2018 that have materially affected, or are reasonably likely to materially affect, our internal control over financial reporting.
| Item 9B. | Other Information. |
None.
22
Certain information required by Part III is incorporated by reference from our definitive Proxy Statement for the Fiscal 2019 Annual Meeting of Shareholders to be held on November 16, 2018 (the “Proxy Statement”). Except for those portions specifically incorporated in this Form 10-K by reference to the Proxy Statement, no other portions of the Proxy Statement are deemed to be filed as part of this Form 10-K.
| Item 10. | Directors, Executive Officers and Corporate Governance. |
Executive Officers
The following sets forth certain information about our current executive officers:
Kathleen S. Skarvan, age 62, joined Electromed in December 2012 as Chief Executive Officer, became a director in November 2013 and was appointed to the additional position of President in August 2015. Ms. Skarvan served as Vice President of Operations at OEM Fabricators from November 2011 until October 2012. Prior to her position with OEM Fabricators, Ms. Skarvan served in various roles at Hutchinson Technology Incorporated, most recently as the President of the Disk Drive Components Division from April 2007 until March 2011. As President of the Disk Drive Components Division, Ms. Skarvan managed a public company division with annual revenues in excess of $300 million. Ms. Skarvan also served as a Senior Vice President of Hutchinson Technology Incorporated from December 2010 to March 2011, and as Vice President of Sales & Marketing of the Disk Drive Components Division from October 2003 until April 2007. She has served on the Board of Trustees of the St. Cloud State University Foundation since June 2015. Ms. Skarvan has a bachelor’s degree from St. Cloud State University.
Jeremy T. Brock, age 39, joined Electromed in August 2011 as controller and principal accounting officer and became the Company’s Chief Financial Officer in October 2011. Prior to joining the Company, Mr. Brock spent five years with the CPA firm CliftonLarsonAllen LLP and focused on performing and managing audit and tax engagements in the manufacturing, distribution and technology sectors. As a Certified Public Accountant, Mr. Brock also has worked on strategic business planning, risk assessments, and the design and implementation of internal controls. Mr. Brock brings additional management and leadership experience from serving in the United States Marine Corps from 1998 to 2002. Mr. Brock has a bachelor’s degree in accounting and finance from the University of Northern Iowa.
Code of Ethics
Our Board has approved a Code of Ethics and Business Conduct (the “Code of Ethics”) that applies to all employees, directors, and officers, including the Chief Executive Officer and Chief Financial Officer (Principal Financial Officer and Principal Accounting Officer). The Code of Ethics is available in the “Investor Relations” section of our website at www.smartvest.com. We intend to disclose on our website any amendment to or waiver from any provision of the Code of Ethics that applies to our Chief Executive Officer or Chief Financial Officer (Principal Financial Officer and Principal Accounting Officer), and that relates to any element of the Code of Ethics identified in Item 406(b) of Regulation S-K, as promulgated by the SEC. Such disclosure will be provided promptly following the date of the amendment or waiver.
The additional information required by this item is incorporated herein by reference to the sections labeled “Election of Directors,” “Corporate Governance,” “Compliance with Section 16(a) of the Exchange Act,” and “Security Ownership of Principal Shareholders, Directors and Management” in the Proxy Statement.
| Item 11. | Executive Compensation. |
The information required by this item is incorporated herein by reference to the sections labeled “Executive Compensation,” “Director Compensation,” and “Corporate Governance – Personnel and Compensation Committee” in the Proxy Statement.
23
| Item 12. | Security Ownership of Certain Beneficial Owners and Management and Related Stockholder Matters. |
The information required by this item relating to the security ownership of certain holders is incorporated herein by reference to the sections labeled “Security Ownership of Principal Shareholders, Directors and Management” and “Equity Compensation Plan Information” in the Proxy Statement.
| Item 13. | Certain Relationships and Related Transactions, and Director Independence. |
The information required by this item is incorporated herein by reference to the sections labeled “Corporate Governance–Independence” and “Certain Transactions and Business Relationships” in the Proxy Statement.
| Item 14. | Principal Accountant Fees and Services. |
The information required by this item is incorporated herein by reference to the section labeled “Ratification of the Appointment of the Company’s Independent Registered Public Accounting Firm – Audit Fees” in the Proxy Statement.
| Item 15. | Exhibits and Financial Statement Schedules. |
| (a) | Documents filed as part of this report. |
| (1) | Financial Statements. The following financial statements are included in Part II, Item 8 of this Annual Report on Form 10-K: |
| ● | Report of Independent Registered Public Accounting Firm |
| ● | Balance Sheets as of June 30, 2018 and 2017 |
| ● | Statements of Operations for the years ended June 30, 2018 and 2017 |
| ● | Statements of Shareholders’ Equity for the years ended June 30, 2018 and 2017 |
| ● | Statements of Cash Flows for the years ended June 30, 2018 and 2017 |
| ● | Notes to Financial Statements |
| (2) | Financial Statement Schedules. No financial statement schedule is required to be included in this Annual Report on Form 10-K. |
| (3) | Unless otherwise indicated, all documents incorporated into this Annual Report on Form 10-K by reference to a document filed with the SEC pursuant to the Exchange Act are located under SEC file number 001-34839. |
24
25
| Exhibit Number |
Description | Method of Filing | ||
| 10.23 | Description of Fiscal Year 2018 Officer Bonus Plan (incorporated by reference to Exhibit 10.3 to Quarterly Report on Form 10-Q for the quarter ended September 30, 2017)* | Incorporated by Reference | ||
| 23.1 | Consent of Independent Registered Public Accounting Firm | Filed Electronically | ||
| 24.1 | Powers of Attorney | Filed Electronically | ||
| 31.1 | Certification Pursuant to Section 302 of the Sarbanes-Oxley Act of 2002 | Filed Electronically | ||
| 31.2 | Certification Pursuant to Section 302 of the Sarbanes-Oxley Act of 2002 | Filed Electronically | ||
| 32.1 | Certification Pursuant to Section 906 of the Sarbanes-Oxley Act of 2002 | Filed Electronically | ||
| 32.2 | Certification Pursuant to Section 906 of the Sarbanes-Oxley Act of 2002 | Filed Electronically | ||
| 101.CAL | XBRL Taxonomy Extension Calculation Linkbase | Filed Electronically | ||
| 101.DEF | XBRL Taxonomy Extension Definition Linkbase | Filed Electronically | ||
| 101.INS | XBRL Instance Document | Filed Electronically | ||
| 101.LAB | XBRL Taxonomy Extension Label Linkbase | Filed Electronically | ||
| 101.PRE | XBRL Taxonomy Extension Presentation Linkbase | Filed Electronically | ||
| 101.SCH | XBRL Taxonomy Extension Schema | Filed Electronically |
| * | Management compensatory contract or arrangement. |
| Item 16. | Form 10-K Summary. |
None.
26
SIGNATURES
Pursuant to the requirements of Section 13 or 15(d) of the Securities Exchange Act of 1934, the registrant has duly caused this report to be signed on its behalf by the undersigned, thereunto duly authorized.
| ELECTROMED, INC. | ||
| Date: September 25, 2018 | By | /s/ Kathleen S. Skarvan |
| Kathleen S. Skarvan | ||
| President and Chief Executive Officer |
Pursuant to the requirements of the Securities Exchange Act of 1934, this report has been signed below by the following persons on behalf of the registrant and in the capacities and on the dates indicated.
| Signature | Title | Date | |||
| /s/ Kathleen S. Skarvan | President, Chief Executive Officer and Director | September 25, 2018 | |||
| Kathleen S. Skarvan | (principal executive officer) | ||||
| /s/ Jeremy T. Brock | Chief Financial Officer | September 25, 2018 | |||
| Jeremy T. Brock | (principal financial and accounting officer) | ||||
| * | Chairman and Director | September 25, 2018 | |||
| Stephen H. Craney | |||||
| * | Director | September 25, 2018 | |||
| William V. Eckles | |||||
| * | Director | September 25, 2018 | |||
| Stan K. Erickson | |||||
| * | Director | September 25, 2018 | |||
| Lee A. Jones | |||||
| * | Director | September 25, 2018 | |||
| George H. Winn | |||||
| * | The undersigned, by signing her name hereto, does hereby sign this document on behalf of each of the above-named directors of the registrant pursuant to powers of attorney duly executed by such persons. |
| By | /s/ Kathleen S. Skarvan | |
| Kathleen S. Skarvan | ||
| Attorney-in-Fact |
27