Attached files
| file | filename |
|---|---|
| 8-K - THOR INDUSTRIES, INC. 8-K - THOR INDUSTRIES INC | a51869747.htm |
| EX-99.1 - EXHIBIT 99.1 - THOR INDUSTRIES INC | a51869747ex99_1.htm |
Exhibit 99.2
601 East Beardsley Avenue, Elkhart, Indiana 46514-3305
Full Year Fiscal 2018 and Fourth Quarter Ended July 31, 2018
Investor Questions & Answers
Published September 20, 2018
Forward Looking Statements
This document includes certain statements that are “forward looking” statements within the meaning of the U.S. Private Securities Litigation Reform Act of 1995, Section 27A of the Securities Act of 1933, as amended, and Section 21E of the Securities Exchange Act of 1934, as amended. These forward looking statements are made based on management’s current expectations and beliefs regarding future and anticipated developments and their effects upon Thor, and inherently involve uncertainties and risks. These forward looking statements are not a guarantee of future performance. We cannot assure you that actual results will not differ materially from our expectations. Factors which could cause materially different results include, among others, raw material and commodity price fluctuations; raw material, commodity or chassis supply restrictions; the level of warranty claims incurred; legislative, regulatory and tax law and/or policy developments including their potential impact on our dealers and their retail customers or on our suppliers; the costs of compliance with governmental regulation; legal and compliance issues including those that may arise in conjunction with recent transactions; lower consumer confidence and the level of discretionary consumer spending; interest rate fluctuations; the potential impact of interest rate fluctuations on the general economy and specifically on our dealers and consumers; restrictive lending practices; management changes; the success of new and existing products and services; consumer preferences; the ability to efficiently utilize production facilities; the pace of acquisitions and the successful closing, integration and financial impact thereof; the potential loss of existing customers of acquisitions; our ability to retain key management personnel of acquired companies; a shortage of necessary personnel for production; the loss or reduction of sales to key dealers; disruption of the delivery of units to dealers; asset impairment charges; cost structure changes; competition; the impact of potential losses under repurchase agreements; the potential impact of the strength of the U.S. dollar on international demand; general economic, market and political conditions; and changes to investment and capital allocation strategies or other facets of our strategic plan. Additional risks and uncertainties surrounding the acquisition of Erwin Hymer Group SE (the "Erwin Hymer Group") include risks regarding the anticipated timing of the closing of the acquisition, the potential benefits of the proposed acquisition and the anticipated operating synergies, the satisfaction of the conditions to closing the acquisition (including obtaining necessary regulatory approvals) in the anticipated timeframe or at all, the integration of the business, the impact of exchange rate fluctuations and unknown or understated liabilities related to the acquisition and Erwin Hymer Group's business. These and other risks and uncertainties are discussed more fully in ITEM 1A of our Annual Report on Form 10-K for the year ended July 31, 2018.
We disclaim any obligation or undertaking to disseminate any updates or revisions to any forward looking statements contained in this document or to reflect any change in our expectations after the date hereof or any change in events, conditions or circumstances on which any statement is based, except as required by law.
Executive Overview
For the full-year fiscal 2018:
|
•
|
Financial results for the full year reflect all-time records in the Company’s history:
|
|
•
|
Net sales increased 14.9% to $8.33 billion
|
|
•
|
Gross profit increased 11.6% to $1.16 billion
|
|
•
|
Income before taxes up 13.8% to $633.0 million
|
|
•
|
Diluted EPS increased 14.8% to $8.14
|
|
•
|
Cash flow from operating activities increased 11.3% to $466.5 million
|
|
•
|
Outstanding debt totally paid down
|
For the fourth quarter of 2018:
|
•
|
Net sales decreased 3.1% to $1.87 billion
|
|
•
|
Gross profit decreased 18.9% to $244.4 million
|
|
•
|
Income before taxes down 29.3% to $124.3 million
|
|
•
|
Diluted EPS decreased 26.1% to $1.67
|
|
•
|
Consolidated RV backlog of $1.40 billion, as of July 31, 2018
|
Outlook: Solid retail market growth is anticipated in fiscal 2019.
Planning assumptions reflect:
|
•
|
The continuation of favorable RV industry fundamentals, which are supported by high consumer confidence rates, favorable employment trends, adequate availability of credit at historically low rates and a healthy housing market. Dealer optimism remains high, and their inventory is fresh. Demand continues to be driven by favorable demographic and lifestyle growth trends, including the ongoing strength of baby boomer customers, as well as first-time and younger buyers
|
|
•
|
Due to dealer order strength experienced in the first half of fiscal 2018, we are planning for tougher year-over-year comparisons in the first half of fiscal 2019 with more favorable top line growth rates in the second half of the year. Similar to the quarterly progression of our top line, we anticipate gross margin pressure to be greater in the first half of the year.
|
|
•
|
During fiscal year 2019, our diluted EPS will benefit from a lower effective tax rate.
|
2
Quick Reference to Contents
|
A.
|
4 | |
|
B.
|
5 | |
|
C.
|
6 | |
|
D.
|
7 | |
|
E.
|
8 | |
|
F.
|
9 | |
|
G.
|
12 | |
| 12 | ||
| 13 | ||
| 13 | ||
| 14 | ||
| 14 | ||
|
H.
|
15 | |
| 15 | ||
| 17 | ||
| 17 | ||
|
I.
|
18 | |
|
a. U.S. Market
|
18 | |
| 18 | ||
| 19 | ||
| 19 | ||
| 19 | ||
| 20 | ||
| 20 | ||
|
J.
|
21 | |
|
K.
|
23 | |
|
L.
|
24 |
3

|
|
Three Months Ended
July 31, 2018
|
|
Three Months Ended
July 31, 2017
|
%
Change
|
||||||||
|
NET SALES:
|
||||||||||||
|
Towables
|
||||||||||||
|
Travel Trailers and Other
|
$ | 844,753 | $ | 852,116 |
(0.9
|
)%
|
||||||
|
Fifth Wheels
|
564,114
|
556,061
|
1.4
|
%
|
||||||||
|
Total Towables
|
$
|
1,408,867
|
$
|
1,408,177
|
—
|
%
|
||||||
|
|
Three Months Ended
July 31, 2018
|
|
Three Months Ended
July 31, 2017
|
%
Change
|
||||||||
|
# OF UNITS:
|
||||||||||||
|
Towables
|
||||||||||||
|
Travel Trailers and Other
|
41,899
|
45,327
|
(7.6
|
)%
|
||||||||
|
Fifth Wheels
|
12,859
|
12,826
|
0.3
|
%
|
||||||||
|
Total Towables
|
54,758
|
58,153
|
(5.8
|
)%
|
||||||||
|
|
As of |
|
As of |
%
|
||||||||
|
ORDER BACKLOG:
|
|
31-Jul-18 |
|
31-Jul-17 |
Change
|
|||||||
|
Towables
|
$
|
766,965
|
$
|
1,416,240
|
(45.8
|
)%
|
||||||
|
MARKET SHARE SUMMARY (a)
|
|
Calendar YTD Through June 30, | ||||||||||
| 2018 | 2017 | |||||||||||
|
U.S. Market
|
47.9
|
% |
48.5
|
% | ||||||||
|
Canadian Market
|
53.5
|
% |
55.9
|
% | ||||||||
|
Combined North American Market
|
48.5
|
% |
49.4
|
% | ||||||||
(a) Source: Statistical Surveys, Inc. Data is based on official state records and is subject to adjustment and is continuously updated.
Thor Unit Shipments Versus Industry
Our Towable unit shipments for the quarter decreased by 5.8%. According to statistics published by RVIA, for the QTD period dates, combined industry travel trailer and fifth wheel wholesale unit shipments decreased 0.2% compared to the same period last year.
5
|
|
Full Year Ended
July 31, 2018
|
Full Year Ended
July 31, 2017
|
%
Change
|
|||||||||
|
NET SALES:
|
||||||||||||
|
Towables
|
||||||||||||
|
Travel Trailers and Other
|
$ | 3,646,581 |
$
|
3,088,561
|
18.1
|
%
|
||||||
|
Fifth Wheels
|
2,362,119
|
2,038,930
|
15.9
|
%
|
||||||||
|
Total Towables
|
$
|
6,008,700
|
$
|
5,127,491
|
17.2
|
%
|
||||||
|
Full Year Ended
July 31, 2018
|
Full Year Ended
July 31, 2017
|
%
Change
|
||||||||||
|
# OF UNITS:
|
||||||||||||
|
Towables
|
||||||||||||
|
Travel Trailers and Other
|
186,710
|
166,140
|
12.4
|
%
|
||||||||
|
Fifth Wheels
|
54,155
|
47,422
|
14.2
|
%
|
||||||||
|
Total Towables
|
240,865
|
213,562
|
12.8
|
%
|
||||||||
|
MARKET SHARE SUMMARY (a)
|
|
Trailing Twelve Months Ended June 30,
|
||||||||||
| 2018 | 2017 | |||||||||||
|
U.S. Market
|
48.1
|
% |
48.3
|
% | ||||||||
|
Canadian Market
|
53.7
|
% |
55.3
|
% | ||||||||
|
Combined North American Market
|
48.7
|
% |
49.1
|
% | ||||||||
(a) Source: Statistical Surveys, Inc. Data is based on official state records and is subject to adjustment and is continuously updated.
Thor Unit Shipments Versus Industry
Our Towable unit shipments for the fiscal year increased by 12.8%. According to statistics published by RVIA, for the comparable period, combined industry travel trailer and fifth wheel wholesale unit shipments increased 13.8%.
6
|
|
Three Months Ended
July 31, 2018
|
|
Three Months Ended
July 31, 2017
|
%
Change
|
||||||||
|
NET SALES:
|
||||||||||||
|
Motorized
|
||||||||||||
|
Class A
|
$ |
218,271
|
$
|
207,979
|
4.9
|
%
|
||||||
|
Class C
|
180,554
|
253,104
|
(28.7
|
)%
|
||||||||
|
Class B
|
22,511
|
24,074
|
(6.5
|
)%
|
||||||||
|
Total Motorized
|
$
|
421,336
|
$
|
485,157
|
(13.2
|
)%
|
||||||
|
|
Three Months Ended
July 31, 2018
|
|
Three Months Ended
July 31, 2017
|
%
Change
|
||||||||
|
# OF UNITS:
|
||||||||||||
|
Motorized
|
||||||||||||
|
Class A
|
1,652
|
1,865
|
(11.4
|
)%
|
||||||||
|
Class C
|
2,651
|
3,907
|
(32.1
|
)%
|
||||||||
|
Class B
|
158
|
184
|
(14.1
|
)%
|
||||||||
|
Total Motorized
|
4,461
|
5,956
|
(25.1
|
)%
|
||||||||
|
|
As of
|
As of
|
%
|
|||||||||
|
ORDER BACKLOG:
|
|
31-Jul-18 |
31-Jul-17
|
Change
|
||||||||
|
Motorized
|
$
|
634,092
|
$
|
915,559
|
(30.7
|
)%
|
||||||
|
MARKET SHARE SUMMARY (a)
|
|
Calendar YTD Through June 30,
|
||||||||||
| 2018 | 2017 | |||||||||||
|
U.S. Market
|
40.2
|
% |
39.9
|
% | ||||||||
|
Canadian Market
|
37.5
|
% |
36.5
|
% | ||||||||
|
Combined North American Market
|
40.0
|
% |
39.6
|
% | ||||||||
(a) Source: Statistical Surveys, Inc. Data is based on official state records and is subject to adjustment and is continuously updated.
Thor Unit Shipments Versus Industry
Our Motorized unit shipments decreased by 25.1% for the quarter, compared to an industry decrease rate of 13.3% for the same period last year.
7
|
|
Full Year Ended
July 31, 2018
|
Full Year Ended
July 31, 2017
|
%
Change
|
|||||||||
|
NET SALES:
|
||||||||||||
|
Motorized
|
||||||||||||
|
Class A
|
$ |
1,000,881
|
$
|
914,681
|
9.4
|
%
|
||||||
|
Class C
|
1,047,376
|
968,899
|
8.1
|
%
|
||||||||
|
Class B
|
98,058
|
87,886
|
11.6
|
%
|
||||||||
|
Total Motorized
|
$
|
2,146,315
|
$
|
1,971,466
|
8.9
|
%
|
||||||
|
Full Year Ended
July 31, 2018
|
Full Year Ended
July 31, 2017
|
%
Change
|
||||||||||
|
# OF UNITS:
|
||||||||||||
|
Motorized
|
||||||||||||
|
Class A
|
8,754
|
8,264
|
5.9
|
%
|
||||||||
|
Class C
|
15,875
|
15,181
|
4.6
|
%
|
||||||||
|
Class B
|
726
|
688
|
5.5
|
%
|
||||||||
|
Total Motorized
|
25,355
|
24,133
|
5.1
|
%
|
||||||||
|
MARKET SHARE SUMMARY (a)
|
Trailing Twelve Months Ended June 30,
|
|||||||||||
| 2018 | 2017 | |||||||||||
|
U.S. Market
|
39.6
|
% |
38.9
|
% | ||||||||
|
Canadian Market
|
35.9
|
% |
35.8
|
% | ||||||||
|
Combined North American Market
|
39.3
|
% |
38.7
|
% | ||||||||
(a) Source: Statistical Surveys, Inc. Data is based on official state records and is subject to adjustment and is continuously updated.
Thor Unit Shipments Versus Industry
Our Motorized unit shipments increased by 5.1% for the fiscal year, compared to an industry growth rate of 6.0% for the comparable period.
8
|
1.
|
Thor reported a decline in consolidated sales of 3.1% for the fourth quarter of 2018 versus the prior year. What factors drove the lower sales levels?
|
|
A.
|
The decline in fourth quarter sales reflects the actions taken during the period to balance dealer inventory levels. Our reduced production levels combined with higher promotional costs and solid retail demand have improved the position of our dealers' inventories as they enter the new model year and prepare for the upcoming 2018 Dealer Open House.
|
It is important to point out that during the fourth quarter of 2017, the Company reported sales growth of 49.7% (18.8% organic growth and a 30.9% increase from the Jayco acquisition completed on June 30, 2016). During this prior-year quarter, our dealers believed that their inventory levels were too low for the then current and anticipated retail demand, and therefore dealers placed higher levels of orders prior to the 2017 Dealer Open House in order to strategically position themselves for the 2018 calendar year selling season. Concurrent with these strong dealer orders, capacity additions over the past year allowed for higher unit production and, in turn, strong sales growth in the first half of fiscal 2018.
From an overall perspective, our objective is to align our sales (wholesale) with those of our dealers (retail) over time. We recognize that bringing wholesale and retail sales into alignment can result in some quarterly variations in our top-line growth metrics. Our production and shipment plans reflect providing our dealers with the appropriate levels of inventory they believe they need to meet current and expected retail demand in a timely manner.
|
2.
|
Your fourth quarter gross margin decreased by 260 basis points on a year-over-year basis. What were the main factors causing this result? Why was the second-half margin performance different than the margin improvements achieved in the first half of the year?
|
|
A.
|
As a result of the actions taken during the fourth quarter of FY 2018 to balance dealer inventory levels, reduced production levels combined with higher promotional cost had a negative impact on our gross margin. Also, during the quarter, we experienced an increase in year-over-year warranty costs, which was due in part to providing extended coverage on certain products since the prior-year period, as well as higher claim activity incurred during the period. While labor costs have begun to moderate, they have remained elevated compared to the prior year. Lastly, while we were successful in delaying certain raw material price increases in the first half of the fiscal year, we are now experiencing inflationary price increases in certain raw material and commodity-based components due in large part to the headwinds created by the announcement and implementation of the steel and aluminum tariffs and other regulatory actions.
|
9
During the first half of FY 2018, we experienced strong increases in gross margin due to strong sales growth, as well as achieving operating and process improvements, primarily by Jayco, which we subsequently lapped in the second half. We were also successful during this period in delaying certain price increases from our supply partners.
|
3.
|
Thor’s gross margin for the fourth quarter was 13.0% compared to 14.1% for the third quarter. What caused this sequential decrease in margin?
|
|
A.
|
In general, our business does not lend itself to meaningful sequential analysis because of varying seasonal demand and production. Historically, however, our fourth quarter has been a higher margin period compared to the other quarters. This was not the case this year mainly due to reduced production levels, lowered wholesale shipments and increased dealer discounts and incentives in order to balance dealer inventories experienced in the fourth quarter of 2018. Also during this period, as a result of the reduction in shipments, our fixed overhead costs were a higher percentage of sales in the fourth quarter versus the third quarter.
|
|
4.
|
On a percentage of sales basis, Thor’s Selling, General and Administrative (SG&A) expenses were flat compared to the prior year, at approximately 5.7%. What were some of the key factors that affected expenses during the quarter?
|
|
A.
|
Our recent historical trend of SG&A expenses reflects a general range of 5.5% to 6.0% of net sales. The costs included in SG&A are primarily variable in nature and fluctuate with the level of sales and income before income taxes.
|
During the fourth quarter of fiscal 2018, we incurred incremental expenses of approximately $6 million, primarily from the combination of transaction costs associated with the announced acquisition of the Erwin Hymer Group and certain legal settlement costs.
These cost increases, however, were essentially offset by a reduction in our management incentive compensation costs, which are based on pre-tax profitability and provides us with cost savings in times when profitability is lower, as was the case in the fourth quarter of this year.
10
|
5.
|
Thor reported a decline in income before income taxes of 29.3% on a decline in sales growth of 3.1% for the fourth quarter of fiscal 2018. What caused this performance?
|
|
A.
|
Thor’s earnings performance was principally driven by the lower gross margin percent, partially offset by a decrease in interest and amortization expenses.
|
|
6.
|
Thor reported a lower rate of decline in net income compared to the decrease in income before income taxes. What caused this result?
|
|
A.
|
Our net income decreased at a lower rate compared to income before income taxes due to a lower fourth quarter effective tax rate of 29.1%, compared to an effective tax rate of 32.1% for the fourth quarter of fiscal 2017. The lower effective tax rate is a direct result of the recently enacted Tax Act. See “Current Hot Topics” section below for further discussion regarding the impact of the Tax Act.
|
|
7.
|
What are the key factors affecting current backlog levels? Are you seeing any material cancellations to orders placed earlier in the year?
|
|
A.
|
Our backlog of $1.4 billion is a reflection of our current, pre-Dealer Open House time of the year, as our dealers await the introduction of our 2019 models. The current backlog also reflects the improvements we have achieved in the time frame in which we deliver dealer orders as a result of the recent capacity additions we have made over the last several quarters. We have not experienced any material cancellations to orders placed earlier in the fiscal year by our dealers.
|
We remain intensely focused on matching our capacity with the demand for our products, while being mindful of both the historically cyclical nature of our industry and also the secular shift that has occurred in recent quarters that belies that history. During fiscal 2017 and 2018, we took numerous actions to increase our capacity, including process improvements, realignment of existing facilities, acquisitions of facilities and new plant construction. These actions had a favorable impact on our 2018 production rates, which in turn improved both our delivery times and drove the reduction in our backlog to more normalized levels.
These expansion projects have allowed us to meet the demand for our products on a more timely basis while expanding our dealer base. We expect this trend to continue in subsequent quarters and, consequently, to result in a year-over-year reduction in overall backlog. In addition, our added capacity and normalized backlog will provide us with the ability to realize the benefits (such as lower labor-related expenses, the effects from product quality improvements and overall reduced manufacturing costs) associated with a more stable production environment.
11
|
1.
|
A. For our stakeholders, this acquisition will provide Thor an entry into the 6 billion-plus Euro growing European RV market with a leadership position. It further enables us to go to market with a company that has a 60+ year track record of excellence within the RV industry, represented by outstanding brands that are synonymous with innovation and quality. The Erwin Hymer Group has a complementary product lineup that spans across multiple price points and categories and is supported by a strong dealer network.
We believe the combined companies will be able to derive significant benefits from design, R&D, technology, engineering and manufacturing excellence and further create a global platform that will generate significant free cash flow and provide extensive synergy opportunities.
12
|
2.
|
|
A.
|
Given the ongoing retail demand for our products by dealers and consumers, as well as the high level of dealer optimism regarding the remainder of 2018 and upcoming 2019 season, we believe dealer inventory levels are generally appropriate for seasonal consumer demand. Dealer inventory levels at the end of our fourth quarter were higher compared to the prior year in certain locations due to the convergence of a number of factors: (1) dealer inventory at the end of our fourth quarter of last year was meaningfully below the dealers' desired levels, (2) many dealers made strategic decisions to carry more inventory going into calendar 2018 to ensure adequate levels of product on hand to satisfy anticipated customer demand, (3) the prolonged winter delayed the typical start to the spring retail selling and delivery activity for many regions of the North American market which had a modest lingering effect beyond spring and (4) our added production capacity allowed for dealer orders to be produced and delivered more quickly in the current fiscal year. Also affecting the dealer inventory level at July 31, 2018, were our Canadian dealers, who as a result of an improving economy, are becoming more optimistic and increasing their inventory levels to reflect a recovering RV market.
|
|
3.
|
|
A.
|
We are experiencing inflationary price increases in certain raw material and commodity-based components due in part to the headwinds created by the announcement and implementation of the steel and aluminum tariffs and other regulatory actions. We continue to work closely with our supply partners to minimize the resulting price increases. We have also taken steps to address incremental costs through a combination of product de-contenting, material sourcing strategies and strategic product price increases, as well as by implementing efficiency improvements throughout our production processes. Historically, we have generally been able to offset net cost increases over time.
|
We believe it is important to point out that steel and aluminum are used to varying degrees in our towable and motorized RVs. The quantity of steel or aluminum contained in our end products varies significantly depending on the particular type of product, with our smaller, light-weight travel trailers containing less of those materials compared to our larger, motorized units. Examples of some of the key component parts that are utilized in the construction of our products that contain sizable amounts of steel or aluminum, include: motorized chassis, frames, aluminum siding, axles, slide-out mechanisms, doors, jacks, awnings and structural aluminum extrusions. Other examples of key components that also contain steel or aluminum, but to a lesser extent, include: window frames, steps, furniture structures, sinks and appliances.
13
Through our ongoing discussions with our key suppliers, we are also monitoring the potential impact of China tariffs on our cost of goods. As of this time, we believe the net impact on our overall costs from the China tariffs will be modest. We are prepared to take similar action steps to address the impact of China-related tariffs that we have already taken to address the steel and aluminum tariffs.
|
4.
|
|
A.
|
The Tax Act was signed into law in December 2017, and includes numerous changes to tax law impacting business, the most significant being a permanent reduction in the federal corporate income tax rate from 35.0% to 21.0%. The rate reduction took effect on January 1, 2018. As the Company’s 2018 fiscal year ended on July 31, 2018, the Company’s federal corporate income tax rate for fiscal 2018 was required to be prorated to a blended 26.9% rate (based on the number of days in the fiscal year to which the two different rates apply). In addition, certain other provisions of the Tax Act, such as the repeal of the domestic production activities (Code Section 199) deduction and limitations on the deductibility of executive compensation, were not effective for the Company during fiscal 2018, but will become effective starting in fiscal 2019.
|
Our effective tax rate in the fourth quarter was 29.1%, compared to an effective tax rate of 32.1% for the prior-year period. The Company recorded a provisional amount of $2.0 million in the fourth quarter of fiscal 2018 of additional income tax expense as a result of guidance from the Internal Revenue Service related to limitations on the deductibility of executive compensation as provided under the Tax Act. As we look forward to fiscal 2019, after considering the lower federal tax rate of 21% for the full fiscal year, an estimated blended state tax rate, the elimination of the Code Section 199 deduction, and the limitations on the deductibility of executive compensation, we currently estimate an overall effective tax rate in the range of 23% and 25%, before consideration of any discrete tax items.
|
5.
|
14
|
A.
|
We continue to make excellent progress in ramping up TH2. Under the tradename Togo, TH2 will release a suite of consumer apps at the Dealer Open House set to occur from September 24 through September 28, 2018. Designed to offer transformational improvements to the RV user experience, Togo consists of products and services that inspire confidence and peace-of-mind in RV users.
|
In addition to the upcoming Togo launch, the TH2 global joint venture is made up of a comprehensive digital platform including Roadtrippers (www.roadtrippers.com) and Roadtrippers Australasia - leaders in digital trip planning services; Cosmos, a digital platform for RV fleet management, product pricing, and booking and rental management; Mighway (www.mighway.com) a leader in peer-to-peer RV rentals; and Campermate, Australia and New Zealand’s top camping app.
TH2 offers a variety of products and services focused on enhancing the enjoyment, safety, connectivity and convenience of RV ownership and use. In addition to making our products more attractive to technologically savvy consumers and attracting more consumers to the RV market, we believe that TH2's functionality will provide numerous revenue streams, including subscriptions, advertisements and commissions.
At our September 2018 Dealer Open House event, we plan on providing more information on this strategic investment.
Our share of the losses of this investment was $1.9 million in fiscal 2018. This loss represents the results of operations for the four months since the formation of the joint venture. The joint venture is expected to experience losses in fiscal 2019 as it continues its ramp-up phase, but such losses are not expected to have a material impact on Thor’s earnings for fiscal year 2019.
|
1.
|
|
A.
|
There are many positive consumer trends that bode well for the long-term future of the RV industry. Some specific findings of the 2018 North American Camping Report from Kampgrounds of America (KOA) include:
|
|
•
|
More than 6 million new households have started camping since 2014, with an increase of 2.6 million new camper households in 2017.
|
|
•
|
As campers age, they generally begin to camp more using RVs. Approximately 7-in-10 current RVers are Millennials or Gen Xers.
|
|
•
|
New campers are now more diverse than the overall U.S. population.
|
|
•
|
In 2017, 61% of campers stayed in a tent – marking a prime target market for Thor to convert tent campers to RVers.
|
15
|
2.
|
What other trends are influencing growth in the RV lifestyle?
|
|
A.
|
RV camping continues to be viewed as an attractive way to spend time with family and friends. Other trends driving RV growth include:
|
|
•
|
The strong correlation with the growth in recreational sports – reflecting a trend toward becoming more active and leading a healthy lifestyle, as well as a growing use of RVs with youth sports leagues and tournaments.
|
|
•
|
The wide variety of RV uses, including tailgating at spectator sports, from college and professional football to auto racing and youth sports.
|
|
•
|
The ability an RV provides to escape stress and relax on short notice for long weekends or other quick getaways.
|
|
•
|
Key shifts in consumer travel preferences, including: the lower cost of RV vacations compared to other forms of travel, the increasing inconvenience of domestic air travel and increasing interest in more experiential vacations which often include an outdoor element.
|
16
|
3.
|
|
A.
|
Yes – there are a number of sources that are supportive of this fact, including RVIA’s 2016 Industry Profile which references a Nielsen research study performed for Go RVingTM that found that the typical RV owner is 45 years old compared to a similar study from 2015 that indicated the typical owner was 48 years old. This study did not distinguish between owners of new versus used units, but is indicative of the reduction in the age of RV consumers. In addition, using data from Statistical Surveys, Inc., we have analyzed annual retail registrations of new RV units from 2013 through 2017 and noted that the average age of the buyer has decreased from 56 years of age in 2013 to 54 years of age in 2017. Given that over 1 million new VINs were registered during this time frame, a 2 year reduction in the average age is a meaningful age reduction over a relatively short period of time.
|
|
A.
|
In general, used RV inventory continues to be limited, and prices remain elevated. At the same time, new products at the entry level are priced competitively and contain the features and floorplans consumers are looking for as well as a factory warranty. This combination of price and value is leading many consumers to buy new rather than used products. Robust demand for used RV inventory also enhances trade-in values. Historically, trade-in value has been one factor that supports consumers who choose to purchase new units every 3-5 years. As a result, a healthy used RV market generally has a positive impact on the overall demand for new RVs.
|
17
|
A.
|
Current retail data suggests that the market remains healthy. While unfavorable weather conditions in numerous markets contributed to a slower start to the retail selling and delivery season, we remain confident that continued positive economic conditions, combined with strong consumer demand fundamentals, will provide another year of meaningful retail growth.
|
Through July 2018, U.S. RV industry retail registrations, as reported by Statistical Surveys, Inc., increased by 6.3% versus the prior year. This follows a very strong year of growth in 2017, as U.S. retail registrations increased in total by 11.6%, with towable retail registrations increasing by 11.5% and motorized registrations increasing 11.7%.
As the current year retail registrations continue to be adjusted by more complete submissions from the government agencies, combined with the sales activity we are hearing from our dealers in August and thus far in September, we believe the calendar 2018 growth rate will be greater than the reported current year-to-date rate.
|
2.
|
Through July of 2018, how have industry wholesale shipments to dealers performed versus the prior year? What is the current industry outlook by RVIA for industry wholesale shipments for calendar year 2018 and 2019?
|
|
A.
|
During the 7 months ended July 31, 2018, industry wholesale shipments to dealers, as reported by the RVIA, reflect a 6.5% growth rate, with towable RVs up by 7.4% and motorized RVs flat compared to the prior year.
|
The August RVIA forecast estimates total industry wholesale shipments to grow by less than 1% in 2018 and decline by less than 2% in 2019, as manufacturers continue to match their shipments with units being sold by their dealers. As a reminder, industry wholesale shipments in 2017 increased by 17.2%, on top of 15.1% growth in 2016.
|
A.
|
In calendar 2017, the Canadian RV industry experienced strong wholesale growth rates, which were supported by retail registration growth, as reported by Statistical Surveys, Inc., of 14.2%, with towable retail registrations increasing 12.4% and motorized registrations increasing 40.7%, as well as dealers' desire to carry higher levels of inventory to support retail sales growth. The growth in 2017 followed three consecutive years (2014 to 2016) of retail sales declines.
|
18
Unfavorable weather conditions in certain provinces contributed to a slower start to the selling and delivery season, however, subsequent retail sales have begun to show signs of recovery. Through July 2018, overall Canadian retail registrations have increased by 4.7% with towables up 4.8% and motorized up 3.4%. We believe that a continued healthy Canadian economy will support additional Canadian RV growth in the remainder of 2018 and beyond.
|
4.
|
|
A.
|
The labor market continues to be tight in Northern Indiana, with the most acute labor tightness within the City of Elkhart. We have implemented multiple initiatives to help attract and retain the best workers and alleviate the labor force pressures. We will remain competitive when it comes to offering the right combination of wages and benefits, while at the same time managing our capacity growth with a focus on geographical areas that offer larger pools of available, quality workers. Many of our recent or announced expansions have occurred, or are planned, for areas outside of Elkhart, where the availability of labor is better. As a result of these actions, as well as more normalized production rates, growth in consolidated labor expense has begun to moderate compared to the prior year.
|
|
A.
|
The RV industry remains highly competitive, as our subsidiaries and our outside competitors continue to drive the industry forward with new and better products for dealers and consumers.
|
During the fourth quarter of FY 2018, we did experience an increase in promotional costs compared to recent periods in order to balance dealer inventory levels.
|
6.
|
|
A.
|
Both dealer and consumer credit environments are healthy. The wholesale lending environment remains healthy, with normal seasonal credit line availability and utilization, as well as continued discipline among lenders concerning credit lines and curtailments.
|
Retail lending standards are also healthy, and credit is broadly available to creditworthy consumers with reasonable down payments and normal length of term options available. The retail RV delinquency rate remains low and is significantly below the average delinquency rate of closed-end consumer loans.
Ally Financial was one of a number of lenders, many of whom are much larger players within the RV wholesale space. We have already heard from a number of the other lenders in the space who are eager and able to take on former Ally dealers. We do not anticipate any disruption to wholesale financing to any of our dealers as a result of Ally's decision.
19
|
7.
|
|
A.
|
Competition for dealers is inherent in our industry. Recent consolidation has not impacted this reality, nor do we expect this to significantly change. Thor’s ability to develop long-standing relationships with the most productive dealers in the market has been, and will always be, crucial to our success, with or without further consolidation.
|
To date, our margins have not been considerably impacted by dealer consolidation. We do not anticipate significant pressure from further consolidation because our dealers appreciate the value that Thor offers, with our breadth of products and brands, people and day-to-day support. Larger dealers, in particular, value partnering with a company that has the ability to provide a large volume of units within a reasonable time period throughout the year.
|
A.
|
Traditionally, we have experienced little adverse effect on retail demand from gradual, modest increases in interest rates. We remain in a historically lower interest rate environment, with adequate credit availability for qualified consumers, and we expect these conditions will continue to be the case for the foreseeable future.
|
20
|
1.
|
What payments have you made on the debt facility in fiscal 2018?
|
|
A.
|
We paid down the entire amount outstanding of $145 million on our debt facility during fiscal 2018. This debt originated as a result of the Jayco acquisition, completed in late fiscal 2016. Our execution, combined with strong earnings and cash flows following the acquisition, allowed us to pay off the initial debt total of $360 million in just two years.
|
|
2.
|
What was working capital at July 31, 2018 and July 31, 2017? What drove the change in working capital year over year?
|
|
A.
|
Working capital at July 31, 2018, was $542.3 million compared to $399.1 million at July 31, 2017. The increase of $143.2 million is primarily a result of an increase in inventory of $77.4 million, primarily due to additional production facilities and production lines added over the past year, and an increase of $52.0 million in cash and cash equivalents.
|
|
3.
|
What is Thor’s current capital expenditure estimate for fiscal 2019?
|
|
A.
|
During the 2018 fiscal year, we invested over $138 million on various capital projects to support long-term expected growth in our businesses. We completed projects at many of our subsidiaries, including Heartland, Jayco and TMC, adding approximately 864,000 square feet, primarily in additional production facility space. In fiscal 2019, we expect to complete the previously announced expansion projects, including:
|
|
•
|
Jayco's expansion in Twin Falls, ID, to improve service to dealers in the Western US and Canada. This facility is expected to be completed in the fall of 2019.
|
|
•
|
Airstream's 700,000 square foot facility, in Jackson Center, OH, that will include new production space for its iconic travel trailers as well as a state of the art training center and visitor center. The new facility is expected to be completed in the fall of 2019.
|
As a result of these and other capital projects, we anticipate capital expenditures to approximate $130 million in fiscal 2019.
As we look ahead, we see continued long-term demand in both our industry and for Thor’s products specifically. Management remains committed to balancing financial prudence with the goals of our strategic plan, as we endeavor to best position Thor to seize the opportunities presented by the demand for our products and our growing market.
21
|
4.
|
As a result of your recent current capacity additions, do you expect the startup of production to have an adverse impact on margins?
|
|
A.
|
Generally, the startup of new or expanded towable facilities happens more quickly than the startup of motorized facilities, with lower initial costs. The startup of new facilities can temporarily increase costs as a result of training and assimilating an expanded workforce, and has, in combination with introducing new product offerings and expanding product lines, led to a short-term increase in warranty costs. Over the past few years, we have expanded a number of plants, started up a number of new plants and introduced a number of new products, and the start-up impact on our margins was generally temporary and modest. With future expansion, we would expect a similar temporary impact.
|
22

|
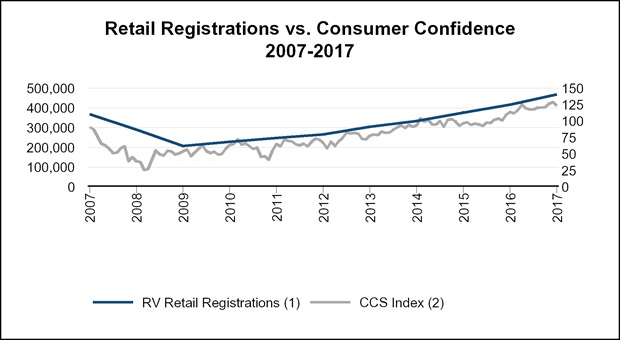
Health of North American Economy
Supports Expected Continued Market Growth
|
Sources: (1) Statistical Surveys, Inc.; (2) The Conference Board, Consumer Confidence Survey®; (3) Recreation Vehicle Industry Association; (4) U.S. Bureau of Economic Analysis
23
|
1.
|
What are the key factors that have been supporting the growth in the RV industry and do you anticipate this growth to continue?
|
|
A.
|
Several factors have been supporting growth in the RV industry, including (1) the health of the U.S. and Canadian economies, (2) demographic trends and lifestyle changes that are favorably contributing to RV participation and (3) the continued focus on product innovation and affordability – providing the benefits of the RV experience to a growing base of potential consumers.
|
The health of the overall North American economy is evidenced by certain key indicators that our management team closely monitors, including:
|
•
|
A growing economy (GDP), healthy consumer confidence levels and increased discretionary consumer spending, which should continue to benefit from lower tax rates stemming from the recent enactment of the Tax Act.
|
|
•
|
Historically lower interest rates with adequate credit availability, relatively stable fuel prices, favorable employment trends and a healthy housing market.
|
|
•
|
See prior page for historical correlation between RV growth and certain key economic metrics.
|
Favorable demographic trends and lifestyle changes are influencing a greater level of RV participation and continue to drive strong retail sales, including:
|
•
|
Increasing North American camping trends, as described earlier in this document, and further described in KOA’s 2018 annual survey report. Findings in this report reflect the growth in the number of overall campers and the frequency in which they camp, as well as a younger and more diverse group of new participants. Specifically, Millennials comprised 31% of the total population in the most recent census, yet accounted for 40% of the total campers in 2017, which increased from 38% of the total campers in 2016, and 34% in 2015.
|
|
•
|
New consumers continue to adopt the RV lifestyle. Per the Recreational Vehicle Industry Association: 34% of RVs sold in 2016 were to first-time buyers, with 80% of those new buyers under age 65. New consumers continue to adopt the RV lifestyle.
|
|
•
|
An expanding array of uses for RVs are driving incremental demand – such as outdoor recreation (an increasing contributor to overall U.S. GDP), tailgating at spectator sports and other lifestyle events.
|
Finally, the continued focus on innovation and affordability – is providing compelling product benefits, as well as enhancing the overall RV experiences by offering:
|
•
|
Award-winning products across the entire price spectrum, reflecting innovative and contemporary floor plans and designs, as well as improved control systems and technologies.
|
24
We anticipate the factors mentioned above will continue to support industry growth for the foreseeable future, specifically solid macroeconomic fundamentals and the strong secular trends influencing new consumer growth and market expansion. Unlike many of the expansions we have experienced over the past two decades, the current expansion has been driven largely by new consumers adopting the RV lifestyle. We view such an expansion to be more sustainable over the long term.
|
2.
|
What is your outlook for Thor for fiscal year 2019?
|
|
A.
|
Solid year-over-year growth of retail registrations is expected to continue throughout the remainder of calendar 2018 and into our fiscal year 2019, as we and our dealers remain optimistic about current and near-term economic conditions and new consumers entering the RV market. We are encouraged by recent order trends related to our higher-end products, including larger diesel Class A motorhomes, fifth wheels and Airstream products. Demand for Airstream products in particular remains very robust and supports our plans to expand this facility.
|
While we are pleased with our full-year results, fiscal 2018 ended with near-term challenges for both top line and gross margin. Our entire organization focused throughout the latter part of the fiscal year in assisting our dealers in balancing their inventory levels, as well as taking numerous actions to offset our rising costs, however, we have more work to do in fiscal 2019.
As dealer orders and our resulting production schedules return to a more normalized pattern beginning in calendar 2019, we will continue to match production to our dealer needs, protect and seek to grow our space on dealer lots, ensure we provide high-quality, innovative products in all key price points with the features consumers are seeking and act aggressively to offset items pressuring our margins, whether from labor, tariffs, commodity increases or other sources.
Due to dealer order strength experienced in the first half of fiscal 2018, we are planning for tougher year-over-year comparisons in the first half of fiscal 2019 with more favorable top line growth rates in the second half of the year. Similar to the quarterly progression of our top line, we anticipate gross margin pressure to be greater in the first half of the year. During fiscal year 2019, our diluted EPS will benefit from a lower effective tax rate.
25
|
3.
|
What are your strategic plans for fiscal 2019 and beyond?
|
|
A.
|
We will remain focused on driving organic growth in our current businesses through prudent investments in capital projects, technology and product innovation. In addition, we will be focused on completing the previously announced acquisition of the Erwin Hymer Group, as well as increasing returns to shareholders through dividends and share repurchases. We believe these combined actions will enhance shareholder value.
|
26