Attached files
| file | filename |
|---|---|
| EX-32.2 - EXHIBIT 32.2 - MISONIX INC | s112490_ex32-2.htm |
| EX-32.1 - EXHIBIT 32.1 - MISONIX INC | s112490_ex32-1.htm |
| EX-31.2 - EXHIBIT 32.2 - MISONIX INC | s112490_ex31-2.htm |
| EX-31.1 - EXHIBIT 31.1 - MISONIX INC | s112490_ex31-1.htm |
| EX-23.2 - EXHIBIT 23.2 - MISONIX INC | s112490_ex23-2.htm |
| EX-23.1 - EXHIBIT 23.1 - MISONIX INC | s112490_ex23-1.htm |
UNITED STATES
SECURITIES AND EXCHANGE COMMISSION
Washington, DC 20549
FORM 10-K
(Mark One)
| ☑ | ANNUAL REPORT PURSUANT TO SECTION 13 OR 15(d) OF THE SECURITIES EXCHANGE ACT OF 1934 |
For the fiscal year ended June 30, 2018
OR
| ☐ | TRANSITION REPORT PURSUANT TO SECTION 13 OR 15(d) OF THE SECURITIES EXCHANGE ACT OF 1934 |
For the transition period from _____ to _____
Commission file number: 1-10986

| MISONIX, INC. |
(Exact name of registrant as specified in its charter)
| New York | 11-2148932 | |
| (State or other jurisdiction of incorporation or organization) |
(I.R.S. Employer Identification No.) | |
| 1938 New Highway, Farmingdale, New York | 11735 | |
| (Address of principal executive offices) | (Zip Code) |
Registrant’s telephone number, including area code: (631) 694-9555
Securities registered pursuant to Section 12(b) of the Act:
| Title of each class | Name of each exchange on which registered | |
| Common Stock, $.01 par value | Nasdaq Global Market |
Securities registered pursuant to Section 12(g) of the Act: None
Indicate by check mark if the registrant is a well-known seasoned issuer, as defined in Rule 405 of the Securities Act.
☐ Yes ☑ No
Indicate by check mark if the registrant is not required to file reports pursuant to Section 13 or Section 15(d) of the Act.
☐ Yes ☑ No
Indicate by check mark whether the registrant (1) has filed all reports required to be filed by Section 13 or 15(d) of the Securities Exchange Act of 1934 during the preceding 12 months (or for such shorter period that the registrant was required to file such reports), and (2) has been subject to such filing requirements for the past 90 days.
☑ Yes ☐ No
Indicate by check mark whether the registrant has submitted electronically and posted on its corporate Web site, if any, every Interactive Data File required to be submitted and posted pursuant to Rule 405 of Regulation S-T (§ 232.405 of this chapter) during the preceding 12 months (or for such shorter period that the registrant was required to submit and post such files). ☑ Yes ☐ No
Indicate by check mark if disclosure of delinquent filers pursuant to Item 405 of Regulation S-K (§229.405 of this chapter) is not contained herein, and will not be contained, to the best of registrant’s knowledge, in definitive proxy or information statements incorporated by reference in Part III of this Form 10-K or any amendment to this Form 10-K. ☑
Indicate by check mark whether the registrant is a large accelerated filer, an accelerated filer, a non-accelerated filer, a smaller reporting company or an emerging growth company. See the definitions of “large accelerated filer,” “accelerated filer”, “smaller reporting company” and “emerging growth company” in Rule 12b-2 of the Exchange Act.
| Large accelerated filer ☐ | Accelerated filer | ☑ | Non-accelerated filer ☐ | Smaller reporting company ☑ | Emerging growth company ☐ | |||
If an emerging growth company, indicate by check mark if the registrant has elected not to use the extended transition period for complying with any new or revised financial accounting standards provided pursuant to Section 13(a) of the Exchange Act. ☐
Indicate by check mark whether the registrant is a shell company (as defined in Rule 12b-2 of the Exchange Act).
☐ Yes ☑ No
The aggregate market value of the voting stock held by non-affiliates of the registrant on December 31, 2017 (computed by reference to the closing price of such stock on such date) was approximately $71,441,583.
There were 9,442,095 shares of Common Stock outstanding at August 29, 2018.
DOCUMENTS INCORPORATED BY REFERENCE
None
USE OF FORWARD-LOOKING STATEMENTS
In this document, we refer to Misonix, Inc. and its subsidiaries (unless the context otherwise requires) as “we,” the “Company” or “Misonix.” With the exception of historical information contained in this Form 10-K, content herein may contain “forward looking statements” that are made pursuant to the Safe Harbor Provisions of the Private Securities Litigation Reform Act of 1995. These statements are based on management’s current expectations and are subject to uncertainty and changes in circumstances. We cannot guarantee that any forward looking statements will be accurate, although we believe that we have been reasonable in our expectations and assumptions. Investors should realize that if underlying assumptions prove inaccurate or unknown risks or uncertainties materialize, actual results could vary materially from our expectations and projections. These factors include general economic conditions, delays and risks associated with the performance of contracts, risks associated with international sales and currency fluctuations, uncertainties as a result of research and development, acceptable results from clinical studies, including publication of results and patient/procedure data with varying levels of statistical relevance, risks involved in introducing and marketing new products, regulatory compliance, potential acquisitions, consumer and industry acceptance, litigation and/or contemplated 510(k) filings, the ability to achieve and maintain profitability in our business lines, and other factors discussed in this Annual Report on Form 10-K, subsequent Quarterly Reports on Form 10-Q and Current Reports on Form 8-K. We disclaim any obligation to update any forward-looking statements.
2
TABLE OF CONTENTS
3
Overview
Misonix, Inc. is a New York corporation based in Farmingdale, New York. We design, manufacture and market minimally invasive therapeutic ultrasonic medical devices. Our products enhance clinical outcomes and provide value to customers and patients. We believe that our current focus products have the ability to become standard of care and provide the Company with a growing revenue stream.
| ● | BoneScalpel® Surgical System (“BoneScalpel”), which is used for surgical procedures involving the precise cutting and sculpting of bone while sparing soft tissue. BoneScapel is now recognized by many surgeons globally as a critical surgical tool enabling improved patient outcomes in the spinal arena. | |
| ● | SonaStar® Surgical Aspirator (“SonaStar”), which is used to emulsify and remove soft and hard tumors, primarily in the neuro and general surgery field. | |
| ● | SonicOne® Wound Cleansing and Debridement System (“SonicOne”), which offers tissue specific debridement and cleansing of wounds and burns for effective removal of devitalized tissue and fibrin deposits while sparing viable cells. |
These devices primarily serve the following clinical specialties: neurosurgery, orthopedic surgery, plastic surgery, wound care and maxillo-facial surgery.
In the United States, our products are marketed primarily through a hybrid sales approach. This includes direct sales representatives, managed by regional sales managers, along with independent distributors.
Outside the United States, we sell our products to specialty distributors who purchase products from us to resell to their clinical customer bases. We sell to all major markets in the Americas, Europe, Middle East, Asia Pacific and Africa.
Products
All Misonix disposables function with proprietary consoles which essentially convert electrical current into ultrasonic energy via piezo electric crystals in order for the relevant device to produce a therapeutic effect.
BoneScalpel
The BoneScalpel is a state of the art, ultrasonic bone cutting and sculpting system capable of making precise cuts with minimal necrosis, minimal burn artifact, minimal inflammation and minimal bone loss. The device is also capable of preserving surrounding soft tissue structures because of its unique ability to differentiate soft tissue from rigid bone. This device can make precise linear or curved cuts, on any plane, with precision not normally associated with powered instrumentation. The BoneScalpel offers the speed and convenience of a powered instrument without the dangers associated with conventional rotary devices. The effect on surrounding soft tissue is minimal due to the elastic and flexible structure of healthy tissue. This is a significant advantage in anatomical regions like the spine where patient safety is of primary concern. In addition, the linear motion of the blunt, tissue-impacting tips avoids accidental ‘trapping’ of soft tissue while largely eliminating the high speed spinning and tearing associated with rotary power instruments. The BoneScalpel allows surgeons to improve on existing surgical techniques by creating new approaches to bone cutting and sculpting and removal, leading to substantial time savings and increased operation efficiencies.
4
The expanded BoneScalpel product platform will allow entry into dynamic market segments like minimally invasive spine surgery and other bone cutting and sculpting needs.
SonaStar
The SonaStar System provides powerful precise aspiration following the ultrasonic ablation of hard or soft tissue. The SonaStar has been used for a wide variety of surgical procedures applying both open and minimally invasive approaches, including neurosurgery and liver surgery. The SonaStar may also be used with OsteoSculpt ® probe tips, which enable the precise shaping or shaving of bony structures that prevent open access to partially or completely hidden soft tissue masses.
SonicOne
The SonicOne Ultrasonic Cleansing and Debridement System is a highly innovative, tissue specific approach for the effective removal of devitalized or necrotic tissue and fibrin deposits while sparing viable, surrounding cellular structures. The tissue specific capability is, in part, due to the fact that healthy and viable tissue structures have a higher elasticity and flexibility than necrotic tissue and are more resistant to destruction from the impact effects of ultrasound. The ultrasonic debridement process separates devitalized tissue from viable tissue layers, allowing for a more defined treatment and, usually, a reduced pain sensation. We believe SonicOne establishes a new standard in wound and burn bed preparation, the essential first step in the healing process, while contributing to a faster patient healing.
License and Other Agreements
On October 19, 2017, the Company entered into a License and Exclusive Manufacturing Agreement (the “Agreement”) with Hunan Xing Hang Rui Kang Bio-technologies Co., Ltd., a Chinese corporation (the “Licensee”) under which Misonix has licensed certain manufacturing and distribution rights to its SonaStar product line in China, Hong Kong and Macau (the “Territory”) in exchange for payments totaling at least $11,000,000.
Pursuant to the Agreement, Licensee is obligated to pay the Company: (i) initial amounts consisting of upfront fees and stocking orders totaling $5,000,000, payable in five (5) equal monthly installments of $1,000,000 each; (ii) royalty payments from the sale of SonaStar products in the Territory, including minimum royalty payments of $2,000,000 per calendar year in each of 2019, 2020, and 2021; and (iii) reimbursement of technology transfer costs in an amount up to $1,000,000. The Agreement also provides that Misonix will supply SonaStar products to Licensee at agreed prices during the transition period prior to Licensee’s commencement of manufacturing.
During the year ended June 30, 2018, the Company delivered the licensed SonaStar technology to the Licensee, and recorded license revenue of $4,010,000. In addition, during the year ended June 30, 2018, the Company had delivered the contractually agreed number of SonaStar units to the Licensee and had recorded product revenue of $990,000. All of the $5 million of initial payments were collected as of March 31, 2018.
In October 1996, we entered into a license agreement with Medtronic Minimally Invasive Therapies (“MMIT”). The MMIT license covered the further development of our medical technology relating to vessel sealing products, which uses high frequency sound waves to coagulate and divide tissue for both open and laparoscopic surgery. We developed the AutoSonix product with MMIT under the agreement. As a result of this joint development, we co-own certain patents with MMIT and MMIT paid us a 5% royalty on end user sales. The MMIT license gives MMIT exclusive worldwide marketing and sales rights for this technology and device. Total royalties from sales of this device worldwide were approximately $525,000, $3,764,000 and $3,903,000 for the fiscal years ended June 30, 2018, 2017 and 2016, respectively. The royalty is recorded as “other income” in our financial statements. Our license agreement with MMIT expired in August 2017 and no further payments are due thereafter.
We sold our rights to the high intensity focused ultrasound technology to SonaCare Medical, LLC (“SonaCare”) in May 2010. We may receive up to approximately $5.8 million in payment for the sale. SonaCare will pay us 7% of the gross revenues received from its sales of the (i) prostate product in Europe and (ii) kidney and liver products worldwide, until we have received payments of $3 million, and thereafter 5% of the gross revenues, up to an aggregate payment of $5.8 million, all subject to a minimum annual royalty of $250,000. Fiscal 2018 payments were $250,000 bringing cumulative payments through June 30, 2018 to $2,542,579.
5
Customers
For the fiscal year ended June 30, 2018, one customer, Hunan Xing Hang Rui Kang Bio-technologies Co., Ltd., accounted for 15.8% of our revenue. During the fiscal years ended June 30, 2017 and 2016, we did not have any customer that accounted for 10% or more of our net sales during such periods.
Research & Development
As of June 30, 2018, our Research and Development (“R&D”) organization consisted of a staff of 10 employees including engineers, technical and support personnel. The in-house technical expertise includes mechanical engineering, acoustics, electrical engineering, software development and product design. The R&D group focuses principally on developing new products and supporting existing products. The Company is currently developing its Nexus next generation surgical platform, resulting in higher research and development expenditures in the current fiscal year.
During the three years ended June 30, 2018, the Company incurred R&D expenses of $4,394,149, $1,837,497, and $1,839,479, or 12.0%, 6.7% and 8.0% of sales, respectively.
Revenue by Region
The Company’s revenues are generated from various regions throughout the world. Sales by the Company outside the United States are made through distributors. Sales made in the United States are made primarily through its direct sales force and some distributors. The following is an analysis of net sales from continuing operations by geographic region:
| For the years ended June 30, | Net Change | ||||||||||||||||||||
| 2018 | 2017 | 2016 | 2018 | 2017 | |||||||||||||||||
| Domestic | $ | 20,044,363 | $ | 16,460,771 | $ | 13,086,806 | 21.8 | % | 25.8 | % | |||||||||||
| International | 16,635,463 | 10,809,192 | 10,026,388 | 53.9 | % | 7.8 | % | ||||||||||||||
| Total | $ | 36,679,826 | $ | 27,269,963 | $ | 23,113,194 | 34.5 | % | 18.0 | % | |||||||||||
Our international sales include a concentration in China, aggregating $6,969,258, $1,335,667, and $1,557,132 for the fiscal years ended June 30, 2018, 2017 and 2016, respectively. Fiscal 2018 international sales include $4,010,000 of license revenue.
Manufacturing and Supply
The Company largely manufactures and assembles its medical device products at its production facility located in Farmingdale, New York. The Company’s products include components manufactured by other companies in the United States. The Company is not dependent upon any single source of supply and has no long-term supply agreements. The Company believes that it will not encounter difficulty in obtaining materials, supplies and components adequate for its anticipated short-term needs.
Competition
Competition in the medical device products industry is rigorous with many companies having significant capital resources, large research laboratories and extensive distribution systems greater than the Company’s. Some of the Company’s major competitors are Medtronic, Anspach, Johnson & Johnson, Integra Life Sciences, Inc., Söering, Stryker Corporation and Smith and Nephew.
Regulatory Requirements
The Company’s medical device products are subject to the regulatory requirements of the U.S. Food and Drug Administration (“FDA”) and other international regulatory authorities. In the United States and other markets where the Company’s products are sold, the Company has the appropriate marketing authorizations and complies with all applicable regulations including, without limitation, 21 USC Chapter 6, 21 CFR Part 807, 93/42 EEC and Health Canada SOR/98-282. In the US, Misonix products have 510(k) clearances.
6
The Company also operates and maintains a Quality Management System which complies with the requirements of International Standards ISO 13485: 2012 + AC:2012, Health Canada CAN/CSA ISO 13485:2003, and US 21 CFR Part 820 Quality System Regulation. This system encompasses the principle of enhancing customer satisfaction through the effective application of the system, including processes for control, monitoring, and continual improvement in order to assure the Company consistently meets or exceeds customer expectations and applicable statutory/regulatory requirements.
The Company is not aware of any regulatory situations, other than those disclosed in Item 3 herein, that would materially impact the Company, nor is the Company aware of any pending legal action or new material breaches of the regulations to which it is subject.
Trademarks, Patents, and Copyrights
The Company holds 55 U.S. patents along with 14 in Europe, 9 in Japan and 15 in Canada, 2 in China and has multiple pending patent applications for its core product lines including ultrasonic and wound technologies, among other things. The Company believes that these patents provide it with a competitive market advantage. The Company also holds 13 trademarks protecting its Company and product names.
The Company will continue to seek patent, trademark, and copyright protections as it deems advisable to protect the markets for its products and its R&D efforts.
Backlog
As of June 30, 2018, the Company’s backlog (firm orders that have not yet been shipped) was $209,648 as compared to $397,660 as of June 30, 2017. The Company does not typically have large recurring orders, but instead ships most of its products on a just in time basis, which results in low levels of backlog.
Employees
As of June 30, 2018, the Company employed a total of 118 full-time employees. The Company considers its relationship with its employees to be good.
Website Access Disclosure
The Company’s Annual Reports on Form 10-K, Quarterly Reports on Form 10-Q and Current Reports on Form 8-K are available free of charge on the Company’s website at www.misonix.com as soon as reasonably practicable after such material is electronically filed with or furnished to the SEC. Copies of the Company’s Annual Report will be made available to shareholders, free of charge, upon written request.
In addition to the other information contained in this Annual Report on Form 10-K (the “10-K”) and the exhibits hereto, the following risk factors should be considered carefully in evaluating our business. Our business, financial condition and/or results of operations could be materially adversely affected by any of these risks. This section contains forward-looking statements. You should refer to the explanation of the qualifications and limitations on forward-looking statements set forth immediately prior to the beginning of Item 1 of the 10-K. Additional risks not presently known to us or that we currently deem immaterial may also adversely affect our business, financial condition and/or results of operations. The following list sets forth many, but not all, of the factors that could impact the Company’s ability to achieve results discussed in any forward-looking statement. Investors should understand that it is not possible to predict or identify all such factors and should not consider this list to be a complete statement of all potential risks and uncertainties.
7
Risks Related to Our Business
We are subject to extensive medical device regulation which may impede or hinder the approval process for our products and, in some cases, may not ultimately result in approval or may result in the recall or seizure of previously approved products.
Our products, development activities and manufacturing processes are subject to extensive and rigorous regulation in the United States by the FDA pursuant to the Federal Food, Drug, and Cosmetic Act (the “FDC Act”), by comparable agencies in foreign countries, and by other regulatory agencies and governing bodies. Under the FDC Act, medical devices must receive FDA clearance or approval before they can be commercially marketed in the U.S. In addition, most major markets for medical devices outside the U.S. require clearance, approval or compliance with certain standards before a product can be commercially marketed. The process of obtaining marketing approval or clearance from the FDA for new products, or with respect to enhancements or modifications to existing products, could:
| ● | take a significant amount of time; |
| ● | require the expenditure of substantial resources; |
| ● | involve rigorous pre-clinical and clinical testing; |
| ● | require changes to the products; and |
| ● | result in limitations on the proposed uses of the products. |
Marketing approvals or clearances are not the only risk. The FDA, and other regulatory bodies, also can require the withdrawal of an approved or cleared product from commercial distribution due to failure to comply with regulatory standards or the occurrence of unforeseen problems.
As a medical device manufacturer, we are required to register with the FDA and are subject to periodic inspection by the FDA for compliance with the FDA’s Quality System Regulation requirements, which require manufacturers of medical devices to adhere to certain regulations, including testing, quality control and documentation procedures. In addition, FDA regulations require us to provide information to the FDA whenever there is evidence that reasonably suggests that a medical device may have caused or contributed to a death or serious injury or, if a malfunction were to occur, could cause or contribute to a death or serious injury. Compliance with applicable regulatory requirements is subject to continual review and is rigorously monitored through periodic inspections by the FDA. In the European Union and China, we are required to maintain certain ISO certifications in order to sell our products and must undergo periodic inspections by notified bodies to obtain and maintain these certifications. Failure to meet regulatory quality standards could have a material adverse effect on our business, financial condition or results of operations.
Consequently, there can be no assurance that we will receive the required clearances from the FDA or other regulatory bodies for new products or modifications to existing products on a timely basis or that any FDA approval will not be subsequently withdrawn. Later discovery of previously unknown problems with a product or manufacturer could result in fines, delays or suspensions of regulatory clearances, seizures or recalls of products, operating restrictions and/or criminal prosecution. The failure to receive product approval clearance on a timely basis, suspensions of regulatory clearances, seizures or recalls of products or the withdrawal of product approval by the FDA or other regulatory bodies could have a material adverse effect on our business, financial condition or results of operations.
We may not be able to effectively protect our intellectual property rights.
Patents and other proprietary rights are and will be essential to our business and our ability to compete effectively with other companies. We also rely upon trade secrets, know-how, continuing technological innovations, strategic alliances and licensing opportunities to develop, maintain and strengthen our competitive position. We pursue a policy of generally obtaining patent protection in both the U.S. and abroad for patentable subject matter in our proprietary devices and also attempt to review third-party patents and patent applications to the extent publicly available to develop an effective patent strategy, avoid infringement of third-party patents, identify licensing opportunities and monitor the patent claims of others. We currently own numerous U.S. and foreign patents. We also are party to various license agreements pursuant to which patent rights have been obtained or granted in consideration for cash or royalty payments. No assurance can be made that any pending or future patent applications will result in issued patents, that any current or future patents issued to, or licensed by, us will not be challenged or circumvented by our competitors, or that our patents will not be found invalid.
8
We also operate in an industry that is susceptible to significant intellectual property litigation and it has been common for companies in the medical device field to aggressively challenge the patent rights of other companies in order to prevent the marketing of new devices. Intellectual property litigation is expensive, complex and lengthy and its outcome is difficult to predict. Future patent litigation may result in significant royalty or other payments or injunctions that can prevent the sale of products and may significantly divert the attention of our technical and management personnel.
In addition, we may have to take legal action in the future to protect our patents, trade secrets or know-how or to assert our intellectual property rights against claimed infringement by others. Any legal action of that type could be costly and time consuming to us and no assurances can be made that any lawsuit will be successful.
The invalidation of key patents or proprietary rights that we own, or an unsuccessful outcome in lawsuits to protect our intellectual property, could have a material adverse effect on our business, financial condition or results of operations. In the event that our right to market any of our products is successfully challenged, or if we fail to obtain a required license or are unable to design around a patent, our business, financial condition or results of operations could be materially adversely affected.
Future product liability claims and other litigation may adversely affect our business, reputation and ability to attract and retain customers.
The design, manufacture and marketing of medical device products of the types that we produce entail an inherent risk of product liability claims. A number of factors could result in an unsafe condition or injury to, or death of, a patient with respect to these or other products that we manufacture or sell, including component failures, manufacturing flaws, design defects or inadequate disclosure of product-related risks or product-related information. These factors could result in product liability claims, a recall of one or more of our products or a safety alert relating to one or more of our products. Product liability claims may be brought by individuals or by groups seeking to represent a class.
We have a recent history of net losses.
We have experienced losses from continuing operations during the last three fiscal years. The loss from continuing operations before income taxes was approximately $2.4 million for the 2018 fiscal year, and the accumulated deficit was approximately $15.5 million as of June 30, 2018. There can be no assurance that we will be able to return to operating profitability in the near-term or at all. As of June 30, 2018, we had a cash balance of approximately $11.0 million. Although we believe this amount is sufficient to finance our operations for at least the next 12 months, there can be no assurance that this will provide sufficient liquidity for longer-term operations or initiatives. Our cash flows may be impacted by a number of factors, including changing market conditions, market acceptance of our new and existing products, and the loss of one or more key customers. There can be no assurance that we will be successful in raising additional capital if the need arises. The failure to raise any necessary additional capital on acceptable terms, or at all, may have a material adverse effect on our future business and results of operations.
Anyone or any company can bring an action against Misonix, including private securities litigation and shareholder derivative suits, and adverse litigation results could affect our business.
Our judicial system allows anyone, including shareholders, to bring a claim against the Company and force the Company to defend itself even if the claim is baseless. The defense may or may not be covered by the Company’s insurance, the result of which could ultimately create a burden on the Company dependent upon the outcome.
9
Litigation can be lengthy, expensive and disruptive to our operations, and results cannot be predicted with certainty. An adverse decision could result in monetary damages or injunctive relief that could affect our financial condition or results of operations.
On April 5, 2017, the Company’s former distributor in China, Cicel (Beijing) Science & Technology Co., Ltd., filed a lawsuit against the Company and certain officers and directors of the Company in the United States District Court for the Eastern District of New York, alleging that the Company improperly terminated its contract with the former distributor. The complaint sought various remedies, including compensatory and punitive damages, specific performance and preliminary and post judgment injunctive relief, and asserted various causes of action, including breach of contract, unfair competition, tortious interference with contract, fraudulent inducement, and conversion. On October 7, 2017, the court granted the Company’s motion to dismiss all of the tort claims asserted against it, and also granted the individual defendants’ motion to dismiss all claims asserted against them. The only claim remaining in the case is for breach of contract against the Company. The Company believes it has various legal and factual defenses to the allegations in the complaint, and intends to vigorously defend the action. The case is at its earliest stages; discovery is just beginning and there is no trial date.
On June 6, 2017, Irving Feldbaum, an individual shareholder of Misonix, filed a lawsuit in the U.S. District Court for the Eastern District of New York. The complaint alleges claims against the Company’s board of directors, its former CEO and CFO, certain of its former directors, and the Company as a nominal defendant for alleged violations of Section 14(a) of the Securities Exchange Act of 1934 and state law claims for breach of fiduciary duty, waste of corporate assets, and unjust enrichment. The complaint alleges that the Company incurred damages as a result of alleged false and misleading statements in the Company’s securities filings concerning the Company’s business, operations, and prospects and the Company’s internal control over financial reporting. The complaint also alleges that the Company’s February 4, 2016 Proxy Statement contained false and misleading statements regarding executive compensation. The complaint seeks the recovery of damages on behalf of the Company and the implementation of changes to corporate governance procedures. On June 16, 2017, Michael Rubin, another individual shareholder of Misonix, filed a case alleging similar claims in the same district court. On July 21, 2017, the district court consolidated the two actions for all purposes. On July 16, 2018, the Company and counsel for Mr. Feldbaum and Mr. Rubin informed the District Court that the parties had reached a settlement in principle. There are aspects of the settlement that remain to be negotiated and documented, and the settlement is subject to approval by the District Court after notice to the Company’s shareholders.
Violation of anti-corruption laws could subject the Company to significant penalties which would materially affect our business and liquidity.
We are required to comply with the Foreign Corrupt Practices Act (“FCPA”) and similar anti-corruption laws in other jurisdictions around the world where we do business. Compliance with these laws has been subject to increasing focus and activity by regulatory authorities in recent years. Actions by our employees, or third-party intermediaries acting on our behalf, in violation of such laws, whether carried out in the United States or elsewhere in connection with the conduct of our business may expose us to liability for violations of the FCPA or other anti-corruption laws and accordingly may have a material adverse effect on our reputation and our business, financial condition or results of operations.
With the assistance of outside counsel, the Company conducted a voluntary investigation into the business practices of the independent Chinese entity that previously distributed its products in China and the Company’s knowledge of those business practices, which may have implications under the FCPA, as well as into various internal controls issues identified during the investigation.
On September 27, 2016 and September 28, 2016, the Company voluntarily contacted the SEC and the DOJ, respectively, to advise both agencies of these potential issues. The Company has provided and will continue to provide documents and other information to the SEC and the DOJ, and is cooperating fully with these agencies in their ongoing investigations of these matters.
Although the Company’s investigation is complete, additional issues or facts could arise which may expand the scope or severity of the potential violations. The Company has no current information derived from the investigation or otherwise to suggest that its previously reported financial statements and results are incorrect.
10
At this stage, the Company is unable to predict what, if any, action the DOJ or the SEC may take or what, if any, penalties or remedial measures these agencies may seek. Nor can the Company predict the impact on the Company as a result of these matters, which may include the imposition of fines, civil and criminal penalties, which are not currently estimable, as well as equitable remedies, including disgorgement of any profits earned from improper conduct and injunctive relief, limitations on the Company’s conduct, and the imposition of a compliance monitor. The DOJ and the SEC periodically have based the amount of a penalty or disgorgement in connection with an FCPA action, at least in part, on the amount of profits that a company obtained from the business in which the violations of the FCPA occurred. During its distributorship relationship with the prior Chinese distributor from 2010 through 2016, the Company generated revenues of approximately $8 million.
Further, the Company may suffer other civil penalties or adverse impacts, including lawsuits by private litigants in addition to the lawsuits that already have been filed, or investigations and fines imposed by local authorities. The investigative costs to date are approximately $3.0 million, of which approximately $0.5 million, $2.4 million and $0.1 million was charged to general and administrative expenses during the years ended June 30, 2018, 2017 and 2016 respectively.
Our future growth is dependent upon the development of new products and line extensions, which requires significant research and development, clinical trials and regulatory approvals, all of which are very expensive and time-consuming and may not result in a commercially viable product.
In order to develop new products and improve current product offerings, we focus our research and development programs largely on the development of next-generation and novel technology offerings across multiple programs and opportunities.
As a part of the regulatory process of obtaining marketing clearance from the FDA for new products, we conduct and participate in numerous clinical trials with a variety of study designs, patient populations and trial endpoints. Unfavorable or inconsistent clinical data from existing or future clinical trials conducted by us, by our competitors or by third parties, or the market’s perception of this clinical data, may adversely impact our ability to obtain product approvals from the FDA, our position in, and share of, the markets in which we participate and our business, financial condition, results of operations or future prospects.
New products may not be accepted by customers in the marketplace.
We are now, and will continue to be, developing new products and introducing them into the market. There can be no assurance that any new product will be accepted by the market. New products are sometimes introduced into the market in a prototype format and may need later revisions or design changes before they operate in a manner to be accepted in the market. As a result of the introduction of new products, there is some risk that revenue expectations may not be met and in some cases the product may not achieve market acceptance.
We face intense competition and may not be able to keep pace with the rapid technological changes in the medical device industry.
The medical device product market is highly competitive. We encounter significant competition across our product lines and in each market in which our products are sold from various medical device companies, most of which have greater financial and marketing resources than we do.
Additionally, the medical device product market is characterized by extensive research and development and rapid technological change. Developments by other companies of new or improved products, processes or technology may make our products or proposed products obsolete or less competitive and may negatively impact our revenues. In some cases foreign companies may attempt to copy our designs illegally. We are required to devote continued efforts and financial resources to develop or acquire scientifically advanced technologies and products, apply our technologies cost-effectively across product lines and markets, attract and retain skilled development personnel, obtain patent and other protection for our technology and products, obtain required regulatory and reimbursement approvals and successfully manufacture and market our products. Failure to develop new products or enhance existing products could have a material adverse effect on our business, financial condition or results of operations.
11
Consolidation in the healthcare industry could lead to demands for price concessions or the exclusion of the Company as supplier from certain of our significant market segments.
The cost of healthcare has risen significantly over the past decade and numerous initiatives and reforms initiated by legislators, regulators and third-party payers to curb these costs have resulted in a consolidation trend in the healthcare industry, including hospitals. This in turn has resulted in greater pricing pressures and the exclusion of certain suppliers from important market segments as group purchasing organizations, independent delivery networks and large single accounts continue to consolidate purchasing decisions for some of our hospital customers. We expect that market demand, government regulation, third-party reimbursement policies and societal pressures will continue to change the worldwide healthcare industry, resulting in further business consolidations and alliances among our customers and competitors, which may reduce competition, exert further downward pressure on the prices of our products and may adversely impact our business, financial condition or results of operations.
We may experience disruption in supply due to our dependence on our suppliers to continue to ship product requirements and our inability to obtain suppliers of certain components for our products.
Our suppliers may encounter problems during manufacturing due to a variety of reasons, including poor business practices, failure to follow specific protocols and procedures, failure to comply with applicable regulations, equipment malfunctions, labor shortages or environmental factors. In addition, we purchase both raw materials used in our products and finished goods from various suppliers and may have to rely on a single source supplier for certain components of our products where there are no alternatives are available. Although we anticipate that we have adequate sources of supply and/or inventory of these components to handle our production needs for the foreseeable future, if we are unable to secure on a timely basis sufficient quantities of the materials we depend on to manufacture our products, if we encounter delays or contractual or other difficulties in our relationships with these suppliers, or if we cannot find suppliers at an acceptable cost, then the manufacture of our products may be disrupted, which could increase our costs and have a material adverse effect on our business.
If we fail to manage any expansion or acquisition, our business could be impaired.
We may in the future acquire one or more technologies, products or companies that complement our business. We may not be able to effectively integrate these into our business and any such acquisition could bring additional risks, exposures and challenges to the Company. In addition, acquisitions may dilute our earnings per share, disrupt our ongoing business, distract our management and employees, increase our expenses, subject us to liabilities and increase our risk of litigation, all of which could harm our business. If we use cash to acquire technologies, products, or companies, such use may divert resources otherwise available for other purposes. If we use our common stock to acquire technologies, products, or companies, our shareholders may experience substantial dilution. If we fail to manage any expansions or acquisition, our business could be impaired.
Our agreements and contracts entered into with partners and other third parties may not be successful.
We signed in the past and may pursue in the future agreements and contracts with third parties to assist in our marketing, manufacturing, selling and distribution efforts. We cannot assure you that any agreements or contracts entered into will be successful.
The fluctuation of our quarterly results may adversely affect the trading price of our common stock.
Our revenues and results of operations have in the past and will likely vary in the future from quarter to quarter due to a number of factors, many of which are outside of our control and any of which may cause our stock price to fluctuate. You should not rely on quarter-to-quarter comparisons of our results of operations as an indication of our future performance. It is likely that in some future quarters, our results of operations may be below the expectations of the Company’s public market analysts and investors. In this event, the price of our common stock may fall.
12
We may not be able to attract and retain additional key management, sales and marketing and technical personnel, or we may lose existing key management, sales and marketing or technical personnel, which may delay our development and marketing efforts.
We depend on a number of key management, sales and marketing and technical personnel. The loss of the services of one or more key employees could delay the achievement of our development and marketing objectives. Our success will also depend on our ability to attract and retain additional highly qualified management, sales and marketing and technical personnel to meet our growth goals. We face intense competition for qualified personnel, many of whom are often subject to competing employment offers, and we do not know whether we will be able to attract and retain such personnel.
Future changes in financial accounting standards or practices or existing taxation rules or practices may cause adverse or unexpected revenue fluctuations and affect our reported results of operations.
A change in accounting standards or practices or a change in existing taxation rules or practices can have a significant effect on our reported results and may even affect our reporting of transactions completed before the change is effective. New accounting pronouncements and taxation rules and varying interpretations of accounting pronouncements and taxation practice have occurred and may occur in the future. Changes to existing rules or the questioning of current practices may adversely affect our reported financial results or the way we conduct our business.
The Affordable Healthcare for America Act includes provisions that may adversely affect our business and results of operations, including an excise tax on the sales of most medical devices.
On March 21, 2010, the House of Representatives passed the Affordable Health Care for America Act, which President Obama signed into law on March 23, 2010. With a new administration in place, changes may be made to the Affordable Health Care Act, or it may be repealed and replaced. The potential impact of these events may adversely affect our business and results of operations. The medical device tax has been established, however through an act of Congress, the excise tax was suspended from January 1, 2016 to December 31, 2017. On January 22, 2018, Congress passed another suspension of the tax from January 1, 2018 through December 31, 2020.
We are experiencing greater scrutiny and regulation by governmental authorities, which may lead to greater regulation in the future.
Our medical devices and our business activities are subject to rigorous regulation, including by the FDA, the DOJ and numerous other federal, state and foreign governmental authorities including the imposition of international trade sanctions and tariffs. Certain state governments and the federal government have enacted legislation aimed at increasing transparency of our interactions with health care providers. Any failure to comply with these legal and regulatory requirements could impact our business.
Risk of reprocessing disposables.
In some jurisdictions around the world, culture and practice encourages reuse of disposable products when the product is clearly labeled for single use. Such reuse may expose us to liability in these jurisdictions.
Item 1B. Unresolved Staff Comments.
None.
The Company occupies approximately 34,400 square feet at 1938 New Highway, Farmingdale, New York pursuant to a lease expiring on September 30, 2019. The Company pays rent of approximately $28,000 a month, which includes a pro rata share of real estate taxes, water, sewer and other charges which are assessed on the leased premises or the land upon which the leased premises are situated. The Company believes that the leased facilities are adequate for its present needs.
13
Former Chinese Distributor - FCPA
With the assistance of outside counsel, the Company conducted a voluntary investigation into the business practices of the independent Chinese entity that previously distributed its products in China and the Company’s knowledge of those business practices, which may have implications under the FCPA, as well as into various internal controls issues identified during the investigation (the “Investigation”).
On September 27, 2016 and September 28, 2016, the Company voluntarily contacted the SEC and the DOJ, respectively, to advise both agencies of these potential issues. The Company has provided and will continue to provide documents and other information to the SEC and the DOJ, and is cooperating fully with these agencies in their ongoing investigations of these matters.
Although the Company’s investigation is complete, additional issues or facts could arise which may expand the scope or severity of the potential violations. The Company has no current information derived from the investigation or otherwise to suggest that its previously reported financial statements and results are incorrect.
At this stage, the Company is unable to predict what, if any, action the DOJ or the SEC may take or what, if any, penalties or remedial measures these agencies may seek. Nor can the Company predict the impact on the Company as a result of these matters, which may include the imposition of fines, civil and criminal penalties, which are not currently estimable, as well as equitable remedies, including disgorgement of any profits earned from improper conduct and injunctive relief, limitations on the Company’s conduct, and the imposition of a compliance monitor. The DOJ and the SEC periodically have based the amount of a penalty or disgorgement in connection with an FCPA action, at least in part, on the amount of profits that a company obtained from the business in which the violations of the FCPA occurred. During its distributorship relationship with the prior Chinese distributor from 2010 through 2016, the Company generated revenues of approximately $8 million.
Further, the Company may suffer other civil penalties or adverse impacts, including lawsuits by private litigants in addition to the lawsuits that already have been filed, or investigations and fines imposed by local authorities. The investigative costs to date are approximately $3.0 million, of which approximately $0.5 million, $2.4 million and $0.1 million was charged to general and administrative expenses during the years ended June 30, 2018, 2017 and 2016 respectively.
Former Chinese Distributor – Litigation
On April 5, 2017, the Company’s former distributor in China, Cicel (Beijing) Science & Technology Co., Ltd., filed a lawsuit against the Company and certain officers and directors of the Company in the United States District Court for the Eastern District of New York, alleging that the Company improperly terminated its contract with the former distributor. The complaint sought various remedies, including compensatory and punitive damages, specific performance and preliminary and post judgment injunctive relief, and asserted various causes of action, including breach of contract, unfair competition, tortious interference with contract, fraudulent inducement, and conversion. On October 7, 2017, the court granted the Company’s motion to dismiss all of the tort claims asserted against it, and also granted the individual defendants’ motion to dismiss all claims asserted against them. The only claim remaining in the case is for breach of contract against the Company. The Company believes it has various legal and factual defenses to the allegations in the complaint, and intends to vigorously defend the action. The case is at its earliest stages; discovery is just beginning and there is no trial date.
Stockholder Derivative Litigation
On June 6, 2017, Irving Feldbaum, an individual shareholder of Misonix, filed a lawsuit in the U.S. District Court for the Eastern District of New York. The complaint alleges claims against the Company’s board of directors, its former CEO and CFO, certain of its former directors, and the Company as a nominal defendant for alleged violations of Section 14(a) of the Securities Exchange Act of 1934 and state law claims for breach of fiduciary duty, waste of corporate assets, and unjust enrichment. The complaint alleges that the Company incurred damages as a result of alleged false and misleading statements in the Company’s securities filings concerning the Company’s business, operations, and prospects and the Company’s internal control over financial reporting. The complaint also alleges that the Company’s February 4, 2016 Proxy Statement contained false and misleading statements regarding executive compensation. The complaint seeks the recovery of damages on behalf of the Company and the implementation of changes to corporate governance procedures. On June 16, 2017, Michael Rubin, another individual shareholder of Misonix, filed a case alleging similar claims in the same district court. On July 21, 2017, the district court consolidated the two actions for all purposes. On July 16, 2018, the Company and counsel for Mr. Feldbaum and Mr. Rubin informed the District Court that the parties had reached a settlement in principle. There are aspects of the settlement that remain to be negotiated and documented, and the settlement is subject to approval by the District Court after notice to the Company’s shareholders.
14
Item 4. Mine Safety Disclosures.
Not applicable.
Item 5. Market for Registrant’s Common Equity, Related Stockholder Matters and Issuer Purchases of Equity Securities.
The Company’s common stock, $.01 par value (“Common Stock”), is listed on the Nasdaq Global Market under the symbol “MSON”.
The following table sets forth the high and low sales prices for the Common Stock during the periods indicated as reported by the Nasdaq Global Market:
| High | Low | |||||||
| Fiscal 2018: | ||||||||
| First Quarter | $ | 10.90 | $ | 7.05 | ||||
| Second Quarter | 11.00 | 9.06 | ||||||
| Third Quarter | 10.70 | 8.25 | ||||||
| Fourth Quarter | 13.50 | 9.55 | ||||||
| High | Low | |||||||
| Fiscal 2017: | ||||||||
| First Quarter | $ | 7.15 | $ | 4.95 | ||||
| Second Quarter | 11.20 | 4.85 | ||||||
| Third Quarter | 12.00 | 9.05 | ||||||
| Fourth Quarter | 11.80 | 9.35 | ||||||
As of June 30, 2018, the Company had 9,430,466 shares of Common Stock outstanding and 54 shareholders of record. This amount does not take into account shareholders whose shares are held in “street name” by brokerage houses or other intermediaries.
The Company has not paid any cash dividends since its inception. The Company does not intend to pay any cash dividends in the foreseeable future, but intends to retain all earnings, if any, for use in its business operations.
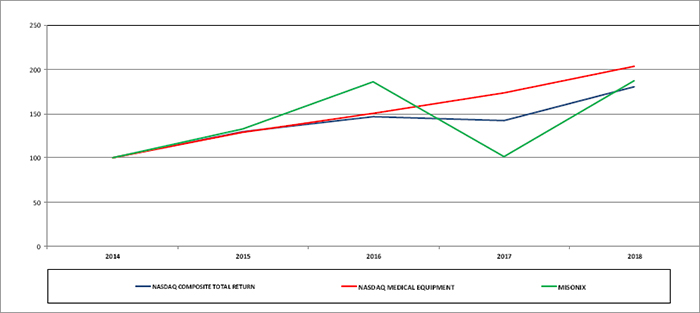
Share Performance Graph
The following graph compares the cumulative total return on the Company’s Common Stock during the last five fiscal years with the NASDAQ Composite Total Return Index and the NASDAQ Medical Equipment Index during the same period. The graph shows the value, at the end of each of the last five fiscal years, of $100 invested in the Common Stock or the indices on June 30, 2013. The graph depicts the change in value of the Company’s Common Stock relative to the noted indices as of the end of each fiscal year and not for any interim period. Historical stock price performance is not necessarily indicative of future stock price performance.
15
| 2014 | 2015 | 2016 | 2017 | 2018 | |||||||||||
| MISONIX, INC. | 100 | 133 | 186 | 101 | 187 | ||||||||||
| NASDAQ Composite Total Return | 100 | 130 | 147 | 142 | 180 | ||||||||||
| NASDAQ Medical Equipment Index | 100 | 129 | 150 | 173 | 204 |
Item 6. Selected Financial Data.
The following selected consolidated financial data should be read in conjunction with Item 7 “Management’s Discussion
and Analysis of Financial Condition and Results of Operations” and our consolidated financial statements and the related
notes appearing in Item 8 “Financial Statements and Supplementary Data” of this 10-K.
The consolidated statements of income data for the years ended June 30, 2018, 2017 and 2016 and the consolidated balance sheet data as of June 30, 2018 and 2017 are derived from our audited consolidated financial statements appearing in Item 8 of this 10-K. The consolidated statements of income data for the years ended June 30, 2015 and 2014 and the consolidated balance sheet data as of June 30, 2016, 2015 and 2014 are derived from our audited consolidated financial statements that are not included in the 10-K. The historical results are not necessarily indicative of the results to be expected in any future period.
16
Selected income statement data:
| For the Year Ended June 30, | ||||||||||||||||||||
| 2018 | 2017 | 2016 | 2015 | 2014 | ||||||||||||||||
| Total revenue | $ | 36,679,826 | $ | 27,269,963 | $ | 23,113,194 | $ | 22,204,578 | $ | 17,060,435 | ||||||||||
| Net (loss)/income from continuing operations | (7,803,552 | ) | (1,842,804 | ) | (1,329,077 | ) | 5,304,056 | 1,126,580 | ||||||||||||
| Net (loss)/income per share from continuing operations - Basic | $ | (0.87 | ) | $ | (0.22 | ) | $ | (0.17 | ) | $ | 0.70 | $ | 0.15 | |||||||
| Net (loss)/income per share from continuing operations - Diluted | $ | (0.87 | ) | $ | (0.22 | ) | $ | (0.17 | ) | $ | 0.66 | $ | 0.15 | |||||||
| Selected balance sheet data: | ||||||||||||||||||||
| June 30, | ||||||||||||||||||||
| 2018 | 2017 | 2016 | 2015 | 2014 | ||||||||||||||||
| Total assets | $ | 29,020,751 | $ | 33,369,649 | $ | 27,732,731 | $ | 26,454,248 | $ | 19,527,869 | ||||||||||
| Total long term liabilities | $ | 13,303 | $ | 13,087 | $ | 31,685 | $ | 20,395 | $ | 67,932 | ||||||||||
| Total shareholders’ equity | $ | 24,401,178 | $ | 28,139,842 | $ | 24,401,290 | $ | 23,754,345 | $ | 16,352,364 | ||||||||||
Item 7. Management’s Discussion and Analysis of Financial Condition and Results of Operations.
Misonix designs, manufactures and markets therapeutic ultrasonic devices. These products are used for precise bone sculpting, removal of soft and hard tumors, and tissue debridement, orthopedic surgery, plastic surgery, and wound and burn care. In the United States, the Company sells its products through a hybrid sales approach which includes direct sales representatives, managed by regional sales managers, along with independent distributors. Outside of the United States, the Company generally sells to distributors who then resell the product to hospitals. The Company operates as one business segment.
In the United States, the Company is taking a more aggressive approach to taking market share, expanding the market and increasing its share of recurring disposable revenue by using a consignment model, whereby the Company will consign the equipment (which is defined as a generator, hand units and accessories) (the “Equipment”) and sell to customers higher margin disposable single use items (the “Consumables”) on a recurring basis. Title remains with the Company with respect to consigned Equipment, which is depreciated and charged to selling expenses over a five year period beginning in fiscal 2017, and a three year period in fiscal 2016. Outside of the United States, the Company has principally not yet adopted a consignment model. The Company’s overall goal is to increase the utilization rate of Equipment which will increase the total number of procedures and maximize the sale of Consumables to our customers, with the goal of becoming the standard of care in the various segments we focus on.
Results of Operations
The following discussion and analysis provides information which the Company’s management believes is relevant to an assessment and understanding of the Company’s results of operations and financial condition. This discussion should be read in conjunction with the consolidated financial statements and notes thereto appearing elsewhere herein. Unless otherwise specified, this discussion relates solely to the Company’s continuing operations.
All of the Company’s sales have been derived from the sale of medical device products, which include manufacture and distribution of ultrasonic medical device products.
17
Fiscal years ended June 30, 2018, 2017 and 2016
Our revenues by category for the three years ended June 30, 2018 are as follows:
| Net Change % | ||||||||||||||||||||
| For the Year Ended June 30, | Year Ended June 30, | |||||||||||||||||||
| 2018 | 2017 | 2016 | 2018 | 2017 | ||||||||||||||||
| Total | ||||||||||||||||||||
| Consumables | $ | 23,596,476 | $ | 20,328,676 | $ | 16,091,651 | 16.1 | % | 26.3 | % | ||||||||||
| Equipment | 9,073,350 | 6,941,287 | 7,021,543 | 30.7 | % | -1.1 | % | |||||||||||||
| License | 4,010,000 | — | — | 100.0 | % | 0.0 | % | |||||||||||||
| Total | $ | 36,679,826 | $ | 27,269,963 | $ | 23,113,194 | 34.5 | % | 18.0 | % | ||||||||||
| Domestic: | ||||||||||||||||||||
| Consumables | $ | 17,735,749 | $ | 14,866,772 | $ | 11,277,449 | 19.3 | % | 31.8 | % | ||||||||||
| Equipment | 2,308,614 | 1,593,999 | 1,809,357 | 44.8 | % | -11.9 | % | |||||||||||||
| Total | $ | 20,044,363 | $ | 16,460,771 | $ | 13,086,806 | 21.8 | % | 25.8 | % | ||||||||||
| International: | ||||||||||||||||||||
| Consumables | $ | 5,860,727 | $ | 5,461,904 | $ | 4,814,202 | 7.3 | % | 13.5 | % | ||||||||||
| Equipment | 6,764,736 | 5,347,288 | 5,212,186 | 26.5 | % | 2.6 | % | |||||||||||||
| Total | $ | 12,625,463 | $ | 10,809,192 | $ | 10,026,388 | 16.8 | % | 7.8 | % | ||||||||||
| License | $ | 4,010,000 | $ | — | $ | — | 100 | % | — | |||||||||||
Fiscal years ended June 30, 2018 and 2017
Net revenue
Revenues increased 34.5% or $9.4 million to $36.7 million in fiscal 2018 from $27.3 million in fiscal 2017 principally due to strong demand for the Company’s products domestically and internationally, and the inclusion of $4.0 million of license revenue relating to the licensing of one of the Company’s products in China.
Product revenue increased 19.8% or $5.4 million to $32.7 million in fiscal 2018, from $27.3 million in fiscal 2017. US product revenue grew 21.8% and international product revenue grew 16.8% for fiscal 2018. Consumables revenue in the United States increased 19.3%, or $2.9 million for the current year, principally due to the strength in the Company’s BoneScalpel product line. International consumables revenue grew 7.3% for the current year.
License revenue was $4.0 million for fiscal 2018, resulting from the Company’s license of SonaStar technology to one of its Chinese distributors. There was no license revenue in fiscal 2017.
Gross profit
The gross profit percentage on product sales was 70.0% in fiscal 2018, compared with 69.9% in fiscal 2017. Including the impact of license revenue in fiscal 2018, which has a 100% gross profit margin, the total gross profit margin for the year was 72.3%.
Selling expenses
Selling expenses increased by $2.2 million, or 15.1% to $16.4 million in fiscal 2018 from $14.2 million in fiscal 2017. The expense increase is related to increased salaries and related costs for the Company’s expanded direct sales force of approximately $1.4 million, higher commission expense of approximately $0.25 million, and increased marketing related expenses of approximately $0.4 million.
18
General and administrative expenses
General and administrative expenses decreased $0.5 million to $9.1 million in fiscal 2018 from $9.6 million in fiscal 2017. The decrease resulted principally from lower professional fees of approximately $2.3 million, reflecting lower professional fees relating to the Investigation. This decrease in expenses was partially offset by an increase in non-cash stock compensation expense of $1.4 million, relating principally to a full year of expense relating to the restricted stock awards granted to the Company’s CEO in December 2016.
Research and development expenses
Research and development expenses increased by $2.6 million, or 139.1% to $4.4 million in fiscal 2018 from $1.8 million in the prior year period. The Company is investing in the design and development of its next generation product, which is expected to be available in fiscal 2019. For fiscal 2018, approximately $2.3 million has been charged to research and development expenses related to this product.
Other income
Other income decreased $3.1 million to $0.6 million in fiscal 2018 from $3.7 million in fiscal 2017. The decrease is related to lower royalty income from MMIT. This royalty agreement expired in August 2017.
Income taxes
For fiscal 2018, the Company recorded an income tax expense of $5.4 million, compared with an income tax benefit of $1.0 million in fiscal 2017.
The income tax expense for fiscal 2018 included a one-time charge of $1.8 million to revalue the Company’s deferred tax asset as of December 31, 2017 to give effect to the reduction in federal corporate tax rate to 21% effective January 1, 2018, as a result of the new tax legislation, enacted on December 22, 2017. Income tax expense also includes a $4.1 million charge to record a full valuation allowance against the Company’s remaining deferred tax assets. In accordance with the guidance of ASC Topic 740, management concluded that in its judgment, the Company’s deferred tax assets at June 30, 2018 are not more likely-than-not realizable. The components of the tax provision are as follows:
| For the years ended June 30, | ||||||||
| 2018 | 2017 | |||||||
| Income tax benefit | $ | (443,746 | ) | $ | (1,022,808 | ) | ||
| Provisional reduction of deferred tax asset relating to Tax Legislation | 1,764,039 | — | ||||||
| Valuation allowance on deferred tax asset | 4,096,353 | — | ||||||
| Net income tax expense (benefit) | $ | 5,416,646 | $ | (1,022,808 | ) | |||
Fiscal years ended June 30, 2017 and 2016
Net revenue
Net sales increased $4,156,769, or 17.98%, to $27,269,963 in fiscal 2017 from $23,113,194 in fiscal 2016 in part due to stronger demand for the Company’s products domestically offset by weaker international Equipment sales. Consumables revenue increased by 26.3% to $20,328,676 for the year ended June 30, 2017 compared with $16,091,651 in the prior year. Equipment sales declined by 1.1% to $6,941,287 compared with $7,021,543 in the prior year. The decline resulted from weaker international sales, principally in China, where the Company ceased shipments in the fourth quarter of fiscal 2016.
Gross profit
Gross profit was 69.9% in fiscal 2017, an increase of 2.8% from 67.1% in fiscal 2016. The increase resulted from a stronger mix of Consumables revenue which carries a higher gross profit margin than Equipment revenue.
19
Selling expenses
Selling expenses increased by $1,587,946, or 15.7% to $14,220,907 in fiscal 2017 from $12,632,961 in fiscal 2016. The expense increase is related to increased commissions of approximately $1.4 million on higher sales of $4.2 million.
General and administrative expenses
General and administrative expenses increased $2,765,690 to $9,565,206 in fiscal 2017 from $6,829,516 in fiscal 2016. The increase resulted principally from increased professional fees of approximately $2.4 million relating to the Investigation, and an additional $442,000 of other professional fees. The Company also paid severance for its former CEO during the fiscal 2017 of approximately $335,000. This increase in expenses was partially offset by a reduction in non-cash stock compensation expense of $805,000, which includes a reversal of stock compensation previously recognized with respect to the Company’s prior CEO relating to unvested stock options which were terminated. The Company also recognized $484,000 of non-cash compensation expense relating to the restricted stock awards granted to the Company’s new CEO in December 2016.
Research and development expenses
Research and development expenses were $1,837,497 for fiscal 2017, approximately the same as fiscal 2016 expenses of $1,839,479.
Other income
Other income decreased $191,486 to $3,735,474 in fiscal 2017 from $3,926,960 in fiscal 2016. The decrease is related to lower royalty income from MMIT. This royalty agreement expired in August 2017.
Income taxes
In fiscal 2017 the income tax benefit for continuing operations had an effective tax rate of 35.7% as compared to an effective rate of 30.1% in fiscal 2016. Prior to June 30, 2014 and through March 31, 2015, the Company had a full valuation allowance recorded against deferred tax assets. The primary factors affecting the fiscal 2017 effective tax rate were non-deductible expenses, stock compensation, tax credits and state income taxes. The primary factors affecting the fiscal 2016 effective tax rate were non-deductible expenses, deferred tax adjustments and state income taxes.
Discontinued operations
The following represents the results of the high intensity focused ultrasound technology sold to SonaCare Medical, LLC in May 2010, which is included in discontinued operations:
| For the years ended June 30, | ||||||||||||
| 2018 | 2017 | 2016 | ||||||||||
| Revenues | $ | — | $ | — | $ | — | ||||||
| Gain on sale of discontinued operations | 250,000 | 250,000 | 250,000 | |||||||||
| Income tax expense | (58,883 | ) | (88,375 | ) | (93,069 | ) | ||||||
| Net income from discontinued operations, net of tax | $ | 191,117 | $ | 161,625 | $ | 156,931 | ||||||
Liquidity and Capital Resources
Working capital at June 30, 2018 was $17.3 million. For fiscal 2018, cash used in operations was $0.6 million, mainly due to the Company’s net loss of $7.6 million and an increase in inventory of $1.4 million, offset by $8.4 million of non-cash expenses.
Cash used in investing activities was $0.3 million, primarily consisting of the purchase of property, plant and equipment along with filing for additional patents, offset by income from discontinued operations.
20
Cash provided by financing activities was $0.3 million for fiscal 2018, resulting from the exercise of stock options.
As of June 30, 2018, the Company had a cash balance of approximately $11.0 and believes it has sufficient cash to finance operations for at least the next 12 months following the issuance date of the financial statements included herein.
Relating to the internal investigation described herein, the Company has incurred approximately $3.0 million in investigative costs and is expected to incur additional costs until the matter is fully resolved. Further, the Company could be subject to fines or penalties related to potential violations of the FCPA.
The Company has been receiving an annual royalty from MMIT which has averaged $3.9 million per year during fiscal 2017 and fiscal 2016. This royalty ended in August 2017.
Commitments
The Company has commitments under operating leases that will be funded from operating sources. At June 30, 2018, the Company’s contractual cash obligations and commitments relating to operating leases and other purchase commitments are as follows:
| Commitment | Less than 1 year | 1-3 years | 4-5 years | After 5 years | Total | |||||||||||||||
| Operating leases | $ | 359,353 | $ | 127,812 | $ | — | $ | — | $ | 487,165 | ||||||||||
| Purchase commitments | 3,841,621 | — | — | — | 3,841,621 | |||||||||||||||
| $ | 4,200,974 | $ | 127,812 | $ | — | $ | — | $ | 4,328,786 | |||||||||||
Off-Balance Sheet Arrangements
The Company has no off-balance sheet arrangements that have or are reasonably likely to have a current or future effect on the Company’s financial condition, changes in financial condition, revenues or expenses, results of operations, liquidity, capital expenditures or capital resources that are material to the Company.
Other
In the opinion of management, inflation has not had a material effect on the operations of the Company.
Critical Accounting Policies and Use of Estimates
Our discussion and analysis of financial condition and results of operations is based upon our consolidated financial statements, which have been prepared in accordance with accounting principles generally accepted in the United States of America. The preparation of these financial statements requires us to make estimates and assumptions that affect the reported amounts of assets and liabilities, the disclosure of contingent liabilities, and the reported amounts of revenues and expenses. Significant estimates affecting amounts reported or disclosed in the consolidated financial statements include net realizable value of inventories, valuation of intangible assets including amortization periods for acquired intangible assets, estimates of projected cash flows and discount rates used to value intangible assets and test goodwill and intangible assets for impairment, computation of valuation allowances recorded against deferred tax assets, and valuation of stock-based compensation. These estimates are based on historical experience and on various other assumptions that are believed to be reasonable under the current circumstances. Actual results could differ from these estimates.
We believe that the following accounting policies, which form the basis for developing these estimates, are those that are most critical to the presentation of our consolidated financial statements and require the more difficult subjective and complex judgments.
21
Revenue Recognition
The Company records revenue upon shipment for products shipped F.O.B. shipping point. Products shipped F.O.B. destination points are recorded as revenue when received at the point of destination. Shipments under agreements with distributors are not subject to return, and payment for these shipments is not contingent on sales by the distributor. Accordingly, the Company recognizes revenue on shipments to distributors in the same manner as with other customers. Service contracts and royalty income are recognized when earned. The Company generally warrantees its product for a 12 month period, and accordingly records a related warranty reserve. Historical warranty costs have not been significant.
The Company presents taxes collected from customers and remitted to governmental authorities in the consolidated statements of operations on a net basis.
License revenue is recorded when 1) a contract has been executed, 2) the underlying intellectual property has been transferred, 3) the payment terms are identified and 4) the risk of a reversal of revenue from lack of receipt of consideration or other factors has passed. License revenue for the years ended June 30, 2018, 2017 and 2016 was $4,010,000, $0 and $0, respectively.
Inventories
Inventories, consisting of purchased materials, direct labor and manufacturing overhead, are stated at the lower of cost (determined by the first-in, first-out method) or net realizable value. At each balance sheet date, we evaluate ending inventories for excess quantities and obsolescence. Our evaluation includes an analysis of historical sales levels by product, projections of future demand by product, the risk of technological or competitive obsolescence for our products, general market conditions, and the feasibility of reworking or using excess or obsolete products or components in the production or assembly of other products that are not obsolete or for which we do not have excess quantities in inventory. To the extent that we determine there are excess or obsolete quantities or quantities on hand, we adjust their carrying value to estimated net realizable value. If future demand or market conditions are lower than our projections, or if we are unable to rework excess or obsolete quantities into other products, we may record further adjustments to the carrying value of inventory through a charge to cost of product revenues in the period the revision is made.
Goodwill
The excess of the cost over the fair value of net assets of acquired businesses is recorded as goodwill. Goodwill is not subject to amortization, but is reviewed for impairment at the reporting unit level annually, or more frequently if impairment indicators arise. Our assessment of the recoverability of goodwill is based upon a comparison of the carrying value of goodwill with its estimated fair value and the value of the Company at the measurement date.
Application of these impairment tests requires significant judgments, including estimation of cash flows, which is dependent on internal forecasts, estimation of the long term rate of growth for our business, the useful lives over which cash flows will occur and determination of our weighted average cost of capital. The Company’s market capitalization exceeds the value of the goodwill. Accordingly, the Company concluded that there was no impairment to goodwill at June 30, 2018 and June 30, 2017.
Income Taxes
The Company assesses whether a valuation allowance should be established against its deferred tax assets based on consideration of all available evidence, both positive and negative, using a more likely than not standard. This assessment considers, among other matters, the nature, frequency and severity of recent losses; a forecast of future profitability; the duration of statutory carryback and carryforward periods; the Company’s experience with tax attributes expiring unused; and tax planning alternatives. The likelihood that the deferred tax asset balance will be recovered from future taxable income is assessed at least quarterly, and the valuation allowance, if any, is adjusted accordingly.
Loss Contingencies
We are subject to claims and lawsuits in the ordinary course of our business, including claims by employees or former employees, with respect to our products and involving commercial disputes, or shareholder actions. We accrue for loss contingencies when it is deemed probable that a loss has been incurred and that loss is estimable. The amounts accrued are based on the full amount of the estimated loss before considering insurance proceeds, if applicable, and do not include an estimate for legal fees expected to be incurred in connection with the loss contingency. Our financial statements do not reflect any material amounts related to possible unfavorable outcomes of claims and lawsuits to which we are currently a party because we currently believe that such claims and lawsuits are not expected, individually or in the aggregate, to result in a material adverse effect on our financial condition. However, it is possible that these contingencies could materially affect our results of operations, financial position and cash flows in a particular period if we change our assessment of the likely outcome of these matters. Relating to the FCPA matter described in Part I — Item 3 above, the Company has incurred approximately $3.0 million in investigative costs, of which approximately $0.5 million was charged to general and administrative expenses during the fiscal year ended June 30, 2018, and is expected to incur additional costs until the matter is fully resolved. Further, the Company could be subject to fines or penalties related to potential violations of the FCPA.
Stock-Based Compensation
We recognize compensation expense associated with the issuance of equity instruments to employees for their services. Based on the type of equity instrument, the fair value is estimated on the date of grant using the Black-Scholes option valuation model, and is being expensed in the financial statements over the service period and is recorded in general and administrative expenses. The input assumptions used in determining fair value are the expected life, expected volatility, risk-free rate and expected dividend yield.
22
On December 15, 2016, we issued 400,000 shares of restricted stock to our Chief Executive Officer. These awards vest over a period of up to five years, subject to meeting certain service, performance and market conditions. We valued these awards using a Monte Carlo valuation model, which required the use of various estimates in arriving at the valuation of the awards. The valuation included the estimate of the probability of achieving the performance criteria, which included minimum levels of Company stock price and revenue. If the stock price and performance conditions are not met, some or all of these awards will not vest and compensation cost recorded, if any, could be reversed.
Recently Issued and Adopted Accounting Standards
In May 2014, the Financial Accounting Standards Board (the “FASB”) issued ASC Update No. 2014-09, Revenue from Contracts with Customers (Topic 606), which was subsequently updated. This purpose of the updated standard is to provide enhancements to the quality and consistency of revenue recognition between companies using U.S. GAAP and International Financial Reporting Standards. The new five-step recognition model introduces the core principle of recognizing revenue in an amount that reflects the consideration to which the entity expects to be entitled in exchange for the promised goods or services.
When effective, as amended, ASU 2014-09 will require us to use either of the following transition methods: (i) a full retrospective approach reflecting the application of the standard in each prior reporting period with the option to elect certain practical expedients; or (ii) a modified retrospective approach with the cumulative effect of initially adopting ASU 2014-09 recognized at the date of adoption (which includes additional footnote disclosures to describe the nature, amount, timing and uncertainty of revenue, certain costs and cash flows arising from our contracts with customers).
We have finalized our review of our various revenue streams within our reporting segment and have gathered data regarding the segregation of those revenue streams into the following types for analysis (i) sale of medical device products under standard ship and bill practices, (ii) consignment and leasing of medical device products, and (iii) licensing agreements related to medical technology. We have gathered data and quantified the amount of sales by type of revenue stream and categorized the types of sales for the purpose of comparing how we currently recognize revenue to the new standard in order to quantify the impact of this ASU. We generally anticipate having substantially similar performance obligations under the new guidance as compared with deliverables and units of account currently being recognized. This standard became effective for the Company on July 1, 2018.
Due to the nature of the licensing agreements that the Company enters into, the revenue recognition treatment required under the new standard will depend on contract-specific terms. The Company will need to consistently evaluate the nature of an implicit price concession granted on a major license and IP agreement with the Company’s Chinese partner which will impact the timing of royalty revenue to be recorded under the contract. This may result in revenue being recognized on this license earlier than current practice although such revenue has not yet been recorded and will not be adjusted to revenue or retained earnings upon adoption.
In August 2014, the FASB issued guidance on management’s responsibility in evaluating whether there is substantial doubt about a company’s ability to continue as a going concern and related footnote disclosures. Management will be required to evaluate, at each reporting period, whether there are conditions or events that raise substantial doubt about a company’s ability to continue as a going concern within one year from the date the financial statements are issued. This guidance is effective prospectively for annual and interim reporting periods ending after 2016; implementation of this guidance did not result a material effect on the Company’s financial condition or results of operations.
In July 2015, the FASB issued ASU 2015-11, Simplifying the Measurement of Inventory. ASU 2015-11 applies to inventory that is measured using first-in, first-out (FIFO) or average cost. An entity should measure inventory within the scope of ASU 2015-11 at the lower of cost and net realizable value. Net realizable value represents the estimated selling prices in the ordinary course of business, less reasonably predictable costs of completion, disposal and transportation. The amendments in ASU 2015-11 more closely align the measurement of inventory in US GAAP with the measurement of inventory in International Financial Reporting Standards (IFRS). ASU 2015-11 is effective for fiscal years beginning after December 15, 2016. The adoption of ASU 2015-11 did not have a material impact on the Company’s consolidated financial statements.
23
In November 2015, the FASB issued ASU 2015-17 “Balance Sheet Classification of Deferred Taxes (Topic 740)”. The amendments in this ASU require deferred tax liabilities and assets be classified as noncurrent in a classified statement of financial position. The amendments eliminate the guidance in Topic 740 that requires an entity to separate deferred tax liabilities and assets into a current amount and a noncurrent amount in a classified statement of financial position. The Company adopted ASU 2015-17 as of March 31, 2016 on a prospective basis in order to simplify the balance sheet classification of deferred taxes.
In February 2016, the FASB issued guidance on lease accounting requiring lessees to recognize a right-of-use asset and a lease liability for long-term leases. The liability will be equal to the present value of lease payments. This guidance must be applied using a modified retrospective transition approach to all annual and interim periods presented and is effective for the Company beginning in fiscal 2019. The Company is evaluating this guidance to determine the impact it will have on its financial statements.
In March 2016, the FASB issued guidance on simplifying several aspects of accounting for share-based payment award transactions, including income tax consequences, classification of awards as either equity or liabilities, and classification on the statement of cash flows. This guidance requires a mix of prospective, modified retrospective, and retrospective transition to all annual and interim periods presented and is effective for the Company beginning in fiscal 2018. This guidance was adopted by the Company on July 1, 2017 and resulted in an increase in the Company’s deferred tax asset of approximately $2.5 million.
In August 2016, the FASB issued guidance on the Statement of Cash Flows Classification of certain cash receipts and cash payments (a consensus of the Emerging Issues Task Force). This guidance addresses the following eight specific cash flow issues: Debt prepayment or debt extinguishment costs; settlement of zero-coupon debt instruments or other debt instruments with coupon interest rates that are insignificant in relation to the effective interest rate of the borrowing; contingent consideration payments made after a business combination; proceeds from the settlement of insurance claims; proceeds from the settlement of corporate-owned life insurance policies (including bank-owned life insurance policies); distributions received from equity method investees; beneficial interests in securitization transactions; and separately identifiable cash flows and application of the predominance principle. This guidance will be effective for the Company beginning in fiscal 2019. The Company is currently evaluating this guidance to determine the impact it will have on its financial statements.
In January 2017, the Financial Accounting Standards Board (the “FASB”) issued ASU No. 2017-04, Simplifying the Test for Goodwill Impairment. Under the new standard, goodwill impairment would be measured as the amount by which a reporting unit’s carrying value exceeds its fair value, not to exceed the carrying value of goodwill. This ASU eliminates existing guidance that requires an entity to determine goodwill impairment by calculating the implied fair value of goodwill by hypothetically assigning the fair value of a reporting unit to all of its assets and liabilities as if that reporting unit had been acquired in a business combination. This update is effective for annual periods beginning after December 15, 2019, and interim periods within those periods. Early adoption is permitted for interim or annual goodwill impairment tests performed on testing dates after January 1, 2017. The Company is applying this guidance to applicable impairment tests after January 1, 2017.
In January 2017, the FASB issued ASU No. 2017-01, Business Combinations: Clarifying the Definition of a Business (“ASU 2017-01”). ASU 2017-01 clarifies the definition of a business for determining whether transactions should be accounted for as acquisitions (or disposals) of assets or businesses. ASU 2017-01 is effective for annual periods and interim periods within those annual periods beginning after December 15, 2017, and early adoption is permitted. The Company is in the process of evaluating the impact of the adoption of ASU 2017-01 on its consolidated financial statements.
There are no other recently issued accounting pronouncements that are expected to have a material effect on the Company’s financial position, results of operations or cash flows.
24
Item 7A. Quantitative and Qualitative Disclosures About Market Risk.
Market Risk:
The principal market risks (i.e., the risk of loss arising from adverse changes in market rates and prices) to which the Company is exposed are interest rates on cash and certain items in inventory.
Interest Rate Risk:
The Company earns interest on cash balances. In light of the Company’s existing cash, results of operations and projected borrowing requirements, the Company does not believe that a 10% change in interest rates would have a significant impact on its consolidated financial position.
Item 8. Financial Statements and Supplemental Data.
The Company’s reports from its independent registered public accounting firms and consolidated financial statements listed in the accompanying index are filed as part of this Annual Report. See “Index to Consolidated Financial Statements” on page F-1 below.
Item 9. Changes in and Disagreements With Accountants on Accounting and Financial Disclosure.
Not applicable.
Item 9A. Controls and Procedures.
Evaluation of Disclosure Controls and Procedures
We maintain disclosure controls and procedures (as defined in Rules 13a-15(e) and 15d-15(e) under the Exchange Act) that are designed to provide reasonable assurance that information required to be disclosed in reports we file or submit under the Exchange Act is recorded, processed, summarized and reported within the time periods specified in the rules and forms of the SEC and that such information is accumulated and communicated to our management, including the Chief Executive Officer and Chief Financial Officer, as appropriate, to allow timely decisions regarding required disclosures.
All internal control systems, no matter how well designed and tested, have inherent limitations, including, among other things, the possibility of human error, circumvention or disregard. Therefore, even those systems of internal control that have been determined to be effective can provide only reasonable assurance that the objectives of the control system are met and may not prevent or detect misstatements. Also, projections of any evaluation of effectiveness to future periods are subject to the risk that controls may become inadequate because of changes in conditions, or that the degree of compliance with the policies or procedures may deteriorate.
We carried out an evaluation, under the supervision and with the participation of management, of the effectiveness of the design and operation of our disclosure controls and procedures as of June 30, 2018. Due to the material weakness in internal control over financial reporting as described below in “Management’s Report on Internal Control over Financial Reporting”, our CEO and CFO have concluded that our disclosure controls and procedures were not effective, and were not operating at a reasonable assurance level, as of June 30, 2018.
25
Management’s Report on Internal Control over Financial Reporting
Our management is responsible for establishing and maintaining adequate internal control over financial reporting and for assessing the effectiveness of internal control over financial reporting, as defined in Rule 13a-15(f) under the Exchange Act. Internal control over financial reporting refers to a process designed by, or under the supervision of, our CEO and our CFO and effected by our Board, management and other personnel, to provide reasonable assurance regarding the reliability of financial reporting and the preparation of financial statements for external purposes in accordance with generally accepted accounting principles, and includes those policies and procedures that:
| ● | pertain to the maintenance of records that in reasonable detail accurately and fairly reflect the transactions and dispositions of our assets; |
| ● | provide reasonable assurance that transactions are recorded as necessary to permit preparation of financial statements in accordance with generally accepted accounting principles, and that our receipts and expenditures are being made only in accordance with authorizations of our management and members of our Board; and |
| ● | provide reasonable assurance regarding prevention or timely detection of unauthorized acquisition, use, or disposition of our assets that could have a material effect on our financial statements. |
Because of its inherent limitations, internal control over financial reporting may not prevent or detect misstatements. Also, projections of any evaluation of effectiveness to future periods are subject to the risk that controls may become inadequate because of changes in conditions, or that the degree of compliance with the policies or procedures may deteriorate.
A material weakness (as defined in Rule 12b-2 under the Exchange Act) is a deficiency, or combination of deficiencies, in internal control over financial reporting such that there is a reasonable possibility that a material misstatement of a company’s annual or interim financial statements will not be prevented or detected on a timely basis. Management conducted an evaluation of the effectiveness of our internal control over financial reporting as of June 30, 2018, based on the criteria established in the 2013 Internal Control—Integrated Framework issued by the Committee of Sponsoring Organizations of the Treadway Commission. Based upon this evaluation, management has determined, because of a lack of consistency in the approval of manual journal entries to the general ledger, a material weakness existed at June 30, 2018, as described below. In light of such material weakness, management has concluded that our internal control over financial reporting was ineffective as of June 30, 2018.
The Company’s financial procedures require that when preparing a journal entry for posting to the general ledger, such journal entry requires the review and written approval of the appropriate finance personnel, other than the individual creating the journal entry. The Company identified a number of instances where journal entries did not contain evidence of the proper written approval. To remediate this weakness, the Company has converted its entire operation, effective July 1, 2018, onto a new NetSuite ERP system, from its legacy ERP system. The legacy system required a higher number of manual journal entries, compared with the new system which will require fewer manual journal entries because of the level of system integration and sophistication. In addition, the Company has implemented procedures to ensure that all journal entries are properly approved including a review at month end by the CFO to ensure that all journal entries are properly authorized.
The identified control deficiency did not result in any material misstatements in our financial statements. However, this control deficiency created a reasonable possibility that a material misstatement to the consolidated financial statements would not be prevented or detected on a timely basis. Accordingly, we concluded that the control deficiency represented a material weakness in our internal control over financial reporting and our internal control over financial reporting was not effective as of June 30, 2018.
The independent registered public accounting firm, BDO USA, LLP, has expressed an adverse report on the operating effectiveness of our internal control over financial reporting as of June 30, 2018. BDO USA, LLP’s report appears in Item 8 of this 10-K.
Changes in Internal Control over Financial Reporting
There were no changes in our internal control over financial reporting (as such term is defined in Rules 13a-15(f) and 15d-15(f) under the Exchange Act) during the fourth fiscal quarter ended June 30, 2018 that materially affected, or are reasonably likely to materially affect, our internal control over financial reporting.
None.
26
Item 10. Directors, Executive Officers and Corporate Governance.
The Company currently has five Directors (the “Board”). Their term expires at the next Annual Meeting of Shareholders. The following table contains information regarding all Directors and executive officers of the Company as of August 15, 2018:
| Name | Age | Principal Occupation | Director Since |
||||
| Patrick A. McBrayer | 66 | Director | 2014 | ||||
| Dr. Charles Miner III | 66 | Director | 2005 | ||||
| Thomas M. Patton | 54 | Director | 2015 | ||||
| Stavros G. Vizirgianakis | 47 | President, Chief Executive Officer and Director | 2013 | ||||
| Gwendolyn A. Watanabe | 47 | Director | 2018 | ||||
| Joseph P. Dwyer | 62 | Chief Financial Officer | — | ||||
| Robert S. Ludecker | 50 | Senior Vice President, Global Sales and Marketing | — | ||||
| Dan Voic | 56 | Vice President of Research and Development and Engineering | — | ||||
| Joseph J. Brennan | 55 | Vice President of Operations | — | ||||
| John J. Salerno | 63 | Vice President of Quality and Regulatory Affairs and Chief Compliance Officer | — | ||||
| Christopher H. Wright | 44 | Vice President of Domestic Sales | — |
Principal Occupations and Business Experience of Directors and Executive Officers
The following is a brief account of the business experience of the Company’s Directors and executive officers:
Directors
Patrick A. McBrayer has served since January 2016 as President and Chief Executive Officer of ACell Corporation, a surgery and wound care company. Mr. McBrayer previously served as President and Chief Executive Officer and as a director of privately-held AxioMed Spine Corporation from February 2006 to January 2015. AxioMed is a medical device company focused on restoring the natural function of the spine. Prior to joining AxioMed, he held positions with Xylos Corporation (medical biomaterials); Exogen, Inc. (treatment of musculoskeletal injury and disease); Osteotech, Inc. (tissue technology); and Johnson and Johnson Products, Inc. (healthcare products). Mr. McBrayer holds a B. S. in General Engineering from the United States Military Academy. The Board believes Mr. McBrayer’s industry knowledge and experience as a CEO qualifies him to serve as a Director.
Dr. Charles Miner III currently practices internal medicine in Darien, Connecticut and is employed by Stamford Health Medical Group. He is also a director of Castle Connolly Private Health Partners, LLC and CEO of Castle Connolly Lifestream MD, LLC. Dr. Miner is on staff at Stamford and Norwalk Hospitals and since 1982 has held a teaching position at Columbia Presbyterian Hospital. Dr. Miner received his M.D. from the University of Cincinnati College of Medicine in 1979 and received a Bachelor of Science from Lehigh University in 1974. Dr. Miner is an experienced physician and teacher in the medical field. He serves on the board of The Stamford Hospital Foundation Board. The Board believes his experience as a medical doctor and his corporate experience qualifies him to serve as a Director.
27
Thomas M. Patton has served as President and Chief Executive Officer of CAS Medical Systems, Inc. and as a member of its Board of Directors since August 2010. He previously served as the CEO of Wright Medical Group, an orthopedic device company, located in Memphis, Tennessee, and as President of Novametrix Medical Systems, a patient-monitoring company, located in Wallingford, Connecticut. From 2003 to 2010, Mr. Patton acted as an advisor to the healthcare-focused private equity group of Ferrer Freeman & Company and, in that capacity, served as the interim CEO of Informed Medical Communications on a part-time basis in 2006 and 2007. Mr. Patton was a co-founder and CEO of QDx, Inc., a start-up company that developed a platform for hematology diagnostics beginning in 2003 which was sold to Abbott Laboratories. Mr. Patton attended The College of the Holy Cross, where he majored in Economics and Accounting. After graduating magna cum laude from Georgetown University Law Center, Mr. Patton worked at the law firm of Williams & Connolly in Washington, D.C. Thereafter, he joined Wright Medical Group as its General Counsel where he served in various executive roles until being appointed CEO. Mr. Patton has served on the board of directors of various public and private healthcare companies. The Board believes Mr. Patton’s industry knowledge and experience qualify him to serve as a director.
Stavros G. Vizirgianakis became the Company’s Interim Chief Executive Officer in September 2016 and its full-time President and Chief Executive Officer in December 2016. Mr. Vizirgianakis has a distinguished career in the medical devices field having worked for United States Surgical Corporation as director of sales for sub-Saharan Africa and later Tyco Healthcare in the capacity of General Manager South Africa. In 2006, Mr. Vizirgianakis co-founded Surgical Innovations, which became one of the largest privately owned medical device distributors in the African region, and part of the Johannesburg Stock Exchange listed entity Ascendis Health. In that capacity, Mr. Vizirgianakis acted as a distributor of the Company’s products. Mr. Vizirgianakis was Managing Director of Ascendis Medical from January 2014 through July 2016. Mr. Vizirgianakis also served on the board of Tenaxis Medical and is a strategic investor and advisor to numerous medical device startups and established companies in this field. Mr. Vizirgianakis has a degree in commerce from the University of South Africa. The Board believes Mr. Vizirgianakis’ industry knowledge and his vast international business relationships qualify him to serve as a Director.
Gwendolyn A. Watanabe, who joined the Company’s board of directors in July 2018, served since 2013 as Global Vice President Corporate Development & Strategy for Teleflex Incorporated, a NYSE-listed global provider of medical technology products. From 2012-2013, she served as Vice President of the Cardiac Care Business Unit of Teleflex Incorporated, and from 2009-2012 she was President and Chief Executive Officer of Hotspur Technology, Inc. prior to its acquisition by Teleflex Incorporated. From 2004-2009 Ms. Watanabe served as Chief Financial Officer and Chief Business Officer of Nellix, Inc. Prior thereto, she served in executive capacities at Bacchus Vascular, Inc. and AneuRx, Inc. She has also been a General Partner of the medical device venture funds Saratoga Ventures V, L.P. and Saratoga Ventures VI, L.P. Ms. Watanabe is a graduate of the Massachusetts Institute of Technology, and holds an M.S. in Mechanical Engineering from Stanford University and an M.B.A. from Harvard University Graduate School of Business. The Board believes Ms. Watanabee’s industry knowledge and experience qualifies her to serve as a Director.
28
Executive Officers who are not Directors
Joseph P. Dwyer has served as the Company’s Chief Financial Officer since August 2017 and as the Company’s Treasurer and Secretary since September 2017, and previously served as Interim Chief Financial Officer from September 2016 to August 2017. From June 2015 to the present, Mr. Dwyer has provided financial consulting and advisory services to various companies, through the firms Dwyer Holdings and TechCXO. Prior thereto, from November 2012 until June 2015, he was Chief Financial Officer of Virtual Piggy, Inc., a publicly-traded technology company. Prior to joining Virtual Piggy, Mr. Dwyer served as chief financial officer of OpenLink Financial, Inc., a privately held company, which provides software solutions for trading and risk management in the energy, commodity, and capital markets. During 2011 and 2012, Mr. Dwyer was a member of the board of directors and chairman of the audit committee and served as interim chief administrative officer of Energy Solutions International, Inc., a privately-held company providing pipeline management software to energy companies and pipeline operators. From 2010 through 2011, Mr. Dwyer served as chief administrative officer of Capstone Advisory Group, LLC, a privately- held financial advisory firm providing corporate restructuring, litigation support, forensic accounting, expert testimony and valuation services. Mr. Dwyer served as a consultant to Verint Systems, Inc., a software company listed on the NASDAQ Global Market, from 2009 through 2010, assisting with SEC reporting and compliance. From 2005 through 2009, Mr. Dwyer served as chief financial officer and executive vice president of AXS-One Inc., a publicly traded software company. During 2004, Mr. Dwyer served as chief financial officer of Synergen, Inc., a privately held software company providing energy technology to utilities. Prior to 2004, Mr. Dwyer also served as chief financial officer and executive vice president of Caminus Corporation, an enterprise application software company that was formerly listed on the NASDAQ National Market, chief financial officer of ACTV, Inc., a digital media company that was formerly listed on the NASDAQ National Market, and chief financial officer of Winstar Global Products, Inc., a manufacturer and distributor of hair care, bath and beauty products until its acquisition by Winstar Communications, Inc. in 1995 when Mr. Dwyer went on to serve as senior vice president, finance of Winstar Communications. Mr. Dwyer received his BBA in Accounting from the University of Notre Dame in 1978 and is licensed as a Certified Public Accountant in the State of New York.
Robert S. Ludecker became Senior Vice President of Global Sales and Marketing in May 2015. Prior to joining the Company as Global Vice President of Sales and Marketing in May 2013, Mr. Ludecker served from February 2011 to May 2013 as Vice President of Global Sales and Marketing for BioMimetic Therapeutics, a NASDAQ-listed biotechnology company, specializing in the development and commercialization of products which promote the healing of musculoskeletal injury and diseases, including orthopedic, spine, and sports medicine applications. Prior to BioMimetic, Mr. Ludecker served from February 2008 to February 2011 in a variety of senior sales and marketing leadership positions with Small Bone Innovations, a private New York City-based orthopedic company specializing in small bones, and Smith and Nephew, a leading U.K.-based global provider of orthopedic reconstruction implants and a broad portfolio of medical instruments and supplies. Mr. Ludecker holds a B. A. degree from Kenyon College.
Dan Voic became Vice President of Research and Development and Engineering in January 2002. Prior thereto, he served as Engineering Manager and Director of Engineering with the Company. Mr. Voic has in excess of 15 years’ experience in both medical and laboratory and scientific products development. Mr. Voic holds an M.S. degree in mechanical engineering from Polytechnic University “Traian Vuia” of Timisoara, Romania and an MS degree in applied mechanics from Polytechnic University of New York.
Joseph J. Brennan became Vice President of Operations in November 2014. Prior to joining the Company, Mr. Brennan served from October 2008 to August 2014 as Director of Operations for Air Techniques, Inc., a global medical device company. Mr. Brennan holds a B. T. degree from the State University of New York at Farmingdale.
John J. Salerno became Vice President of Quality and Regulatory Affairs in March 2015 and also assumed the position of Chief Compliance Officer in April 2018. Prior to joining the Company, Mr. Salerno served from December 2012 to March 2015 as Senior Director of Quality Assurance for US Nonwovens Corp., a privately-held over the counter drug products, cosmetics, personal care and EPA surface disinfectant company. From May 2010 to December 2012, Mr. Salerno was a consultant for US Nonwovens. From 2006 to 2010, Mr. Salerno held the position of Vice President of Quality Assurance and Regulatory Affairs for International Technidyne Corporation. Prior to 2006, Mr. Salerno held the position of Vice President of Regulator Compliance and Reliability Engineering for Pall Life Sciences. Mr. Salerno holds a Master’s degree in Microbiology from Long Island University and a Bachelor’s degree in biology from Fordham University.
Christopher H. Wright became Vice President of Domestic Sales in July 2015. Prior to that, he was National Sales Director of Surgical Sales for the Company since 2013. Prior to joining the Company, Mr. Wright served from 2011 to 2013 in the position of Senior Business Director with Wright Medical/BioMimetics, LLC. From 2007 – 2011 Mr. Wright held the position for Regional Manager with Small Bone Innovations. From 2005 – 2007 he held the position of Territory business manager with Baxter Healthcare. Prior to 2005, Mr. Wright was an independent sales representative. Mr. Wright holds a Bachelor of Arts degree in Business Administration from Xavier University of New Orleans in Louisiana.
Executive officers are elected annually by, and serve at the discretion of, the Board.
29
Section 16(a) Beneficial Ownership Reporting Compliance
Section 16(a) of the Exchange Act requires the Company’s executive officers, directors and persons who own more than 10% of a registered class of the Company’s equity securities (“Reporting Persons”) to file reports of ownership and changes in ownership on Forms 3, 4, and 5 with the SEC. These Reporting Persons are required by SEC regulation to furnish the Company with copies of all Forms 3, 4 and 5 they file with the SEC. Based solely on the Company’s review of the copies of the forms it has received, the Company believes that all Reporting Persons, complied on a timely basis with all filing requirements applicable to them with respect to transactions during fiscal year 2018.
Code of Ethics
The Company has adopted a code of ethics that applies to all of its directors, officers (including its Chief Executive Officer, Chief Financial Officer, Controller and any person performing similar functions) and employees. The Company has made the Code of Ethics available on its website at www.MISONIX.com.
Nomination of Directors
The process followed by the Nominating and Governance Committee to identify and evaluate director candidates includes requests to the members of our board of directors and others for recommendations, meetings from time to time to evaluate biographical information and background material relating to potential candidates and interviews of selected candidates by members of the Nominating and Governance Committee and our board of directors.
While we do not have a formal diversity policy for board membership, we look for potential candidates that help ensure that the board of directors has the benefit of a wide range of attributes, including cultural, gender, ethnic and age diversity and experience in industries beyond healthcare. We also look for financial oversight experience, financial community experience and a good reputation within the financial community; business management experience and the potential to succeed top management in the event board intervention is necessary on an unexpected basis; business contacts, business knowledge and influence that may be useful to our businesses; and knowledge about our industry and technologies.
Our board of directors does not currently prescribe any minimum qualifications for director candidates; however, the Nominating and Governance Committee will take into account a potential candidate’s experience, areas of expertise and other factors relevant to the overall composition of our board of directors.
Shareholders may recommend individuals to the Nominating and Governance Committee for consideration as potential director candidates by submitting the names of the candidate(s), together with appropriate biographical information and background materials and a statement as to whether the shareholder or group of shareholders making the recommendation has beneficially owned more than 5% of our common stock for at least a year as of the date such recommendation is made, to the Nominating and Governance Committee, Attn: Corporate Secretary, Misonix, Inc., 1938 New Highway, Farmingdale, New York 11735. Assuming that appropriate biographical and background material has been provided on a timely basis, the Nominating and Governance Committee will evaluate shareholder-recommended candidates by following substantially the same process, and applying substantially the same criteria, as it follows for candidates submitted by others.
Audit Committee
The Company has a separately designated standing Audit Committee. The members of the committee are Messrs. Patton, McBrayer and Ms. Watanabe. Mr. Patton chairs the committee. John W. Gildea, a former member of the Board, served on the Audit Committee until July 2018. Each current member of the committee, and each member who served during the 2018 fiscal year, is independent as defined in Rule 10A-3 of the Securities and Exchange Commission and the listing standards of Nasdaq. The Board of Directors has determined that Messrs. Patton and McBrayer each qualifies as an “audit committee financial expert,” as that term is defined in Regulation S-K of the Securities and Exchange Commission.
30
Item 11. Executive Compensation.
Compensation Discussion and Analysis
Overview of Compensation Program and Philosophy
Our compensation program is intended to:
| ● | Attract, motivate, retain and reward employees of outstanding ability; | |
| ● | Link changes in employee compensation to individual and corporate performance; | |
| ● | Align employees’ interests with those of the Company’s shareholders. |
The ultimate objective of our compensation program is to increase shareholder value. We seek to achieve these objectives with a total compensation approach which takes into account a competitive base salary, bonus pay based on the annual performance of the Company and individual goals and stock option and restricted stock awards.
The Board’s Compensation Committee, which is comprised solely of independent directors and is responsible for making decisions regarding the amount and form of compensation paid to the Company’s executive officers, has carefully considered the results of prior say-on-pay shareholder votes. Based upon the vote results at the most recent annual shareholders meeting, shareholders appear to be supportive of the Compensation Committee’s approach to the executive compensation program.
Base Salaries
Base salaries paid to executives are intended to attract and retain highly talented individuals. In setting base salaries, individual experience, individual performance, the Company’s performance and job responsibilities during the year are considered. Executive salaries are evaluated against local companies of similar size and nature. During the fiscal year ended June 30, 2018, Messrs. Vizirgianakis, Dwyer, Ludecker and Voic each received base salary increases of 3.0% based on performance.
Annual Bonus Plan Compensation
The Compensation Committee of the Board approves annual performance-based compensation. The purpose of the annual bonus compensation is to motivate executive officers and key employees. Target bonuses, based upon recommendations from the Chief Executive Officer, are evaluated and approved by the Compensation Committee for all management employees other than the Chief Executive Officer. The bonus recommendations are derived from individual and Company performance but not based on a specific formula and are discretionary. The Chief Executive Officer’s bonus compensation is derived from the recommendation of the Compensation Committee based upon the Chief Executive Officer’s performance and Company performance but is not based on a specific formula and is discretionary. Bonuses earned in fiscal 2018 based on performance were as follows: $167,000 to Mr. Vizirgianakis, $85,000 to Mr. Dwyer, $170,500 to Mr. Ludecker, and $39,000 to Mr. Voic. Mr. Wright’s performance-based compensation is commission based and he therefore did not participate in the bonus plan.
Equity Incentive Awards
Company executives are eligible to receive restricted stock and stock options (which gives them the right to purchase shares of common stock at a specified price in the future). These grants will vest based upon the passage of time, the achievement of performance metrics, or both. We believe that the use of restricted stock and stock options as the basis for long-term incentive compensation meets our defined compensation strategy and business needs by achieving increased value for shareholders and retaining key employees.
Stock option awards are intended to attract and retain highly talented executives, to provide an opportunity for significant compensation when overall Company performance is reflected in the stock price and to help align executives’ and shareholders’ interests. Stock options are typically granted at the time of hire to key new employees and annually to a broad group of existing key employees, including executive officers. We have adopted a number of equity compensation plans governing the grant of such stock options. All of our equity compensation plans have been approved by our shareholders.
31
Annual option grants to executive officers are made at the discretion of the Board or the Compensation Committee and may be in the form of incentive stock options (“ISOs”) up to the fullest extent permitted under tax laws, with the balance granted in the form of nonqualified stock options. The option grants are subject to the terms of the relevant plan. ISOs have potential income tax advantage for executives if the executive disposes of the acquired shares after satisfying certain holding periods. Tax laws provide that at the date of grant, the aggregate fair market value of ISOs that become exercisable for any employee in any year may not exceed $100,000.
Our current standard option vesting schedule for all employees is 25% on the first anniversary of the date of grant, 25% on the second anniversary of the date of grant, 25% on the third anniversary of the date of grant and 25% on the fourth anniversary of the date of grant. We have on occasion issued options that have two year vesting to employees.
The number of stock options granted in fiscal 2018 to the named executive officers, and their estimated fair value, were as follows:
| Named Executive Officer | Grant Date | Number of Options Granted | Estimated Fair Value of Awards at Grant Date | ||||||
| Joseph P. Dwyer | 8/21/2017 | 100,000 | $ | 582,770 | |||||
| Joseph P. Dwyer | 11/2/2017 | 12,000 | $ | 66,238 | |||||
| Robert S. Ludecker | 11/2/2017 | 24,000 | $ | 132,476 | |||||
| Dan Voic | 11/2/2017 | 12,000 | $ | 66,238 | |||||
| Christopher H. Wright | 11/2/2017 | 12,000 | $ | 66,238 | |||||
The stock options awarded on August 21, 2017 had an exercise price of $10.20 (which was equal to the closing market price per share of our stock on the date of grant). The stock options awarded on November 2, 2017 had an exercise price of $10.25 (which was equal to the closing market price per share of our stock on the date of grant). All stock options in the above table provide for vesting at 25% per year on the first four year anniversary dates of the grant date, with a stated expiration date of ten years after grant.
In conjunction with the execution of his employment agreement, on December 15, 2016 Mr. Vizirgianakis received grants of an aggregate of 400,000 shares of restricted stock pursuant to the Company’s 2014 Employee Equity Incentive Plan (the “Plan”) as follows: (i) a grant of 134,000 shares vesting in five equal installments on September 1, 2017, 2018, 2019, 2020 and 2021; (ii) a performance grant of 133,000 shares which vests if both of the following conditions are satisfied simultaneously: (A) at any time prior to the third anniversary of the grant date, the most recent publicly reported trailing four (4) fiscal quarter revenue of the Company (exclusive of the impact of any acquisitions after the grant date) is at least $35,000,000 and (B) the closing price of the Company’s Common Stock is at least $10.50 per share (subject to adjustment for stock splits, stock dividends and the like) for ten (10) consecutive trading days; and (iii) a performance grant of 133,000 shares which vests if both of the following conditions are satisfied simultaneously: (A) at any time prior to the fifth anniversary of the grant date, the most recent publicly reported trailing four (4) fiscal quarter revenue of the Company (exclusive of the impact of any acquisitions after the grant date) is at least $48,000,000 and (B) the closing price of the Company’s Common Stock is at least $13.00 per share (subject to adjustment for stock splits, stock dividends and the like) for ten (10) consecutive trading days. The aforementioned performance grants will vest on a change of control in accordance with the Plan only if the applicable share price threshold is met in such transaction.
32
Other Annual Compensation and Benefits
Although direct compensation, in the form of salary, non-equity incentive awards and long-term equity incentive awards provide most of the compensation to each Executive Officer, we also provide for the following items of additional compensation:
| ● | Retirement savings are provided by a 401(k) plan, in the same manner to all U.S. employees. This plan includes an employer matching contribution of 10% which is intended to encourage employees (including the chief executive officer) to save for retirement. |
| ● | Health, life and disability benefits are offered to our executive officers in the same manner to all of our U.S. employees. We provided additional life insurance, long term care policies and certain transportation expenses for our chief executive officer and each of our executive officers. |
Transportation expenses are provided to executive officers, primarily in the form of an automobile allowance.
Compensation Committee Report
Our Compensation Committee has furnished the following report. The information contained in the “Compensation Committee Report” is not deemed to be “soliciting material” or to be “filed” with the SEC, nor is such information to be incorporated by reference into any future filing under the Securities Act of 1933, as amended (the “Securities Act”), or the Exchange Act, as amended, except to the extent that we specifically incorporate it by reference in to such filings.
Our Compensation Committee has reviewed and discussed the “Compensation Discussion and Analysis” required by Item 402(b) of Regulation S-K of the Securities Act with management. Based on such review and discussion, our Compensation Committee recommended to our Board of Directors that the “Compensation Discussion and Analysis” be included in our Annual Report on Form 10-K for the fiscal year ended June 30, 2018 for filing with the SEC.
| Compensation Committee | |
| Patrick A. McBrayer | |
| Dr. Charles Miner III | |
| Thomas M. Patton |
Compensation Committee Interlocks and Insider Participation
During fiscal 2018, Messrs. McBrayer, Miner and Patton served as members of our Compensation Committee. No Member of our Compensation Committee is or was during fiscal year 2018 an employee or an officer of Misonix or its subsidiaries.
Summary of Compensation
The table and footnotes below describe the total compensation for fiscal years ended June 30, 2018, June 30, 2017, and June 30, 2016 earned by the “named executive officers,” who are each of the persons who served as our principal executive officer and principal financial officer during fiscal 2018, and the three other most highly compensated individuals who were serving as executive officers of the Company on June 30, 2018, the last day of the fiscal year.
33
SUMMARY COMPENSATION TABLE
| Name and Principal Position | Fiscal year Ended June 30, | Salary ($) | Bonus ($) | Stock Awards ($) | Option Awards ($) | All Other Compensation ($) | Total ($) | |||||||||||||||||||
| Stavros Vizirgianakis | 2018 | $ | 365,400 | $ | 167,000 | $ | — | $ | — | $ | 8,907 | (1) | $ | 541,307 | ||||||||||||
| President and Chief Executive | 2017 | $ | 180,000 | $ | 103,125 | $ | 3,637,388 | $ | — | $ | 124,020 | $ | 4,044,533 | |||||||||||||
| Officer | 2016 | $ | — | $ | — | $ | — | $ | — | $ | — | — | ||||||||||||||
| Joseph P. Dwyer | 2018 | $ | 309,385 | $ | 85,000 | $ | — | $ | 649,008 | $ | 7,327 | (1) | $ | 1,050,720 | ||||||||||||
| Chief Financial Officer | 2017 | $ | 285,000 | $ | — | $ | — | $ | — | $ | — | $ | 285,000 | |||||||||||||
| 2016 | $ | — | $ | — | $ | — | $ | — | $ | — | $ | — | ||||||||||||||
| Robert S. Ludecker | 2018 | $ | 279,972 | $ | 170,500 | $ | — | $ | 132,476 | $ | 9,409 | (1) | $ | 592,356 | ||||||||||||
| Senior Vice President-Medical | 2017 | $ | 271,817 | $ | 82,500 | $ | — | $ | 264,250 | $ | 31,300 | $ | 649,867 | |||||||||||||
| Global Sales and Marketing | 2016 | $ | 263,900 | $ | 65,000 | $ | — | $ | 110,379 | $ | 8,194 | $ | 447,473 | |||||||||||||
| Dan Voic | 2018 | $ | 191,088 | $ | 39,000 | $ | — | $ | 66,238 | $ | 11,843 | (2) | $ | 308,170 | ||||||||||||
| Vice President of | 2017 | $ | 185,523 | $ | 22,000 | $ | — | $ | 76,781 | $ | 15,615 | $ | 299,919 | |||||||||||||
| Research and Development | 2016 | $ | 180,119 | $ | 25,000 | $ | — | $ | 128,776 | $ | 11,885 | $ | 345,780 | |||||||||||||
| and Engineering | ||||||||||||||||||||||||||
| Christopher H. Wright | 2018 | $ | 321,775 | $ | — | $ | — | $ | 66,238 | $ | 7,850 | (1) | $ | 395,863 | ||||||||||||
| Vice President - U. S. Sales | 2017 | $ | 383,250 | $ | — | $ | — | $ | 232,714 | $ | 10,870 | $ | 626,834 | |||||||||||||
| 2016 | $ | 296,300 | $ | — | $ | — | $ | 55,190 | $ | 7,646 | $ | 359,136 | ||||||||||||||
| (1) | Consists of a car allowance, life and long term care insurance coverage. |
| (2) | Consists of a car allowance, toll reimbursements and life and long term care insurance coverage. |
34
Grants of Plan Based Awards
The following table presents non-equity and equity awards granted to the named executive officers in fiscal year 2018.
GRANTS OF PLAN BASED AWARDS IN FISCAL 2018
| Name | Grant Date | All Other Stock Awards: Number of Shares of Stock | All Other Option Awards: Number of Securities Underlying Options | (1) Exercise or Base price of Option Awards ($/Share) | (2) Grant Date Fair Value of Stock and Option Awards ($) | ||||||||||
| Joseph P. Dwyer | 8/21/2017 | — | 100,000 | $ | 10.20 | $ | 582,770 | ||||||||
| Joseph P. Dwyer | 11/2/2017 | — | 12,000 | $ | 10.25 | $ | 66,238 | ||||||||
| Robert S. Ludecker | 11/2/2017 | — | 24,000 | $ | 10.25 | $ | 132,476 | ||||||||
| Dan Voic | 11/2/2017 | — | 12,000 | $ | 10.25 | $ | 66,238 | ||||||||
| Christopher H. Wright | 11/2/2017 | — | 12,000 | $ | 10.25 | $ | 66,238 | ||||||||
| (1) | Stock option awards were issued on August 21, 2017 to Mr. Dwyer pursuant to our 2017 Employee Equity Incentive Plan. Stock option awards were issued on November 2, 2017 pursuant to our 2017 Employee Equity Incentive Plan, except Mr. Wright, who received his grant from the 2012 Employee Equity Incentive Plan. All stock options in the above table provide for vesting at 25% per year on the first four year anniversary dates of the grant date, with a stated expiration date of ten years after grant. |
| (2) | This amount represents the Black-Scholes computation as of that date of award. |
35
Outstanding Equity Awards at Fiscal Year-End
The following table sets forth information regarding outstanding equity awards held as of June 30, 2018 by our named executive officers.
OUTSTANDING EQUITY AWARDS AT 2018 FISCAL YEAR END
| Name | Number of Securities Underlying Unexercised Options (#) Exercisable | Number of Securities Underlying Unexercised Options (#) Unexercisable | Option Exercise Price ($) | Option Expiration Date | Number of Shares of Stock That Have Not Not Vested | |||||||||||||
| Stavros G. Vizirgianakis | (1) | $ | — | 107,200 | ||||||||||||||
| (1) | 133,000 | |||||||||||||||||
| (1) | 133,000 | |||||||||||||||||
| Joseph P. Dwyer | ||||||||||||||||||
| — | 100,000 | (2) | 10.20 | 8/21/2027 | ||||||||||||||
| — | 12,000 | (3) | 10.25 | 11/2/2027 | ||||||||||||||
| Robert S. Ludecker | ||||||||||||||||||
| 10,000 | — | (3) | 4.68 | 9/10/2023 | ||||||||||||||
| 26,250 | 8,750 | (4) | 7.67 | 9/9/2024 | ||||||||||||||
| 60,000 | 20,000 | (5) | 12.77 | 5/14/2025 | ||||||||||||||
| 15,000 | 15,000 | (6) | 9.38 | 8/18/2025 | ||||||||||||||
| 7,750 | 23,250 | (7) | 6.76 | 11/3/2026 | ||||||||||||||
| 7,500 | 22,500 | (8) | 9.53 | 12/6/2026 | ||||||||||||||
| — | 24,000 | (2) | 10.25 | 11/2/2027 | ||||||||||||||
| Dan Voic | ||||||||||||||||||
| 7,500 | — | 2.19 | 9/13/2021 | |||||||||||||||
| 17,500 | — | 2.96 | 9/13/2022 | |||||||||||||||
| 26,250 | — | 4.68 | 9/10/2023 | |||||||||||||||
| 26,249 | 8,751 | (4) | 7.67 | 9/9/2024 | ||||||||||||||
| 17,500 | 17,500 | (7) | 9.38 | 8/18/2025 | ||||||||||||||
| 3,750 | 11,250 | (8) | 9.53 | 12/6/2026 | ||||||||||||||
| — | 12,000 | (3) | 10.25 | 11/2/2027 | ||||||||||||||
| Christopher H. Wright | ||||||||||||||||||
| 7,500 | 2,500 | (4) | 7.67 | 9/9/2024 | ||||||||||||||
| 7,500 | 7,500 | (6) | 9.38 | 8/18/2025 | ||||||||||||||
| 3,750 | 11,250 | (7) | 6.76 | 11/3/2026 | ||||||||||||||
| 8,750 | 26,250 | (5) | 9.53 | 12/6/2026 | ||||||||||||||
| — | 12,000 | (3) | 10.25 | 11/2/2027 | ||||||||||||||
| (1) | 134,000 shares vesting in five equal installments on September 1, 2017, 2018, 2019, 2020 and 2021; 133,000 shares vest if both of the following conditions are satisfied simultaneously: (A) at any time prior to the third anniversary of the grant date, the most recent publicly reported trailing four (4) fiscal quarter revenue of the Company (exclusive of the impact of any acquisitions after the grant date) is at least $35,000,000 and (B) the closing price of the Company’s Common Stock is at least $10.50 per share (subject to adjustment for stock splits, stock dividends and the like) for ten (10) consecutive trading days; and 133,000 shares vest if both of the following conditions are satisfied simultaneously: (A) at any time prior to the fifth anniversary of the grant date, the most recent publicly reported trailing four (4) fiscal quarter revenue of the Company (exclusive of the impact of any acquisitions after the grant date) is at least $48,000,000 and (B) the closing price of the Company’s Common Stock is at least $13.00 per share (subject to adjustment for stock splits, stock dividends and the like) for ten (10) consecutive trading days. |
| (2) | Options issued 8/21/17 and vest equally over 4 years. |
| (3) | Options issued 11/2/17 and vest equally over 4 years. |
36
| (4) | Options issued 9/09/14 and vest equally over 4 years. |
| (5) | Options issued 5/14/2015 and vest equally on 11/14/2016, 5/14/2017, 5/14/2018 and 5/14/2019. |
| (6) | Options issued 8/18/2015 and vest equally over 4 years. |
| (7) | Options issued on 11/3/16 and vested equally over 4 years. |
| (8) | Options issued on 12/6/16 and vested equally over 4 years. |
Stock Option Exercises
The following table shows all stock option exercises during fiscal 2018 by the named executive officers.
| OPTION EXERCISES IN FISCAL 2018 |
| Name of Executive Officer | Exercise Date | Number of Shares Acquired On Exercise | (1) Value Realized On Exercise | |||||||||
| Stavros Vizirgianakis | 9/21/2017 | 7,500 | $ | 18,713 | ||||||||
| (1) | Amounts reflect the difference between the exercise price of the options and the market value of the shares acquired upon exercise. Market values are based on the closing price per share of our Common Stock on the NASDAQ Global Market on the date of exercise. |
Employment and Severance Agreements
Vizirgianakis Employment Agreement
On December 15, 2016, the Company entered into an Employment Agreement (the “Vizirgianakis Agreement”) with Stavros G. Vizirgianakis pursuant to which Mr. Vizirgianakis serves as the Company’s full time President and Chief Executive Officer. Mr. Vizirgianakis had been serving on an unpaid basis as interim Chief Executive Officer of the Company since September 2, 2016. Mr. Vizirgianakis continues to serve as a member of the Company’s Board of Directors.
Pursuant to the Vizirgianakis Agreement, Mr. Vizirgianakis’ initial term of employment runs through September 13, 2019, provided that the term shall be automatically renewed and extended for consecutive one (1) year renewal terms, unless either party sends to the other party a notice of non-renewal at least ninety (90) days prior to the expiration of the initial term or any then-current renewal term. Mr. Vizirgianakis will receive an annual base salary of not less than three hundred sixty thousand dollars ($360,000) per annum, subject to review by the Board at least annually for increase but not for decrease. Mr. Vizirgianakis is also eligible to receive annual bonuses in the discretion of the Board. The Vizirgianakis Agreement also provides for a one-time $10,000 moving allowance and reimbursement of counsel fees relating to visa matters and the negotiation of the Vizirgianakis Agreement. If the Company terminates Mr. Vizirgianakis’ employment without cause (as defined in the Vizirgianakis Agreement), the Company provides a notice of non-renewal, or Mr. Vizirgianakis terminates his employment for good reason (as defined in the Vizirgianakis Agreement), Mr. Vizirgianakis shall be entitled to receive (i) a lump-sum cash payment from the Company in an amount equal to one and one-half (1.5) times the annual base salary as is in effect immediately prior to the date of such termination, and (ii) continuation of all employee benefits and fringe benefits to which he was entitled under the Vizirgianakis Agreement immediately prior to such termination of employment for a period of eighteen (18) months following the termination of employment. The Vizirgianakis Agreement also contains non-competition and non-solicitation covenants from Mr. Vizirgianakis during the term of employment and for a period of 18 months thereafter.
37
In conjunction with the execution of the Vizirgianakis Agreement, Mr. Vizirgianakis received grants of an aggregate of 400,000 shares of restricted stock pursuant to the Company’s 2014 Employee Equity Incentive Plan (the “Plan”) as follows: (i) a grant of 134,000 shares vesting in five equal installments on September 1, 2017, 2018, 2019, 2020 and 2021; (ii) a performance grant of 133,000 shares which vests if both of the following conditions are satisfied simultaneously: (A) at any time prior to the third anniversary of the grant date, the most recent publicly reported trailing four (4) fiscal quarter revenue of the Company (exclusive of the impact of any acquisitions after the grant date) is at least $35,000,000 and (B) the closing price of the Company’s Common Stock is at least $10.50 per share (subject to adjustment for stock splits, stock dividends and the like) for ten (10) consecutive trading days; and (iii) a performance grant of 133,000 shares which vests if both of the following conditions are satisfied simultaneously: (A) at any time prior to the fifth anniversary of the grant date, the most recent publicly reported trailing four (4) fiscal quarter revenue of the Company (exclusive of the impact of any acquisitions after the grant date) is at least $48,000,000 and (B) the closing price of the Company’s Common Stock is at least $13.00 per share (subject to adjustment for stock splits, stock dividends and the like) for ten (10) consecutive trading days. The aforementioned performance grants will vest on a change of control in accordance with the Plan only if the applicable share price threshold is met in such transaction.
Dwyer Employment Agreement
On August 21, 2017, the Company entered into an Employment Agreement (the “Dwyer Agreement”) with Joseph P. Dwyer pursuant to which Mr. Dwyer serves as the Company’s full time Chief Financial Officer. Mr. Dwyer had been serving as Interim Chief Financial Officer of the Company since September 13, 2016.
Pursuant to the Dwyer Agreement, Mr. Dwyer’s initial term of employment runs through August 21, 2019, provided that the term shall be automatically renewed and extended for consecutive one (1) year renewal terms, unless either party sends to the other party a notice of non-renewal at least ninety (90) days prior to the expiration of the initial term or any then-current renewal term. Mr. Dwyer will receive an annual base salary of not less than two hundred seventy-five thousand dollars ($275,000) per annum, subject to review by the Board at least annually for increase but not for decrease. Mr. Dwyer is also eligible to receive annual bonuses in the discretion of the Board. If the Company terminates Mr. Dwyer’s employment without cause (as defined in the Dwyer Agreement), the Company provides a notice of non-renewal, or Mr. Dwyer terminates his employment for good reason (as defined in the Dwyer Agreement), Mr. Dwyer shall be entitled to receive (i) a lump-sum cash payment from the Company in an amount equal to fifty percent of the annual base salary if the applicable termination of employment takes place prior to the first anniversary of the effective date of the Dwyer Agreement or one hundred percent of the annual base salary if the applicable termination of employment takes place on or at any time after the first anniversary of the effective date of the Dwyer Agreement and (ii) continuation of all employee benefits and fringe benefits to which he was entitled under the Dwyer Agreement immediately prior to such termination of employment for a period of six or twelve months (as the case may be based upon the same time criteria as the cash severance) following the termination of employment. The Dwyer Agreement also contains non-competition and non-solicitation covenants from Mr. Dwyer during the term of employment and for a period of 12 months thereafter.
In conjunction with the execution of the Dwyer Agreement, Mr. Dwyer received a grant of a ten-year stock option to purchase one hundred thousand (100,000) shares (the “Dwyer Stock Option Award”) of Company common stock, under the Misonix, Inc. 2017 Equity Incentive Plan or another equity plan adopted by the Board and approved by the Company’s shareholders. The Dwyer Stock Option Award has an exercise price of $10.20 per share, which equals the fair market value as defined in the plan and vests and becomes exercisable in four equal annual installments from the date of grant.
Dwyer Consulting Agreement
On September 13, 2016, the Company appointed Joseph Dwyer as the Company’s interim Chief Financial Officer, reporting to the Company’s Chief Executive Officer and Audit Committee. The Company entered into a Consulting Agreement, dated September 13, 2016, with Dwyer Holdings LLC (“Dwyer Co.”) to provide Mr. Dwyer’s services to the Company (the “Dwyer Consulting Agreement”). The Dwyer Consulting Agreement was in effect for a one (1) year period, cancellable by either party upon five (5) days’ notice any time after the initial two (2) months of the term. Dwyer Co. was paid $30,000 per month for Mr. Dwyer’s services. On October 25, 2016, the Company entered into Amendment No. 1 to Consulting Agreement (the “Amendment”) with Dwyer Holdings LLC. The Amendment amended the Dwyer Consulting Agreement solely to: (i) require that the Company provide Mr. Dwyer with coverage under its directors’ and officers’ liability policy that is no less favorable than the coverage then provided to any other present or former executive, officer or director of the Company during the term of the Dwyer Consulting Agreement and for a period of at least five years thereafter and (ii) provide that should Mr. Dwyer be required or requested by the Company to provide documentary evidence or testimony in connection with any claim or legal matter arising from or connected with the services provided under the Dwyer Agreement, the Company shall pay all reasonable expenses (including fees of legal counsel) in complying therewith and, following the term of the Dwyer Consulting Agreement, $400 per hour for sworn testimony or preparation therefor payable in advance. The Dwyer Consulting Agreement was superseded by the Dwyer Agreement described above.
38
Executive Severance Agreements
On September 15, 2016, the Company and Robert S. Ludecker entered into a letter agreement (the “Ludecker Agreement”) which provides that in the event (i) Mr. Ludecker’s employment with the Company is terminated by the Company on or before September 15, 2018 for any reason other than for Cause (as defined in the Ludecker Agreement), the Company will pay him a one-time additional compensation equal to twelve (12) months annual base salary and (ii) of a Change in Control of Misonix (as defined in the Ludecker Agreement) and his employment by the Company or the acquiring company ceases (x) involuntarily or (y) voluntarily in accordance with the terms of the Ludecker Agreement, Mr. Ludecker will be entitled to a one-time additional compensation equal to twelve (12) months annual base salary. The Ludecker Agreement contains standard provisions regarding (i) execution of a release and covenant not to sue; (ii) cooperation; (iii) confidentiality; (iv) non-competition; (v) non-solicitation; and (vi) non-disparagement.
Summary of Potential Payments Upon Termination or Following a Change-In-Control
Severance Agreement and Severance Payments
Except as described above, we did not have severance agreements with any of our Executive Officers during fiscal 2018.
Change-in-Control and Change-in-Control Payments
In the event of a change-in-control, we are required to make certain change-in-control payments to Mr. Ludecker and Mr. Voic under the terms of the change-in-control agreements. The agreements provide for twelve (12) months base salary upon change in control of the Company.
The following table shows the benefits which would be received by each of our named executive officers for severance and change-in-control events (data with respect to equity awards assumes at change of control at June 30, 2018):
| Severance Payments | Change-in-Control Payments | |||||||||||||||||||||||||||
| Salary | Employee Benefits | Total | Salary | Employee Benefits | Equity Awards | Total | ||||||||||||||||||||||
| Stavros G. Vizirgianakis | $ | 556,200 | $ | 32,040 | $ | 588,240 | $ | — | $ | — | $ | 4,627,680 | $ | 4,627,680 | ||||||||||||||
| Joseph P. Dwyer | $ | 141,625 | $ | 10,000 | $ | 151,625 | $ | — | $ | — | $ | 245,800 | $ | 245,800 | ||||||||||||||
| Robert S. Ludecker | $ | 284,109 | $ | — | $ | 284,109 | $ | 284,109 | $ | — | $ | 646,040 | $ | 930,149 | ||||||||||||||
| Dan Voic | $ | — | $ | — | $ | — | $ | 193,912 | $ | — | $ | 784,600 | $ | 978,512 | ||||||||||||||
| Christopher H. Wright | $ | — | $ | — | $ | — | $ | — | $ | 303,625 | $ | 303,625 | ||||||||||||||||
39
Tax deductibility of Executive Compensation
Section 162 (m) of the Code limits to $1,000,000 per person the amount that we may deduct for compensation paid to any of our most highly compensated officers in any year. In fiscal 2018, there was no executive officer’s compensation that exceeded $1,000,000 other than Mr. Dwyer, who’s compensation was $1,050,720 for fiscal 2018.
Equity Plans
As of June 30, 2018, the Company had the following stock plans with options or other grants outstanding or available for issuance:
| Plan | Initial Shares | Granted | Exercised | Expired / Forfeited | Outstanding | Available For Issuance | ||||||||||||||||||
| 2001 Employee Stock Option Plan | 1,000,000 | 1,251,261 | 376,368 | 868,955 | 5,938 | — | ||||||||||||||||||
| 2005 Employee Equity Incentive Plan | 500,000 | 547,125 | 490,550 | 48,925 | 7,650 | — | ||||||||||||||||||
| 2005 Non Employee Director Stock Option Plan | 200,000 | 195,000 | 112,500 | 37,500 | 45,000 | — | ||||||||||||||||||
| 2009 Employee Equity Incentive Plan | 500,000 | 624,925 | 386,350 | 125,600 | 112,975 | 675 | ||||||||||||||||||
| 2009 Non Employee Director Stock Option Plan | 200,000 | 225,000 | 56,250 | 75,000 | 93,750 | 50,000 | ||||||||||||||||||
| 2012 Employee Equity Incentive Plan | 500,000 | 695,000 | 122,370 | 196,000 | 376,630 | 1,000 | ||||||||||||||||||
| 2012 Non Employee Director Stock Option Plan | 200,000 | 222,500 | 3,750 | 45,000 | 173,750 | 22,500 | ||||||||||||||||||
| 2014 Employee Equity Incentive Plan | 750,000 | 505,000 | 3,625 | 158,875 | 342,500 | 3,875 | ||||||||||||||||||
| 2017 Equity Incentive Plan | 750,000 | 172,000 | — | — | 172,000 | 578,000 | ||||||||||||||||||
| Total | 1,330,193 | 656,050 | ||||||||||||||||||||||
Director Compensation For Fiscal 2018
Directors are compensated through payment of a cash fee and annual stock option grants. Commencing on January 1, 2017 and effective on May 9, 2017, each non-employee director received an annual fee of $35,000 and the Chairman of the Audit Committee received $45,000. Each non-employee director was also reimbursed for reasonable expenses incurred while traveling to attend a meeting of the Board of Directors or while traveling in furtherance of the business of the Company.
The following table sets forth information for the fiscal year ended June 30, 2018 with respect to the compensation of our directors.
DIRECTOR COMPENSATION FOR THE 2018 FISCAL YEAR
| DIRECTOR COMPENSATION FOR THE 2018 FISCAL YEAR | ||||||||||||
| Name | Fees Earned or Paid in Cash ($) | Option Awards ($) | Total ($) | |||||||||
| John W. Gildea | $ | 35,000 | 74,905 | $ | 109,905 | |||||||
| Dr. Charles Miner III | $ | 35,000 | 74,905 | $ | 109,905 | |||||||
| Thomas M. Patton | $ | 45,000 | 112,357 | $ | 157,357 | |||||||
| Patrick A. McBrayer | $ | 35,000 | 99,873 | $ | 134,873 | |||||||
40
Outstanding options at June 30, 2018 were as follows: Mr. Gildea - 105,000 shares, Dr. Miner - 90,000 shares, Mr. McBrayer - 50,000 shares, and Mr. Patton - 37,500 shares.
Item 12. Security Ownership of Certain Beneficial Owners and Management and Related Stockholder Matters.
The following table sets forth as of August 15, 2018, certain information with regard to the ownership of the Company’s Common Stock by (i) each beneficial owner of 5% or more of the Company’s Common Stock; (ii) each director; (iii) each executive officer named in the “Summary Compensation Table” above; and (iv) all executive officers and directors of the Company as a group. Unless otherwise stated, the persons named in the table have sole voting and investment power with respect to all Common Stock shown as beneficially owned by them.
| Name and Address (1) | Common Stock Beneficially Owned | Percent Of Class | ||||||
| Stavros G. Vizirgianakis | 1,659,828 | (2) | 17.5 | % | ||||
| South Africa Alpha Capital Management Ltd. and Praesidium Capital Management (Pty) Ltd. | 502,270 | (3) | 5.3 | % | ||||
| Patrick A. McBrayer | 39,850 | (4) | * | |||||
| Charles Miner | 108,132 | (5) | 1.1 | % | ||||
| Thomas M. Patton | 35,000 | (6) | * | |||||
| Gwendolyn A. Watanabe | — | * | ||||||
| Joseph P. Dwyer | 26,300 | (7) | * | |||||
| Robert S. Ludecker | 147,693 | (8) | 1.5 | % | ||||
| Dan Voic | 255,144 | (9) | 2.7 | % | ||||
| Christopher H. Wright | 35,750 | (10) | * | |||||
| All executive officers and Directors as a group (Eleven people) | 2,320,697 | (11) | 23.4 | % | ||||
* Less than 1%
| (1) | Except as otherwise noted, the business address of each of the named individuals in this table is c/o MISONIX, INC., 1938 New Highway, Farmingdale, New York 11735. |
| (2) | Includes 18,750 shares which Mr. Vizirgianakis has the right to acquire upon exercise of stock options which are exercisable within 60 days. |
| (3) | Based upon information set forth in a Schedule 13G Amendment No. 1 filed with the SEC on February 14, 2018, by South Africa Alpha Capital Management Ltd. (“SAACM”) and Praesidium Capital Management (Pty) Ltd. (“PCM”). SAACM and PCM each hold shared voting and dispositive power over all of the indicated shares. SAACM’s business address is 69 Front Street, Hamilton, Bermuda, HM12; PCM’s business address is The Terraces, Block G, Steenberg Office Park, Silverwood Close, Tokai, Cape Town, South Africa. |
| (4) | Includes 38,750 shares which Mr. McBrayer has the right to acquire upon exercise of stock options which are exercisable within 60 days. |
| (5) | Includes 78,750 shares which Dr. Miner has the right to acquire upon exercise of stock options which are exercisable within 60 days. |
41
| (6) | Includes 30,000 shares which Mr. Patton has the right to acquire upon exercise of stock options which are exercisable within 60 days. |
| (7) | Includes 25,000 shares which Mr. Dwyer has the right to acquire upon exercise of stock options which are exercisable within 60 days. |
| (8) | Includes 138,250 shares which Mr. Ludecker has the right to acquire upon exercise of stock options which are exercisable within 60 days. |
| (9) | Includes 116,249 shares which Mr. Voic has the right to acquire upon exercise of stock options which are exercisable within 60 days. |
| (10) | Includes 33,750 shares which Mr. Wright has the right to acquire upon exercise of stock options which are exercisable within 60 days. |
| (11) | Includes 491,499 shares which such persons have the right to acquire upon exercise of stock options which are exercisable within 60 days. |
Equity Compensation Plan Information:
| Plan category | Number of securities to be issued upon exercise of outstanding options, warrants and rights | Weighted -average exercise price of outstanding options, warrants and rights | Number of securities remaining available for future issuance under equity compensation plans (excluding securities reflected in column (a)) | |||||||||
| (a) | (b) | (c) | ||||||||||
| Equity compensation plans approved by security holders | ||||||||||||
| I.2001 Plan | 5,938 | $ | 1.82 | — | ||||||||
| II. 2005 Plan | 7,650 | $ | 2.55 | — | ||||||||
| III. 2005 Directors Plan | 45,000 | $ | 2.49 | — | ||||||||
| IV. 2009 Plan | 112,975 | $ | 4.91 | 675 | ||||||||
| V. 2009 Directors Plan | 93,750 | $ | 7.18 | 50,000 | ||||||||
| VI. 2012 Plan | 376,630 | $ | 7.92 | 1,000 | ||||||||
| VII. 2012 Directors Plan | 173,750 | $ | 9.88 | 22,500 | ||||||||
| VIII. 2014 Plan | 342,500 | $ | 10.28 | 3,875 | ||||||||
| IX. 2017 Plan | 172,000 | $ | 10.22 | 578,000 | ||||||||
| Equity compensation plans not approved by security holders | — | — | — | |||||||||
| Total | 1,330,193 | $ | 8.53 | 656,050 | ||||||||
42
Item 13. Certain Relationships and Related Transactions, and Director Independence.
Director Compensation
Please see Item 11 - “Executive Compensation - Director Compensation” for a discussion of options granted and other compensation to our non-employee directors.
Executive Compensation
Please see Item 11 - “Executive Compensation” for additional information on compensation of our named executive officers.
Director Independence
The Company is required to have a Board of Directors a majority of whom are “independent” as defined by the Nasdaq listing standards and to disclose those Directors that the Board of Directors has determined to be independent. Based on such definition, the Board of Directors has determined that all Directors other than Stavros G. Vizirgianakis, who is an officer of the Company, are independent. See “Item 10. Directors, Executive Officers of the Registrant and Corporate Governance”.
Item 14. Principal Accountant Fees and Services.
Audit Fees
BDO USA, LLP (“BDO”) billed the Company $210,131 and $0 in the aggregate for services rendered for the audit of the Company’s 2018 and 2017 fiscal years, respectively, and the review of the Company’s interim financial statements included in the Company’s Quarterly Reports on Form 10-Q for the Company’s 2018 and 2017 fiscal years, respectively.
Audit-Related Fees
None.
Tax Fees and All Other Fees
BDO did not provide any tax services or other services to the Company during the fiscal years ended June 30, 2018 and 2017 respectively.
Policy on Pre-approval of Independent Registered Public Accounting Firm Services
The charter of the Audit Committee provides for the pre-approval of all audit services and all permitted non-audit services to be performed for Misonix by the independent registered public accounting firm, subject to the requirements of applicable law. The procedures for pre-approving all audit and non-audit services provided by the independent registered public accounting firm include the Audit Committee reviewing audit-related services, tax services and other services. The Audit Committee periodically monitors the services rendered by and actual fees paid to the independent registered public accounting firm to ensure that such services are within the parameters approved by the Audit Committee.
43
Item 15. Exhibits and Financial Statement Schedules.
| (a) | 1. | The response to this portion of Item 15 is submitted as a separate section of this Report. |
| 2. | Financial Statement Schedules | |
| Schedule II - Valuation and Qualifying Accounts. | ||
| 3. | Exhibits | |
| 3 (a) | Restated Certificate of Incorporation of the Company. (1) | |
| 3 (b) | By-laws of the Company. (2) | |
| 10.1 | Form of Indemnification Agreement. (3) | |
| 10.2 | Development and Option Agreement dated August 27, 1996 between the Company and United States Surgical Corporation. (4) | |
| 10.3 | License Agreement dated October 16, 1996 between the Company and United States Surgical Corporation. (4) | |
| * | 10.4 | 1996 Non-Employee Director Stock Option Plan. (5) |
| * | 10.5 | 1996 Employee Incentive Stock Option Plan. (5) |
| * | 10.6 | 1998 Employee Stock Option Plan. (6) |
| * | 10.7 | 2001 Employee Stock Option Plan. (7) |
| * | 10.8 | 2005 Employee Equity Incentive Plan. (8) |
| * | 10.9 | 2005 Non-Employee Director Stock Option Plan. (8) |
| * | 10.10 | 2009 Employee Equity Incentive Plan. (9) |
| * | 10.11 | 2009 Non-Employee Director Stock Option Plan. (9) |
44
45
| 101.INS XBRL Instance Document | ||
| 101.SCH XBRL Taxonomy Extension Scheme Document | ||
| 101.CAL XBRL Taxonomy Extension Calculation Linkbase Document | ||
| 101.DEF XBRL Taxonomy Extension Definition Linkbase Document | ||
| 101.LAB XBRL Taxonomy Extension Label Linkbase Document | ||
| 101.PRE XBRL Taxonomy Extension Presentation Linkbase Document | ||
| *Denotes management compensation plan, agreement or arrangement. | ||
| (1) | Incorporated by reference from the Company’s Registration Statement on Form S-8 (Reg. No. 333-165088). |
| (2) | Incorporated by reference from the Company’s Current Report on Form 8-K filed on October 3, 2014. |
| (3) | Incorporated by reference from the Company’s Annual Report on Form 10-K for the fiscal year ended June 30, 2011. |
| (4) | Incorporated by reference from the Company’s Annual Report on Form 10-KSB for the fiscal year ended June 30, 1997. |
| (5) | Incorporated by reference from the Company’s definitive proxy statement for the Annual Meeting of Shareholders held on February 19, 1997. |
| (6) | Incorporated by reference from the Company’s Registration Statement on Form S-8 (Reg. No. 333-78795). |
| (7) | Incorporated by reference from the Company’s Registration Statement on Form S-8 (Reg. No. 333-63166). |
| (8) | Incorporated by reference from the Company’s definitive proxy statement for the Annual Meeting of Shareholders held on December 14, 2005. |
| (9) | Incorporated by reference from the Company’s definitive proxy statement for the Annual Meeting of Shareholders held on December 8, 2009. |
| (10) | Incorporated by reference from the Company’s Current Report on Form 8-K filed on June 4, 2010. |
| (11) | Incorporated by reference from the Company’s Current Report on Form 8-K filed on November 15, 2011. |
| (12) | Incorporated by reference from the Company’s Current Report on Form 8-K filed on September 13, 2012. |
| (13) | Incorporated by reference from the Company’s Current Report on Form 8-K filed on May 10, 2013. |
46
| (14) | Incorporated by reference from the Company’s definitive proxy statement for the Annual Meeting of Shareholders held on December 4, 2012. |
| (15) | Incorporated by reference from the Company’s definitive proxy statement for the Annual Meeting of Shareholders held on February 3, 2015. |
| (16) | Incorporated by reference by the Company’s Current Report on Form 8-K filed on May 26, 2015. |
| (17) | Incorporated by reference from the Company’s Current Report on Form 8-K filed on July 8, 2015. |
| (18) | Incorporated by reference from the Company’s Current Report on Form 8-K filed on August 26, 2016. |
| (19) | Incorporated by reference from the Company’s Current Report on Form 8-K filed on September 14, 2016. |
| (20) | Incorporated by reference from the Company’s Current Report on Form 8-K filed on September 16, 2016. |
| (21) | Incorporated by reference from the Company’s Current Report on Form 8-K filed on October 25, 2016. |
| (22) | Incorporated by reference from the Company’s Current Report on Form 8-K filed on December 19, 2016. |
| (23) | Incorporated by reference from the Company’s Registration Statement on Form S-8 filed on July 19, 2017. |
| (24) | Incorporated by reference from the Company’s Current Report on Form 8-K filed on August 23, 2017. |
| (25) | Incorporated by reference from the Company’s Current Report on Form 8-K filed on September 18, 2017. |
| (26) | Incorporated by reference from the Company’s Quarterly Report on Form 10-Q filed on February 6, 2018. |
| (27) | Incorporated by reference from the Company’s Quarterly Report on Form 10-Q filed on May 7, 2018. |
Not applicable.
47
Pursuant to the requirements of Section 13 or 15(d) of the Securities Exchange Act of 1934, the registrant has duly caused this report to be signed on its behalf by the undersigned, thereunto duly authorized.
| MISONIX, INC. | ||
| By: | /s/ Stavros G. Vizirgianakis | |
| Stavros G. Vizirgianakis | ||
| Chief Executive Officer | ||
Date: September 13, 2018
Pursuant to the requirements of the Securities Exchange Act of 1934, this report has been signed below by the following persons on behalf of the registrant and in the capacities and on the dates indicated.
| Signature | Title | Date | ||
| /s/ Stavros G. Vizirgianakis | Chief Executive Officer and Director | September 13, 2018 | ||
| Stavros G. Vizirgianakis | (principal executive officer) | |||
| /s/ Joseph P. Dwyer | Chief Financial Officer | September 13, 2018 | ||
| Joseph P. Dwyer | (principal financial and accounting officer) | |||
| /s/ Patrick A. McBrayer | Director | September 13, 2018 | ||
| Patrick A. McBrayer | ||||
| /s/ Charles Miner III | Director | September 13, 2018 | ||
| Charles Miner III | ||||
| /s/ Thomas M. Patton | Director | September 13, 2018 | ||
| Thomas M. Patton | ||||
| /s/ Gwendolyn A. Watanabe | Director | September 13, 2018 | ||
| Gwendolyn A. Watanabe | ||||
48
INDEX TO CONSOLIDATED FINANCIAL STATEMENTS
MISONIX, INC. and Subsidiaries
For the years ended June 30, 2018, June 30, 2017 and June 30, 2016
| Page | ||
| Report of Independent Registered Public Accounting Firm | F-2 | |
| Report of Independent Registered Public Accounting Firm | F-4 | |
| Consolidated Balance Sheets - June 30, 2018 and 2017 | F-5 | |
| Consolidated Statements of Operations - Years Ended June 30, 2018, 2017 and 2016 | F-6 | |
| Consolidated Statements of Shareholders’ Equity - Years Ended June 30, 2018, 2017 and 2016 | F-7 | |
| Consolidated Statements of Cash Flows - Years Ended June 30, 2018, 2017 and 2016 | F-8 | |
| Notes to Consolidated Financial Statements | F-9 | |
| The following consolidated financial statement schedule is included in Item 15(a)(2): | ||
| Schedule II - Valuation and Qualifying Accounts | F-26 |
All other schedules for which provision is made in the applicable accounting regulations of the SEC are not required under the related instructions or are not applicable and therefore have been omitted.
F-1
REPORT OF INDEPENDENT REGISTERED PUBLIC ACCOUNTING FIRM
Board of Directors and Shareholders
MISONIX, INC.
Farmingdale, New York
Opinion on the Consolidated Financial Statements
We have audited the accompanying consolidated balance sheet of MISONIX, INC. and its Subsidiaries (collectively, the “Company”) as of June 30, 2018, and the related consolidated statement of operations, shareholders’ equity and cash flows for the year ended June 30, 2018, and the related notes and financial statement schedule listed in the accompanying index (collectively referred to as the “consolidated financial statements”). In our opinion, the consolidated financial statements present fairly, in all material respects, the financial position of the Company at June 30, 2018, and the results of its operations and its cash flows for the year ended June 30, 2018, in conformity with accounting principles generally accepted in the United States of America.
We also have audited, in accordance with the standards of the Public Company Accounting Oversight Board (United States) (“PCAOB”), the Company’s internal control over financial reporting as of June 30, 2018, based on criteria established in Internal Control – Integrated Framework (2013) issued by the Committee of Sponsoring Organizations of the Treadway Commission and our report dated September 13, 2018 expressed an adverse opinion thereon.
Basis for Opinion
These consolidated financial statements are the responsibility of the Company’s management. Our responsibility is to express an opinion on the Company’s consolidated financial statements based on our audit. We are a public accounting firm registered with the PCAOB and are required to be independent with respect to the Company in accordance with the U.S. federal securities laws and the applicable rules and regulations of the Securities and Exchange Commission and the PCAOB.
We conducted our audits in accordance with the standards of the PCAOB. Those standards require that we plan and perform the audit to obtain reasonable assurance about whether the financial statements are free of material misstatement, whether due to error or fraud.
Our audits included performing procedures to assess the risks of material misstatement of the consolidated financial statements, whether due to error or fraud, and performing procedures that respond to those risks. Such procedures including examining, on a test basis, evidence regarding the amounts and disclosures in the consolidated financial statements. Our audits also included evaluating the accounting principles used and significant estimates made by management, as well as evaluating the overall presentation of the consolidated financial statements. We believe that our audits provide a reasonable basis for our opinion.
Emphasis of Matter
As discussed in Note 1 to the consolidated financial statements, during the year ended June 30, 2018, the Company adopted FASB issued Accounting Standards Update No. 2016-09 “Compensation—Stock Compensation (Topic 718)”. As a result, the Company recorded a cumulative impact adjustment to accumulated deficit upon adoption. Our opinion is not modified with respect to this matter.
/s/ BDO USA, LLP
We have served as the Company’s auditor since 2017.
Melville, New York
September 13, 2018
F-2
Board of Directors and Shareholders
MISONIX, INC.
We have audited the accompanying consolidated balance sheet of MISONIX, INC. and Subsidiaries (collectively, the “Company”) as of June 30, 2017, and the related consolidated statements of operations, shareholders’ equity and cash flows for the years ended June 30, 2017 and 2016. Our audits of the basic consolidated financial statements included the financial statement schedule listed in the index appearing under Item 15(a)(2). These financial statements and financial statement schedule are the responsibility of the Company’s management. Our responsibility is to express an opinion on these financial statements and financial statement schedule based on our audits.
We conducted our audits in accordance with the standards of the Public Company Accounting Oversight Board (United States). Those standards require that we plan and perform the audit to obtain reasonable assurance about whether the financial statements are free of material misstatement. An audit includes examining, on a test basis, evidence supporting the amounts and disclosures in the financial statements. An audit also includes assessing the accounting principles used and significant estimates made by management, as well as evaluating the overall financial statement presentation. We believe that our audits provide a reasonable basis for our opinion.
In our opinion, the consolidated financial statements referred to above present fairly, in all material respects, the financial position of MISONIX, INC. and Subsidiaries as of June 30, 2017, and the results of their operations and their cash flows for the years ended June 30, 2017 and 2016 in conformity with accounting principles generally accepted in the United States of America. Also in our opinion, the related financial statement schedule, when considered in relation to the basic consolidated financial statements taken as a whole, present fairly, in all material respects, the information set forth therein.
/s/ GRANT THORNTON LLP
Boston, Massachusetts
August 24, 2017
F-3
REPORT OF INDEPENDENT REGISTERED PUBLIC ACCOUNTING FIRM
Board of Directors and Shareholders
MISONIX, INC.
Farmingdale, New York
Opinion on Internal Control over Financial Reporting
We have audited Misonix’s internal control over financial reporting as of June 30, 2018, based on criteria established in Internal Control-Integrated Framework (2013) issued by the Committee of Sponsoring Organizations of the Treadway Commission (the COSO criteria). In our opinion, the Company did not maintain, in all material respects, effective internal control over financial reporting as of June 30, 2018, based on the COSO criteria.
We do not express an opinion or any other form of assurance on management’s statements referring to any corrective actions taken by the Company after the date of management’s assessment.
We also have audited, in accordance with the standards of the Public Company Accounting Oversight Board (United States), the consolidated balance sheets of Misonix, Inc. as of June 30, 2018, and the related consolidated statements of operations, shareholders’ equity, and cash flows for the year then ended and our report dated September 13, 2018 expressed an unqualified opinion thereon and included an emphasis-of matter paragraph regarding the adoption of FASB issued Accounting Standards Updated No. 2016-09 “Compensation-Stock Compensation (Topic 718)”, as discussed in Note 1 to the consolidated financial statements.
Basis for Opinion
The Company’s management is responsible for maintaining effective internal control over financial reporting and for its assessment of the effectiveness of internal control over financial reporting, included in the accompanying Item 9A, Management’s Report on Internal Control over Financial Reporting. Our responsibility is to express an opinion on the Company’s internal control over financial reporting based on our audit. We are a public accounting firm registered with the PCAOB and are required to be independent with respect to the Company in accordance with U.S. federal securities laws and the applicable rules and regulations of the Securities and Exchange Commission and the PCAOB.
We conducted our audit of internal control over financial reporting in accordance with the standards of the PCAOB. Those standards require that we plan and perform the audit to obtain reasonable assurance about whether effective internal control over financial reporting was maintained in all material respects. Our audit included obtaining an understanding of internal control over financial reporting, assessing the risk that a material weakness exists, and testing and evaluating the design and operating effectiveness of internal control based on the assessed risk. Our audit also included performing such other procedures as we considered necessary in the circumstances. We believe that our audit provides a reasonable basis for our opinion.
A material weakness is a deficiency, or a combination of deficiencies, in internal control over financial reporting, such that there is a reasonable possibility that a material misstatement of the company’s annual or interim financial statements will not be prevented or detected on a timely basis. A material weakness regarding management’s failure to design and maintain controls over a lack of consistency in the approval of manual journal entries to the general ledger has been identified and described in management’s assessment. This material weakness was considered in determining the nature, timing, and extent of audit tests applied in our audit of the 2018 financial statements, and this report does not affect our report dated September 13, 2018 on those financial statements.
Definition and Limitations of Internal Control over Financial Reporting
A company’s internal control over financial reporting is a process designed to provide reasonable assurance regarding the reliability of financial reporting and the preparation of financial statements for external purposes in accordance with generally accepted accounting principles. A company’s internal control over financial reporting includes those policies and procedures that (1) pertain to the maintenance of records that, in reasonable detail, accurately and fairly reflect the transactions and dispositions of the assets of the company; (2) provide reasonable assurance that transactions are recorded as necessary to permit preparation of financial statements in accordance with generally accepted accounting principles, and that receipts and expenditures of the company are being made only in accordance with authorizations of management and directors of the company; and (3) provide reasonable assurance regarding prevention or timely detection of unauthorized acquisition, use, or disposition of the company’s assets that could have a material effect on the financial statements.
Because of its inherent limitations, internal control over financial reporting may not prevent or detect misstatements. Also, projections of any evaluation of effectiveness to future periods are subject to the risk that controls may become inadequate because of changes in conditions, or that the degree of compliance with the policies or procedures may deteriorate.
/s/ BDO USA, LLP
Melville, New York
September 13, 2018
F-4
MISONIX, INC. and Subsidiaries
| June 30, 2018 | June 30, 2017 | |||||||
| Assets | ||||||||
| Current assets: | ||||||||
| Cash and cash equivalents | $ | 10,979,455 | $ | 11,557,071 | ||||
| Accounts receivable, less allowance for doubtful accounts of $200,000 and $96,868, respectively | 5,245,549 | 5,133,389 | ||||||
| Inventories, net | 5,019,886 | 4,992,434 | ||||||
| Prepaid expenses and other current assets | 611,647 | 918,899 | ||||||
| Total current assets | 21,856,537 | 22,601,793 | ||||||
| Property, plant and equipment, net of accumulated amortization and depreciation of $9,023,235 and $6,976,282, respectively | 4,188,378 | 3,730,203 | ||||||
| Patents, net of accumulated amortization of $1,063,393 and $885,394, respectively | 757,447 | 719,136 | ||||||
| Goodwill | 1,701,094 | 1,701,094 | ||||||
| Intangible and other assets | 517,295 | 282,876 | ||||||
| Deferred income tax | — | 4,334,547 | ||||||
| Total assets | $ | 29,020,751 | $ | 33,369,649 | ||||
| Liabilities and shareholders’ equity | ||||||||
| Current liabilities: | ||||||||
| Accounts payable | $ | 1,794,098 | $ | 1,861,228 | ||||
| Accrued expenses and other current liabilities | 2,812,172 | 3,346,138 | ||||||
| Total current liabilities | 4,606,270 | 5,207,366 | ||||||
| Deferred lease liability | — | 9,354 | ||||||
| Deferred income | 13,303 | 13,087 | ||||||
| Total liabilities | 4,619,573 | 5,229,807 | ||||||
| Commitments and contingencies (Note 7) | ||||||||
| Shareholders’ equity: | ||||||||
| Common stock, $.01 par value-shares authorized 40,000,000; 9,430,466 and 9,357,166 shares issued and outstanding in each period | 94,305 | 93,572 | ||||||
| Additional paid-in capital | 39,772,973 | 36,808,810 | ||||||
| Accumulated deficit | (15,466,100 | ) | (8,762,540 | ) | ||||
| Total shareholders’ equity | 24,401,178 | 28,139,842 | ||||||
| Total liabilities and shareholders’ equity | $ | 29,020,751 | $ | 33,369,649 | ||||
See Accompanying Notes to Consolidated Financial Statements.
F-5
MISONIX, INC. and Subsidiaries
Consolidated Statements of Operations
| For the years ended | ||||||||||||
| June 30, | ||||||||||||
| 2018 | 2017 | 2016 | ||||||||||
| Revenues | ||||||||||||
| Product | $ | 32,669,826 | $ | 27,269,963 | $ | 23,113,194 | ||||||
| License | 4,010,000 | $ | — | $ | — | |||||||
| Total revenue | $ | 36,679,826 | $ | 27,269,963 | $ | 23,113,194 | ||||||
| Cost of goods sold | 9,794,898 | 8,217,439 | 7,640,626 | |||||||||
| Gross profit | 26,884,928 | 19,052,524 | 15,472,568 | |||||||||
| Operating expenses: | ||||||||||||
| Selling expenses | 16,368,381 | 14,220,907 | 12,632,961 | |||||||||
| General and administrative expenses | 9,063,139 | 9,595,206 | 6,829,516 | |||||||||
| Research and development expenses | 4,394,149 | 1,837,497 | 1,839,479 | |||||||||
| Total operating expenses | 29,825,669 | 25,653,610 | 21,301,956 | |||||||||
| Loss from operations | (2,940,741 | ) | (6,601,086 | ) | (5,829,388 | ) | ||||||
| Other income (expense): | ||||||||||||
| Interest income | 26,123 | 75 | 81 | |||||||||
| Royalty income | 525,438 | 3,771,610 | 3,948,757 | |||||||||
| Other | 2,274 | (36,211 | ) | (21,878 | ) | |||||||
| Total other income | 553,835 | 3,735,474 | 3,926,960 | |||||||||
| (Loss) from continuing operations before income taxes | (2,386,906 | ) | (2,865,612 | ) | (1,902,428 | ) | ||||||
| Income tax expense (benefit) | 5,416,646 | (1,022,808 | ) | (573,351 | ) | |||||||
| Net (loss) from continuing operations | (7,803,552 | ) | (1,842,804 | ) | (1,329,077 | ) | ||||||
| Discontinued operations: | ||||||||||||
| Gain from sale of discontinued operations net of tax of $58,883, $88,375 and $93,069, respectively | 191,117 | 161,625 | 156,931 | |||||||||
| Net income from discontinued operations | 191,117 | 161,625 | 156,931 | |||||||||
| Net (loss) | $ | (7,612,435 | ) | $ | (1,681,179 | ) | $ | (1,172,146 | ) | |||
| Net income (loss) per share: | ||||||||||||
| Continuing operations: | ||||||||||||
| Basic | $ | (0.87 | ) | $ | (0.22 | ) | $ | (0.17 | ) | |||
| Diluted | $ | (0.87 | ) | $ | (0.22 | ) | $ | (0.17 | ) | |||
| Discontinued operations | ||||||||||||
| Basic | $ | 0.02 | $ | 0.02 | $ | 0.02 | ||||||
| Diluted | $ | 0.02 | $ | 0.02 | $ | 0.02 | ||||||
| Combined | ||||||||||||
| Basic | $ | (0.85 | ) | $ | (0.20 | ) | $ | (0.15 | ) | |||
| Diluted | $ | (0.85 | ) | $ | (0.20 | ) | $ | (0.15 | ) | |||
| Weighted average shares - Basic | 9,009,189 | 8,398,778 | 7,776,949 | |||||||||
| Weighted average shares - Diluted | 9,009,189 | 8,398,778 | 7,776,949 | |||||||||
See Accompanying Notes to Consolidated Financial Statements.
F-6
MISONIX, INC. and Subsidiaries
Consolidated Statements of Shareholders’ Equity
| Common Stock, | ||||||||||||||||||||||||||||
| $.01 Par Value | Treasury Stock | Additional | Total | |||||||||||||||||||||||||
| Number | Number | paid-in | Accumulated | shareholders’ | ||||||||||||||||||||||||
| of shares | Amount | of shares | Amount | capital | deficit | equity | ||||||||||||||||||||||
| Balance, June 30, 2015 | 7,869,095 | $ | 78,691 | (124,982 | ) | $ | (946,260 | ) | $ | 30,531,129 | $ | (5,909,215 | ) | $ | 23,754,345 | |||||||||||||
| Net (loss) | — | — | — | — | — | (1,172,146 | ) | (1,172,146 | ) | |||||||||||||||||||
| Proceeds from exercise of stock options | 79,139 | 791 | (13,867 | ) | (153,092 | ) | 341,748 | — | 189,447 | |||||||||||||||||||
| Stock-based compensation | — | — | — | — | 1,629,644 | — | 1,629,644 | |||||||||||||||||||||
| Balance, June 30, 2016 | 7,948,234 | $ | 79,482 | (138,849 | ) | $ | (1,099,352 | ) | $ | 32,502,521 | $ | (7,081,361 | ) | $ | 24,401,290 | |||||||||||||
| Net (loss) | — | — | — | — | — | (1,681,179 | ) | (1,681,179 | ) | |||||||||||||||||||
| Sale of common stock | 761,469 | 7,615 | — | — | 3,992,385 | 4,000,000 | ||||||||||||||||||||||
| Issuance of restricted stock | 400,000 | 4,000 | — | — | (4,000 | ) | — | — | ||||||||||||||||||||
| Proceeds from exercise of stock options | 247,463 | 2,475 | 138,849 | 1,099,352 | (768,235 | ) | — | 333,592 | ||||||||||||||||||||
| Stock-based compensation | — | — | — | — | 1,086,139 | — | 1,086,139 | |||||||||||||||||||||
| Balance, June 30, 2017 | 9,357,166 | $ | 93,572 | — | $ | — | $ | 36,808,810 | $ | (8,762,540 | ) | $ | 28,139,842 | |||||||||||||||
| Implementation of new accounting standard | 908,875 | 908,875 | ||||||||||||||||||||||||||
| Net (loss) | — | — | — | — | — | (7,612,435 | ) | (7,612,435 | ) | |||||||||||||||||||
| Proceeds from exercise of stock options | 73,300 | 733 | — | — | 335,335 | — | 336,068 | |||||||||||||||||||||
| Stock-based compensation | — | — | — | — | 2,628,828 | — | 2,628,828 | |||||||||||||||||||||
| Balance, June 30, 2018 | 9,430,466 | $ | 94,305 | — | $ | — | $ | 39,772,973 | $ | (15,466,100 | ) | $ | 24,401,178 | |||||||||||||||
See Accompanying Notes to Consolidated Financial Statements.
F-7
MISONIX, INC. and Subsidiaries
Consolidated Statements of Cash Flows
| For the years ended June 30, | ||||||||||||
| 2018 | 2017 | 2016 | ||||||||||
| Operating activities | ||||||||||||
| Net (loss) | $ | (7,612,435 | ) | $ | (1,681,179 | ) | $ | (1,172,146 | ) | |||
| Net (income) from discontinued operations | (191,117 | ) | (161,625 | ) | (156,931 | ) | ||||||
| Adjustments to reconcile net (loss) to net cash used in continuing operating activities: | ||||||||||||
| Depreciation and amortization | 1,427,225 | 1,066,844 | 1,651,972 | |||||||||
| Bad debt expense | 55,390 | — | (30,000 | ) | ||||||||
| Deferred income tax expense (benefit) | 5,243,422 | (939,857 | ) | (502,262 | ) | |||||||
| Stock-based compensation | 2,628,828 | 1,086,139 | 1,629,644 | |||||||||
| Deferred income | 216 | (18,598 | ) | (8,966 | ) | |||||||
| Deferred lease liability | (9,354 | ) | 92 | 9,262 | ||||||||
| Changes in operating assets and liabilities: | ||||||||||||
| Accounts receivable | (167,550 | ) | (1,263,962 | ) | 641,820 | |||||||
| Inventories | (1,410,356 | ) | (873,136 | ) | (2,823,304 | ) | ||||||
| Prepaid expenses and other assets | 72,833 | (404,608 | ) | (186,211 | ) | |||||||
| Accounts payable, accrued expenses | (601,096 | ) | 1,917,232 | 630,882 | ||||||||
| Net cash used in continuing operations | (563,994 | ) | (1,272,658 | ) | (316,240 | ) | ||||||
| Investing activities | ||||||||||||
| Acquisition of property, plant and equipment | (375,419 | ) | (490,421 | ) | (471,829 | ) | ||||||
| Additional patents | (165,388 | ) | (224,394 | ) | (132,731 | ) | ||||||
| Net cash used in investing continuing activities | (540,807 | ) | (714,815 | ) | (604,560 | ) | ||||||
| Net cash provided by investing activities - discontinued operations | 191,117 | 161,625 | 156,931 | |||||||||
| Net cash used in investing activities | (349,690 | ) | (553,190 | ) | (447,629 | ) | ||||||
| Financing activities | ||||||||||||
| Proceeds from sale of common stock | — | 4,000,000 | — | |||||||||
| Proceeds from exercise of stock options | 336,068 | 333,592 | 189,447 | |||||||||
| Net cash provided by financing activities from continuing operations | 336,068 | 4,333,592 | 189,447 | |||||||||
| Net (decrease)/increase in cash and cash equivalents | (577,616 | ) | 2,507,744 | (574,422 | ) | |||||||
| Cash and cash equivalents at beginning of period | 11,557,071 | 9,049,327 | 9,623,749 | |||||||||
| Cash and cash equivalents at end of period | $ | 10,979,455 | $ | 11,557,071 | $ | 9,049,327 | ||||||
| Supplemental disclosure of cash flow information: | ||||||||||||
| Cash paid for: | ||||||||||||
| Income taxes | $ | 704 | $ | 10,179 | $ | 140,931 | ||||||
| Transfer of inventory to property, plant and equipment for the consignment of product | $ | 1,382,904 | $ | 1,703,637 | $ | 1,303,532 | ||||||
See Accompanying Notes to Consolidated Financial Statements.
F-8
MISONIX, INC. and Subsidiaries
Notes to Consolidated Financial Statements
For the Years Ended June 30, 2018, 2017, and 2016
1. Basis of Presentation, Organization and Business and Summary of Significant Accounting Policies
Basis of Presentation
These consolidated financial statements of Misonix, Inc. (“Misonix” or the “Company”) include the accounts of Misonix and its 100% owned subsidiaries. All significant intercompany balances and transactions have been eliminated.
Organization and Business
Misonix designs, manufactures, develops and markets therapeutic ultrasonic devices. These products are used for precise bone sculpting, removal of soft tumors, and tissue debridement in the fields of orthopedic surgery, plastic surgery, neurosurgery, podiatry and vascular surgery. In the United States, our products are marketed primarily through a hybrid sales approach. This includes direct sales representatives, managed by regional sales managers, along with independent distributors. Outside the United States, we sell BoneScalpel and SonaStar to specialty distributors who purchase products from us to resell to their clinical customer bases. We sell to all major markets in the Americas, Europe, Middle East, Asia Pacific and Africa. The Company operates as one business segment.
High Intensity Focused Ultrasound Technology
The Company sold its rights to the high intensity focused ultrasound technology to SonaCare Medical, LLC (“SonaCare”) in May 2010. The Company may receive up to approximately $5.8 million in payment for the sale. SonaCare will pay the Company 7% of the gross revenues received from its sales of the (i) prostate product in Europe and (ii) kidney and liver products worldwide, until the Company has received payments of $3 million, and thereafter 5% of the gross revenues, up to an aggregate payment of $5.8 million, all subject to a minimum annual royalty of $250,000. Cumulative payments through June 30, 2018 were $2,542,579.
Cash and Cash Equivalents
The Company considers all highly liquid debt instruments purchased with a maturity of three months or less to be cash equivalents. All of the Company’s cash is maintained in bank accounts and accordingly it does not have cash equivalents at June 30, 2018. The Company’s cash balance at June 30, 2018 was $10,979,455.
The Company maintains cash balances at various financial institutions. At June 30, 2018, these financial institutions held cash that was approximately $10,729,455 in excess of amounts insured by the Federal Deposit Insurance Corporation and other government agencies.
Major Customers and Concentration of Credit Risk
Included in sales from continuing operations are sales to the Company distributor of SonaStar in China of $6,969,258, $0 and $0, for the fiscal years ended June 30, 2018, 2017 and 2016, respectively, inclusive of product licensing fees of $4,010,000. Accounts receivable from this customer were $293,915 at June 30, 2018.
Total royalties from Medtronic Minimally Invasive Therapies (“MMIT”) related to their sales of the Company’s ultrasonic cutting and sculpting products, which use high frequency sound waves to coagulate and divide tissue for both open and laparoscopic surgery, were $525,000, $3,764,000 and $3,903,000 for the fiscal years ended June 30, 2018, 2017 and 2016, respectively. Accounts receivable from MMIT royalties were $0 and $925,000 at June 30, 2018 and 2017, respectively. The license agreement with MMIT expired in August 2017.
At June 30, 2018 and 2017, the Company’s accounts receivable with customers outside the United States were approximately $1,630,000 and $860,000, respectively, none of which is over 90 days.
F-9
Use of Estimates
The preparation of financial statements in conformity with accounting principles generally accepted in the United States requires management to make estimates and judgments that affect the reported amount of assets and liabilities and disclosure of contingent assets and liabilities at the date of the financial statements and the reported amounts of revenues and expenses during the reporting period. Significant estimates and assumptions are used for but not limited to establishing the allowance for doubtful accounts, valuation of inventory, depreciation, asset impairment evaluations and establishing deferred tax assets and related valuation allowances, and stock-based compensation. Actual results could differ from those estimates.
Accounts Receivable
Accounts receivable, principally trade, are generally due within 30 to 90 days and are stated at amounts due from customers, net of an allowance for doubtful accounts. The Company performs ongoing credit evaluations and adjusts credit limits based upon payment history and the customer’s current credit worthiness, as determined by a review of their current credit information. The Company continuously monitors aging reports, collections and payments from customers and maintains a provision for estimated credit losses based upon historical experience and any specific customer collection issues that have been identified. While such credit losses have historically been within expectations and the provisions established, the Company cannot guarantee that the same credit loss rates will be experienced in the future. The Company writes off accounts receivable when they become uncollectible.
Inventories
Inventories are stated at the lower of cost (first-in, first-out) or net realizable value and consist of raw materials, work-in process and finished goods and include purchased materials, direct labor and manufacturing overhead. Management evaluates the need to record adjustments to write down inventory to the lower of cost or net realizable value on a quarterly basis. The Company’s policy is to assess the valuation of all inventories, including raw materials, work-in-process and finished goods and it writes down its inventory for estimated obsolescence based upon the age of inventory and assumptions about future demand and usage. Inventory items used for demonstration purposes, rentals or on consignment are classified as property, plant and equipment.
Property, Plant and Equipment
Property, plant and equipment are recorded at cost. Minor replacements and maintenance and repair expenses are charged to expense as incurred. Depreciation of property and equipment is provided using the straight-line method over estimated useful lives ranging from 3 to 5 years. Leasehold improvements are amortized over the life of the lease or the useful life of the related asset, whichever is shorter. The Company’s policy is to periodically evaluate the appropriateness of the lives assigned to property, plant and equipment and make adjustments if necessary. Inventory items included in property, plant and equipment are depreciated using the straight line method over estimated useful lives of 3 to 5 years. Depreciation of BoneScapel and Sonic OneOR generators which are consigned to customers are depreciated over a 5 year period, and depreciation is charged to selling expenses. See Note 4.
Revenue Recognition
The Company records revenue upon shipment for products shipped F.O.B. shipping point. Products shipped F.O.B. destination points are recorded as revenue when received at the point of destination. Shipments under agreements with distributors are not subject to return, and payment for these shipments is not contingent on sales by the distributor. Accordingly, the Company recognizes revenue on shipments to distributors in the same manner as with other customers. Service contracts and royalty income are recognized when earned. The Company generally warrantees its product for a 12 month period, and accordingly records a related warranty reserve. Historical warranty costs have not been significant.
The Company presents taxes collected from customers and remitted to governmental authorities in the consolidated statements of operations on a net basis.
F-10
License revenue is recorded when 1) a contract has been executed, 2) the underlying intellectual property has been transferred, 3) the payment terms are identified and 4) the risk of a reversal of revenue from lack of receipt of consideration or other factors has passed. License revenue for the years ended June 30, 2018, 2017 and 2016 was $4,010,000, $0 and $0, respectively.
On October 19, 2017, the Company entered into a License and Exclusive Manufacturing Agreement (the “Agreement”) with Hunan Xing Hang Rui Kang Bio-technologies Co., Ltd., a Chinese corporation (the “Licensee”or “Hunan” ) under which Misonix has licensed certain manufacturing and distribution rights to its SonaStar product line in China, Hong Kong and Macau (the “Territory”) in exchange for payments totaling at least $11,000,000.
The Agreement with Hunan provides for the following three primary revenue streams:
| a) | Sales of Misonix SonaStar products, totaling $990,000, which have been recognized as product revenue when the products were shipped. For the quarters ended September 30, 2017, December 31, 2017 and March 31, 2018, revenue of $270,000, $570,000 and $150,000, respectively, was recognized from these product shipments, which completed the initial product shipment requirement under the Agreement. |
| b) | A technology license fee of $4,010,000, relating to the granting of a technology license to Hunan, allowing Hunan to manufacture and sell SonaStar products in China. The applicable technology was delivered to Hunan in the quarter ended March 31, 2018, and the license fee was recorded in full in that quarter. This technology license fee will be accounted for as “Revenue - License” in our statement of operations in the quarter ended March 31, 2018. |
| c) | A royalty fee based on the number of generators manufactured and sold by Hunan in China during the initial 10 year term of the Agreement. For the calendar years 2019, 2020 and 2021, Hunan will pay a minimum royalty fee of $2 million per year. After 2021, there are no minimum royalties. These royalty payments will be recorded as “Revenue – Royalty” when the royalties are earned. |
In addition, the Agreement contains a provision allowing for Misonix to be reimbursed by Hunan for it’s out of pocket costs to assist Hunan with training to build the product, to the extent Hunan requests any training. We consider this option to be a substantive option which should be accounted for as a separate event as the event occurs rather than as a deliverable in the original arrangement. We also believe that this will be an immaterial portion of this contract.
During the year ended June 30, 2018, the Company delivered the licensed SonaStar technology to the Licensee, and recorded license revenue of $4,010,000.
Long-Lived Assets
The carrying values of intangible and other long-lived assets, excluding goodwill, are periodically reviewed to determine if any impairment indicators are present. If it is determined that such indicators are present and the review indicates that the assets will not be fully recoverable, based on undiscounted estimated cash flows over the remaining amortization and depreciation period, their carrying values are reduced to estimated fair value. Impairment indicators include, among other conditions, cash flow deficits, historic or anticipated decline in revenue or operating profit, adverse legal or regulatory developments, accumulation of costs significantly in excess of amounts originally expected to acquire the asset and a material decrease in the fair value of some or all of the assets. Assets are grouped at the lowest levels for which there are identifiable cash flows that are largely independent of the cash flows generated by other asset groups. No such impairment was deemed to exist in fiscal 2018 and 2017.
Goodwill
Goodwill is not amortized. We review goodwill for impairment annually and whenever events or changes indicate that the carrying value of an asset may not be recoverable. These events or circumstances could include a significant change in the business climate, legal factors, operating performance indicators, competition, or sale or disposition of significant assets or products. Application of this impairment test requires significant judgments, including estimation of cash flows, which is dependent on internal forecasts, estimation of the long term rate of growth for the Company’s business, the useful lives over which cash flows will occur and determination of the Company’s weighted average cost of capital. The Company also compares its market capitalization to the value of its goodwill to view for evidence of impairment. The Company completed its annual goodwill impairment tests for fiscal 2018 and 2017 as of June 30th each year. No impairment of goodwill was deemed to exist in fiscal 2018 and 2017.
Patents
The cost of acquiring or processing patents is capitalized at cost. This amount is being amortized using the straight-line method over the estimated useful lives of the underlying assets, which is approximately 17 years. Patents totaled $757,447 and $719,136 at June 30, 2018 and 2017, respectively. Amortization expense for the years ended June 30, 2018, 2017 and 2016 was approximately $127,000, $110,000 and $94,000, respectively.
The following is a schedule of estimated future patent amortization expense as of June 30, 2018 during the following fiscal years:
| 2019 | $ | 125,961 | |||
| 2020 | 101,483 | ||||
| 2021 | 95,312 | ||||
| 2022 | 62,765 | ||||
| 2023 | 61,695 | ||||
| Thereafter | 310,231 | ||||
| $ | 757,447 |
Income Taxes
Deferred tax assets and liabilities are recognized for the future tax consequences attributable to differences between the financial statement carrying amounts of existing assets and liabilities and their respective tax bases and operating loss and tax credit carry forwards. Deferred tax assets and liabilities are measured using enacted tax rates expected to apply to taxable income in the years in which those temporary differences are expected to be recovered or settled. The effect on deferred tax assets and liabilities of a change in tax rates is recognized in income in the period that includes the enactment date. The ultimate realization of deferred tax assets is dependent upon the generation of future taxable income in those periods in which temporary differences become deductible. Should management determine that it is more likely than not that some portion of the deferred tax asset will not be realized, a valuation allowance against the deferred tax asset would be established in the period such determination was made.
F-11
The Company recognizes a tax benefit from an uncertain tax position only if it is more likely than not that the tax position will be sustained on examination by the taxing authorities based on the technical merits of the position. The tax benefits recognized in the financial statements from such position are measured based on the largest benefit that has a greater than fifty percent likelihood of being realized upon ultimate settlement. The Company classifies income tax related interest and penalties as a component of income tax expense.
Earnings Per Share
Earnings per share (“EPS”) is calculated using the two class method, which allocates earnings among common stock and participating securities to calculate EPS when an entity’s capital structure includes either two or more classes of common stock or common stock and participating securities. Unvested share-based payment awards that contain non-forfeitable rights to dividends or dividend equivalents (whether paid or unpaid) are participating securities. As such, unvested restricted stock of the Company are considered participating securities. The dilutive effect of options and their equivalents (including non-vested stock issued under stock based compensation plans), is computed using the “treasury” method.
Basic income per common share is based on the weighted average number of common shares outstanding during the period. Diluted income per common share includes the dilutive effect of potential common shares outstanding. The following table sets forth the reconciliation of weighted average shares outstanding and diluted weighted average shares outstanding:
| For the twelve months ended | ||||||||||||
| June 30, | ||||||||||||
| 2018 | 2017 | 2016 | ||||||||||
| Basic weighted average shares outstanding | 9,009,189 | 8,398,778 | 7,776,949 | |||||||||
| Dilutive effect of resticted stock awards (participating securities) | — | — | — | |||||||||
| Denominator for basic earnings per share | 9,009,189 | 8,398,778 | 7,776,949 | |||||||||
| Dilutive effect of stock options | — | — | — | |||||||||
| Diluted weighted average shares outstanding | 9,009,189 | 8,398,778 | 7,776,949 | |||||||||
Diluted EPS for the three years ended June 30, 2018 as presented is the same as basic EPS as the inclusion of the effect of common share equivalents then outstanding would be anti-dilutive. Accordingly, excluded from the calculation of diluted EPS are the dilutive effect of options to purchase 211,801, 473,848, and 467,733 shares of common stock for the years ended June 30, 2018, 2017 and 2016, respectively. Also excluded from the calculation of both basic and diluted earnings per share for the years ended June 30, 2018 and 2017 are the 400,000 shares of restricted common stock which were issued in December 2016.
Research and Development
All research and development expenses are expensed as incurred and are included in operating expenses.
Advertising Expense
The cost of advertising is expensed in the period the advertising first takes place. The Company incurred approximately $0, $76,000 and $386,000 in advertising costs during the fiscal years ended June 30, 2018, 2017 and 2016, respectively. Advertising costs are reported in selling expenses on the statement of operations.
F-12
Depreciation Expense for Consigned Inventory
The Company typically provides to its United States customers, on a consignment basis, the generators used to power its BoneScapel and SonicOne products. Title to these generators remains at all times with the Company. When these generators are deployed in the field at customer locations, the Company depreciates these units over a five year period and charges the depreciation to selling expenses. Depreciation expense relating to consigned generators for the three years ended June 30, 2018 was $487,000, $425,000 and $416,000, respectively. Prior to fiscal 2017, consigned units were depreciated over a three year period. The impact of this change in accounting estimate was a reduction in expense of approximately $283,000 for the year ended June 30, 2017, compared to what the expense would have been without this change.
Shipping and Handling
Shipping and handling fees for the fiscal years ended June 30, 2018, 2017 and 2016 were approximately $99,000, $119,000 and $109,000 respectively, and are reported as a component of net sales. Shipping and handling costs for the fiscal years ended June 30, 2018, 2017 and 2016 were approximately $289,000, $337,000 and $142,000, respectively, and are reported as a component of selling expenses.
Stock-Based Compensation
The Company measures compensation cost for all share based payments at fair value and recognizes the cost over the vesting period. The Company uses the Black-Scholes method to value awards and utilizes the straight line amortization method to recognize the expense associated with the awards with graded vesting terms.
Restricted Stock Awards
The Company measures compensation cost for all restricted stock awards at fair value and recognizes the cost over the vesting period. For awards that have market conditions, the Company uses the Monte Carlo valuation method to value awards and utilizes the straight line amortization method to recognize the expense associated with the awards with graded vesting terms. Where awards have performance conditions, the Company will determine the probability of achieving those conditions and will record compensation expense when it is probable that the conditions will be met.
Recent Accounting Pronouncements
In May 2014, the Financial Accounting Standards Board (the “FASB”) issued ASC Update No. 2014-09, Revenue from Contracts with Customers (Topic 606), which was subsequently updated. This purpose of the updated standard is to provide enhancements to the quality and consistency of revenue recognition between companies using U.S. GAAP and International Financial Reporting Standards. The new five-step recognition model introduces the core principle of recognizing revenue in an amount that reflects the consideration to which the entity expects to be entitled in exchange for the promised goods or services.
When effective, as amended, ASU 2014-09 will require us to use either of the following transition methods: (i) a full retrospective approach reflecting the application of the standard in each prior reporting period with the option to elect certain practical expedients; or (ii) a modified retrospective approach with the cumulative effect of initially adopting ASU 2014-09 recognized at the date of adoption (which includes additional footnote disclosures to describe the nature, amount, timing and uncertainty of revenue, certain costs and cash flows arising from our contracts with customers). This standard became effective for the Company on July 1, 2018 and we will adopt the new pronouncement under the modified retrospective approach.
We have reviewed our various revenue streams within our reporting segment and have gathered data regarding the segregation of those revenue streams into the following types for analysis (i) sale of medical device products under standard ship and bill practices, (ii) consignment and leasing of medical device products, and (iii) licensing agreements related to medical technology. We have gathered data and quantified the amount of sales by type of revenue stream and categorized the types of sales for the purpose of comparing how we currently recognize revenue to the new standard in order to quantify the impact of this ASU. We have finalized our review on our medical device product sales and the consignment and leasing of medical devices. We generally anticipate having substantially similar performance obligations under the new guidance as compared with deliverables and units of account currently being recognized. We expect to recognize an immaterial adjustment to retained earnings reflecting the cumulative impact for the above described revenue streams.
Due to the nature of the licensing agreements that the Company enters into, the revenue recognition treatment required under the new standard will depend on contract-specific terms. The Company is in the process of concluding on the impact that the standard will have on this revenue stream and will need to consistently evaluate the nature of any implicit price concession granted on a major license and IP agreement with the Company’s Chinese partner which will impact the timing of royalty revenue to be recorded under the contract. This may result in revenue being recognized on this license earlier than current practice although such revenue has not yet been recorded and the Company has not yet concluded on any necessary adjustment to retained earnings upon adoption.
F-13
In February 2016, the FASB issued guidance on lease accounting requiring lessees to recognize a right-of-use asset and a lease liability for long-term leases. The liability will be equal to the present value of lease payments. This guidance must be applied using a modified retrospective transition approach to all annual and interim periods presented and is effective for the Company beginning in fiscal 2019. The Company is currently in the early stages of evaluating this guidance to determine the impact it will have on its consolidated financial statements.
In August 2016, the FASB issued guidance on the Statement of Cash Flows Classification of certain cash receipts and cash payments (a consensus of the Emerging Issues Task Force). This guidance addresses the following eight specific cash flow issues: Debt prepayment or debt extinguishment costs; settlement of zero-coupon debt instruments or other debt instruments with coupon interest rates that are insignificant in relation to the effective interest rate of the borrowing; contingent consideration payments made after a business combination; proceeds from the settlement of insurance claims; proceeds from the settlement of corporate-owned life insurance policies (including bank-owned life insurance policies); distributions received from equity method investees; beneficial interests in securitization transactions; and separately identifiable cash flows and application of the predominance principle. This guidance will be effective for the Company beginning in fiscal 2019. As this guidance only affects the classification within the statement of cash flows, ASU 2016-15 is not expected to have a material impact on the Company’s consolidated financial statements.
In January 2017, the FASB issued ASU No. 2017-01, Business Combinations: Clarifying the Definition of a Business (“ASU 2017-01”). ASU 2017-01 clarifies the definition of a business for determining whether transactions should be accounted for as acquisitions (or disposals) of assets or businesses. ASU 2017-01 is effective for annual periods and interim periods within those annual periods beginning after December 15, 2017, and early adoption is permitted. The Company is in the process of evaluating the impact of the adoption of ASU 2017-01 on its consolidated financial statements.
There are no other recently issued accounting pronouncements that are expected to have a material effect on the Company’s financial position, results of operations or cash flows.
Recently Adopted Accounting Pronouncements
In March 2016, the FASB issued Accounting Standards Update No. 2016-09 “Compensation—Stock Compensation (Topic 718): Improvements to Employee Share-Based Payment Accounting” intended to simplify several aspects of accounting for share-based payment transactions. The Company adopted these amendments beginning in the first quarter of fiscal 2018. The guidance requires that all excess tax benefits and tax deficiencies previously recorded as additional paid-in capital be prospectively recorded in income tax expense. The guidance allows for an increase in the threshold for net share settlement up to the maximum statutory rate in employees’ applicable jurisdictions without triggering liability classification. The adoption of this guidance had an immaterial impact on income taxes on the Company’s Consolidated Statement of Operations for the year ended June 30, 2018. The Company elected to apply the presentation requirement for cash flows related to excess tax benefits prospectively, which had an immaterial impact on both net cash from operating activities and net cash used in financing activities for the year ended June 30, 2018. The presentation requirements for cash flows related to employee taxes paid for withheld shares had no impact on any of the periods presented on the Company’s Consolidated Statements of Cash Flows since such cash flows have historically been presented as a financing activity. Finally, the Company has elected to account for forfeitures as they occur, rather than estimate expected forfeitures. As a result, the Company recorded the cumulative impact of $908,875 as an increase to Deferred Income Taxes with a corresponding decrease to Accumulated Deficit.
F-14
2. Fair Value of Financial Instruments
We follow a three-level fair value hierarchy that prioritizes the inputs to measure fair value. This hierarchy requires entities to maximize the use of “observable inputs” and minimize the use of “unobservable inputs.” The three levels of inputs used to measure fair value are as follows:
Level 1: Quoted prices (unadjusted) for identical assets or liabilities in active markets as of the measurement date.
Level 2: Significant other observable inputs other than Level 1 prices such as quoted prices for similar assets or liabilities; quoted prices in markets that are not active; or other inputs that are observable or can be corroborated by observable market data.
Level 3: Significant unobservable inputs that reflect assumptions that market participants would use in pricing an asset or liability.
At June 30, 2018 and 2017, all of our cash, trade accounts receivable and trade accounts payable were short term in nature, and their carrying amounts approximate fair value.
3. Inventories
Inventories are summarized as follows:
| June 30, 2018 | June 30, 2017 | |||||||
| Raw material | $ | 3,540,205 | $ | 2,409,148 | ||||
| Work-in-process | 180,442 | 741,994 | ||||||
| Finished goods | 1,743,497 | 3,267,232 | ||||||
| 5,464,144 | 6,418,374 | |||||||
| Less valuation reserve | 444,258 | 1,425,940 | ||||||
| $ | 5,019,886 | $ | 4,992,434 | |||||
4. Property, Plant and Equipment
Property, plant and equipment consist of the following:
| June 30, 2018 | June 30, 2017 | |||||||
| Demonstration and consignment inventory | $ | 8,227,878 | $ | 6,951,583 | ||||
| Machinery and equipment | 2,582,244 | 2,452,363 | ||||||
| Furniture and fixtures | 1,464,325 | 1,406,758 | ||||||
| Leasehold improvements | 691,751 | 691,751 | ||||||
| Software systems | 223,087 | — | ||||||
| Automobiles | 22,328 | 22,328 | ||||||
| 13,211,613 | 11,524,783 | |||||||
| Less: accumulated depreciation and amortization | (9,023,235 | ) | (7,794,580 | ) | ||||
| $ | 4,188,378 | $ | 3,730,203 | |||||
Depreciation and amortization of property, plant and equipment totaled approximately $1,300,000, $957,000 and $1,339,000 for the fiscal years ended June 30, 2018, 2017 and 2016, respectively.
F-15
5. Accrued Expenses and Other Current Liabilities
The following summarizes accrued expenses and other current liabilities:
| June 30, 2018 | June 30, 2017 | |||||||
| Accrued payroll, payroll taxes and vacation | $ | 351,435 | $ | 715,245 | ||||
| Accrued bonus | 552,988 | 343,400 | ||||||
| Accrued commissions | 742,807 | 751,000 | ||||||
| Professional fees | 102,065 | 662,537 | ||||||
| Litigation settlement | — | 500,000 | ||||||
| Deferred income | 13,303 | 27,901 | ||||||
| Deferred foreign taxes | 401,000 | — | ||||||
| Vendor and sales tax accruals | 648,574 | 346,055 | ||||||
| $ | 2,812,172 | $ | 3,346,138 | |||||
6. Stock-Based Compensation Plans
At June 30, 2018, the Company had outstanding equity-linked grants under eight stock-based compensation plans (the “Plans”), as follows:
| Plan | Initial Shares | Granted | Exercised | Expired / Forfeited | Outstanding | Available For Issuance | ||||||||||||||||||
| 2001 Employee Stock Option Plan | 1,000,000 | 1,251,261 | 376,368 | 868,955 | 5,938 | — | ||||||||||||||||||
| 2005 Employee Equity Incentive Plan | 500,000 | 547,125 | 490,550 | 48,925 | 7,650 | — | ||||||||||||||||||
| 2005 Non Employee Director Stock Option Plan | 200,000 | 195,000 | 112,500 | 37,500 | 45,000 | — | ||||||||||||||||||
| 2009 Employee Equity Incentive Plan | 500,000 | 624,925 | 386,350 | 125,600 | 112,975 | 675 | ||||||||||||||||||
| 2009 Non Employee Director Stock Option Plan | 200,000 | 225,000 | 56,250 | 75,000 | 93,750 | 50,000 | ||||||||||||||||||
| 2012 Employee Equity Incentive Plan | 500,000 | 695,000 | 122,370 | 196,000 | 376,630 | 1,000 | ||||||||||||||||||
| 2012 Non Employee Director Stock Option Plan | 200,000 | 222,500 | 3,750 | 45,000 | 173,750 | 22,500 | ||||||||||||||||||
| 2014 Employee Equity Incentive Plan | 750,000 | 505,000 | 3,625 | 158,875 | 342,500 | 3,875 | ||||||||||||||||||
| 2017 Equity Incentive Plan | 750,000 | 172,000 | — | — | 172,000 | 578,000 | ||||||||||||||||||
| Total | 1,330,193 | 656,050 | ||||||||||||||||||||||
The compensation cost that has been charged against income for these plans was $1,728,491, $1,086,139 and $1,629,644 for the fiscal years ended June 30, 2018, 2017 and 2016, respectively, and is recorded in the department associated with the employee to which the grants are issued. The expense for fiscal 2018 included a reversal of stock compensation from prior periods due to forfeitures of unvested options of $625,202. As of June 30, 2018, there was $4,617,767 of total unrecognized compensation cost related to non-vested share-based compensation arrangements to be recognized over a weighted-average period of 2.4 years, which includes $2,248,649 of unrecognized compensation expense on restricted stock awards.
Stock options typically expire 10 years from the date of grant and vest over service periods, which typically are 4 years. All options are granted at the price of the Common Stock on the NASDAQ Stock Market on the date of grant as set forth in the Plans.
The fair value of each option award was estimated on the date of grant using the Black-Scholes option valuation model that uses the assumptions noted in the following table. The expected volatility represents the historical price changes of the Company’s stock over a period equal to that of the expected term of the option. The Company uses the simplified method for determining the option term. The risk-free rate was based on the U.S. Treasury yield curve in effect at the time of grant. The expected dividend yield is based upon historical and projected dividends. The Company has historically not paid dividends, and is not expected to do so in the near term.
F-16
The weighted average fair value at date of grant for options granted during the fiscal years ended June 30, 2018, 2017 and 2016 was $5.50, $4.46 and $4.68 per share, respectively. The fair value was estimated based on the weighted average assumptions of:
| For the three years ended June 30, | ||||||||||||
| 2018 | 2017 | 2016 | ||||||||||
| Risk-free interest rates | 1.98 | % | 1.80 | % | 1.71 | % | ||||||
| Expected option life in years | 5.95 | 6.25 | 6.25 | |||||||||
| Expected stock price volatility | 57.42 | % | 54.68 | % | 55.41 | % | ||||||
| Expected dividend yield | 0 | % | 0 | % | 0 | % | ||||||
A summary of option activity under the Plans as of June 30, 2018, 2017 and 2016, and changes during the years ended on those dates is presented below:
| Options | ||||||||||||
| Outstanding Shares | Weighted Average Exercise Price | Aggregate Intrinsic Value | ||||||||||
| Outstanding as of June 30, 2015 | 1,557,616 | 5.80 | $ | 6,553,821 | ||||||||
| Vested and exercisable at June 30, 2015 | 620,256 | 3.19 | $ | 3,911,604 | ||||||||
| Granted | 320,000 | 8.80 | ||||||||||
| Exercised | (82,737 | ) | 4.60 | |||||||||
| Forfeited | (4,375 | ) | 9.23 | |||||||||
| Expired | (280 | ) | 5.82 | |||||||||
| Outstanding as of June 30, 2016 | 1,790,224 | $ | 6.38 | $ | 1,675,072 | |||||||
| Vested and exercisable at June 30, 2016 | 813,349 | $ | 3.82 | $ | 1,501,208 | |||||||
| Granted | 327,500 | 8.34 | ||||||||||
| Exercised | (527,663 | ) | 3.30 | |||||||||
| Forfeited | (383,625 | ) | 8.23 | |||||||||
| Expired | (15,200 | ) | 8.51 | |||||||||
| Outstanding as of June 30, 2017 | 1,191,236 | $ | 7.66 | $ | 2,748,956 | |||||||
| Vested and exercisable at June 30, 2017 | 517,361 | $ | 6.33 | $ | 1,923,794 | |||||||
| Granted | 305,500 | 10.10 | ||||||||||
| Exercised | (76,418 | ) | 5.47 | |||||||||
| Forfeited | (15,125 | ) | 7.89 | |||||||||
| Expired | (75,000 | ) | 4.87 | |||||||||
| Outstanding as of June 30, 2018 | 1,330,193 | $ | 8.47 | $ | 5,369,557 | |||||||
| Vested and exercisable at June 30, 2018 | 681,316 | $ | 7.67 | $ | 3,355,240 | |||||||
The total fair value of shares vested during the year ended June 30, 2018 was $1,553,905. The number and weighted-average grant-date fair value of non-vested stock options at the beginning of fiscal 2018 was 673,875 and $4.77, respectively. The number and weighted-average grant-date fair value of stock options which vested during fiscal 2018 was 648,777 and $5.08, respectively.
Stock options are granted with exercise prices not less than the fair market value of the Company’s Common Stock, at the time of the grant, with an exercise term as determined by the compensation committee of the Company’s board of directors (the “Committee”) not to exceed 10 years. The Committee determines the vesting period for the Company’s stock options. Generally, such stock options have vesting periods of immediate to four years. Certain option awards provide for accelerated vesting upon meeting specific retirement, death or disability criteria, and upon change of control.
Restricted Stock Awards
On December 15, 2016, the Company issued 400,000 shares of restricted stock to its Chief Executive Officer. These awards vest over a period of up to five years, subject to meeting certain service, performance and market conditions. These awards were valued at approximately $3.4 million and compensation expense recorded for the year ended June 30, 2018 was $900,337. At June 30, 2018, there was $2,248,649 of unrecognized compensation cost to non-vested restricted stock awards to be recognized over a weighted-average period of 2.8 years. The awards contain a combination of vesting terms which include time vesting, performance vesting relating to revenue achievement, and market vesting related to obtaining certain levels of Company stock prices. At June 30, 2018, the Company has estimated that it is probable that the performance conditions will be met. The awards were valued using a Monte Carlo valuation model using a stock price at the date of grant of $9.60, a term of 3 to 5 years, a risk free interest rate of 1.6% to 2.1% and a volatility factor of 66.5%.
F-17
7. Commitments and Contingencies
Leases
The Company has entered into several non-cancellable operating leases for the rental of certain manufacturing and office space, equipment and automobiles expiring in various years through 2021. The principal building lease provides for a monthly rental of approximately $28,000.
The following is a schedule of future minimum lease payments, by year and in the aggregate, under operating leases with initial or remaining terms of one year or more at June 30, 2018:
| Operating Leases | |||||
| 2019 | $ | 359,353 | |||
| 2020 | 115,324 | ||||
| 2021 | 12,488 | ||||
| 2022 | — | ||||
| Total mimimun lease payments | $ | 487,165 | |||
Certain of the leases provide for escalation clauses, renewal options and the payment of real estate taxes and other occupancy costs. Rent expense for all operating leases was approximately $435,000, $428,000 and $411,000 for the fiscal years ended June 30, 2018, 2017 and 2016, respectively.
Purchase Commitments
As of June 30, 2018, 2017, and 2016, the Company had purchase and inventory commitments totaling $3,841,641, $2,859,718 and $2,507,125, respectively.
Class Action Securities Litigation
On September 19, 2016, Richard Scalfani, an individual shareholder of Misonix, filed a lawsuit against the Company and its former CEO and CFO in the U.S. District Court for the Eastern District of New York, alleging violations of the federal securities laws. The complaint alleges that the Company’s stock price was artificially inflated between November 5, 2015 and September 14, 2016 as a result of alleged false and misleading statements in the Company’s securities filings concerning the Company’s business, operations, and prospects and the Company’s internal control over financial reporting. Scalfani filed the action seeking to represent a putative class of all persons (other than defendants, officers and directors of the Company, and their affiliates) who purchased publicly traded Misonix securities between November 5, 2015 and September 14, 2016. Scalfani was seeking an unspecified amount of damages for himself and for the putative class under the federal securities laws. On March 24, 2017, the Court appointed Scalfani and another individual Misonix shareholder, Tracey Angiuoli, as lead plaintiffs for purposes of pursuing the action on behalf of the putative class. The lead plaintiffs, on behalf of the putative class, and the Company reached a settlement in principle under which the Company would pay $500,000 to resolve the matter. The district court approved the settlement and dismissed the lawsuit with prejudice in an order dated December 16, 2017. The Company has paid its $250,000, representing its insurance retention. The balance was paid by the Company’s insurance carrier.
Former Chinese Distributor - FCPA
With the assistance of outside counsel, the Company conducted a voluntary investigation into the business practices of the independent Chinese entity that previously distributed its products in China and the Company’s knowledge of those business practices, which may have implications under the FCPA, as well as into various internal controls issues identified during the investigation.
F-18
On September 27, 2016 and September 28, 2016, the Company voluntarily contacted the SEC and the DOJ, respectively, to advise both agencies of these potential issues. The Company has provided and will continue to provide documents and other information to the SEC and the DOJ, and is cooperating fully with these agencies in their ongoing investigations of these matters.
Although the Company’s investigation is complete, additional issues or facts could arise which may expand the scope or severity of the potential violations. The Company has no current information derived from the investigation or otherwise to suggest that its previously reported financial statements and results are incorrect.
At this stage, the Company is unable to predict what, if any, action the DOJ or the SEC may take or what, if any, penalties or remedial measures these agencies may seek. Nor can the Company predict the impact on the Company as a result of these matters, which may include the imposition of fines, civil and criminal penalties, which are not currently estimable, as well as equitable remedies, including disgorgement of any profits earned from improper conduct and injunctive relief, limitations on the Company’s conduct, and the imposition of a compliance monitor. The DOJ and the SEC periodically have based the amount of a penalty or disgorgement in connection with an FCPA action, at least in part, on the amount of profits that a company obtained from the business in which the violations of the FCPA occurred. During its distributorship relationship with the prior Chinese distributor from 2010 through 2016, the Company generated revenues of approximately $8 million.
Further, the Company may suffer other civil penalties or adverse impacts, including lawsuits by private litigants in addition to the lawsuits that already have been filed, or investigations and fines imposed by local authorities. The investigative costs to date are approximately $3.0 million, of which approximately $0.5 million, $2.4 million and $0.1 million was charged to general and administrative expenses during the years ended June 30, 2018, 2017 and 2016 respectively.
Former Chinese Distributor – Litigation
On April 5, 2017, the Company’s former distributor in China, Cicel (Beijing) Science & Technology Co., Ltd., filed a lawsuit against the Company and certain officers and directors of the Company in the United States District Court for the Eastern District of New York, alleging that the Company improperly terminated its contract with the former distributor. The complaint sought various remedies, including compensatory and punitive damages, specific performance and preliminary and post judgment injunctive relief, and asserted various causes of action, including breach of contract, unfair competition, tortious interference with contract, fraudulent inducement, and conversion. On October 7, 2017, the court granted the Company’s motion to dismiss all of the tort claims asserted against it, and also granted the individual defendants’ motion to dismiss all claims asserted against them. The only claim remaining in the case is for breach of contract against the Company. The Company believes it has various legal and factual defenses to the allegations in the complaint, and intends to vigorously defend the action. The case is at its earliest stages; discovery is just beginning and there is no trial date.
Stockholder Derivative Litigation
On June 6, 2017, Irving Feldbaum, an individual shareholder of Misonix, filed a lawsuit in the U.S. District Court for the Eastern District of New York. The complaint alleges claims against the Company’s board of directors, its former CEO and CFO, certain of its former directors, and the Company as a nominal defendant for alleged violations of Section 14(a) of the Securities Exchange Act of 1934 and state law claims for breach of fiduciary duty, waste of corporate assets, and unjust enrichment. The complaint alleges that the Company incurred damages as a result of alleged false and misleading statements in the Company’s securities filings concerning the Company’s business, operations, and prospects and the Company’s internal control over financial reporting. The complaint also alleges that the Company’s February 4, 2016 Proxy Statement contained false and misleading statements regarding executive compensation. The complaint seeks the recovery of damages on behalf of the Company and the implementation of changes to corporate governance procedures. On June 16, 2017, Michael Rubin, another individual shareholder of Misonix, filed a case alleging similar claims in the same district court. On July 21, 2017, the district court consolidated the two actions for all purposes. On July 16, 2018, the Company and counsel for Mr. Feldbaum and Mr. Rubin informed the District Court that the parties had reached a settlement in principle. There are aspects of the settlement that remain to be negotiated and documented, and the settlement is subject to approval by the District Court after notice to the Company’s shareholders.
F-19
8. Related Party Transactions
OrthoXact Proprietary Limited (“OrthoXact”) (formerly Applied BioSurgical) is an independent distributor for the Company in South Africa. The chief executive officer of OrthoXact is also the brother of Stavros G. Vizirgianakis, the CEO of Misonix, Inc.
Set forth below is a table showing the Company’s net revenues for the years ended June 30 and accounts receivable at June 30 for the indicated time periods below with OrthoXact:
| For the years ended June 30: | ||||||||||||
| Applied BioSurgical | 2018 | 2017 | 2016 | |||||||||
| Sales | $ | 999,719 | $ | 580,888 | $ | 559,787 | ||||||
| Accounts receivable | $ | 239,062 | $ | 192,984 | $ | 272,421 | ||||||
On October 25, 2016, the Company sold 761,469 shares of Common Stock in a private placement to Stavros G. Vizirgianakis, the Company’s current Chief Executive Officer, at a price per share of $5.253, representing total cash proceeds to the Company of approximately $4.0 million.
9. Income Taxes
Open tax years related to federal and state income tax filings are for the years ended June 30, 2015, 2016, and 2017. The Company’s net operating loss carryforwards from closed years can be adjusted by the tax authorities when they are utilized in an open year. The Company files state tax returns in California, Florida, New Jersey, New York, Pennsylvania, Texas and various other states. The Company was examined by the Internal Revenue Service for the year ended June 30, 2015 and such examination had been closed with no change in taxes. The Company’s former foreign subsidiary, Misonix Ltd. filed tax return in the United Kingdom and it was dissolved in June 2018.
Deferred income taxes reflect the net tax effects of temporary differences between the carrying amounts of assets and liabilities for financial reporting purposes and the amounts used for income tax purposes.
The tax effects of temporary differences that give rise to significant portions of the deferred tax assets and liabilities are presented below:
| June 30, | ||||||||
| 2018 | 2017 | |||||||
| Deferred tax assets / (liabilities) | ||||||||
| Bad debt reserves | $ | 45,817 | $ | 34,243 | ||||
| Inventory reserves | 194,363 | 676,733 | ||||||
| Accruals and allowances | 18,938 | 269,539 | ||||||
| Net operating loss carryforwards | 2,738,775 | 3,500,826 | ||||||
| Tax credits | 496,898 | 455,916 | ||||||
| Foreign tax credits | 401,000 | — | ||||||
| Stock based compensation | 516,733 | 451,892 | ||||||
| Deferred gain - HIFU and Labcaire | 91,862 | 149,222 | ||||||
| Amortization | (378,818 | ) | (594,306 | ) | ||||
| Depreciation | (36,088 | ) | 16,030 | |||||
| Other | 6,873 | 3,182 | ||||||
| 4,096,353 | 4,963,277 | |||||||
| Valuation Allowance | (4,096,353 | ) | (628,730 | ) | ||||
| Total net deferred tax assets | $ | — | $ | 4,334,547 | ||||
F-20
Tax Cuts and Jobs Act of 2017
The Tax Cuts and Jobs Act of 2017 (the “Tax Legislation”), enacted on December 22, 2017, contains significant changes to U.S. tax law, including lowering the U.S. corporate income tax rate to 21%, implementing a territorial tax system, and imposing a one-time tax on deemed repatriated earnings of foreign subsidiaries.
The Tax Legislation reduces the U.S. statutory tax rate from 35% to 21%, effective January 1, 2018. U.S. tax law requires that taxpayers with a fiscal year that begins before and ends after the effective date of a rate change calculate a blended tax rate based on the pro rata number of days in the fiscal year before and after the effective date. As a result, for the fiscal year ended June 30, 2018, the Company’s U.S. statutory income tax rate is 27.55%.
On December 22, 2017, the SEC staff issued Staff Accounting Bulletin No. 118 (“SAB 118”), which provides guidance on accounting for the tax effects of the Tax Legislation. SAB 118 provides a measurement period that should not extend beyond one year from the Tax Legislation enactment date for companies to complete the accounting under ASC 740, Income Taxes. In accordance with SAB 118, a company must reflect the income tax effects of those aspects of the Tax Legislation for which the accounting under ASC 740 is complete. To the extent that a company’s accounting for certain income tax effects of the Tax Legislation is incomplete but it is able to determine a reasonable estimate, it must record a provisional estimate in the financial statements. The Company recorded $1,755,823 discrete tax expense representing the expense of remeasuring its U.S. deferred tax assets at the lower 21% U.S. statutory tax rate. In addition, the Company had approximately $169,000 of alternative minimum tax credit which was reclassed to tax receivable.
Valuation Allowance on Deferred Tax Assets
Deferred tax assets refer to assets that are attributable to differences between the financial statement carrying amounts of existing assets and liabilities and their respective tax bases. Deferred tax assets in essence represent future savings of taxes that would otherwise be paid in cash. The realization of the deferred tax assets is dependent upon the generation of sufficient future taxable income, including capital gains. If it is determined that the deferred tax assets cannot be realized, a valuation allowance must be established, with a corresponding charge to net income.
In accordance with ASC Topic 740, the Company establishes valuation allowances for deferred tax assets that, in its judgment are not more likely-than-not realizable. The guidance requires entities to evaluate all available positive and negative evidence, including cumulative results in recent periods, weighted based on its objectivity, in determining whether its deferred tax assets are more likely than not realizable.
The Company regularly assesses its ability to realize its deferred tax assets. While the Company had positive cumulative pretax income as of June 30, 2017, based on actual results for fiscal 2018 and the Company’s current forecast for fiscal 2019 the Company is in a three year cumulative loss position at June 30, 2018, and it expects to be in a cumulative pretax loss position as of June 30, 2019. Management evaluated available positive evidence, including the continued growth of the Company’s revenues and gross profit margins, its recent SonaStar technology license to its Chinese partner and the reduction in investigative and professional fees recognized in fiscal 2017, along with available negative evidence, including the Company’s continuing investment in building its next generation Nexus platform and its continuing investment in building a direct sales force, while at the same time paying commissions to its domestic sales distributors. After weighing both the positive and negative evidence, management concluded that the Company’s deferred tax assets are not more likely-than-not realizable. Accordingly, the Company recorded a full valuation allowance of $4,096,353 against its remaining deferred tax assets at June 30, 2018. The Company will continue to assess its ability to utilize its net operating loss carryforwards, and will reverse this valuation allowance when sufficient evidence is achieved to allow the realizability of such deferred tax assets.
As of June 30, 2018, the Company had approximately $12,175,000 of U.S. federal net operating loss carryforwards of which $10,504,000 will expire in tax years between 2031 and 2037 and $1,671,000 will not expire. Included in U.S. Federal net operating loss carryforward amount are windfall tax benefits related to exercised stock options of approximately $2,571,000, the benefit of which was recorded in equity when the Company adopted ASU 2016-09 beginning in fiscal 2018. The Company has approximately $497,000 of research and development tax credit carryforwards which expire in the tax years between 2026 and 2038.
F-21
Significant components of the income tax expense (benefit) attributable to continuing operations are as follows:
| Year Ended June 30, | ||||||||||||
| 2018 | 2017 | 2016 | ||||||||||
| Current: | ||||||||||||
| Federal | $ | — | $ | — | $ | 4,962 | ||||||
| Foreign | 401,000 | 5,424 | 17,012 | |||||||||
| Total current | 401,000 | 5,424 | 21,974 | |||||||||
| Deferred: | ||||||||||||
| Federal | 5,116,778 | (990,016 | ) | (558,133 | ) | |||||||
| State | (101,132 | ) | (38,216 | ) | (37,192 | ) | ||||||
| Total deferred | 5,015,646 | (1,028,232 | ) | (595,325 | ) | |||||||
| $ | 5,416,646 | $ | (1,022,808 | ) | $ | (573,351 | ) | |||||
The reconciliation of income tax expense (benefit) computed at the Federal statutory tax rates to income tax expense (benefit) is as follows:
| Year ended June 30, | ||||||||||||
| 2018 | 2017 | 2016 | ||||||||||
| Tax at federal statutory rates | $ | (483,207 | ) | $ | (974,308 | ) | $ | (646,828 | ) | |||
| State income taxes, net of federal benefit | (102,812 | ) | (34,636 | ) | (13,319 | ) | ||||||
| Research credit | (216,099 | ) | (50,000 | ) | (49,593 | ) | ||||||
| Stock-based compensation | 306,678 | 6,692 | 191,827 | |||||||||
| Deferred tax asset adjustments (1) | — | — | (100,939 | ) | ||||||||
| Valuation allowance | 4,096,353 | — | — | |||||||||
| Reduction of deferred tax asset related to Tax Legislation | 1,755,823 | — | — | |||||||||
| Travel and entertainment | 12,458 | 34,743 | 35,010 | |||||||||
| Other | 47,452 | (5,299 | ) | 10,491 | ||||||||
| $ | 5,416,646 | $ | (1,022,808 | ) | $ | (573,351 | ) | |||||
| (1) | Relates to the correction of error from the fiscal 2016 tax provision as the net impact was not material. |
10. Employee Profit Sharing Plan
The Company sponsors a retirement plan pursuant to Section 401(k) of the Internal Revenue Code of 1986, as amended (the “Code”) for all full-time employees. Participants may contribute a percentage of compensation not to exceed the maximum allowed under the Code, which was $24,000 if the employee was over 50 years of age for the year ended June 30, 2018. The plan provides for a matching contribution by the Company of 10% of annual eligible compensation contributed by the participants based on years of service, which amounted to $58,162, $57,465 and $52,145 for the fiscal years ended June 30, 2018, 2017 and 2016, respectively.
11. Segment Reporting
Operating segments are defined as components of an enterprise about which separate financial information is available that is evaluated on a regular basis by the chief operating decision-maker (“CODM”) in deciding how to allocate resources to an individual segment and in assessing performance of the segment. The Company has concluded that its Chief Executive Officer is the CODM as he is the ultimate decision maker for key operating decisions, determining the allocation of resources and assessing the financial performance of the Company. These decisions, allocations and assessments are performed by the CODM using consolidated financial information. Consolidated financial information is utilized by the CODM as the Company’s current product offering primarily consists of minimally invasive therapeutic ultrasonic medical devices. The Company’s products are relatively consistent and manufacturing is centralized and consistent across product offerings. Based on these factors, key operating decisions and resource allocations are made by the CODM using consolidated financial data and as such the Company has concluded that it operates as one segment.
F-22
Worldwide revenue for the Company’s products is categorized as follows:
| For the Year Ended June 30, | ||||||||||||
| 2018 | 2017 | 2016 | ||||||||||
| Total | ||||||||||||
| Consumables | $ | 23,596,476 | $ | 20,328,676 | $ | 16,091,651 | ||||||
| Equipment | 9,073,350 | 6,941,287 | 7,021,543 | |||||||||
| License | 4,010,000 | — | — | |||||||||
| Total | $ | 36,679,826 | $ | 27,269,963 | $ | 23,113,194 | ||||||
| Domestic: | ||||||||||||
| Consumables | $ | 17,735,749 | $ | 14,866,772 | $ | 11,277,449 | ||||||
| Equipment | 2,308,614 | 1,593,999 | 1,809,357 | |||||||||
| License | — | — | — | |||||||||
| Total | $ | 20,044,363 | $ | 16,460,771 | $ | 13,086,806 | ||||||
| International: | ||||||||||||
| Consumables | $ | 5,860,727 | $ | 5,461,904 | $ | 4,814,202 | ||||||
| Equipment | 6,764,736 | 5,347,288 | 5,212,186 | |||||||||
| License | 4,010,000 | — | — | |||||||||
| Total | $ | 16,635,463 | $ | 10,809,192 | $ | 10,026,388 | ||||||
Substantially all of the Company’s long-lived assets are located in the United States.
F-23
12. Quarterly Results (unaudited)
| Fiscal 2018 | ||||||||||||||||||||
| Q1 | Q2 | Q3 | Q4 | Year | ||||||||||||||||
| Revenue | ||||||||||||||||||||
| Product | $ | 7,280,723 | $ | 8,323,845 | $ | 8,429,132 | $ | 8,636,126 | $ | 32,669,826 | ||||||||||
| License | — | — | 4,010,000 | — | 4,010,000 | |||||||||||||||
| Total revenue | 7,280,723 | 8,323,845 | 12,439,132 | 8,636,126 | 36,679,826 | |||||||||||||||
| Cost of goods sold | 2,177,355 | 2,465,826 | 2,631,893 | 2,519,824 | 9,794,898 | |||||||||||||||
| Gross profit | 5,103,368 | 5,858,019 | 9,807,239 | 6,116,302 | 26,884,928 | |||||||||||||||
| Operating expenses: | ||||||||||||||||||||
| Selling expenses | 3,570,713 | 3,919,515 | 4,447,421 | 4,430,732 | 16,368,381 | |||||||||||||||
| General and administrative expenses | 2,573,131 | 2,380,860 | 1,925,086 | 2,184,062 | 9,063,139 | |||||||||||||||
| Research and development expenses | 901,274 | 957,204 | 1,199,895 | 1,335,776 | 4,394,149 | |||||||||||||||
| Total operating expenses | 7,045,118 | 7,257,579 | 7,572,402 | 7,950,570 | 29,825,669 | |||||||||||||||
| Income (loss) from operations | (1,941,750 | ) | (1,399,560 | ) | 2,234,837 | (1,834,268 | ) | (2,940,741 | ) | |||||||||||
| Other income (expense): | ||||||||||||||||||||
| Interest income | 13 | 45 | 9,074 | 16,991 | 26,123 | |||||||||||||||
| Royalty income and license fees | 452,971 | 71,550 | 916 | 1 | 525,438 | |||||||||||||||
| Other | (4,458 | ) | (4,387 | ) | (5,712 | ) | 16,831 | 2,274 | ||||||||||||
| Total other income | 448,526 | 67,208 | 4,278 | 33,823 | 553,835 | |||||||||||||||
| — | ||||||||||||||||||||
| Loss from continuing operations before income taxes | (1,493,224 | ) | (1,332,352 | ) | 2,239,115 | (1,800,445 | ) | (2,386,906 | ) | |||||||||||
| — | ||||||||||||||||||||
| Income tax expense (benefit) | (281,000 | ) | 5,524,422 | — | 173,224 | 5,416,646 | ||||||||||||||
| — | ||||||||||||||||||||
| Net income from continuing operations | (1,212,224 | ) | (6,856,774 | ) | 2,239,115 | (1,973,669 | ) | (7,803,552 | ) | |||||||||||
| Income from discontinued operations net of tax | — | — | — | 191,117 | 191,117 | |||||||||||||||
| Net loss | $ | (1,212,224 | ) | $ | (6,856,774 | ) | $ | 2,239,115 | $ | (1,782,552 | ) | $ | (7,612,435 | ) | ||||||
| Net income (loss) per share: | ||||||||||||||||||||
| Continuing operations: | ||||||||||||||||||||
| Basic | $ | (0.14 | ) | $ | (0.76 | ) | $ | 0.24 | $ | (0.22 | ) | $ | (0.87 | ) | ||||||
| Diluted | $ | (0.14 | ) | $ | (0.76 | ) | $ | 0.23 | $ | (0.22 | ) | $ | (0.87 | ) | ||||||
| Discontinued operations | ||||||||||||||||||||
| Basic | $ | — | $ | — | $ | — | $ | 0.02 | $ | 0.02 | ||||||||||
| Diluted | $ | — | $ | — | $ | — | $ | 0.02 | $ | 0.02 | ||||||||||
| Combined | ||||||||||||||||||||
| Basic | $ | (0.14 | ) | $ | (0.76 | ) | $ | 0.24 | $ | (0.20 | ) | $ | (0.85 | ) | ||||||
| Diluted | $ | (0.14 | ) | $ | (0.76 | ) | $ | 0.23 | $ | (0.20 | ) | $ | (0.85 | ) | ||||||
| Weighted average shares - Basic | 8,958,405 | 8,977,984 | 9,028,506 | 9,037,046 | 9,009,189 | |||||||||||||||
| Weighted average shares - Diluted | 8,958,405 | 8,977,984 | 9,549,144 | 9,037,046 | 9,009,189 | |||||||||||||||
F-24
| Fiscal 2017 | ||||||||||||||||||||
| Q1 | Q2 | Q3 | Q4 | Year | ||||||||||||||||
| Revenue | $ | 6,171,625 | $ | 6,030,380 | $ | 7,177,763 | $ | 7,890,195 | $ | 27,269,963 | ||||||||||
| Cost of goods sold | 1,912,007 | 1,818,672 | 2,112,099 | 2,374,661 | 8,217,439 | |||||||||||||||
| Gross profit | 4,259,618 | 4,211,708 | 5,065,664 | 5,515,534 | 19,052,524 | |||||||||||||||
| Operating expenses: | ||||||||||||||||||||
| Selling expenses | 3,325,687 | 3,271,134 | 3,587,859 | 4,036,227 | 14,220,907 | |||||||||||||||
| General and administrative expenses | 1,931,821 | 2,087,419 | 2,484,962 | 3,091,004 | 9,595,206 | |||||||||||||||
| Research and development expenses | 492,084 | 440,364 | 465,863 | 439,186 | 1,837,497 | |||||||||||||||
| Total operating expenses | 5,749,592 | 5,798,917 | 6,538,684 | 7,566,417 | 25,653,610 | |||||||||||||||
| Loss from operations | (1,489,974 | ) | (1,587,209 | ) | (1,473,020 | ) | (2,050,883 | ) | (6,601,086 | ) | ||||||||||
| Other income/(expense): | ||||||||||||||||||||
| Interest income | 19 | 19 | 18 | 19 | 75 | |||||||||||||||
| Royalty income and license fees | 944,068 | 949,048 | 953,235 | 925,259 | 3,771,610 | |||||||||||||||
| Other | (1,996 | ) | (6,640 | ) | (6,940 | ) | (20,635 | ) | (36,211 | ) | ||||||||||
| Total other income | 942,091 | 942,427 | 946,313 | 904,643 | 3,735,474 | |||||||||||||||
| (Loss) from continuing operations before income taxes | (547,883 | ) | (644,782 | ) | (526,707 | ) | (1,146,240 | ) | (2,865,612 | ) | ||||||||||
| Income tax (benefit) | (26,000 | ) | (30,000 | ) | (219,000 | ) | (747,808 | ) | (1,022,808 | ) | ||||||||||
| Net (loss) from continuing operations | $ | (521,883 | ) | $ | (614,782 | ) | $ | (307,707 | ) | $ | (398,432 | ) | $ | (1,842,804 | ) | |||||
| Net income from discontinued operations: | ||||||||||||||||||||
| Net income (loss) from discontinued operations, net of tax | — | — | 161,861 | (236 | ) | 161,625 | ||||||||||||||
| Net income from discontinued operations | — | — | 161,861 | (236 | ) | 161,625 | ||||||||||||||
| Net (loss) | $ | (521,883 | ) | $ | (614,782 | ) | $ | (145,846 | ) | $ | (398,668 | ) | $ | (1,681,179 | ) | |||||
| Net (loss) per share from continuing operations - Basic | $ | (0.07 | ) | $ | (0.07 | ) | $ | (0.04 | ) | $ | (0.05 | ) | $ | (0.22 | ) | |||||
| Net income per share from discontinued operations - Basic | — | — | 0.02 | — | 0.02 | |||||||||||||||
| Net (loss) per share - Basic | $ | (0.07 | ) | $ | (0.07 | ) | $ | (0.02 | ) | $ | (0.05 | ) | $ | (0.20 | ) | |||||
| Net (loss) per share from continuing operations - Diluted | $ | (0.07 | ) | $ | (0.07 | ) | $ | (0.04 | ) | $ | (0.05 | ) | $ | (0.22 | ) | |||||
| Net income per share from discontinued operations - Diluted | — | — | 0.02 | — | 0.02 | |||||||||||||||
| Net (loss) per share - Diluted | $ | (0.07 | ) | $ | (0.07 | ) | $ | (0.02 | ) | $ | (0.05 | ) | $ | (0.20 | ) | |||||
| Weighted average shares - Basic | 7,809,385 | 8,374,900 | 8,613,354 | 8,806,570 | 8,398,778 | |||||||||||||||
| Weighted average shares - Diluted | 7,809,385 | 8,374,900 | 8,613,354 | 8,806,570 | 8,398,778 | |||||||||||||||
F-25
| Description | Balance
at beginning of period | Additions charged to cost and expenses | (Deductions) | Balance
at end of period | ||||||||||||
| Allowance for doubtful accounts-years ended June 30: | ||||||||||||||||
| 2018 | $ | 96,868 | $ | 103,132 | $ | — | $ | 200,000 | ||||||||
| 2017 | $ | 96,868 | $ | — | $ | — | $ | 96,868 | ||||||||
| 2016 | $ | 126,868 | $ | (30,000 | ) (A) | $ | — | $ | 96,868 | |||||||
| (A) | Reduction in allowance for doubtful accounts due to adjustment in reserve balance. |
| Description | Balance
at beginning of period | Additions charged (credited) to cost and expenses | (Deductions) | Balance
at end of period | ||||||||||||
| Deferred tax valuation allowance-years ended June 30: | ||||||||||||||||
| 2018 | $ | 628,730 | $ | 3,467,623 | $ | 4,096,353 | ||||||||||
| 2017 | $ | 628,730 | — | — | $ | 628,730 | ||||||||||
| 2016 | $ | 628,730 | $ | — | $ | — | $ | 628,730 | ||||||||
F-26