Attached files
| file | filename |
|---|---|
| EX-99.2 - EX-99.2 - CARVANA CO. | d621973dex992.htm |
| 8-K - 8-K - CARVANA CO. | d621973d8k.htm |

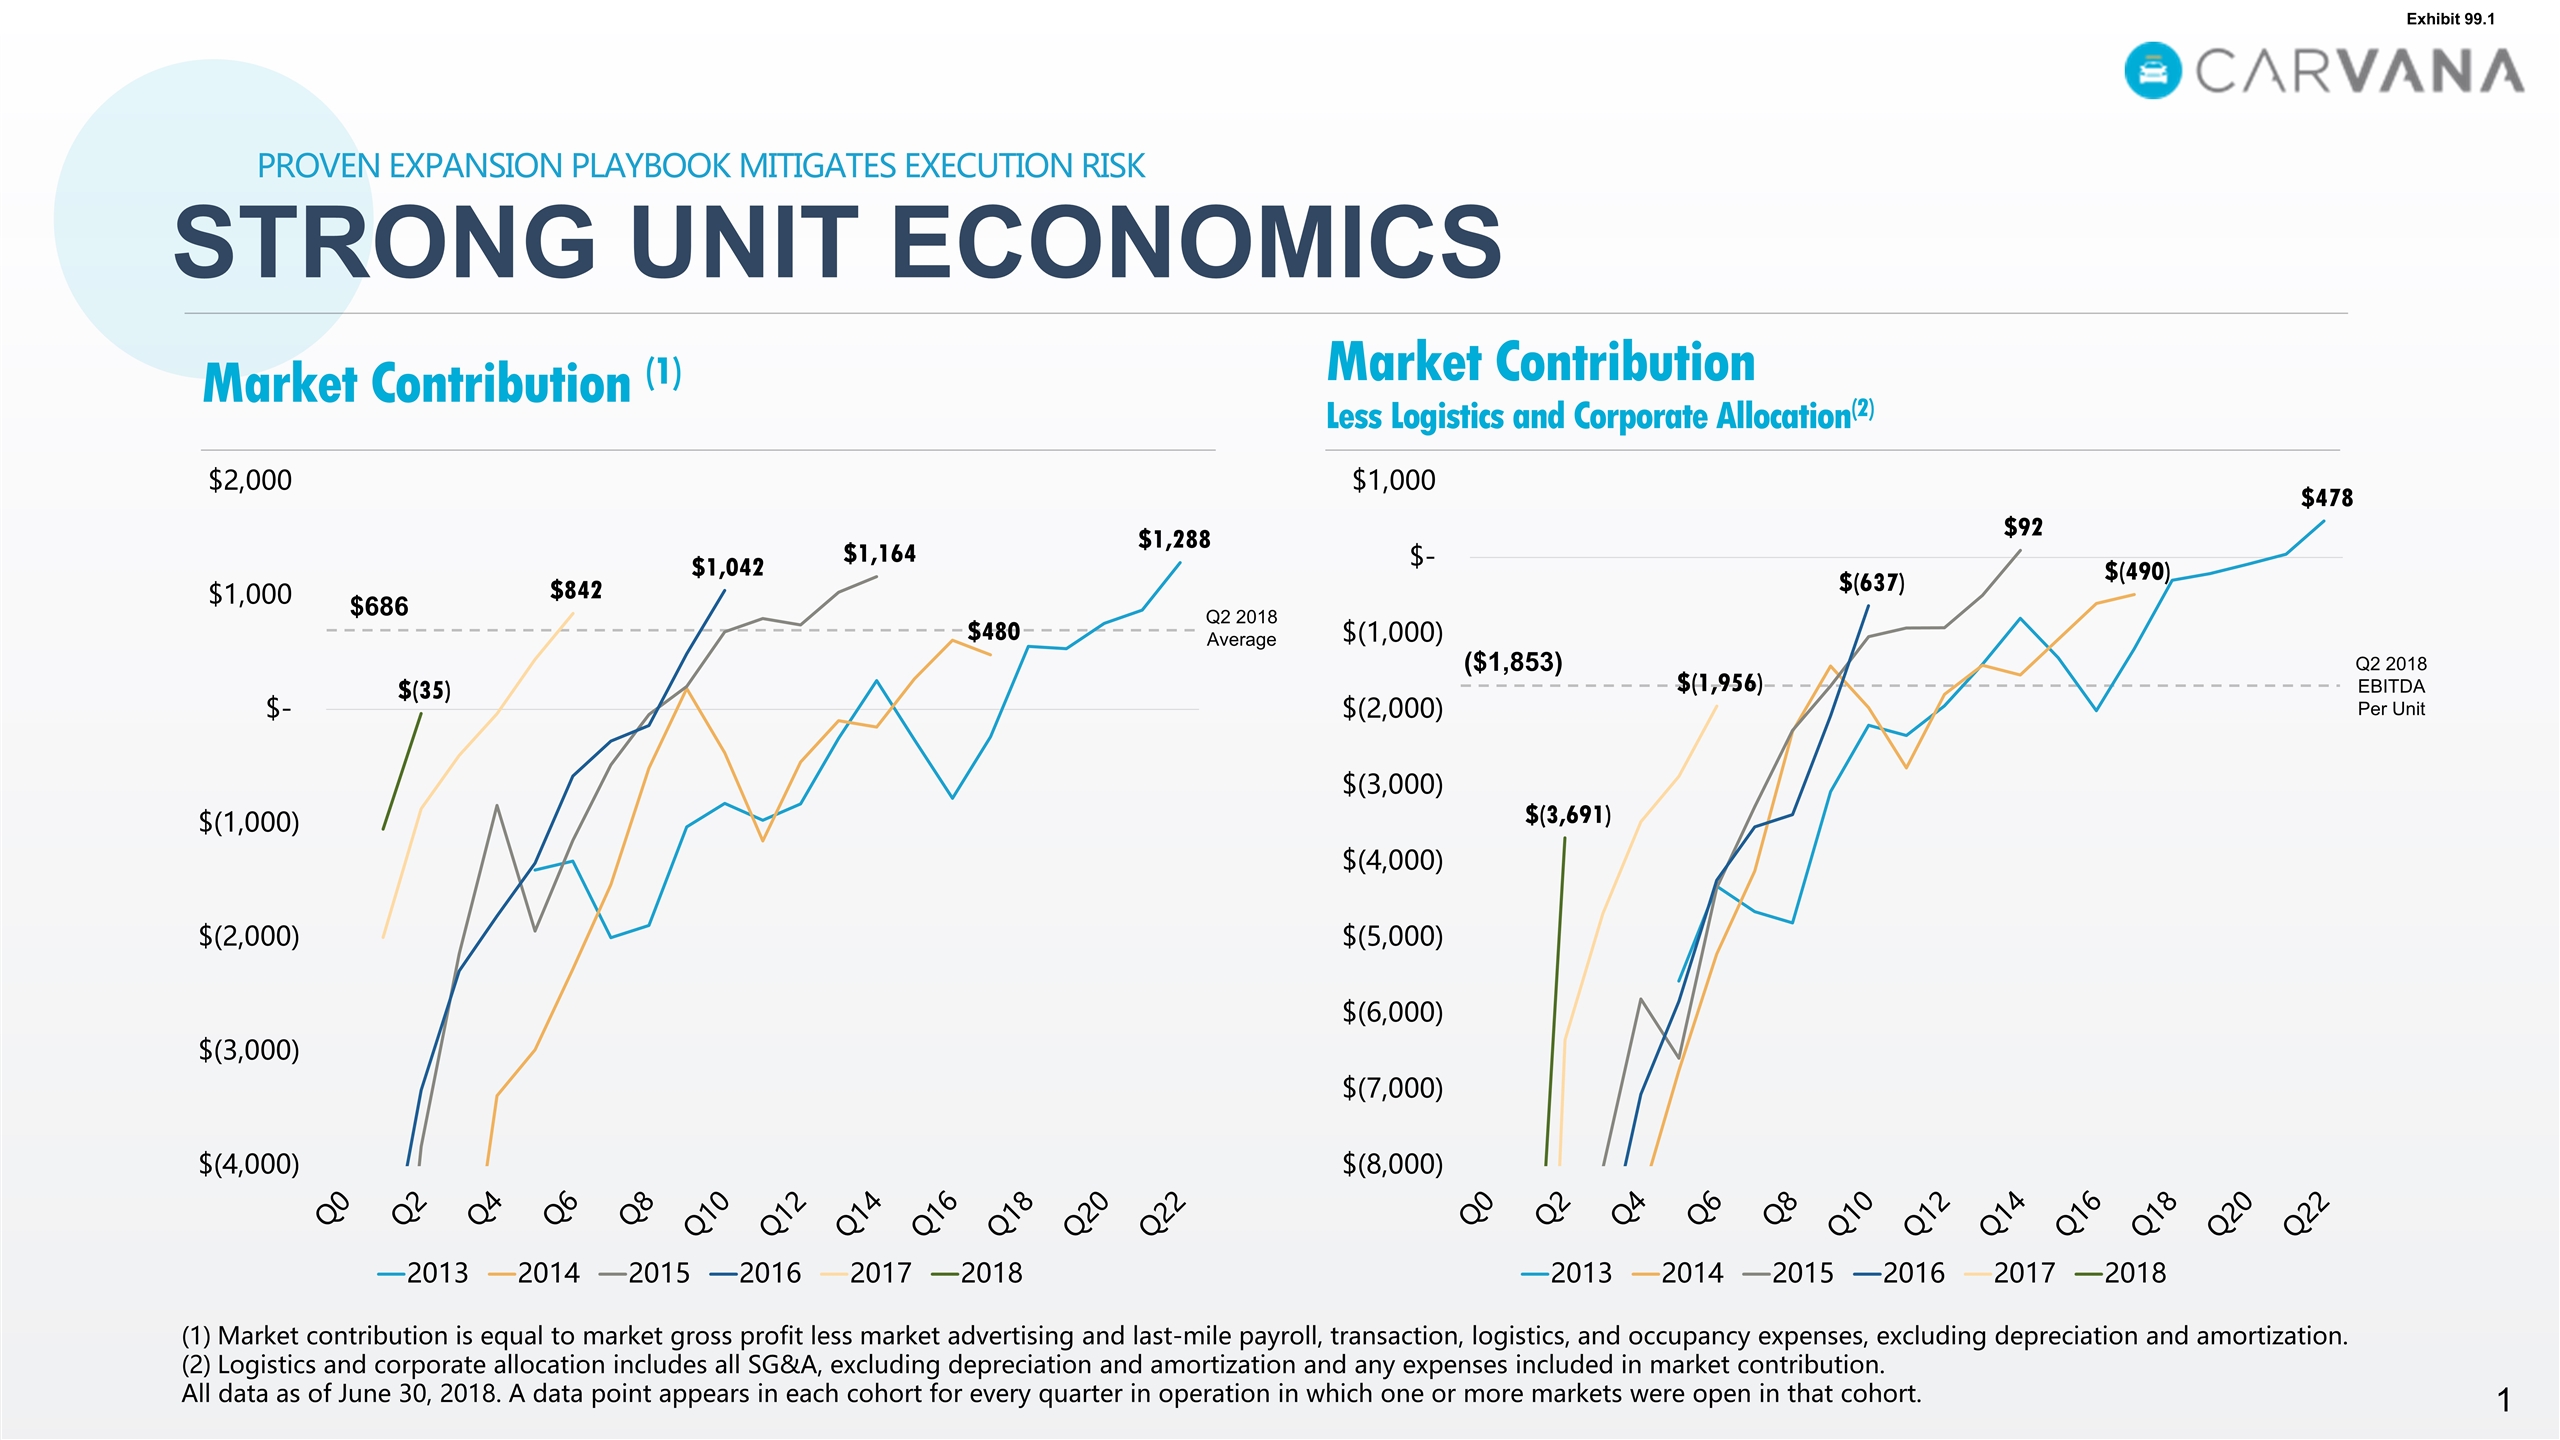
Q2 2018 EBITDA Per Unit ($1,853) Proven Expansion Playbook Mitigates Execution Risk STRONG UNIT ECONOMICS Market contribution is equal to market gross profit less market advertising and last-mile payroll, transaction, logistics, and occupancy expenses, excluding depreciation and amortization. Logistics and corporate allocation includes all SG&A, excluding depreciation and amortization and any expenses included in market contribution. All data as of June 30, 2018. A data point appears in each cohort for every quarter in operation in which one or more markets were open in that cohort. Market Contribution (1) Market Contribution Less Logistics and Corporate Allocation(2) Q2 2018 Average $686 Exhibit 99.1

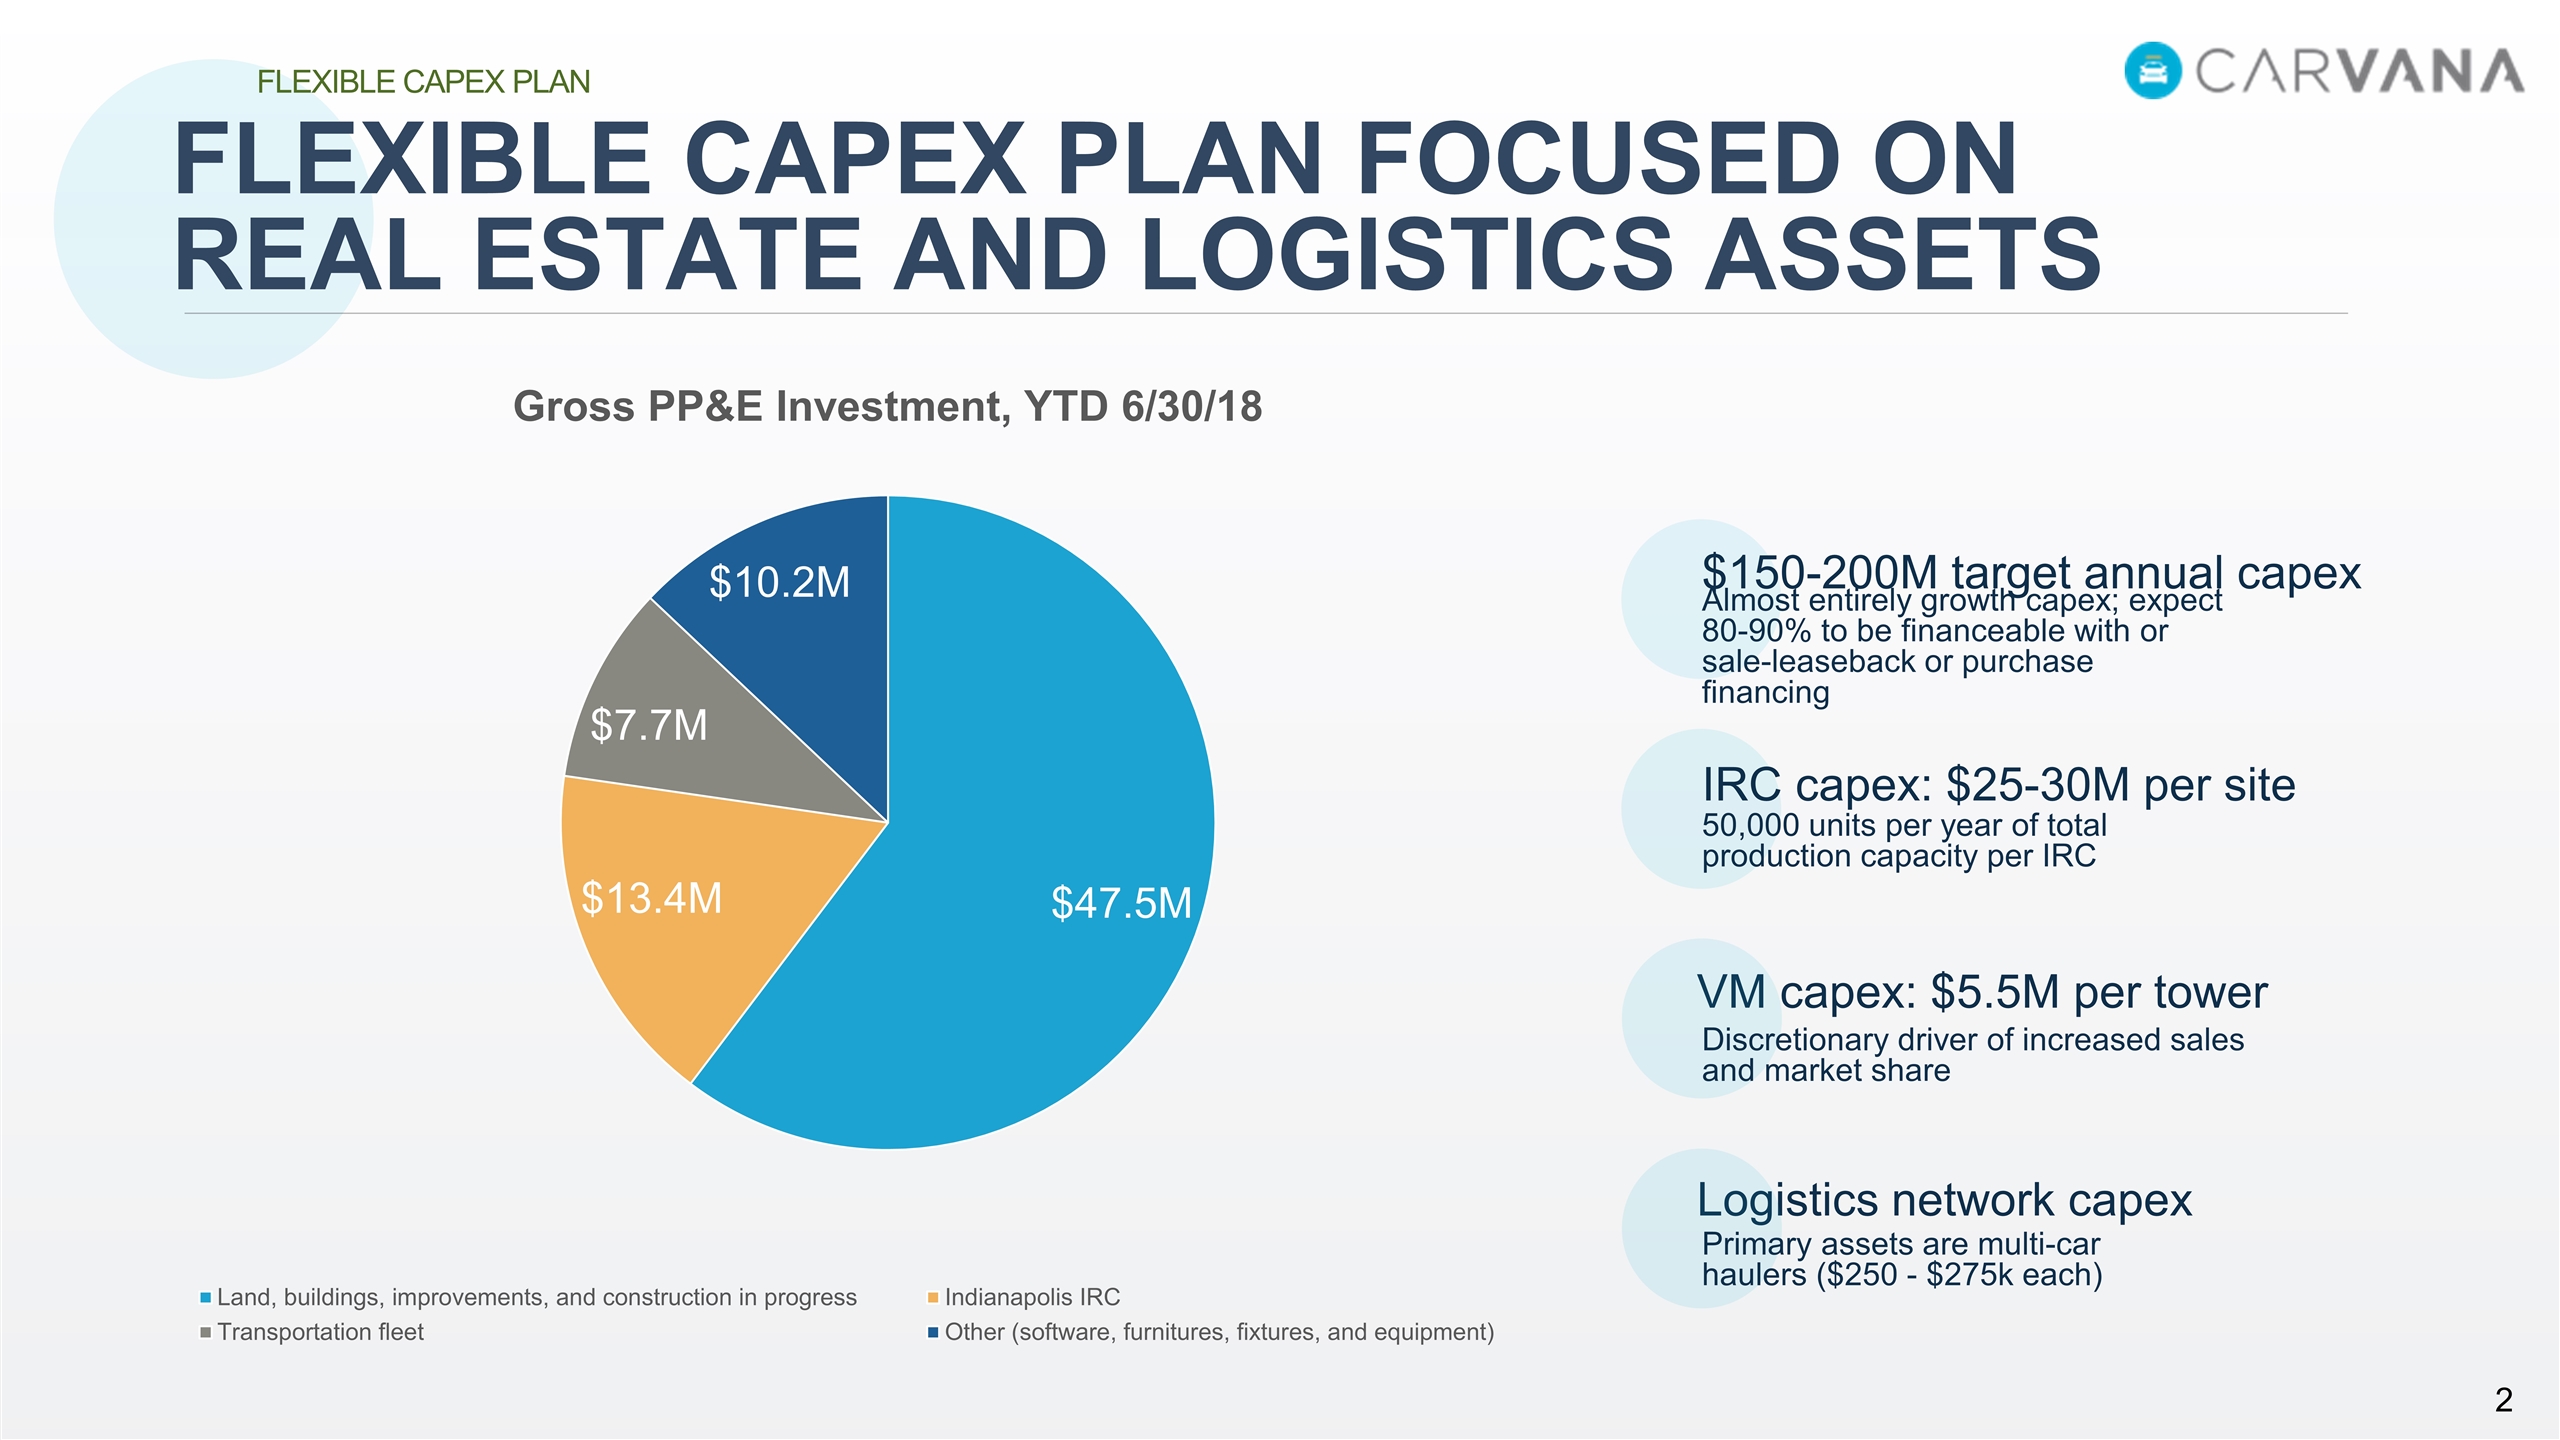
FLEXIBLE CAPEX PLAN FOCUSED ON REAL ESTATE AND LOGISTICS ASSETS FLEXIBLE CAPEX PLAN Almost entirely growth capex; expect 80-90% to be financeable with or sale-leaseback or purchase financing $150-200M target annual capex VM capex: $5.5M per tower Logistics network capex IRC capex: $25-30M per site 50,000 units per year of total production capacity per IRC Discretionary driver of increased sales and market share Primary assets are multi-car haulers ($250 - $275k each)

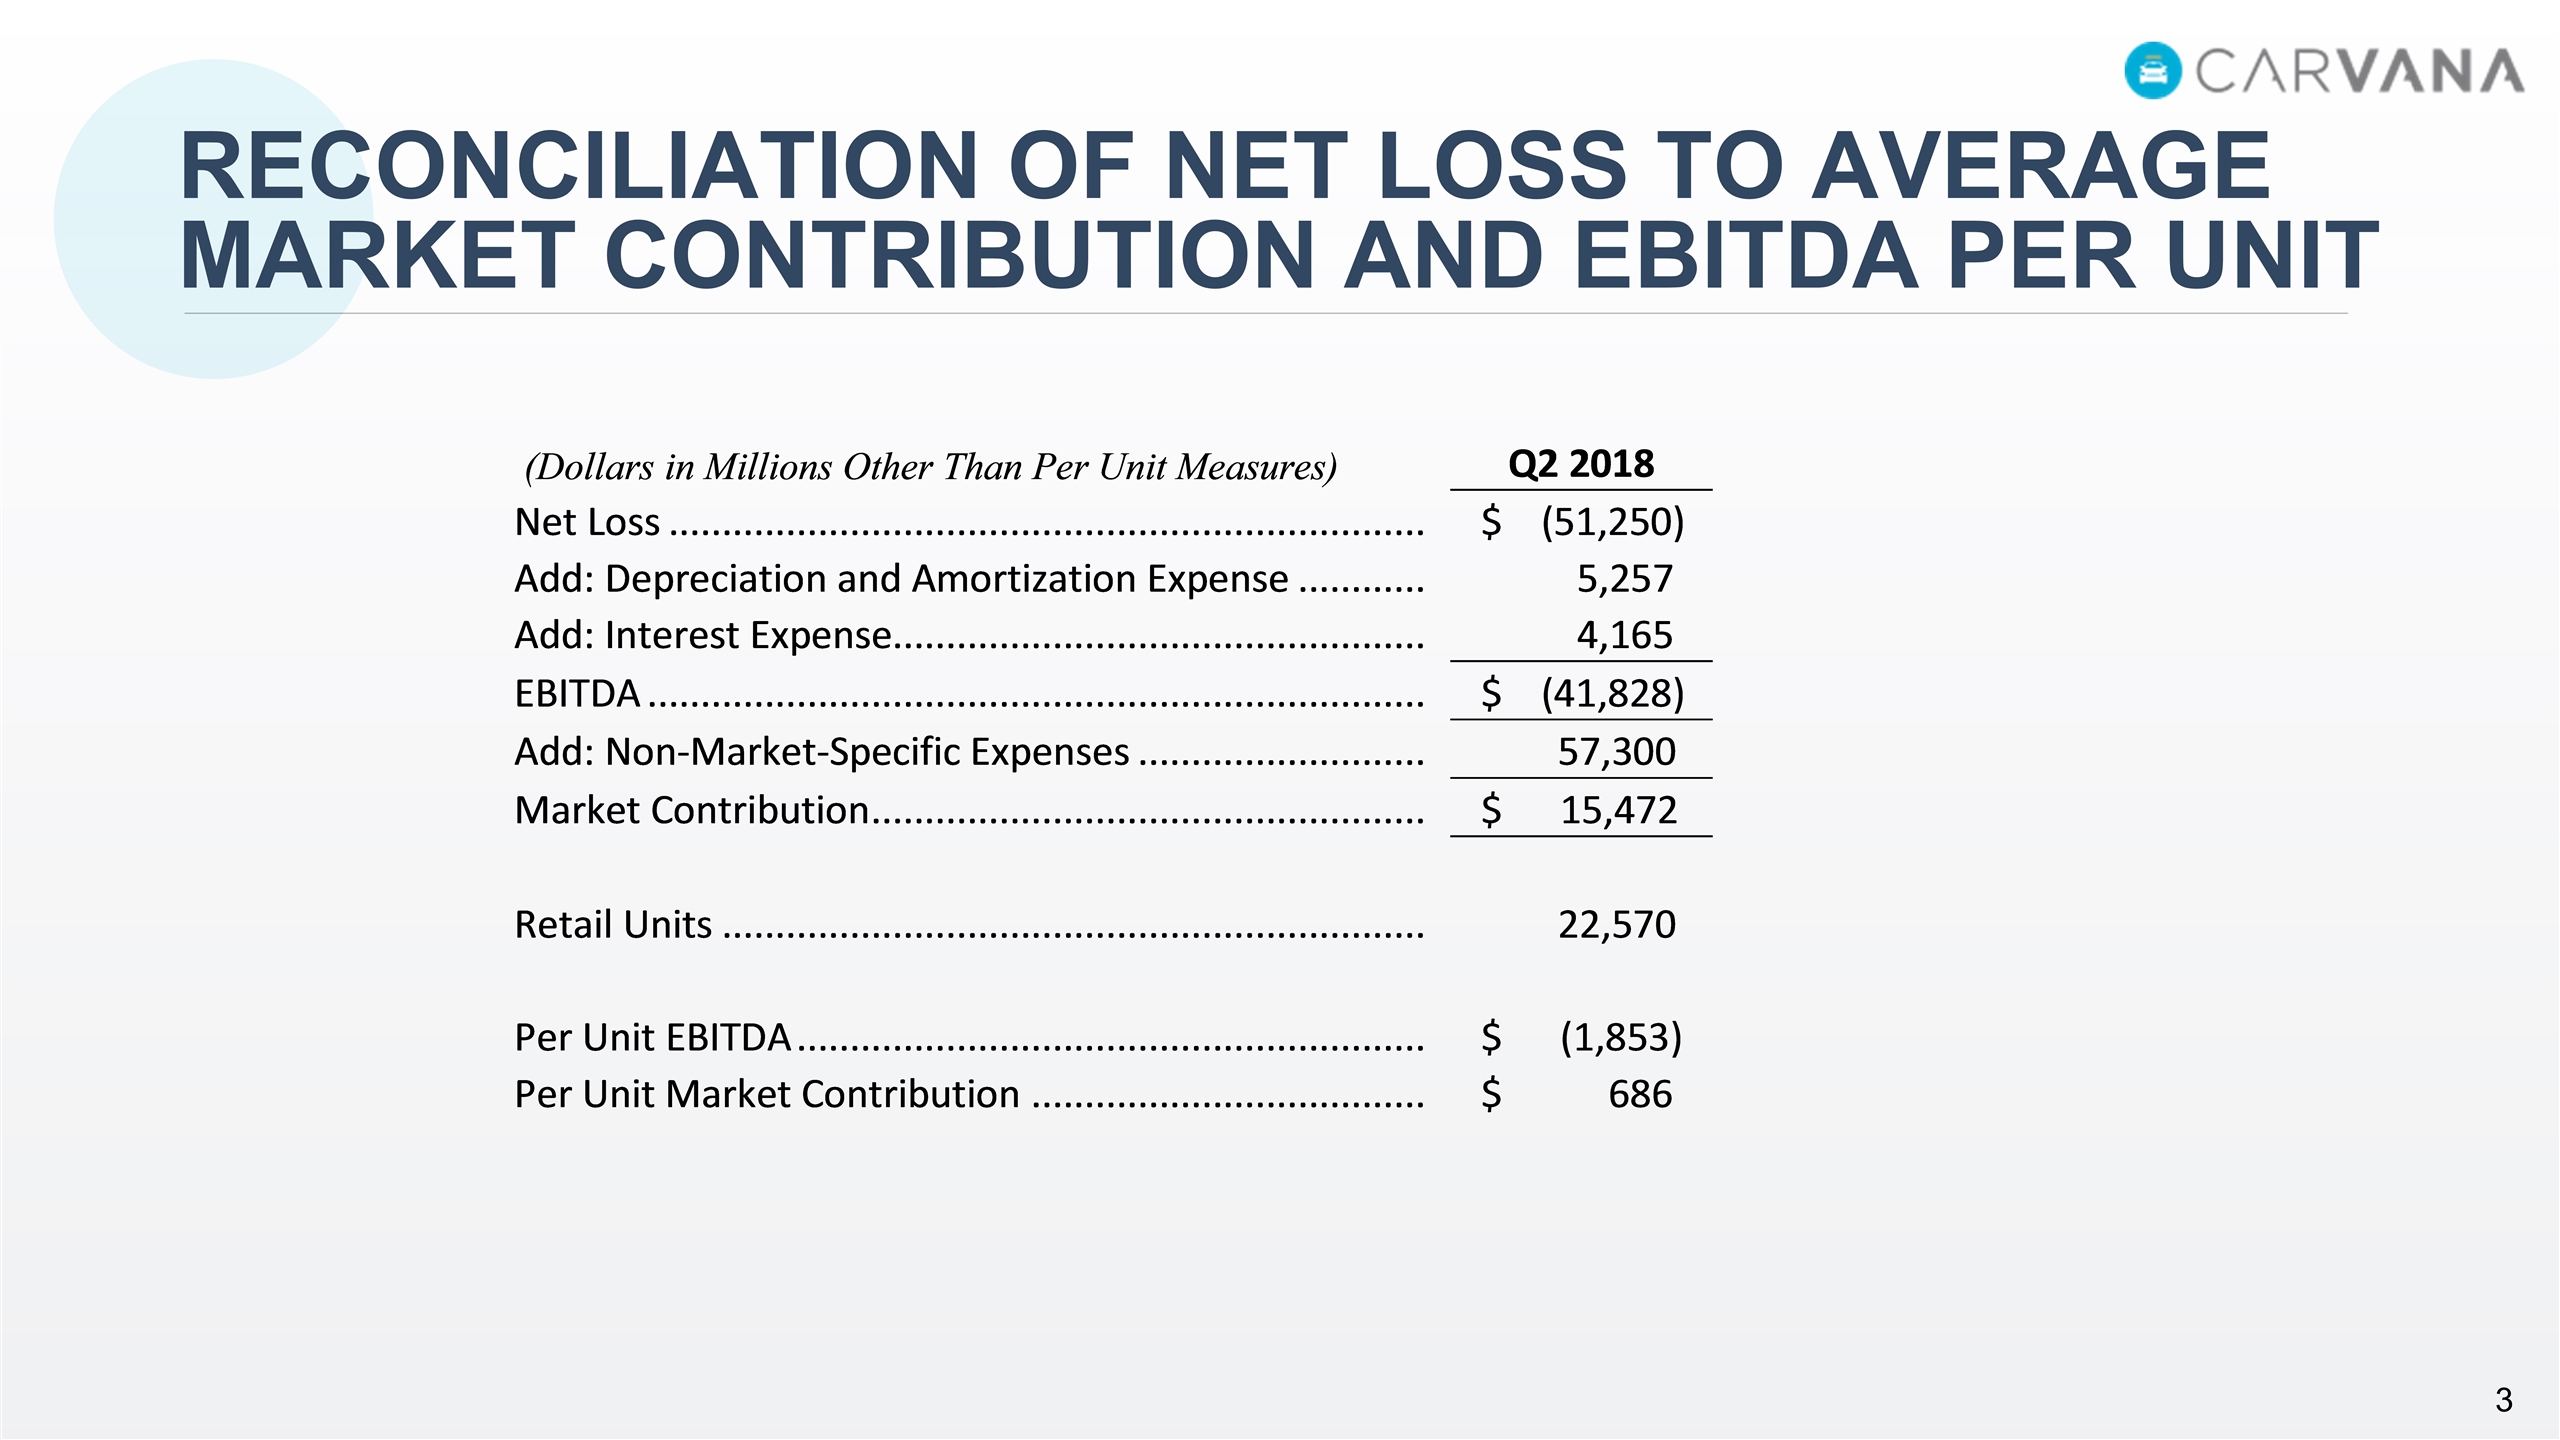
Reconciliation of Net Loss to Average Market Contribution and EBITDA Per Unit
