Attached files
| file | filename |
|---|---|
| 8-K - 8-K - Inuvo, Inc. | form8-kxxirdeckx9x6x18.htm |

1
Safe Harbor Statement 2 This presentation includes or incorporates by reference statements that constitute forward-looking statements within the meaning of Section 27A of the Securities Act of 1933, as amended, and Section 21E of the Securities Exchange Act of 1934, as amended. These statements relate to future events or to our future financial performance, and involve known and unknown risks, uncertainties and other factors that may cause the Company’s actual results, levels of activity, performance, or achievements to be materially different from any future results, levels of activity, performance or achievements expressed or implied by these forward‐looking statements. These statements include, but are not limited to, information or assumptions about expenses, capital and other expenditures, financing plans, capital structure, cash flow, liquidity, management’s plans, goals and objectives for future operations and growth. In some cases, you can identify forward‐looking statements by the use of words such as “may,” “could,” “expect,” “intend,” “plan,” “seek,” “anticipate,” “believe,” “estimate,” “predict,” “potential,” “continue,” or the negative of these terms or other comparable terminology. You should not place undue reliance on forward‐looking statements since they involve known and unknown risks, uncertainties and other factors which are, in some cases, beyond our control and which could cause actual performance or results to differ materially from those expressed in or suggested by forward-looking statements. These statements are based on the current expectations or beliefs of the Company’s management and are subject to various known and unknown risks that could cause actual results to differ materially from those described in the forward-looking statements, including, but not limited to, product demand, pricing, market acceptance, changing economic conditions, risks in product and technology development, the effect of the Company's accounting policies, increasing competition, the Company’s ability to integrate companies and businesses acquired by it and certain other risk factors, including those that are set forth from time to time in the Company's filings with the United States Securities and Exchange Commission, which may cause the actual results, performance and achievements of the Company to be materially different from any future results, performance and achievements implied by such forward- looking statements.
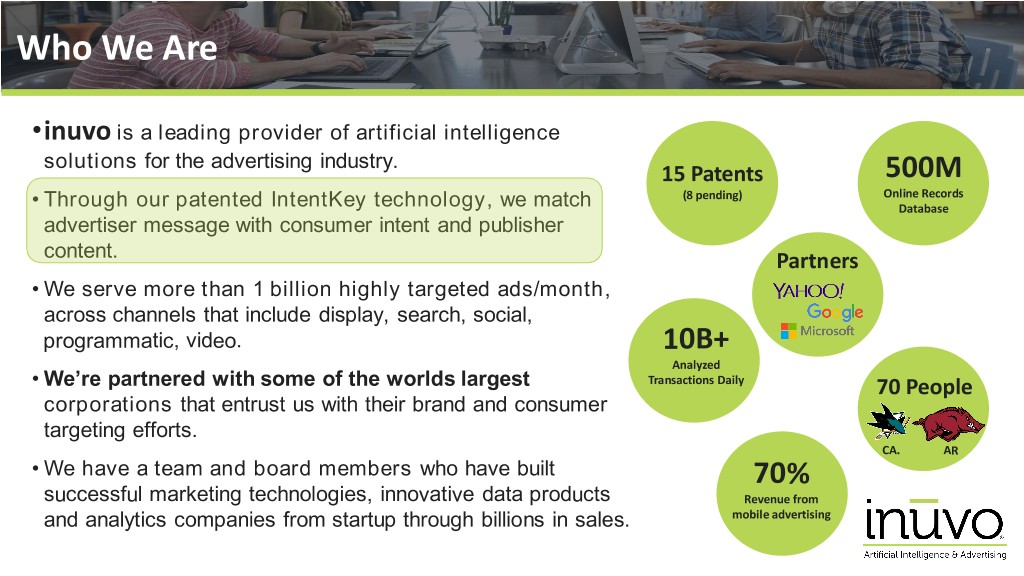
Who We Are 3 •inuvo is a leading provider of artificial intelligence solutions for the advertising industry. 15 Patents 500M (8 pending) Online Records • Through our patented IntentKey technology, we match Database advertiser message with consumer intent and publisher content. Partners • We serve more than 1 billion highly targeted ads/month, across channels that include display, search, social, programmatic, video. 10B+ Analyzed • We’re partnered with some of the worlds largest Transactions Daily 70 People corporations that entrust us with their brand and consumer targeting efforts. CA. AR • We have a team and board members who have built 70% successful marketing technologies, innovative data products Revenue from and analytics companies from startup through billions in sales. mobile advertising
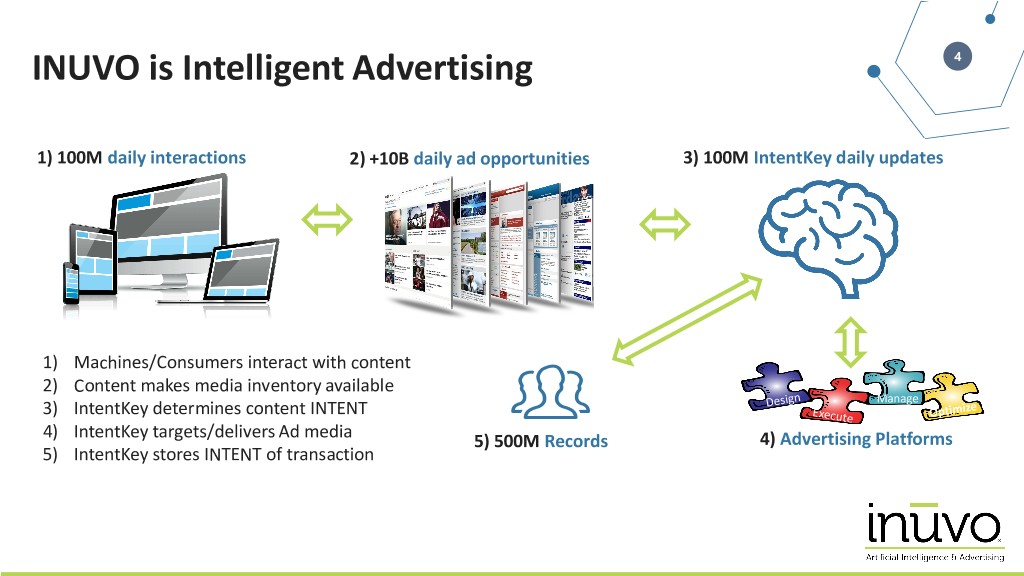
INUVO is Intelligent Advertising 4 1) 100M daily interactions 2) +10B daily ad opportunities 3) 100M IntentKey daily updates 1) Machines/Consumers interact with content 2) Content makes media inventory available Manage 3) IntentKey determines content INTENT 4) IntentKey targets/delivers Ad media 5) 500M Records 4) Advertising Platforms 5) IntentKey stores INTENT of transaction
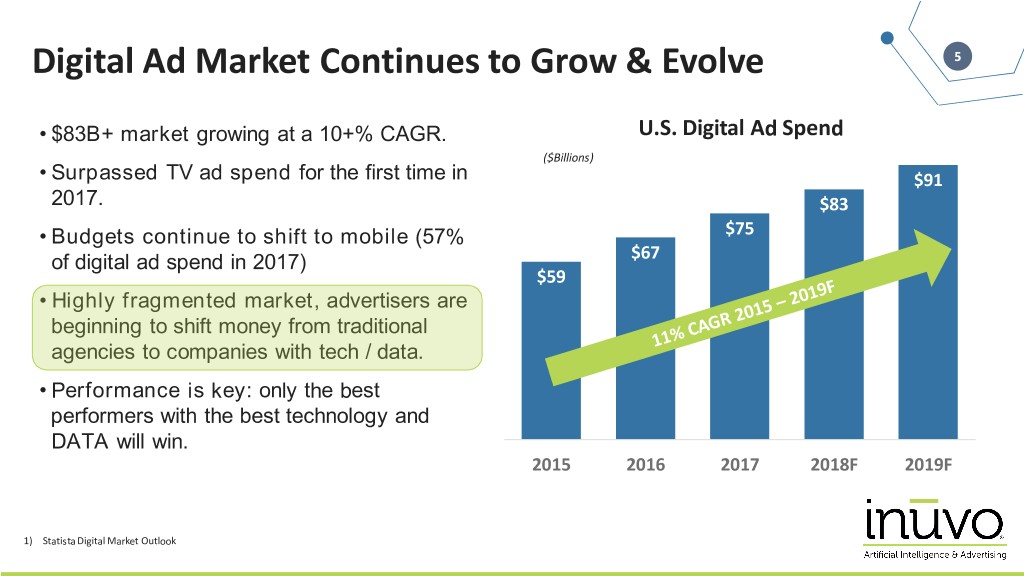
Digital Ad Market Continues to Grow & Evolve 5 • $83B+ market growing at a 10+% CAGR. U.S. Digital Ad Spend ($Billions) • Surpassed TV ad spend for the first time in $91 2017. $83 • Budgets continue to shift to mobile (57% $75 of digital ad spend in 2017) $67 $59 • Highly fragmented market, advertisers are beginning to shift money from traditional agencies to companies with tech / data. • Performance is key: only the best performers with the best technology and DATA will win. 2015 2016 2017 2018F 2019F 1) Statista Digital Market Outlook
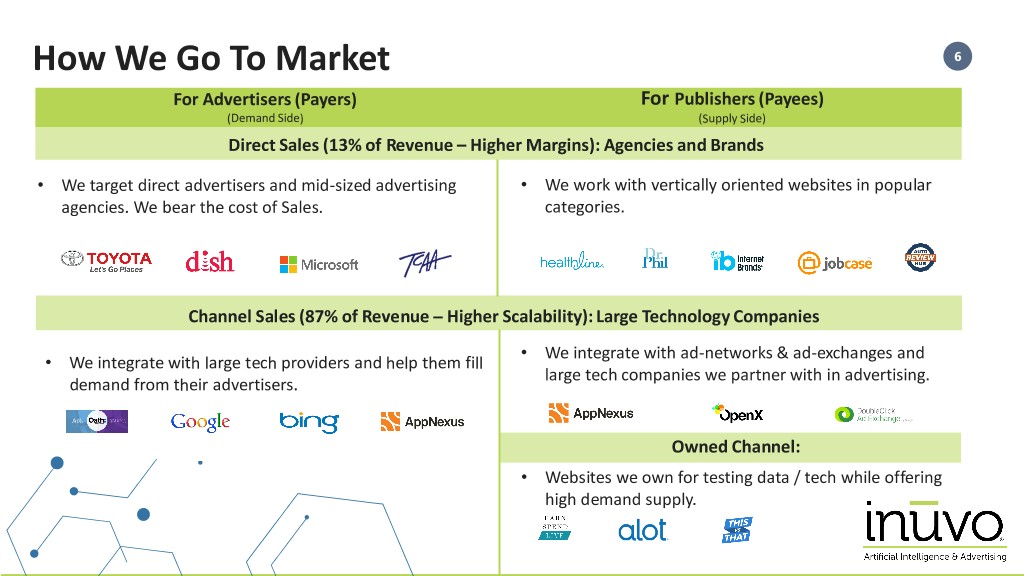
How We Go To Market 6 For Advertisers (Payers) For Publishers (Payees) (Demand Side) (Supply Side) Direct Sales (13% of Revenue – Higher Margins): Agencies and Brands • We target direct advertisers and mid-sized advertising • We work with vertically oriented websites in popular agencies. We bear the cost of Sales. categories. Channel Sales (87% of Revenue – Higher Scalability): Large Technology Companies • We integrate with ad-networks & ad-exchanges and • We integrate with large tech providers and help them fill large tech companies we partner with in advertising. demand from their advertisers. Owned Channel: • Websites we own for testing data / tech while offering high demand supply.
Our Scope: >1B Ads/Month for Notable Brands 7 A proven track record with a strong portfolio of advertisers, partners and publishers
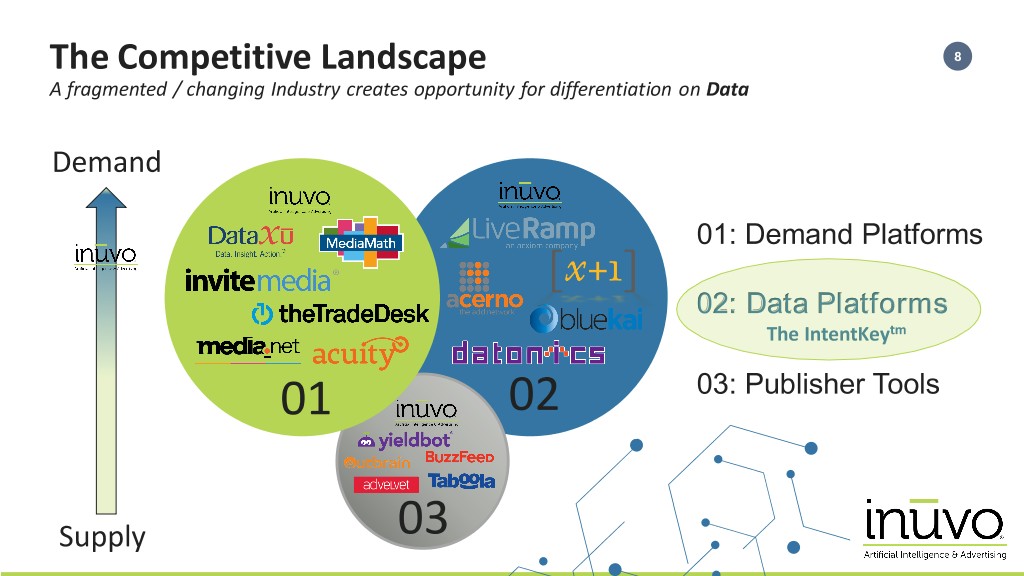
The Competitive Landscape 8 A fragmented / changing Industry creates opportunity for differentiation on Data Demand 01: Demand Platforms 02: Data Platforms The IntentKeytm 01 02 03: Publisher Tools Supply 03
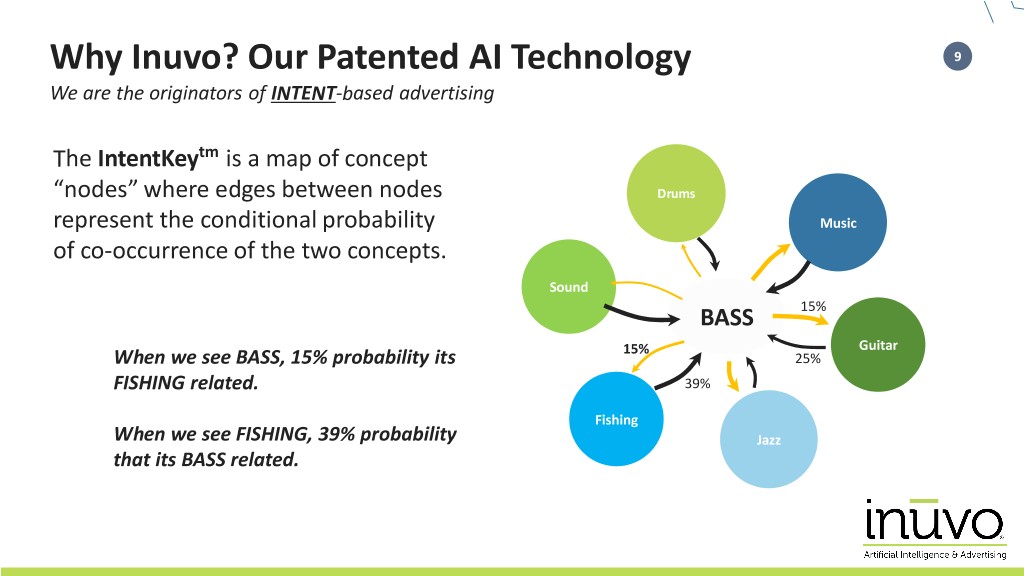
Why Inuvo? Our Patented AI Technology 9 We are the originators of INTENT-based advertising The IntentKeytm is a map of concept “nodes” where edges between nodes Drums represent the conditional probability Music of co-occurrence of the two concepts. Sound BASS 15% 15% Guitar When we see BASS, 15% probability its 25% FISHING related. 39% Fishing When we see FISHING, 39% probability Jazz that its BASS related.
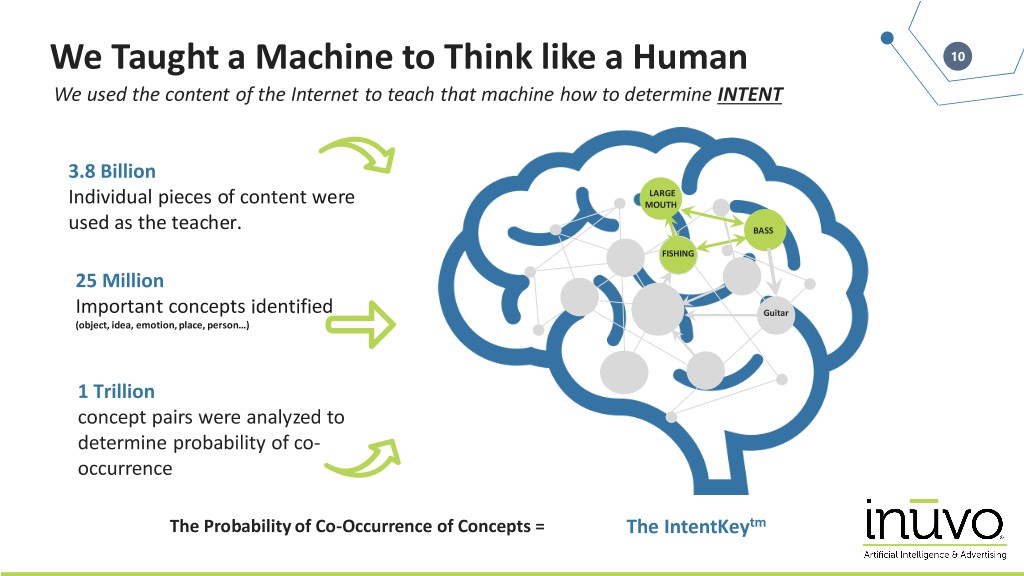
We Taught a Machine to Think like a Human 10 We used the content of the Internet to teach that machine how to determine INTENT 3.8 Billion LARGE Individual pieces of content were MOUTH used as the teacher. BASS FISHING 25 Million Important concepts identified Guitar (object, idea, emotion, place, person…) 1 Trillion concept pairs were analyzed to determine probability of co- occurrence The Probability of Co-Occurrence of Concepts = The IntentKeytm
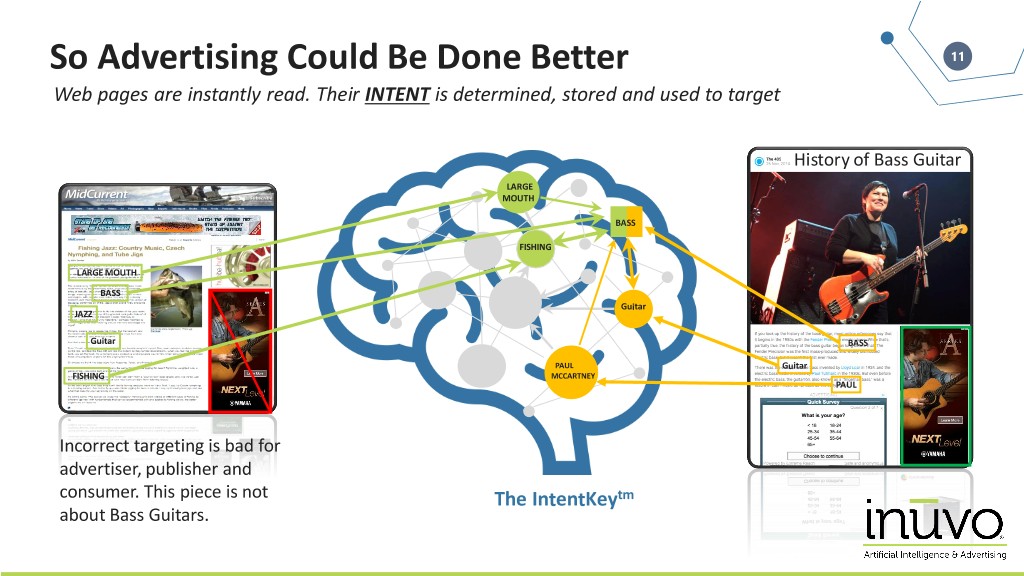
So Advertising Could Be Done Better 11 Web pages are instantly read. Their INTENT is determined, stored and used to target History of Bass Guitar LARGE MOUTH BASS FISHING LARGE MOUTH BASS Guitar JAZZ Guitar BASS PAUL Guitar FISHING MCCARTNEY PAUL Incorrect targeting is bad for advertiser, publisher and consumer. This piece is not The IntentKeytm about Bass Guitars.
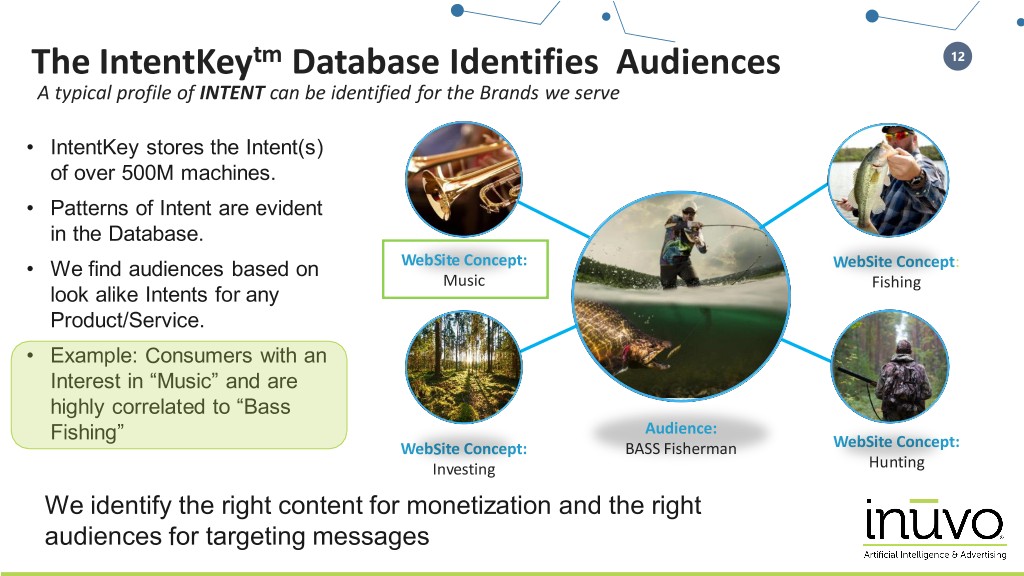
The IntentKeytm Database Identifies Audiences 12 A typical profile of INTENT can be identified for the Brands we serve • IntentKey stores the Intent(s) of over 500M machines. • Patterns of Intent are evident in the Database. • We find audiences based on WebSite Concept: WebSite Concept: Music Fishing look alike Intents for any Product/Service. • Example: Consumers with an Interest in “Music” and are highly correlated to “Bass Fishing” Audience: WebSite Concept: BASS Fisherman WebSite Concept: Investing Hunting We identify the right content for monetization and the right audiences for targeting messages
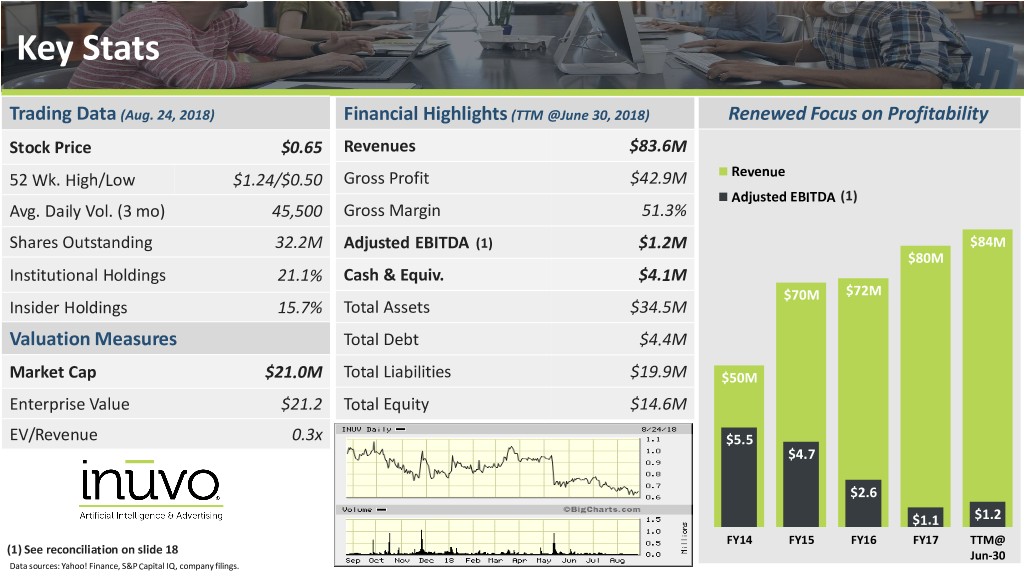
Key Stats 13 Trading Data (Aug. 24, 2018) Financial Highlights (TTM @June 30, 2018) Renewed Focus on Profitability Stock Price $0.65 Revenues $83.6M 52 Wk. High/Low $1.24/$0.50 Gross Profit $42.9M Revenue Adjusted EBITDA (1) Avg. Daily Vol. (3 mo) 45,500 Gross Margin 51.3% Shares Outstanding 32.2M Adjusted EBITDA (1) $1.2M $84M $80M Institutional Holdings 21.1% Cash & Equiv. $4.1M $70M $72M Insider Holdings 15.7% Total Assets $34.5M Valuation Measures Total Debt $4.4M Market Cap $21.0M Total Liabilities $19.9M $50M Enterprise Value $21.2 Total Equity $14.6M EV/Revenue 0.3x $5.5 $4.7 $2.6 $1.1 $1.2 FY14 FY15 FY16 FY17 TTM@ (1) See reconciliation on slide 18 Jun-30 Data sources: Yahoo! Finance, S&P Capital IQ, company filings.
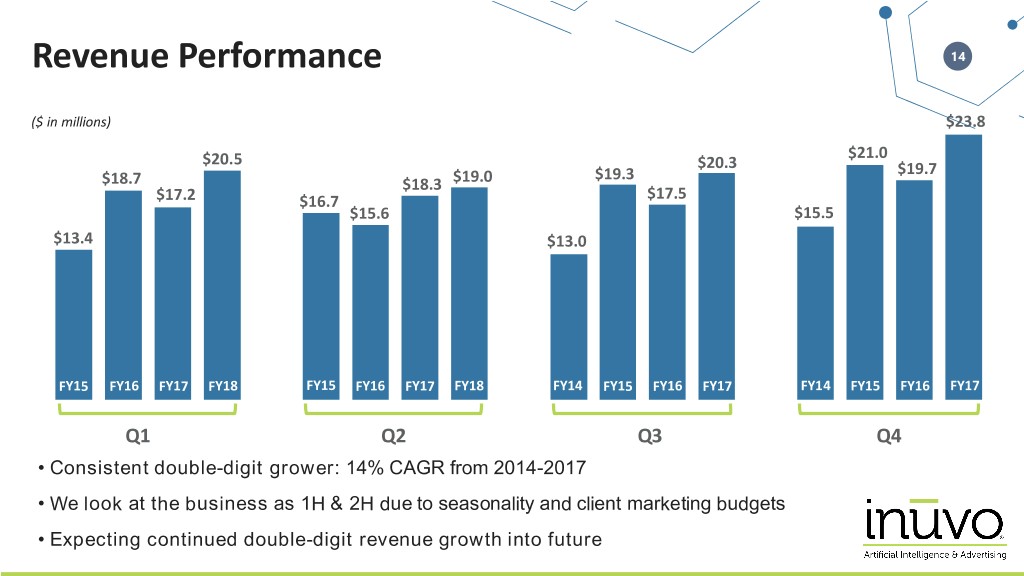
Revenue Performance 14 ($ in millions) $23.8 $21.0 $20.5 $20.3 $19.3 $19.7 $18.7 $18.3 $19.0 $17.2 $16.7 $17.5 $15.6 $15.5 $13.4 $13.0 FY15 FY16 FY17 FY18 FY15 FY16 FY17 FY18 FY14 FY15 FY16 FY17 FY14 FY15 FY16 FY17 Q1 Q2 Q3 Q4 • Consistent double-digit grower: 14% CAGR from 2014-2017 • We look at the business as 1H & 2H due to seasonality and client marketing budgets • Expecting continued double-digit revenue growth into future
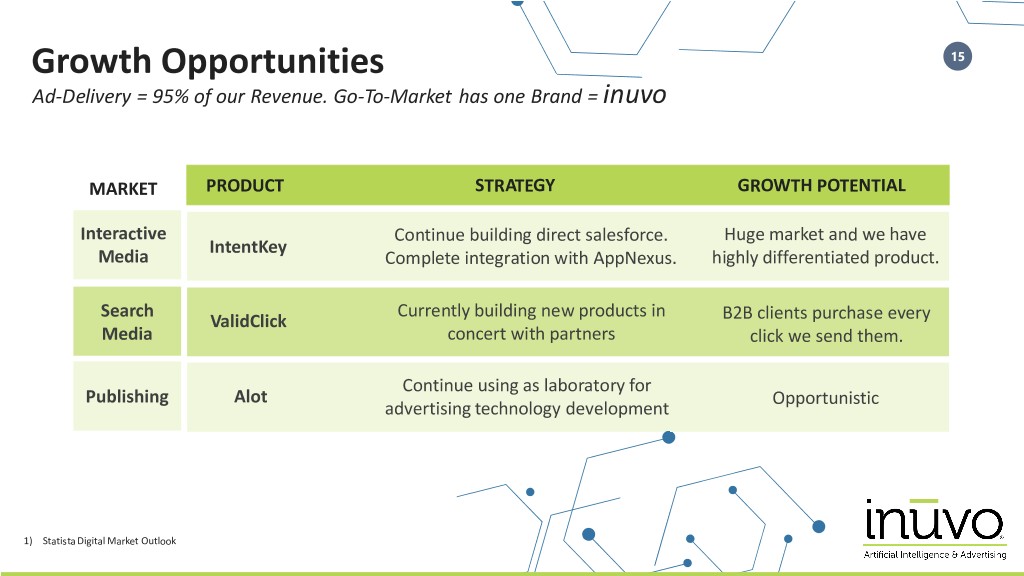
Growth Opportunities 15 Ad-Delivery = 95% of our Revenue. Go-To-Market has one Brand = inuvo MARKET PRODUCT STRATEGY GROWTH POTENTIAL Interactive Continue building direct salesforce. Huge market and we have IntentKey Media Complete integration with AppNexus. highly differentiated product. Search Currently building new products in ValidClick B2B clients purchase every Media concert with partners click we send them. Continue using as laboratory for Publishing Alot Opportunistic advertising technology development 1) Statista Digital Market Outlook
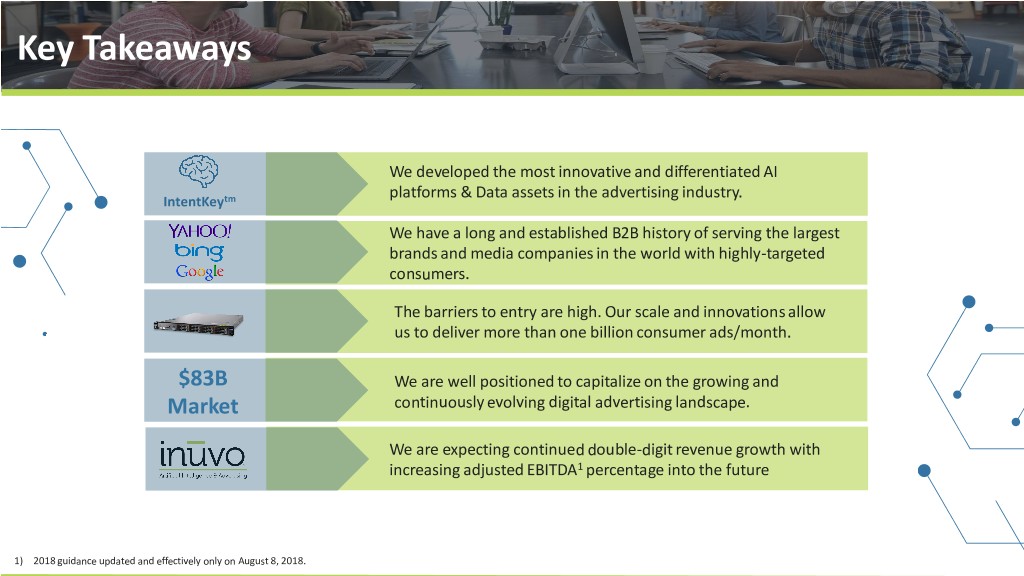
Key Takeaways 16 We developed the most innovative and differentiated AI platforms & Data assets in the advertising industry. IntentKeytm We have a long and established B2B history of serving the largest brands and media companies in the world with highly-targeted consumers. The barriers to entry are high. Our scale and innovations allow us to deliver more than one billion consumer ads/month. $83B We are well positioned to capitalize on the growing and Market continuously evolving digital advertising landscape. We are expecting continued double-digit revenue growth with increasing adjusted EBITDA1 percentage into the future 1) 2018 guidance updated and effectively only on August 8, 2018.

17 Get In Touch Richard Howe, CEO Wally Ruiz, CFO Phone: 501-205-8508 richard.howe@inuvo.com wallace.ruiz@inuvo.com
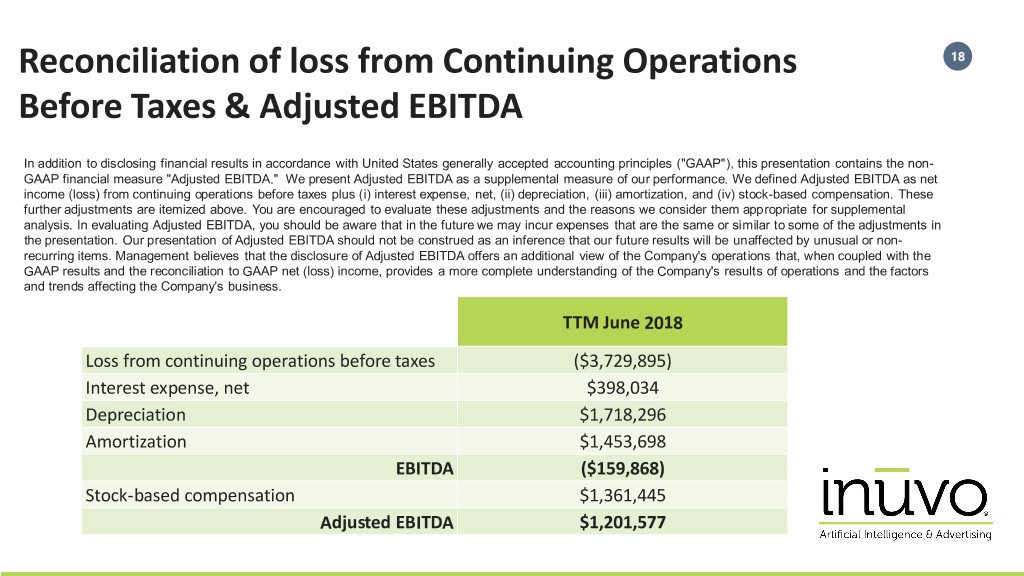
Reconciliation of loss from Continuing Operations 18 Before Taxes & Adjusted EBITDA In addition to disclosing financial results in accordance with United States generally accepted accounting principles ("GAAP"), this presentation contains the non- GAAP financial measure "Adjusted EBITDA." We present Adjusted EBITDA as a supplemental measure of our performance. We defined Adjusted EBITDA as net income (loss) from continuing operations before taxes plus (i) interest expense, net, (ii) depreciation, (iii) amortization, and (iv) stock-based compensation. These further adjustments are itemized above. You are encouraged to evaluate these adjustments and the reasons we consider them appropriate for supplemental analysis. In evaluating Adjusted EBITDA, you should be aware that in the future we may incur expenses that are the same or similar to some of the adjustments in the presentation. Our presentation of Adjusted EBITDA should not be construed as an inference that our future results will be unaffected by unusual or non- recurring items. Management believes that the disclosure of Adjusted EBITDA offers an additional view of the Company's operations that, when coupled with the GAAP results and the reconciliation to GAAP net (loss) income, provides a more complete understanding of the Company's results of operations and the factors and trends affecting the Company's business. TTM June 2018 Loss from continuing operations before taxes ($3,729,895) Interest expense, net $398,034 Depreciation $1,718,296 Amortization $1,453,698 EBITDA ($159,868) Stock-based compensation $1,361,445 Adjusted EBITDA $1,201,577
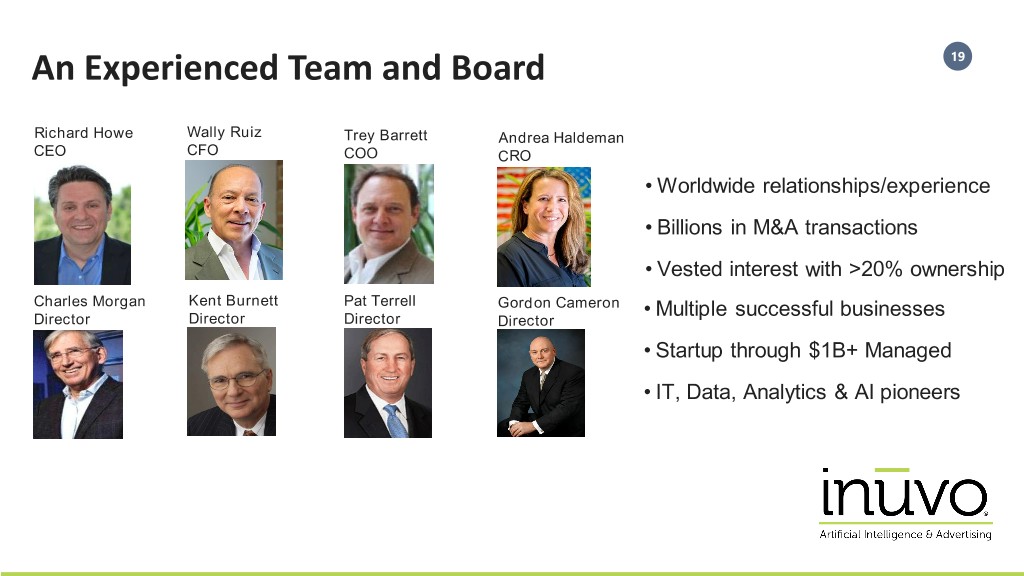
An Experienced Team and Board 19 Richard Howe Wally Ruiz Trey Barrett Andrea Haldeman CEO CFO COO CRO • Worldwide relationships/experience • Billions in M&A transactions • Vested interest with >20% ownership Charles Morgan Kent Burnett Pat Terrell Gordon Cameron • Multiple successful businesses Director Director Director Director • Startup through $1B+ Managed • IT, Data, Analytics & AI pioneers
