Attached files
| file | filename |
|---|---|
| 8-K - 8-K - Inspire Medical Systems, Inc. | a18-27010_18k.htm |
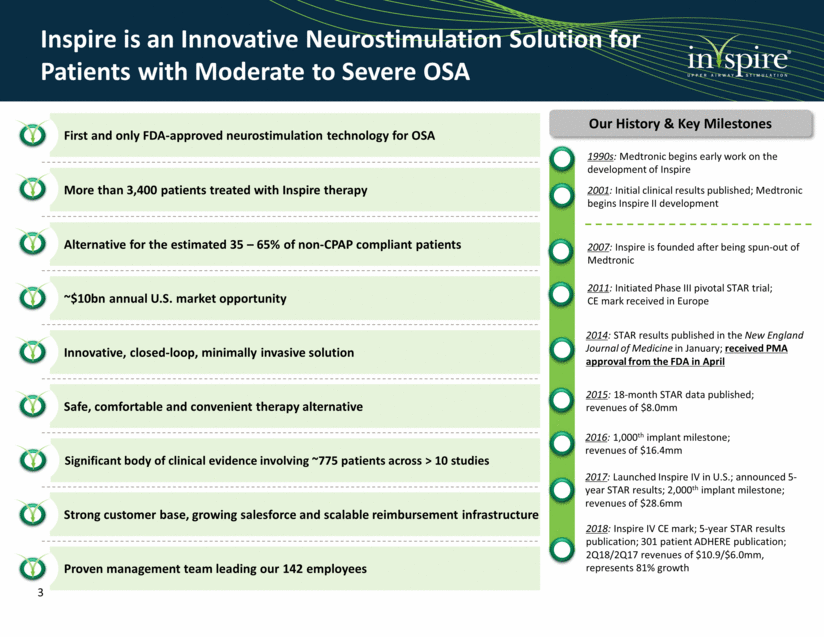
Disclaimer This presentation contains forward-looking statements within the meaning of the Private Securities Litigation Reform Act of 1995. All statements other than statements of historical facts are forward-looking statements. In some cases, you can identify forward-looking statements by terms such as ‘‘may,’’ ‘‘will,’’ ‘‘should,’’ ‘‘expect,’’ ‘‘plan,’’ ‘‘anticipate,’’ ‘‘could,’’ “future,” “outlook,” ‘‘intend,’’ ‘‘target,’’ ‘‘project,’’ ‘‘contemplate,’’ ‘‘believe,’’ ‘‘estimate,’’ ‘‘predict,’’ ‘‘potential,’’ ‘‘continue,’’ or the negative of these terms or other similar expressions, although not all forward-looking statements contain these words. The forward-looking statements in this presentation relate to, among other things, statements regarding our clinical data growth, product development, indication expansion, market development and prior authorization approvals. These forward-looking statements are based on management’s current expectations and involve known and unknown risks and uncertainties that may cause our actual results, performance or achievements to be materially different from any future results, performance or achievements expressed or implied by the forward-looking statements. Such risks and uncertainties include, among others, estimates regarding the annual total addressable market for our Inspire therapy in the U.S. and our market opportunity outside the U.S., future results of operations, financial position, research and development costs, capital requirements and our needs for additional financing; commercial success and market acceptance of our Inspire therapy; our ability to achieve and maintain adequate levels of coverage or reimbursement for our Inspire system or any future products we may seek to commercialize; competitive companies and technologies in our industry; our ability to expand our indications and develop and commercialize additional products and enhancements to our Inspire system; our business model and strategic plans for our products, technologies and business, including our implementation thereof; our ability to accurately forecast customer demand for our Inspire system and manage our inventory; our ability to expand, manage and maintain our direct sales and marketing organization, and to market and sell our Inspire system in markets outside of the U.S.; our ability to increase the number of active medical centers implanting Inspire therapy; our ability to hire and retain our senior management and other highly qualified personnel; our ability to commercialize or obtain regulatory approvals for our Inspire therapy and system, or the effect of delays in commercializing or obtaining regulatory approvals; FDA or other U.S. or foreign regulatory actions affecting us or the healthcare industry generally, including healthcare reform measures in the U.S. and international markets; and our ability to establish and maintain intellectual property protection for our Inspire therapy and system or avoid claims of infringement. Other important factors that could cause actual results, performance or achievements to differ materially from those contemplated in this presentation can be found under the captions “Risk Factors” and "Management's Discussion and Analysis of Financial Condition and Results of Operations“ in our Quarterly Report on Form 10-Q for the quarter ended June 30, 2018, as such factors may be updated from time to time in our other filings with the SEC, which are accessible on the SEC’s website at www.sec.gov. These and other important factors could cause actual results to differ materially from those indicated by the forward-looking statements made in this presentation. Any such forward-looking statements represent management’s estimates as of the date of this presentation. While we may elect to update such forward-looking statements at some point in the future, unless required by applicable law, we disclaim any obligation to do so, even if subsequent events cause our views to change. Thus, one should not assume that our silence over time means that actual events are bearing out as expressed or implied in such forward-looking statements. These forward-looking statements should not be relied upon as representing our views as of any date subsequent to the date of this presentation. This presentation contains trademarks, trade names and service marks of other companies, which are the property of their respective owners. We do not intend our use or display of other parties' trademarks, trade names or service marks to imply, and such use or display should not be construed to imply, a relationship with, or endorsement or sponsorship of us by, these other parties. 2
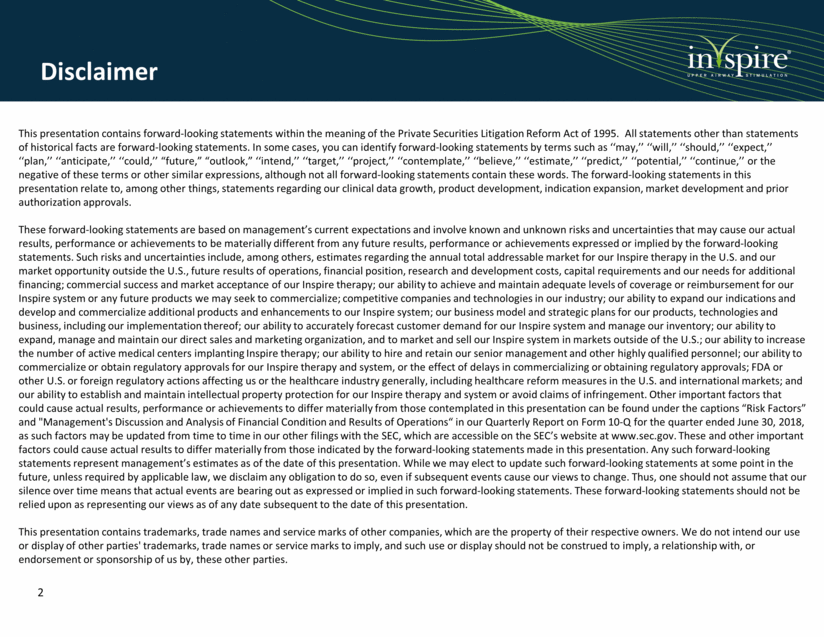
More than 3,400 patients treated with Inspire therapy First and only FDA-approved neurostimulation technology for OSA Alternative for the estimated 35 – 65% of non-CPAP compliant patients ~$10bn annual U.S. market opportunity Innovative, closed-loop, minimally invasive solution Safe, comfortable and convenient therapy alternative Significant body of clinical evidence involving ~775 patients across > 10 studies Proven management team leading our 142 employees Inspire is an Innovative Neurostimulation Solution for Patients with Moderate to Severe OSA 1990s: Medtronic begins early work on the development of Inspire 2001: Initial clinical results published; Medtronic begins Inspire II development 2007: Inspire is founded after being spun-out of Medtronic 2011: Initiated Phase III pivotal STAR trial; CE mark received in Europe 2014: STAR results published in the New England Journal of Medicine in January; received PMA approval from the FDA in April 2015: 18-month STAR data published; revenues of $8.0mm 2016: 1,000th implant milestone; revenues of $16.4mm 2017: Launched Inspire IV in U.S.; announced 5-year STAR results; 2,000th implant milestone; revenues of $28.6mm Our History & Key Milestones Strong customer base, growing salesforce and scalable reimbursement infrastructure 2018: Inspire IV CE mark; 5-year STAR results publication; 301 patient ADHERE publication; 2Q18/2Q17 revenues of $10.9/$6.0mm, represents 81% growth 3
Strong Management Team Tim Herbert President, CEO & Founder 30+ Years of Experience Rick Buchholz Chief Financial Officer 15+ Years of Experience Randy Ban SVP, Sales and Marketing 20+ Years of Experience 3 Other Key Management Steve Jandrich – Chief Compliance Officer, VP, Human Resources Kathy Sherwood – VP, Global Market Access Howard Green – VP, Marketing Andreas Henke – VP, Commercial Operations, Europe John Rondoni – VP, Product Development, Operations & QA Quan Ni – VP, Research 4
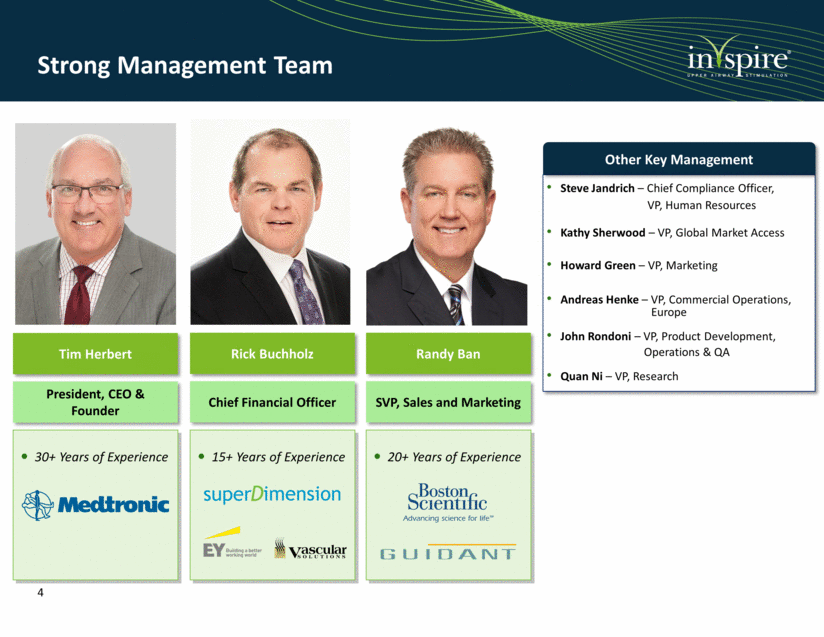
OSA is Caused by a Blocked or Partially Blocked Airway Obstructive Sleep Apnea (OSA) is a Serious and Chronic Disease Blockage prevents airflow to the lungs Results in repeated arousals and oxygen de-saturations Severity of sleep apnea is measured by frequency of apnea or hypopnea events per hour, which is referred to as the Apnea-Hypopnea Index (AHI) Most Patients Are Unaware of Their Condition and Untreated OSA Multiplies Serious Health Risks ____________________ Source: Company Website Redline et al, The Sleep Heart Health Study. Am J Res and Crit Care Med 2010. Gami et al, J Am Coll Cardiol 2013. Young et al, J Sleep 2008. Li et al, Europace 2014. Prospective Study of Obstructive Sleep Apnea and Incident Coronary Heart Disease and Heart Failure from SHHS and Wisconsin Sleep Cohort Study. Normal range: AHI < 5 events per hour Mild sleep apnea: 5 < AHI < 15 events per hour Moderate sleep apnea: 15 < AHI < 30 events per hour Severe sleep apnea: AHI > 30 events per hour Inspire’s Focus High risk patients: obese, male or of advanced age Common first indicator: heavy snoring Other indicators: Lack of energy Headaches Depression Nighttime gasping Dry mouth Memory or concentration problems Excessive daytime sleepiness Years of Follow-up Increased Risk of Mortality (5) % Surviving 2x The risk for stroke (1) 2x The risk for sudden cardiac death (2) 5x The risk for cardiovascular mortality (3) 57% Increased risk for recurrence of Atrial Fibrillation after ablation (4) Airway obstruction during breathing 5
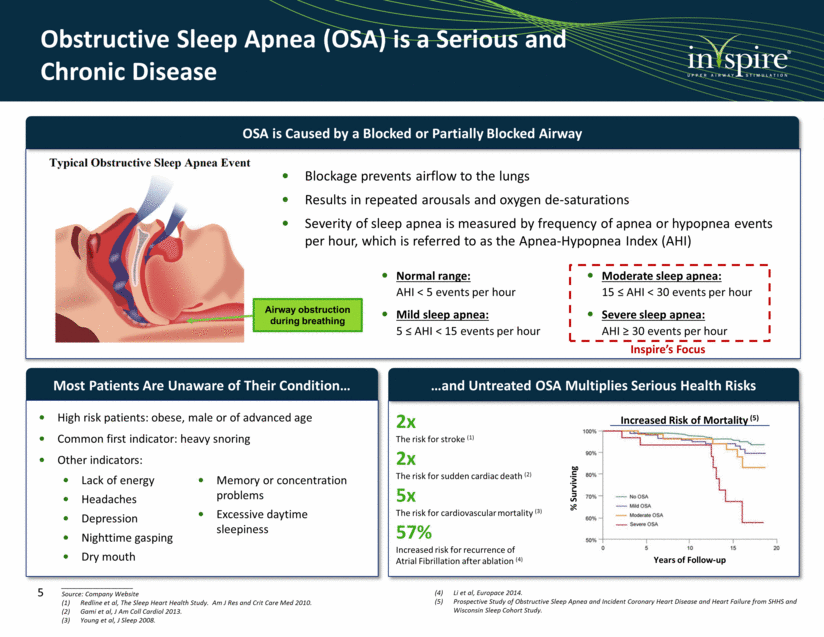
Sleep Apnea is a Major Public Health Problem & Awareness is Building ____________________ Source: The New York Times, Science Daily, CBS This Morning, The Washington Post and Pioneer Press. Metrics – Week of January 22, 2018 55,823 (+22%) Web Sessions 548 (+42%) Calls 12,199 (+43%) Doctor Searches 202 (+59%) Emails 184 (+25%) CHT Sign-Ups (+) represents change Week over Week 6
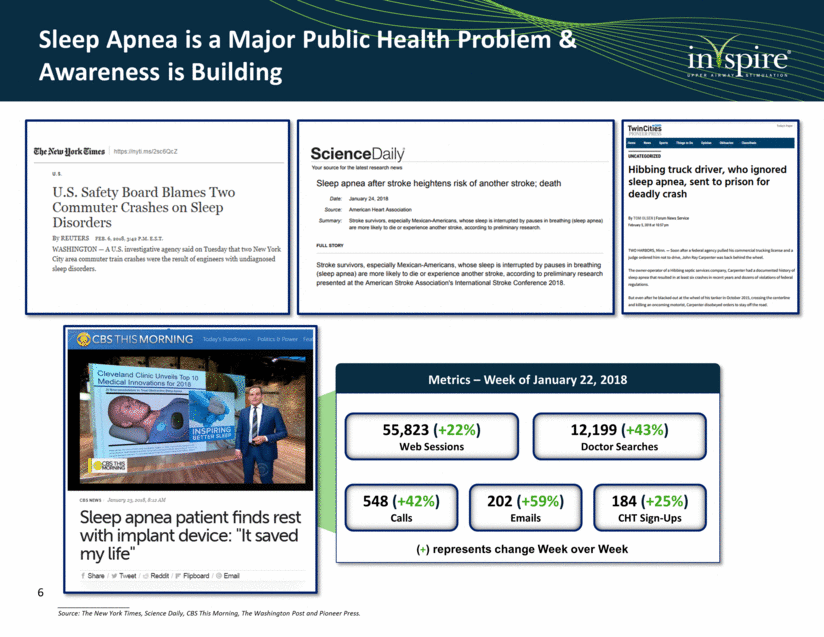
Current Treatment Options such as CPAP and Invasive Surgery have Significant Limitations Continuous Positive Airway Pressure (CPAP) is the Leading Therapy for OSA Invasive Surgery Uvulopalatopharyngoplasty (UPPP) Maxillomandibular Advancement (MMA) Delivered through a face or nasal mask that connects through a hose to a bedside air pump Demonstrated improvements in patient-reported sleep quality and reductions in daytime sleepiness Faces significant limitations as a therapeutic option, primarily due to low patient compliance (approximately 35% – 65%) Drivers of CPAP Non-Compliance The effectiveness of CPAP has been limited by low patient compliance as many patients find the mask or treatment cumbersome, uncomfortable and loud Several variations of sleep surgery Success rates vary widely (30% - 60%) (1) Irreversible anatomy alteration In-patient surgery with extended recovery Mask Discomfort Mask Leakage Pressure Intolerance Skin Irritation Nasal Congestion Nasal Drying Nosebleeds Claustrophobia Lack of Intimacy ____________________ Shah, Janki, et al; American Journal of Otolaryngology (2018). Uvulopalatopharyngoplasty vs CN XII stimulation for treatment of obstructive sleep apnea: A single institution experience. 7
A Strong Market Opportunity Exists for an Alternative to CPAP that is Effective and Minimally Invasive Our Estimated Annual U.S. Market Opportunity Sleep apnea affects +100 million people worldwide (1) Approximately 17 million individuals in the U.S. with moderate to severe OSA Annually, ~2 million adult patients are prescribed a CPAP device (2) Annual U.S. economic costs of untreated moderate to severe OSA are between $65 - $165 billion (3) OSA economic costs are potentially greater than asthma, heart failure, stroke and hypertensive disease OSA is associated with an increase in: Rate & severity of vehicle accidents Increased healthcare utilization Reduction of work performance Occupational injuries ____________________ Note: ASP constitutes abbreviation for average selling price. Source: World Health Organization. Company estimates. Represents moderate to severe OSA. Source: McKinsey & Company, 2010. Adults with Moderate to Severe OSA Prescribed CPAP (2) = ~2 million 35% of CPAP Non-Compliant Adults = ~700,000 70% Inspire Anatomy Eligible = ~500,000 Inspire U.S. Market = ~$10 billion Less: 65% CPAP Compliant Less: 30% Anatomy Challenges Multiplied by: our ASP Prevalence & Economic Costs Published literature estimates CPAP non-compliance rates of 35% - 65% 8
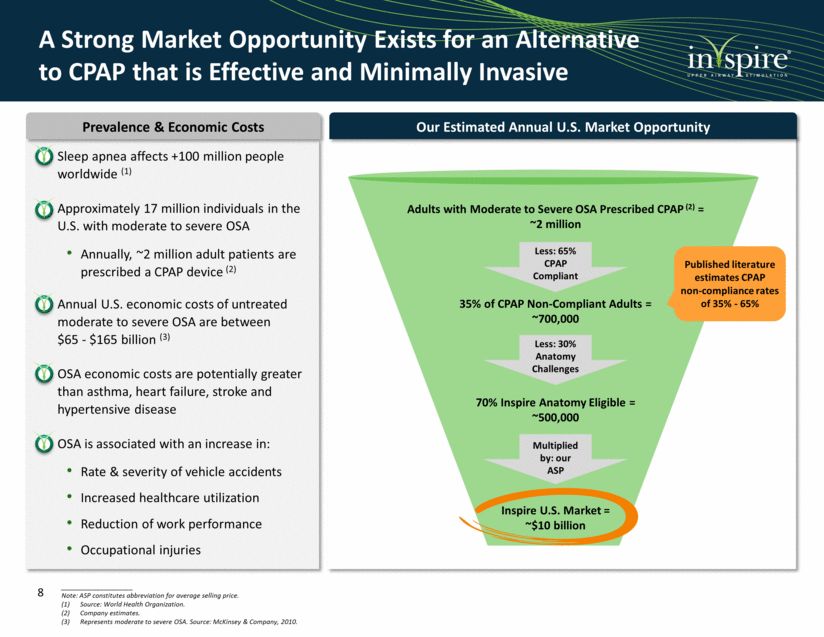
Our Inspire Therapy is a Disruptive Solution for Patients with OSA Remote control and three implantable components: Pressure sensing lead: detects when the patient is attempting to breathe Neurostimulator: houses the electronics and battery power for the device Stimulation lead: delivers electrical stimulation to the hypoglossal nerve Approximately a 2-hour outpatient procedure Requires three small incisions (1 in neck and 2 in chest) Patients typically recover quickly and resume normal activities in just a few days System activation occurs 30 days after implantation Patient controls system by turning on the device each night with the remote control before going to sleep 1 2 3 Inspire System Inspire Procedure 2 1 3 Hypoglossal Nerve Neurostimulator Stimulation Lead Pressure Sensing Lead 2 1 3 9
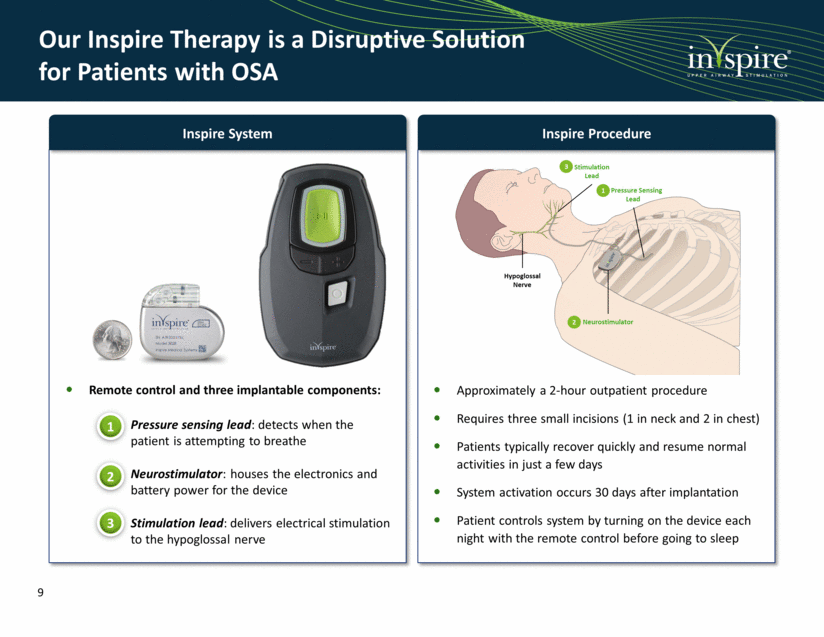
Inspire Therapy Overcomes Many of These Limitations with a Safe and Effective Solution Strong safety profile Effective and durable treatment Closed-loop system Strong patient compliance High patient satisfaction Minimally invasive outpatient procedure ~11-year battery life (without recharging) Utilizes patient’s natural physiology Short recovery times post surgery Patient controlled therapy Mild Stimulation is a Clear Mechanism of Action Inspire Therapy Offers Significant Benefits Long term outcomes demonstrate that Inspire therapy addresses the shortfalls of current treatments 10
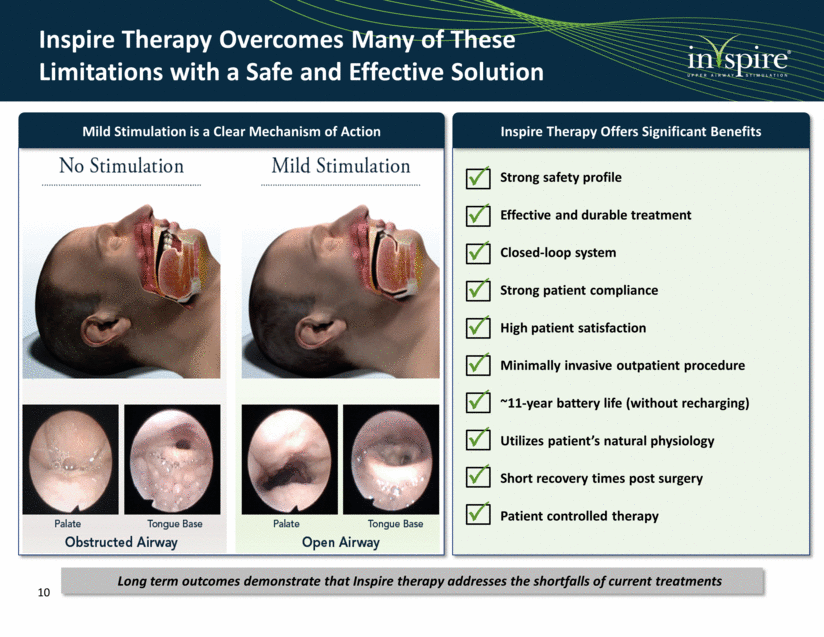
Inspire system turned on Airflow Breathing Oxygen Saturation No OSA events OSA events - 100 – - - - 97.5 – - - - 95 – - - - 92.5 – - - - 90 – - - - 87.5 – - - - - 0 – - - - - -100 – - - - - - - 0 – - - - - - - - - 0 – - - - - - - - - - 0 – - - - - - - - - - - - - - - - - - - - - - - - - - - - - - - - - - - 12:26:00 AM Polysomnogram Before and After Activation of Inspire System After activating the Inspire system, the patient exhibited a more regular breathing pattern, higher and more consistent blood oxygen levels, and fewer or no transient arousals Apnea Obstructive (23.80s) Apnea Obstructive (42.40s) Apnea Obstructive (46.86s) Apnea Obstructive (37.93s) Apnea Arousal Apnea Arousal Apnea Arousal Apnea Arousal ousal N2 (TW RPSGT) N2 (TW RPSGT) N2 (TW RPSGT) N2 (TW RPSGT) N2 (TW RPSGT) N2 (TW RPSGT) N2 (TW RPSGT) N2 (TW RPSGT) N2 (TW RPSGT) N2 (TW RPSGT) N2 (TW RPSGT) N2 (TW RPSGT) Desaturation (38.06s) 8 Desaturation (28.06s) 8 Desaturation (51.94s) 13 Desaturation (36.06s) 8 s) 12 ousal N2 (TW RPSGT) ECG1 m/V F4-M1 p/V C4-M1 p/V C1-M2 p/V m/V Airflow p/V Chest p/V Abdomen p/V SqCG % 12:23:00 AM 12:23:30 AM 12:24:00 AM 12:24:30 AM 12:25:00 AM 12:25:30 AM 12:26:30 AM 12:27:00 AM 12:27:30 AM 12:28:00 AM 12:28:30 AM 12:29:00 AM 12:2 Nasal PR EMG1 p/V Objective Measures Show the Impact of Our Inspire Therapy on OSA 11
Clinical Evidence
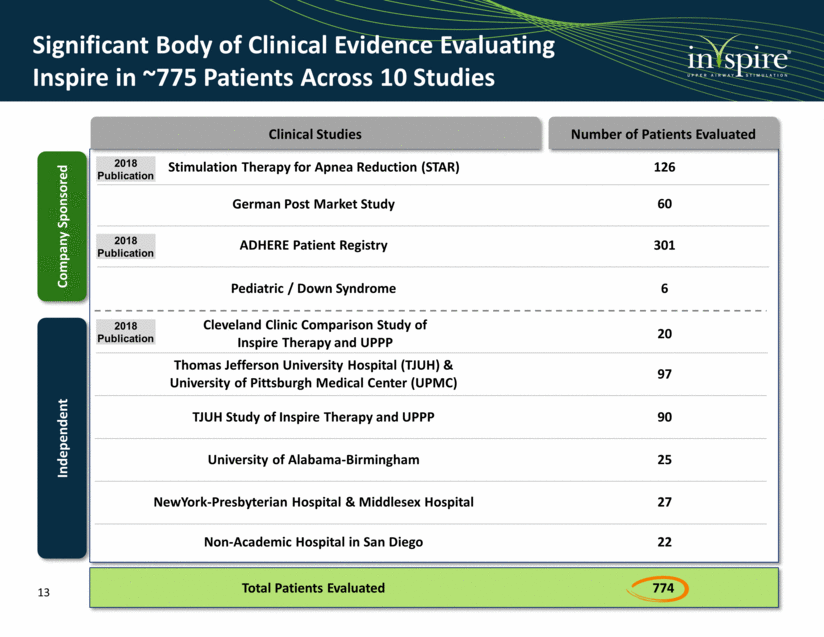
Company Sponsored Significant Body of Clinical Evidence Evaluating Inspire in ~775 Patients Across 10 Studies Stimulation Therapy for Apnea Reduction (STAR) 126 German Post Market Study 60 ADHERE Patient Registry Thomas Jefferson University Hospital (TJUH) & University of Pittsburgh Medical Center (UPMC) 97 University of Alabama-Birmingham 25 NewYork-Presbyterian Hospital & Middlesex Hospital 27 Independent Pediatric / Down Syndrome 6 Non-Academic Hospital in San Diego 22 TJUH Study of Inspire Therapy and UPPP 90 301 774 Total Patients Evaluated Clinical Studies Number of Patients Evaluated Cleveland Clinic Comparison Study of Inspire Therapy and UPPP 20 2018 Publication 2018 Publication 2018 Publication 13
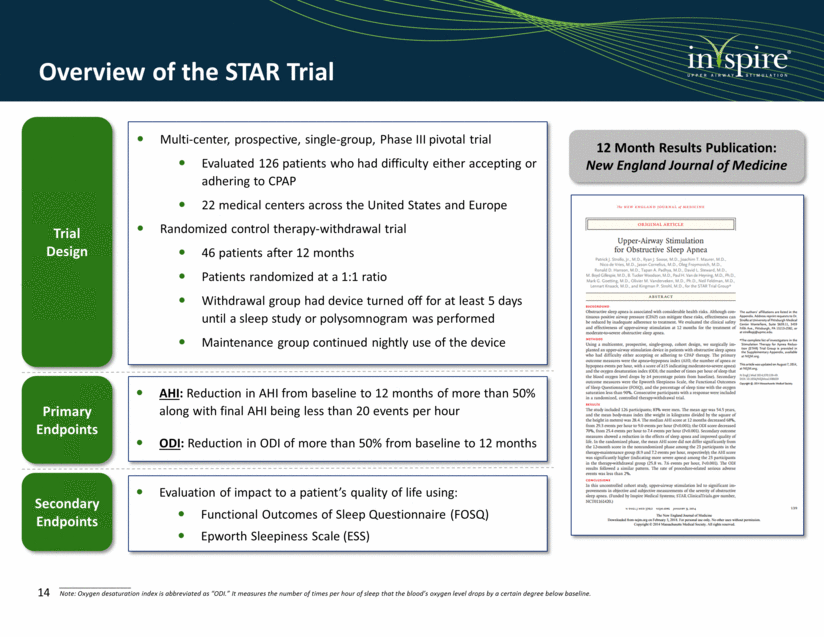
Overview of the STAR Trial Trial Design Primary Endpoints Secondary Endpoints AHI: Reduction in AHI from baseline to 12 months of more than 50% along with final AHI being less than 20 events per hour ODI: Reduction in ODI of more than 50% from baseline to 12 months Evaluation of impact to a patient’s quality of life using: Functional Outcomes of Sleep Questionnaire (FOSQ) Epworth Sleepiness Scale (ESS) Multi-center, prospective, single-group, Phase III pivotal trial Evaluated 126 patients who had difficulty either accepting or adhering to CPAP 22 medical centers across the United States and Europe Randomized control therapy-withdrawal trial 46 patients after 12 months Patients randomized at a 1:1 ratio Withdrawal group had device turned off for at least 5 days until a sleep study or polysomnogram was performed Maintenance group continued nightly use of the device 12 Month Results Publication: New England Journal of Medicine ____________________ Note: Oxygen desaturation index is abbreviated as “ODI.” It measures the number of times per hour of sleep that the blood’s oxygen level drops by a certain degree below baseline. 14
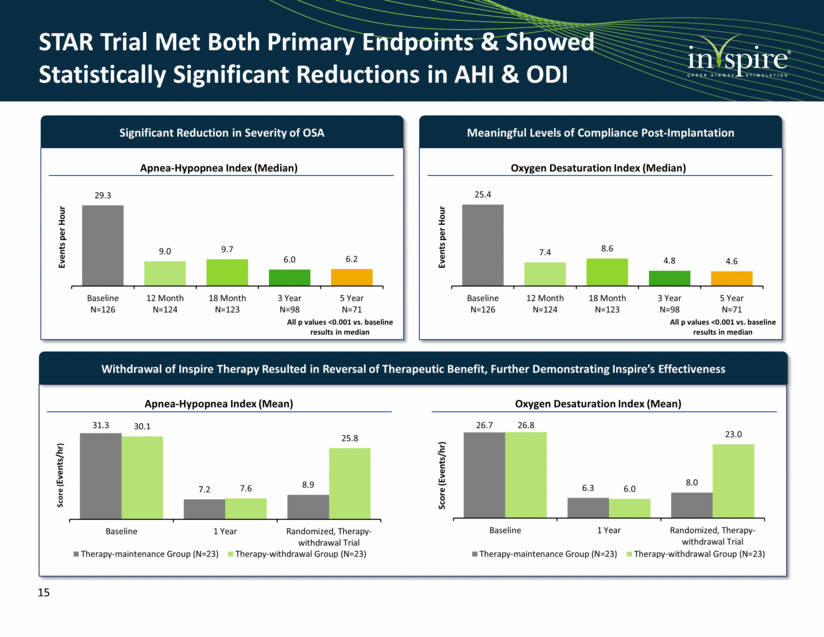
STAR Trial Met Both Primary Endpoints & Showed Statistically Significant Reductions in AHI & ODI Significant Reduction in Severity of OSA Apnea-Hypopnea Index (Median) All p values <0.001 vs. baseline results in median Events per Hour Meaningful Levels of Compliance Post-Implantation Oxygen Desaturation Index (Median) All p values <0.001 vs. baseline results in median Events per Hour Withdrawal of Inspire Therapy Resulted in Reversal of Therapeutic Benefit, Further Demonstrating Inspire’s Effectiveness Score (Events/hr) Score (Events/hr) Apnea-Hypopnea Index (Mean) Oxygen Desaturation Index (Mean) 15 29.3 9.0 9.7 6.0 6.2 Baseline N=126 12 Month N=124 18 Month N=123 3 Year N=98 5 Year N=71 25.4 7.4 8.6 4.8 4.6 Baseline N=126 12 Month N=124 18 Month N=123 3 Year N=98 5 Year N=71 31.3 7.2 8.9 30.1 7.6 25.8 Baseline 1 Year Randomized, Therapy- withdrawal Trial Therapy-maintenance Group (N=23) Therapy-withdrawal Group (N=23) 26.7 6.3 8.0 26.8 6.0 23.0 Baseline 1 Year Randomized, Therapy- withdrawal Trial Therapy-maintenance Group (N=23) Therapy-withdrawal Group (N=23)
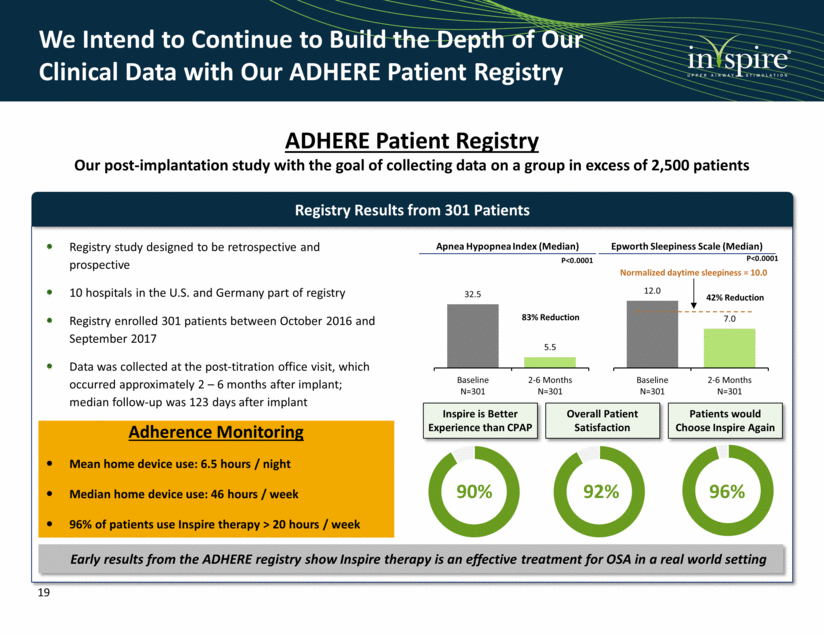
Additional STAR Findings Showed Meaningful Improvement in Compliance and Quality of Life Metrics Inspire has Substantial Positive Implications on Patient Compliance Functional Outcomes of Sleep Questionnaire (Median) All p values <0.001 vs. baseline results Epworth Sleepiness Scale (Median) Normalized daytime sleepiness = 10.0 Normalized daytime functioning = 17.9 No or Soft Snoring (Median) Bed Partner Leaves Room (Median) and has Resulted in Meaningful Impact to Patients' Quality of Life Self-Reported Device Use Patients Reported Nightly Use (%) Published literature estimates that only approximately 35% to 65% of patients prescribed a CPAP device are compliant with the therapy 35% CPAP compliance 65% CPAP compliance After 12 Months, 93% of patients used Inspire Therapy at least 5 days per week 16 14.6 18.2 18.4 18.8 18.7 Baseline N=126 12 Mo. N=124 18 Mo. N=123 3 Yr. N=98 5 Yr. N=92 11.0 6.0 6.0 6.0 6.0 Baseline N=126 12 Mo. N=124 18 Mo. N=123 3 Yr. N=98 5 Yr. N=92 17% 86% 87% 81% 90% Baseline N=108 12 Mo. N=103 18 Mo. N=103 3 Yr. N=100 5 Yr. N=80 30% 5% 4% 3% 1% Baseline N=108 12 Mo. N=103 18 Mo. N=103 3 Yr. N=100 5 Yr. N=80 86% 81% 81% 80% 0% 10% 20% 30% 40% 50% 60% 70% 80% 90% 100% 12 Month N=124 24 Month N=117 3 Year N=108 5 Year N=92
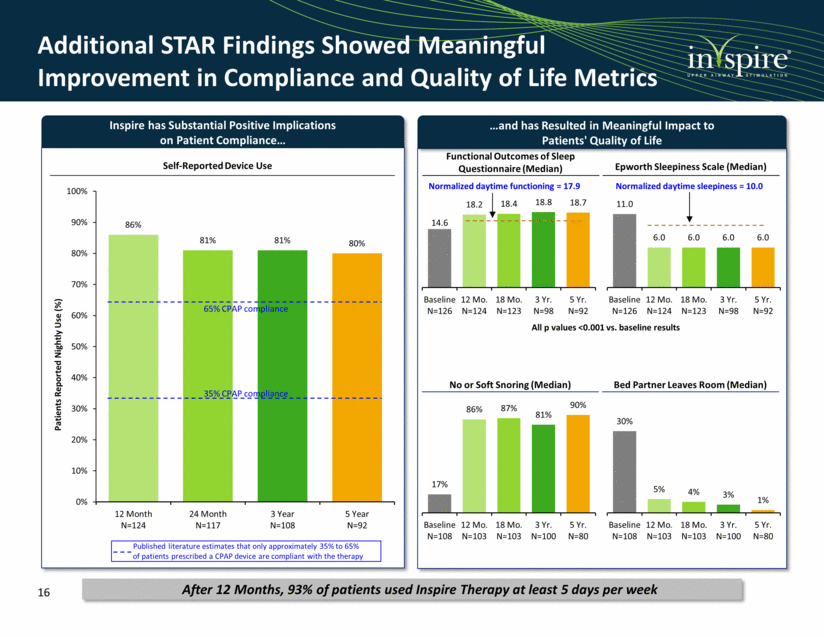
Inspire’s Compelling Clinical Evidence has been Replicated Across Multiple Studies German Post-Market Study Company sponsored, multi-center post-approval study in Germany (N=60) Measurements: 2 months, 6 months and 1 year Publication: The Laryngoscope in 2017 Therapy compliance: average 39 hours per week; 89% > 20 hours per week Independent Study by TJUH & UPMC Conducted by researchers at TJUH and UPMC (N=97) Measurements: 3 months Publication: Journal of Clinical Sleep Medicine in 2017 Therapy compliance: average > 45 hours per week; >75% > 40 hours per week Other Independent Studies University of Alabama-Birmingham: reported on the outcomes from their first twenty-five consecutive cases treated with Inspire therapy. The median AHI in these patients decreased significantly from 38.5 to 6.5 (p<0.0001) Mean device use of 49.5 hours per week NewYork-Presbyterian Hospital and Middlesex Hospital: conducted a multi-center study reporting on 27 patients treated with Inspire therapy. Postoperative AHI was significantly reduced from 44.8 to 6.3 (p<0.001) Mean device use of 50.3 hours per week Non-academic hospital in San Diego: collected data on 22 consecutive patients treated with Inspire therapy. AHI reductions were consistent among patients, with all patients measured achieving a titrated AHI < 5 Mean device use of 7.0 hours per night Apnea Hypopnea Index (Median) Score (Events/hr) P<0.001 Apnea Hypopnea Index (Mean) P<0.001 Score (Events/hr) 67% Reduction 82% Reduction ____________________ Note: Thomas Jefferson University Hospital abbreviated at TJUH. University of Pittsburgh Medical Center abbreviated as UPMC. 17 35.9 6.3 35.3 6.3 Baseline 3 Months TJUH Cohort (N=48) UPMC Cohort (N=49) 28.6 9.5 Baseline N=60 1 Year N=56
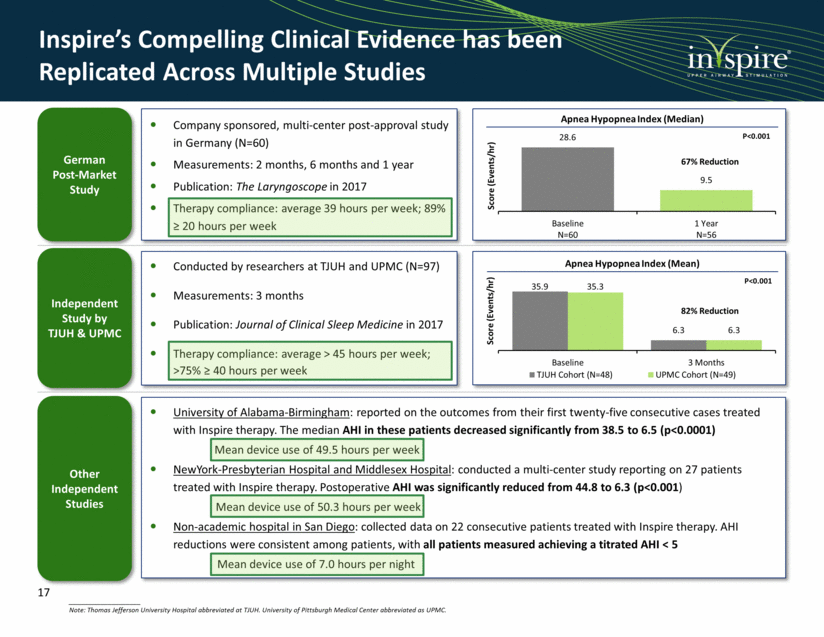
Recent Developments: Independent Cleveland Clinic Comparison Study of Inspire vs. UPPP Cleveland Clinic Comparison Study of Inspire Therapy and UPPP Independent retrospective study conducted by multi-disciplinary team of physicians from the Cleveland Clinic (N=40) N=20 enrolled in HNS N=20 enrolled in UPPP Publication: American Journal of Otolaryngology Mar. 2018 Compared outcomes of Inspire Upper Airway Stimulation (HNS) vs UPPP in patients with moderate to severe OSA HNS: All patients who underwent HNS implantation at a single institution between Nov. 2015 and Nov. 2016 (N=20); all patients met STAR trial criteria UPPP: Utilized a pre-existing database of patients (N=116) who were intolerant to CPAP and underwent UPPP between 2003-2012. From this data, patients that matched STAR trial inclusion criteria were selected (N=20) Conclusion “The present study compares outcomes of the most well established upper airway surgery with outcomes of upper airway stimulation therapy in patients with OSA. Compared to uvulopalatopharyngoplasty, hypoglossal nerve stimulation therapy provides significant objective improvement in outcome measures for select patients with moderate to severe OSA with inability to tolerate CPAP. Although traditional upper airway surgery is effective in treating patients with OSA, our study suggests hypoglossal nerve stimulation is curative for many patients as it normalizes the AHI to < 5 and is an excellent option for second line therapy in select patients with OSA who are intolerant to CPAP.” Pre vs Post Operative AHI for UPPP vs HNS Groups (Mean) P<0.001 AHI Score (Events/hr) 88% Reduction 29% Reduction P= 0.02 ____________________ Note: Hypoglossal nerve stimulation abbreviated at HNS. Pre vs Post Operative ESS for UPPP vs HNS Groups (Mean) P<0.001 Index Score Normalized daytime sleepiness = 10.0 P=0.001 18 11.0 13.0 7.0 8.0 UPPP (N=16) HNS (N=15) Pre Operative ESS Post Operative ESS
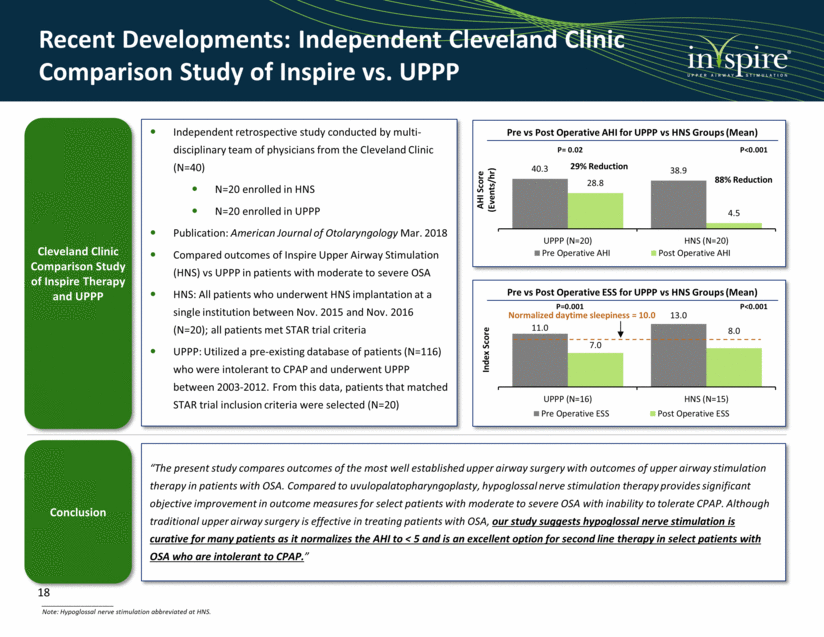
We Intend to Continue to Build the Depth of Our Clinical Data with Our ADHERE Patient Registry Registry Results from 301 Patients Registry study designed to be retrospective and prospective 10 hospitals in the U.S. and Germany part of registry Registry enrolled 301 patients between October 2016 and September 2017 Data was collected at the post-titration office visit, which occurred approximately 2 – 6 months after implant; median follow-up was 123 days after implant Patients would Choose Inspire Again Apnea Hypopnea Index (Median) P<0.0001 Epworth Sleepiness Scale (Median) 83% Reduction 42% Reduction P<0.0001 Early results from the ADHERE registry show Inspire therapy is an effective treatment for OSA in a real world setting ADHERE Patient Registry Our post-implantation study with the goal of collecting data on a group in excess of 2,500 patients 96% 92% Overall Patient Satisfaction Inspire is Better Experience than CPAP 90% Adherence Monitoring Mean home device use: 6.5 hours / night Median home device use: 46 hours / week 96% of patients use Inspire therapy > 20 hours / week Normalized daytime sleepiness = 10.0 19 32.5 5.5 Baseline N=301 2-6 Months N=301 12.0 7.0 Baseline N=301 2-6 Months N=301
Product and Indication Expansion
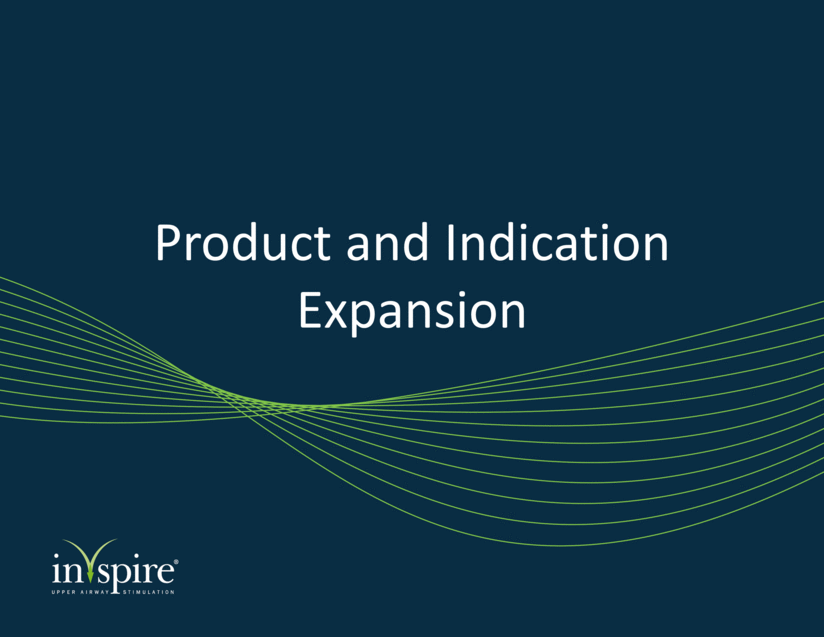
We are Committed to Continuous Product Development & Indication Expansion Indication Expansion Product Pipeline 5th generation neurostimulator is in the concept phase of development Inspire Cloud, which is still in development, is being designed to allow physicians to monitor patient compliance and therapy efficacy ____________________ Published in JAMA Otolaryngology – Head & Neck Surgery. Working with the FDA to expand indication in the U.S. to patients as young as 12 years of age (including Down syndrome) Patients born with Down syndrome have higher rates of OSA than the general pediatric population 6-patient investigator-initiated trial demonstrated the safety and efficacy of Inspire therapy for treating Down syndrome patients (1) Illustrative Inspire Cloud Dashboard 21
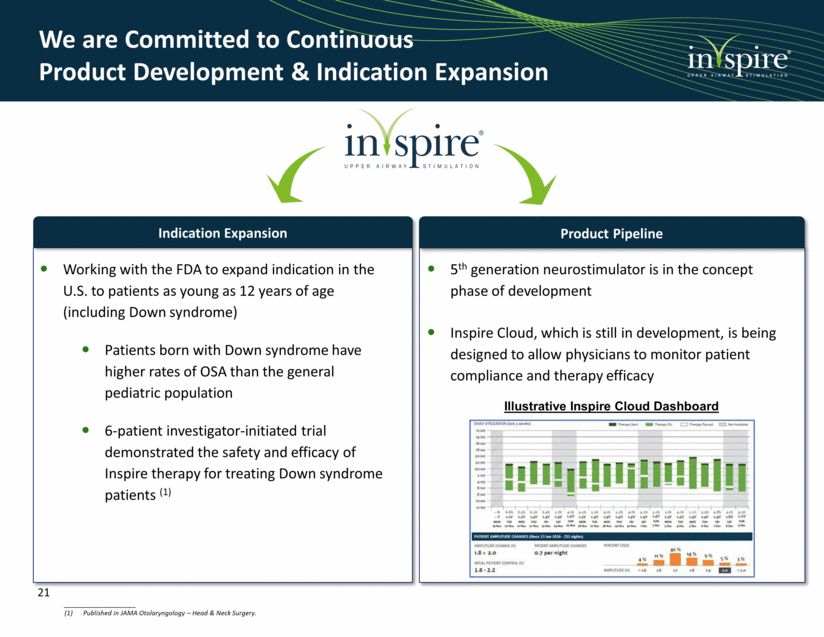
Inspire Cloud: Longitudinal Care Inspire cloud Care team Referral network Monitors Adherence Generates Complete Patient Therapy Reports Insight into Center-Wide Therapy Outcomes Strengthens the Referral Network Creates Care Coordination Hub Fits into existing sleep clinic workflows Inspire Cloud was launched at the AASM (American Academy of Sleep Medicine) annual meeting June 2018 22
Commercial Development
Inspire Approach to Market Development We have a Targeted Approach to Market Development Direct to Patient Channels / Self-Referred Inspire Program Core Team Sleep Practice Refer and Manage Sleep Practice Referrals Dental Practice Referrals Cardiac Practice / EP (1) Referrals Direct-to-Patient Outreach Machine Inspire has built a referral network with physicians across the treatment continuum Differentiated marketing engine capable of generating demand through patient channels Engaged Sessions 1.1 million in 2017 Dr. Searches 400,000 in 2017 Practice Engagement Trackable calls (>17,000 in 2017) Emails Health Talk Sign Ups Visits - MD pages Clicks - MD news stories Physician to Physician Patient Word of Mouth Company Sponsored Public Relations Local Radio ____________________ (1) EP constitutes abbreviation for electrophysiologists. 24

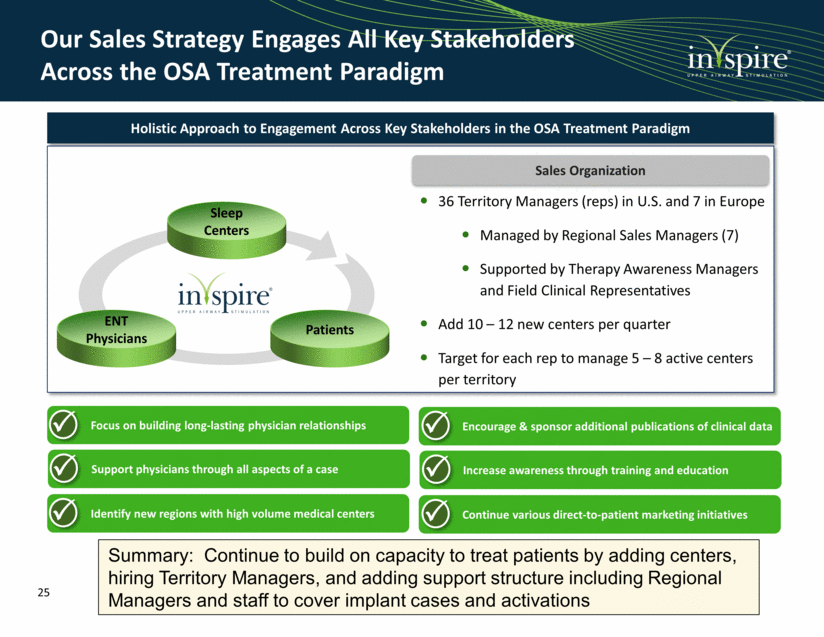
Our Sales Strategy Engages All Key Stakeholders Across the OSA Treatment Paradigm Holistic Approach to Engagement Across Key Stakeholders in the OSA Treatment Paradigm Focus on building long-lasting physician relationships Support physicians through all aspects of a case Identify new regions with high volume medical centers Encourage & sponsor additional publications of clinical data Increase awareness through training and education Continue various direct-to-patient marketing initiatives Sales Organization 36 Territory Managers (reps) in U.S. and 7 in Europe Managed by Regional Sales Managers (7) Supported by Therapy Awareness Managers and Field Clinical Representatives Add 10 – 12 new centers per quarter Target for each rep to manage 5 – 8 active centers per territory Patients ENT Physicians Sleep Centers Summary: Continue to build on capacity to treat patients by adding centers, hiring Territory Managers, and adding support structure including Regional Managers and staff to cover implant cases and activations 25
Keys To Driving a Strong Territory New Centers and Territory Framing Building Regional Manager Team and currently have 7 RMs (added 3 in Q2) Adding Field Clinical Reps (FCRs) to support implants Continuing adding Territory Managers Ended Q2 with 36 Territory Managers Continuous cadence of adding 3-4 new TMs per quarter Sales Training Inspire University conducted quarterly for new employees Free up selling time for tenured reps to focus on driving patient flow Invest in FCRs to cover cases and activations How TMs Spend Their Time Find The Right Centers Drive patient flow & Practice Readiness Attend DISE, Cases & Follow up Manage Prior Auth, Coding, Payment FCRs to support 26

Reimbursement
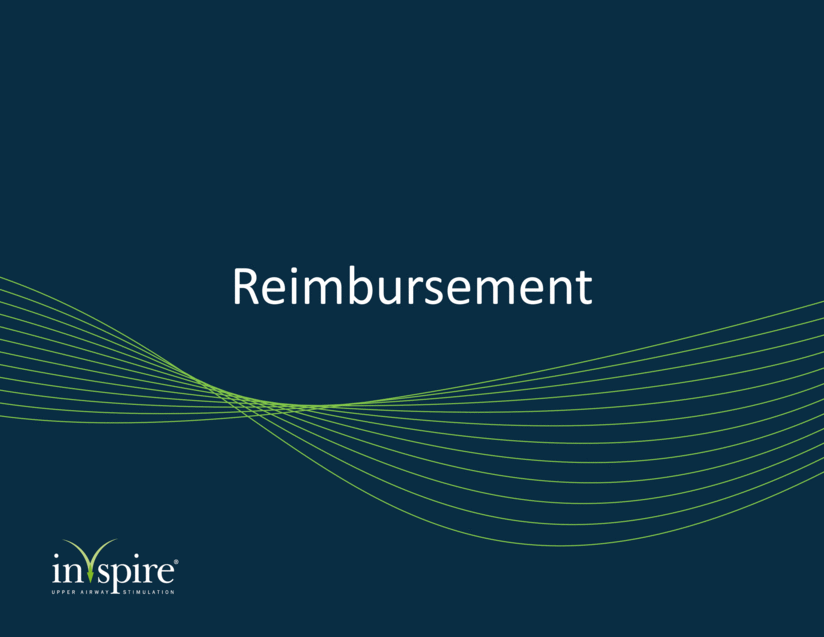
Our Team is Focused on All Aspects of Reimbursement, which Include Coding, Payment and Coverage Coding Physician Facility Payment Physician Facility Coverage Medicare Commercial Neurostimulator and stimulation lead: CPT code 64568 for Cranial Nerve Stimulator Sensing lead: CPT code 0466T (Category III) Physician society working to convert to a Category I code National Medicare average payment of approximately $27,000 Covers the cost of the device and the procedure for implantation Approximately 280 commercial payors in the U.S. have paid for Inspire procedure, mostly through prior authorization Medicare payment in most MACs Government contract for VA / Military hospitals Two-pronged Approach to Reimbursement 2017 U.S. Revenue Mix Commercial Medicare VA Part 1: Work with all payers to educate on the therapy during annual and mid-cycle reviews to develop positive coverage policies (i.e., Aetna was a mid-cycle) Part 2: Work with physicians and centers to obtain prior authorizations from payers as most have negative coverage policies today, yet approve procedures after appeal cycles 28 60% 30% 10%
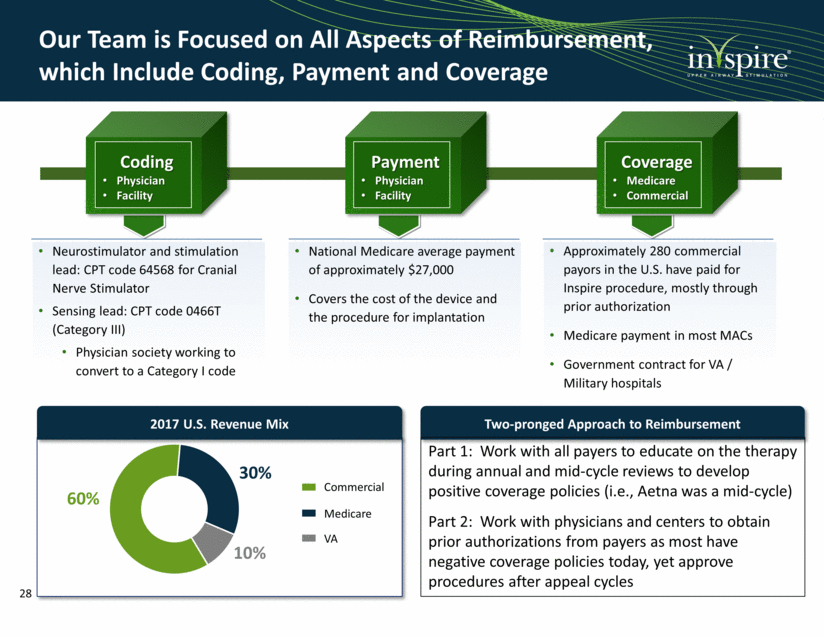
Review Cycles – most major providers have a scheduled annual review for policies Focus is to provide updated dossier, guidelines, experiences to encourage a deep dive review Continue to build on already strong clinical dossier and physician support Leverage internal staff as well as multiple contractors with designated payers assigned to each Large Payors – most difficult to engage, and more accepting of the appeal (EMR) process Small Payors – less comfortable with EMR process and more agile to conduct internal reviews Developing Positive Coverage Policies – Leveraging the Aetna Policy Decision Cigna, Humana & others @15+M Aetna 22.2 M United Healthcare 45.7 M Anthem 14 BCBS Plans: California & Georgia ++ 38.7 M HCSC BCBS IL/TX 14.6 M BCBS 9 BCBS Plans: MA, MN, MI, ID, WA, FL, TN, TN, NC, AL 26.3 M BCBS Others 17.4 M IBC Horizon Highmark Care First Excellus BCBS Evidence Street (Nov 2018 target update) 12 Medicare MAC Jurisdictions Medicare Nat’l Coverage Decision 38.7 M Focus on local payments Long-term: May look toward national policy Small Regional Plans focused in area with active centers: Medica HAP PreferredOne Clev Clinic OSU Group Health WI 29
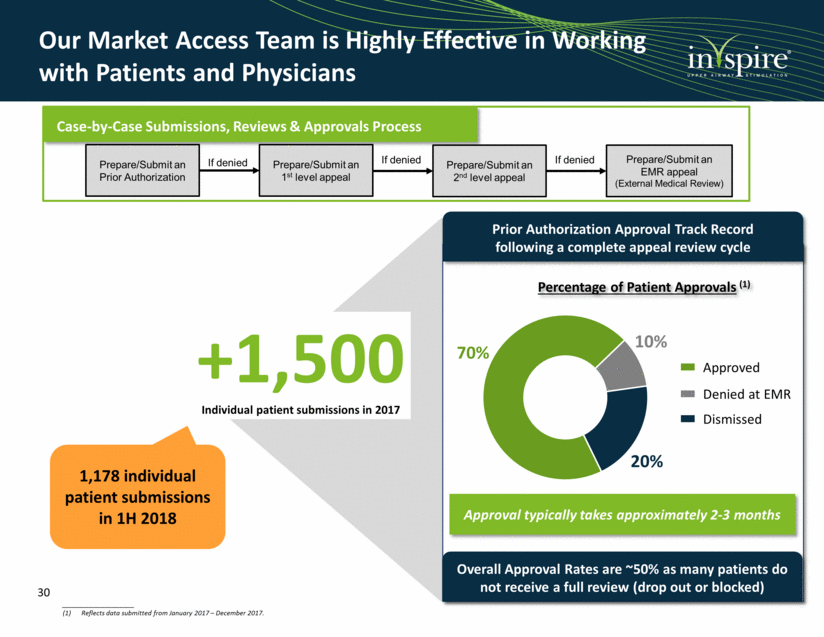
____________________ Reflects data submitted from January 2017 – December 2017. Our Market Access Team is Highly Effective in Working with Patients and Physicians Prior Authorization Approval Track Record following a complete appeal review cycle Approval typically takes approximately 2-3 months +1,500 Individual patient submissions in 2017 Approved Denied at EMR Dismissed Percentage of Patient Approvals (1) 1,178 individual patient submissions in 1H 2018 Overall Approval Rates are ~50% as many patients do not receive a full review (drop out or blocked) Case-by-Case Submissions, Reviews & Approvals Process Prepare/Submit an Prior Authorization Prepare/Submit an 1st level appeal If denied Prepare/Submit an 2nd level appeal If denied Prepare/Submit an EMR appeal (External Medical Review) If denied 30 70% 10% 20%
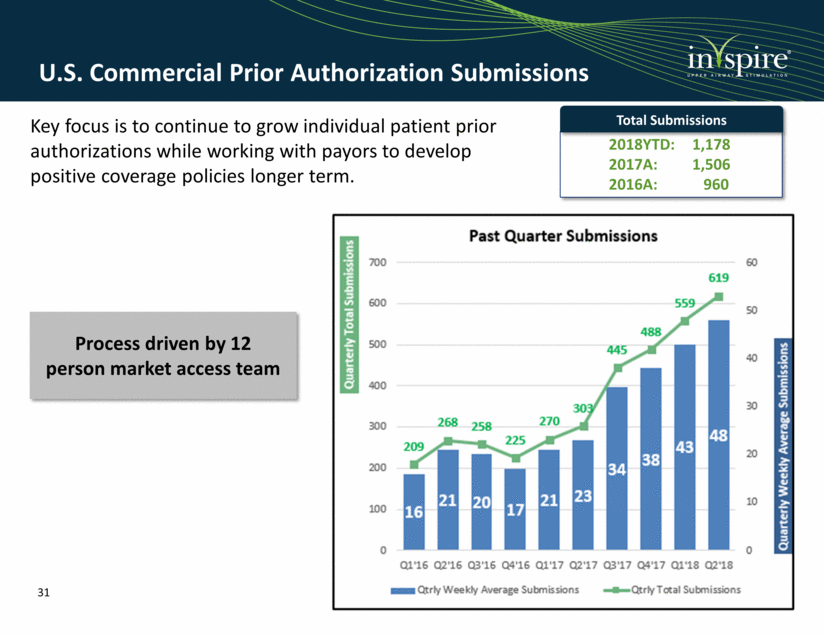
Process driven by 12 person market access team Total Submissions 2018YTD: 1,178 2017A: 1,506 2016A: 960 U.S. Commercial Prior Authorization Submissions Key focus is to continue to grow individual patient prior authorizations while working with payors to develop positive coverage policies longer term. 31
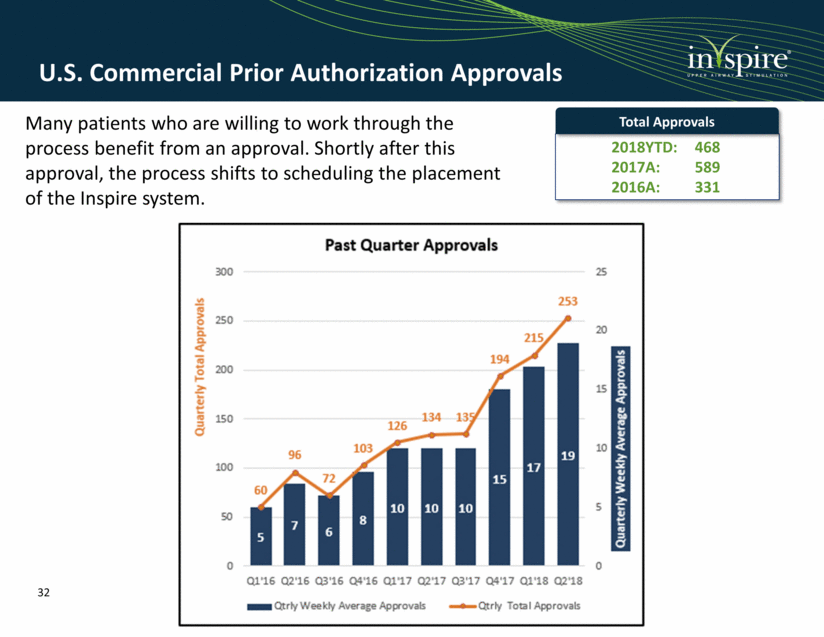
Total Approvals 2018YTD: 468 2017A: 589 2016A: 331 U.S. Commercial Prior Authorization Approvals Many patients who are willing to work through the process benefit from an approval. Shortly after this approval, the process shifts to scheduling the placement of the Inspire system. 32
Financials

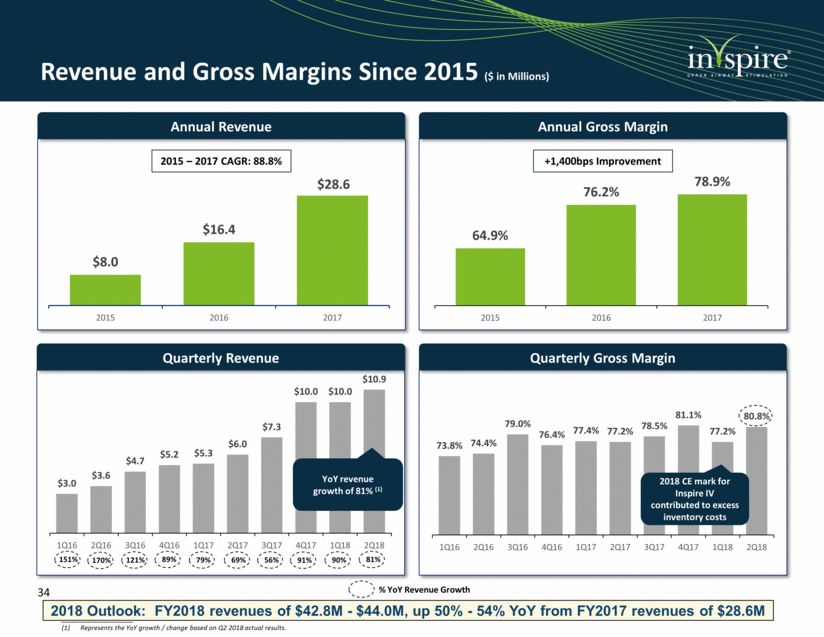
Revenue and Gross Margins Since 2015 ($ in Millions) Annual Revenue Annual Gross Margin 2015 – 2017 CAGR: 88.8% +1,400bps Improvement Quarterly Revenue Quarterly Gross Margin 89% 79% 69% 56% 91% % YoY Revenue Growth 81% ____________________ (1) Represents the YoY growth / change based on Q2 2018 actual results. YoY revenue growth of 81% (1) 2018 CE mark for Inspire IV contributed to excess inventory costs 151% 170% 121% 90% 2018 Outlook: FY2018 revenues of $42.8M - $44.0M, up 50% - 54% YoY from FY2017 revenues of $28.6M 34 $8.0 $16.4 $28.6 2015 2016 2017 64.9% 76.2% 78.9% 2015 2016 2017 $3.0 $3.6 $4.7 $5.2 $5.3 $6.0 $7.3 $10.0 $10.0 $10.9 1Q16 2Q16 3Q16 4Q16 1Q17 2Q17 3Q17 4Q17 1Q18 2Q18 73.8% 74.4% 79.0% 76.4% 77.4% 77.2% 78.5% 81.1% 77.2% 80.8% 1Q16 2Q16 3Q16 4Q16 1Q17 2Q17 3Q17 4Q17 1Q18 2Q18
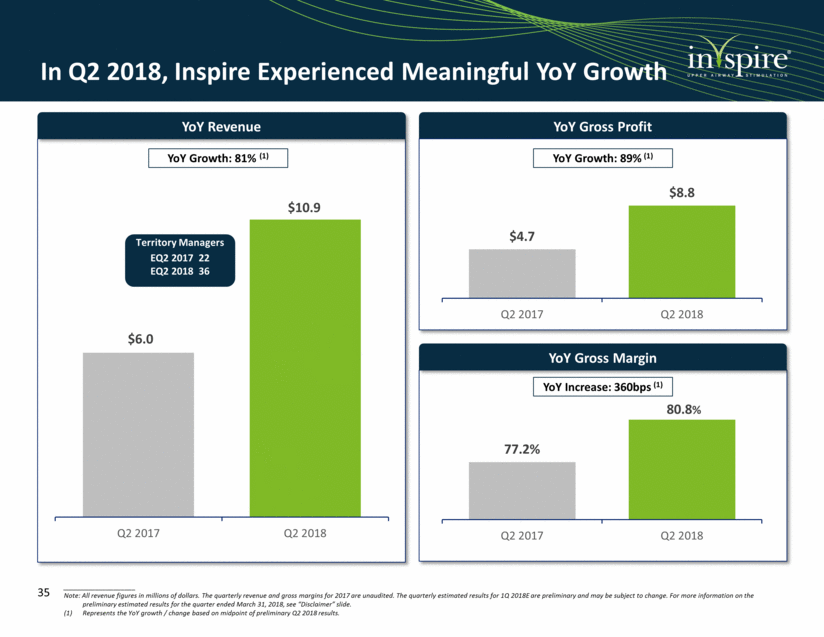
In Q2 2018, Inspire Experienced Meaningful YoY Growth YoY Revenue YoY Gross Profit YoY Growth: 81% (1) YoY Gross Margin YoY Growth: 89% (1) YoY Increase: 360bps (1) ____________________ Note: All revenue figures in millions of dollars. The quarterly revenue and gross margins for 2017 are unaudited. The quarterly estimated results for 1Q 2018E are preliminary and may be subject to change. For more information on the preliminary estimated results for the quarter ended March 31, 2018, see “Disclaimer” slide. Represents the YoY growth / change based on midpoint of preliminary Q2 2018 results. Territory Managers EQ2 2017 22 EQ2 2018 36 80.8% 35 $6.0 $10.9 Q2 2017 Q2 2018 $4.7 $8.8 Q2 2017 Q2 2018 77.2% Q2 2017 Q2 2018
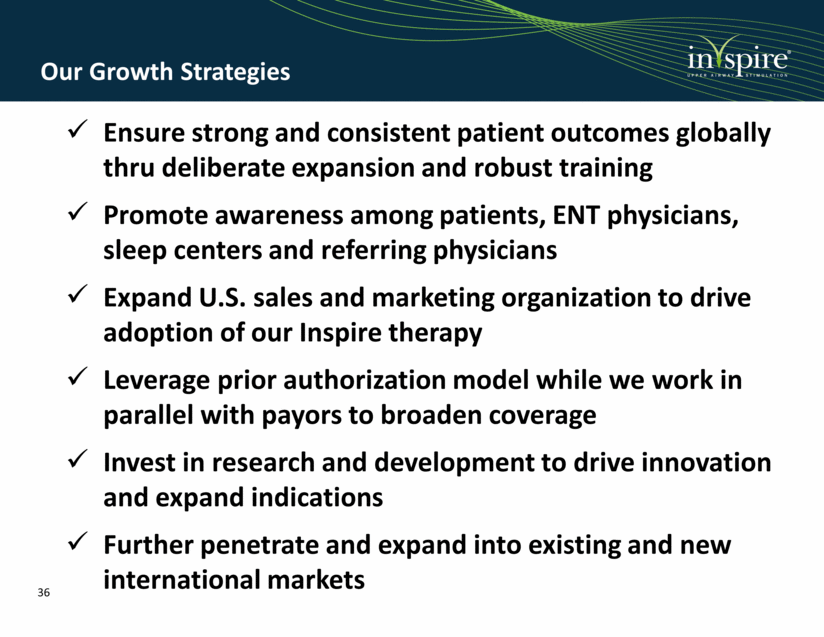
Our Growth Strategies Ensure strong and consistent patient outcomes globally thru deliberate expansion and robust training Promote awareness among patients, ENT physicians, sleep centers and referring physicians Expand U.S. sales and marketing organization to drive adoption of our Inspire therapy Leverage prior authorization model while we work in parallel with payors to broaden coverage Invest in research and development to drive innovation and expand indications Further penetrate and expand into existing and new international markets 36
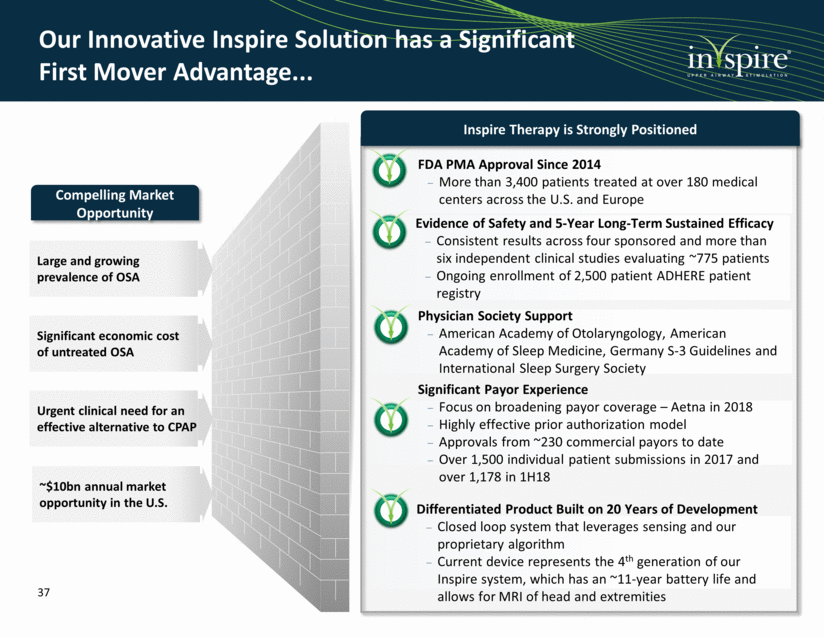
Our Innovative Inspire Solution has a Significant First Mover Advantage... FDA PMA Approval Since 2014 More than 3,400 patients treated at over 180 medical centers across the U.S. and Europe Evidence of Safety and 5-Year Long-Term Sustained Efficacy Consistent results across four sponsored and more than six independent clinical studies evaluating ~775 patients Ongoing enrollment of 2,500 patient ADHERE patient registry Physician Society Support American Academy of Otolaryngology, American Academy of Sleep Medicine, Germany S-3 Guidelines and International Sleep Surgery Society Significant Payor Experience Focus on broadening payor coverage – Aetna in 2018 Highly effective prior authorization model Approvals from ~230 commercial payors to date Over 1,500 individual patient submissions in 2017 and over 1,178 in 1H18 Large and growing prevalence of OSA Significant economic cost of untreated OSA Urgent clinical need for an effective alternative to CPAP ~$10bn annual market opportunity in the U.S. Compelling Market Opportunity Inspire Therapy is Strongly Positioned Differentiated Product Built on 20 Years of Development Closed loop system that leverages sensing and our proprietary algorithm Current device represents the 4th generation of our Inspire system, which has an ~11-year battery life and allows for MRI of head and extremities 37
