Attached files
| file | filename |
|---|---|
| 8-K - FORM 8-K - PEABODY ENERGY CORP | d580711d8k.htm |
Exhibit 99.1 Investor Presentation August 2018 Exhibit 99.1 Investor Presentation August 2018
Statement on Forward‐Looking Information This presentation contains forward‐looking statements within the meaning of the securities laws. Forward‐ looking statements can be identified by the fact that they do not relate strictly to historical or current facts. They often include words or variation of words such as expects, anticipates, intends, plans, believes, seeks, estimates, projects, forecasts, targets, would, will, should, goal, could or may or other similar expressions. Forward‐looking statements provide management's current expectations or predictions of future conditions, events or results. All statements that address operating performance, events or developments that we expect or anticipate will occur in the future are forward‐looking statements. They may include estimates of revenues, income, earnings per share, cost savings, capital expenditures, dividends, share repurchases, liquidity, capital structure, market share, industry volume, or other financial items, descriptions of management’s plans or objectives for future operations, or descriptions of assumptions underlying any of the above. All forward‐looking statements speak only as of the date they are made and reflect the company's good faith beliefs, assumptions and expectations, but they are not guarantees of future performance or events. Furthermore, the company disclaims any obligation to publicly update or revise any forward‐looking statement, except as required by law. By their nature, forward‐looking statements are subject to risks and uncertainties that could cause actual results to differ materially from those suggested by the forward‐looking statements. Factors that might cause such differences include, but are not limited to, a variety of economic, competitive and regulatory factors, many of which are beyond the company's control, that are described in our Annual Report on Form 10‐K for the fiscal year ended Dec. 31, 2017, as well as additional factors we may describe from time to time in other filings with the SEC. You may get such filings for free at our website at www.peabodyenergy.com. You should understand that it is not possible to predict or identify all such factors and, consequently, you should not consider any such list to be a complete set of all potential risks or uncertainties. 2Statement on Forward‐Looking Information This presentation contains forward‐looking statements within the meaning of the securities laws. Forward‐ looking statements can be identified by the fact that they do not relate strictly to historical or current facts. They often include words or variation of words such as expects, anticipates, intends, plans, believes, seeks, estimates, projects, forecasts, targets, would, will, should, goal, could or may or other similar expressions. Forward‐looking statements provide management's current expectations or predictions of future conditions, events or results. All statements that address operating performance, events or developments that we expect or anticipate will occur in the future are forward‐looking statements. They may include estimates of revenues, income, earnings per share, cost savings, capital expenditures, dividends, share repurchases, liquidity, capital structure, market share, industry volume, or other financial items, descriptions of management’s plans or objectives for future operations, or descriptions of assumptions underlying any of the above. All forward‐looking statements speak only as of the date they are made and reflect the company's good faith beliefs, assumptions and expectations, but they are not guarantees of future performance or events. Furthermore, the company disclaims any obligation to publicly update or revise any forward‐looking statement, except as required by law. By their nature, forward‐looking statements are subject to risks and uncertainties that could cause actual results to differ materially from those suggested by the forward‐looking statements. Factors that might cause such differences include, but are not limited to, a variety of economic, competitive and regulatory factors, many of which are beyond the company's control, that are described in our Annual Report on Form 10‐K for the fiscal year ended Dec. 31, 2017, as well as additional factors we may describe from time to time in other filings with the SEC. You may get such filings for free at our website at www.peabodyenergy.com. You should understand that it is not possible to predict or identify all such factors and, consequently, you should not consider any such list to be a complete set of all potential risks or uncertainties. 2
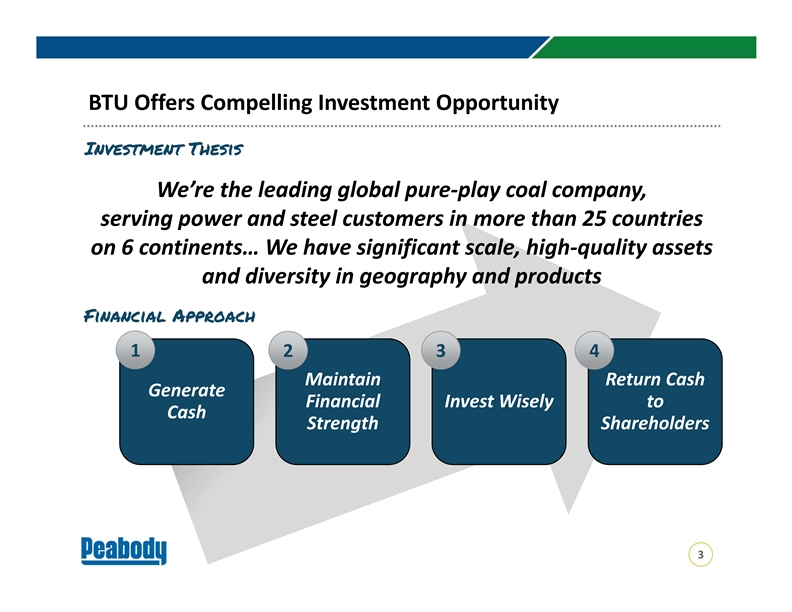
BTU Offers Compelling Investment Opportunity Investment Thesis We’re the leading global pure‐play coal company, serving power and steel customers in more than 25 countries on 6 continents… We have significant scale, high‐quality assets and diversity in geography and products Financial Approach 1 2 3 4 Maintain Return Cash Generate Financial Invest Wisely to Cash Strength Shareholders 3BTU Offers Compelling Investment Opportunity Investment Thesis We’re the leading global pure‐play coal company, serving power and steel customers in more than 25 countries on 6 continents… We have significant scale, high‐quality assets and diversity in geography and products Financial Approach 1 2 3 4 Maintain Return Cash Generate Financial Invest Wisely to Cash Strength Shareholders 3
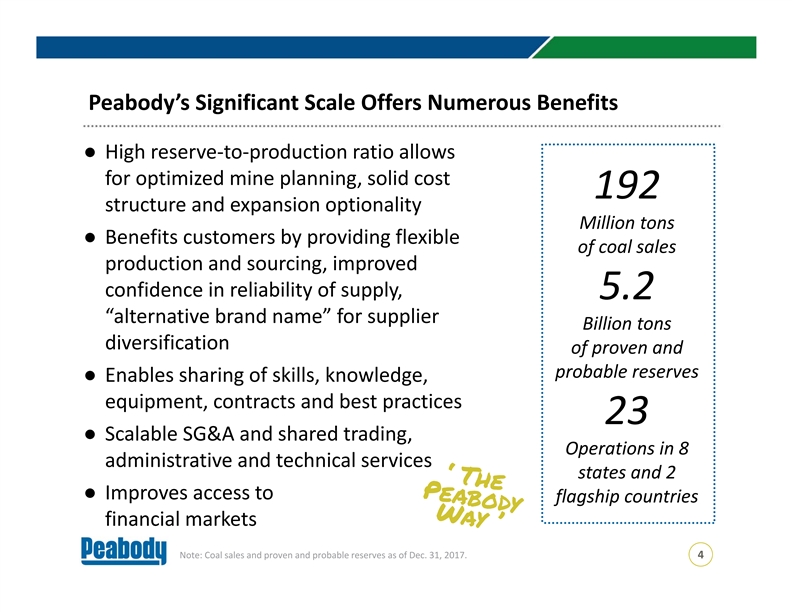
Peabody’s Significant Scale Offers Numerous Benefits ● High reserve‐to‐production ratio allows for optimized mine planning, solid cost 192 structure and expansion optionality Million tons ● Benefits customers by providing flexible of coal sales production and sourcing, improved confidence in reliability of supply, 5.2 “alternative brand name” for supplier Billion tons diversification of proven and probable reserves ● Enables sharing of skills, knowledge, equipment, contracts and best practices 23 ● Scalable SG&A and shared trading, Operations in 8 administrative and technical services states and 2 ● Improves access to flagship countries financial markets Note: Coal sales and proven and probable reserves as of Dec. 31, 2017. 4Peabody’s Significant Scale Offers Numerous Benefits ● High reserve‐to‐production ratio allows for optimized mine planning, solid cost 192 structure and expansion optionality Million tons ● Benefits customers by providing flexible of coal sales production and sourcing, improved confidence in reliability of supply, 5.2 “alternative brand name” for supplier Billion tons diversification of proven and probable reserves ● Enables sharing of skills, knowledge, equipment, contracts and best practices 23 ● Scalable SG&A and shared trading, Operations in 8 administrative and technical services states and 2 ● Improves access to flagship countries financial markets Note: Coal sales and proven and probable reserves as of Dec. 31, 2017. 4
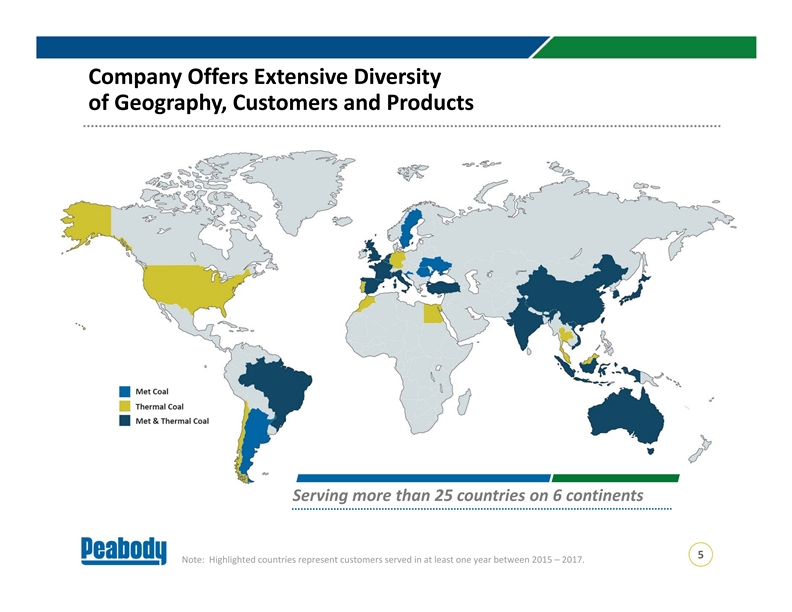
Company Offers Extensive Diversity of Geography, Customers and Products Serving more than 25 countries on 6 continents 5 Note: Highlighted countries represent customers served in at least one year between 2015 – 2017. Company Offers Extensive Diversity of Geography, Customers and Products Serving more than 25 countries on 6 continents 5 Note: Highlighted countries represent customers served in at least one year between 2015 – 2017.
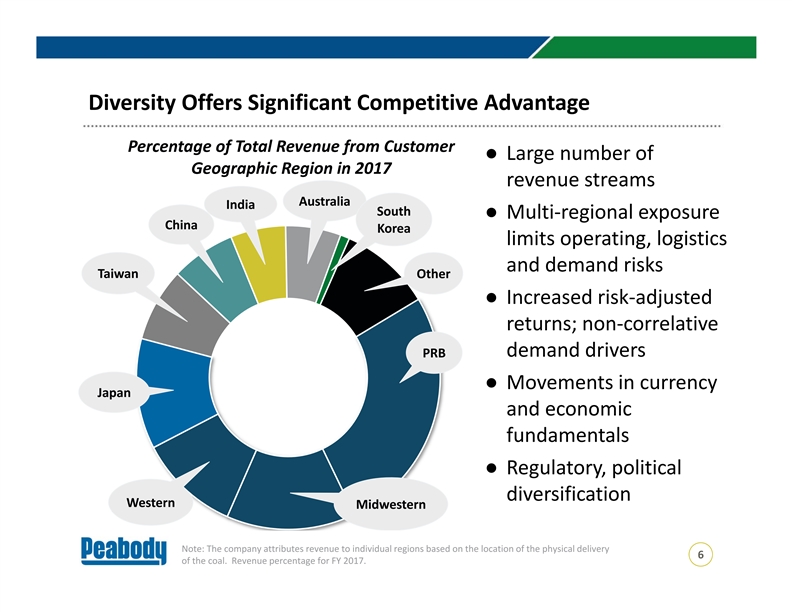
Diversity Offers Significant Competitive Advantage Percentage of Total Revenue from Customer ● Large number of Geographic Region in 2017 revenue streams Australia India South ● Multi‐regional exposure China Korea limits operating, logistics and demand risks Taiwan Other ● Increased risk‐adjusted returns; non‐correlative demand drivers PRB ● Movements in currency Japan and economic fundamentals ● Regulatory, political diversification Western Midwestern Note: The company attributes revenue to individual regions based on the location of the physical delivery 6 of the coal. Revenue percentage for FY 2017. Diversity Offers Significant Competitive Advantage Percentage of Total Revenue from Customer ● Large number of Geographic Region in 2017 revenue streams Australia India South ● Multi‐regional exposure China Korea limits operating, logistics and demand risks Taiwan Other ● Increased risk‐adjusted returns; non‐correlative demand drivers PRB ● Movements in currency Japan and economic fundamentals ● Regulatory, political diversification Western Midwestern Note: The company attributes revenue to individual regions based on the location of the physical delivery 6 of the coal. Revenue percentage for FY 2017.
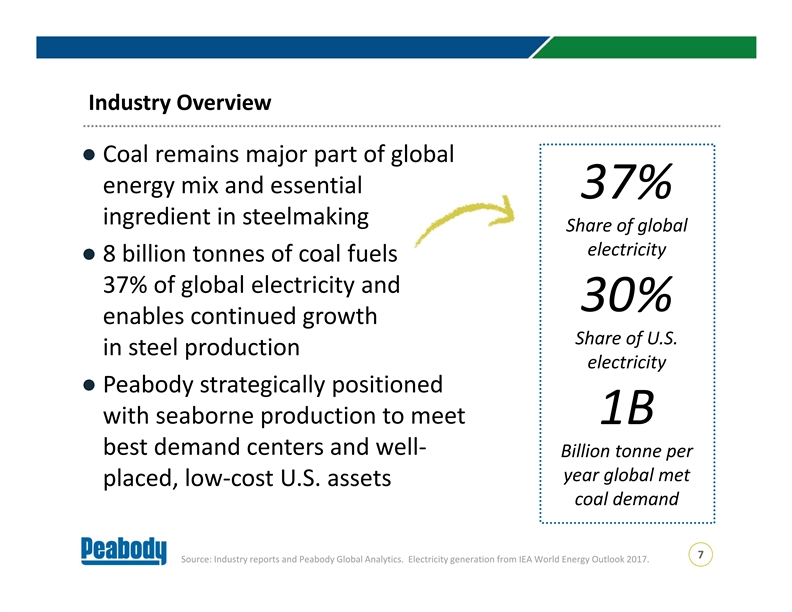
Industry Overview ● Coal remains major part of global energy mix and essential 37% ingredient in steelmaking Share of global electricity ● 8 billion tonnes of coal fuels 37% of global electricity and 30% enables continued growth Share of U.S. in steel production electricity ● Peabody strategically positioned with seaborne production to meet 1B best demand centers and well‐ Billion tonne per year global met placed, low‐cost U.S. assets coal demand 7 Source: Industry reports and Peabody Global Analytics. Electricity generation from IEA World Energy Outlook 2017. Industry Overview ● Coal remains major part of global energy mix and essential 37% ingredient in steelmaking Share of global electricity ● 8 billion tonnes of coal fuels 37% of global electricity and 30% enables continued growth Share of U.S. in steel production electricity ● Peabody strategically positioned with seaborne production to meet 1B best demand centers and well‐ Billion tonne per year global met placed, low‐cost U.S. assets coal demand 7 Source: Industry reports and Peabody Global Analytics. Electricity generation from IEA World Energy Outlook 2017.
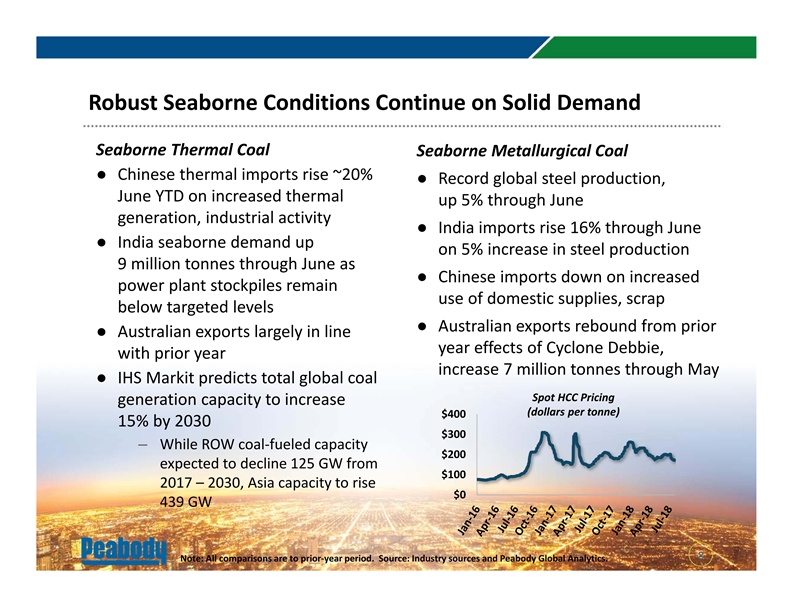
Robust Seaborne Conditions Continue on Solid Demand Seaborne Thermal Coal Seaborne Metallurgical Coal ● Chinese thermal imports rise ~20% ● Record global steel production, June YTD on increased thermal up 5% through June generation, industrial activity ● India imports rise 16% through June ● India seaborne demand up on 5% increase in steel production 9 million tonnes through June as ● Chinese imports down on increased power plant stockpiles remain use of domestic supplies, scrap below targeted levels ● Australian exports rebound from prior ● Australian exports largely in line year effects of Cyclone Debbie, with prior year increase 7 million tonnes through May ● IHS Markit predicts total global coal Spot HCC Pricing generation capacity to increase (dollars per tonne) $400 15% by 2030 $300 – While ROW coal‐fueled capacity $200 expected to decline 125 GW from $100 2017 – 2030, Asia capacity to rise $0 439 GW 8 8 Note: All comparisons are to prior‐year period. Source: Industry sources and Peabody Global Analytics.Robust Seaborne Conditions Continue on Solid Demand Seaborne Thermal Coal Seaborne Metallurgical Coal ● Chinese thermal imports rise ~20% ● Record global steel production, June YTD on increased thermal up 5% through June generation, industrial activity ● India imports rise 16% through June ● India seaborne demand up on 5% increase in steel production 9 million tonnes through June as ● Chinese imports down on increased power plant stockpiles remain use of domestic supplies, scrap below targeted levels ● Australian exports rebound from prior ● Australian exports largely in line year effects of Cyclone Debbie, with prior year increase 7 million tonnes through May ● IHS Markit predicts total global coal Spot HCC Pricing generation capacity to increase (dollars per tonne) $400 15% by 2030 $300 – While ROW coal‐fueled capacity $200 expected to decline 125 GW from $100 2017 – 2030, Asia capacity to rise $0 439 GW 8 8 Note: All comparisons are to prior‐year period. Source: Industry sources and Peabody Global Analytics.
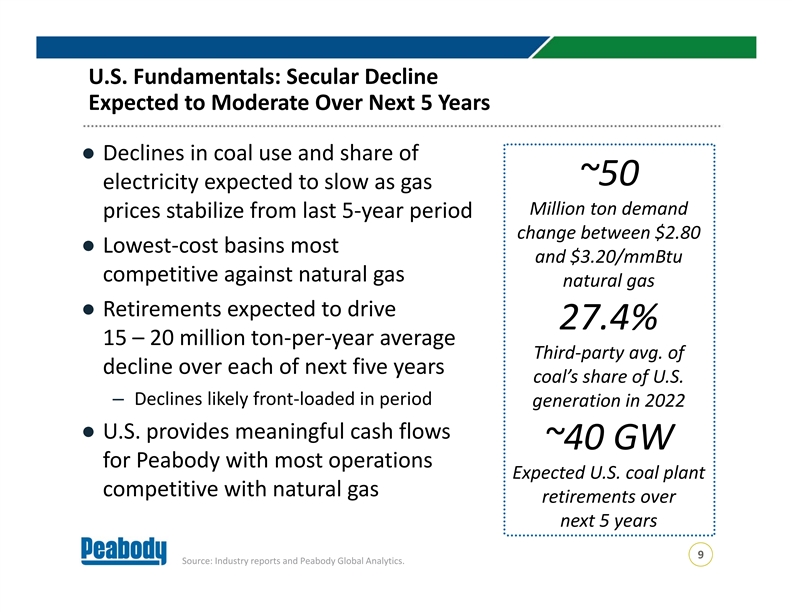
U.S. Fundamentals: Secular Decline Expected to Moderate Over Next 5 Years ● Declines in coal use and share of ~50 electricity expected to slow as gas Million ton demand prices stabilize from last 5‐year period change between $2.80 ● Lowest‐cost basins most and $3.20/mmBtu competitive against natural gas natural gas ● Retirements expected to drive 27.4% 15 – 20 million ton‐per‐year average Third‐party avg. of decline over each of next five years coal’s share of U.S. – Declines likely front‐loaded in period generation in 2022 ● U.S. provides meaningful cash flows ~40 GW for Peabody with most operations Expected U.S. coal plant competitive with natural gas retirements over next 5 years 9 Source: Industry reports and Peabody Global Analytics. U.S. Fundamentals: Secular Decline Expected to Moderate Over Next 5 Years ● Declines in coal use and share of ~50 electricity expected to slow as gas Million ton demand prices stabilize from last 5‐year period change between $2.80 ● Lowest‐cost basins most and $3.20/mmBtu competitive against natural gas natural gas ● Retirements expected to drive 27.4% 15 – 20 million ton‐per‐year average Third‐party avg. of decline over each of next five years coal’s share of U.S. – Declines likely front‐loaded in period generation in 2022 ● U.S. provides meaningful cash flows ~40 GW for Peabody with most operations Expected U.S. coal plant competitive with natural gas retirements over next 5 years 9 Source: Industry reports and Peabody Global Analytics.
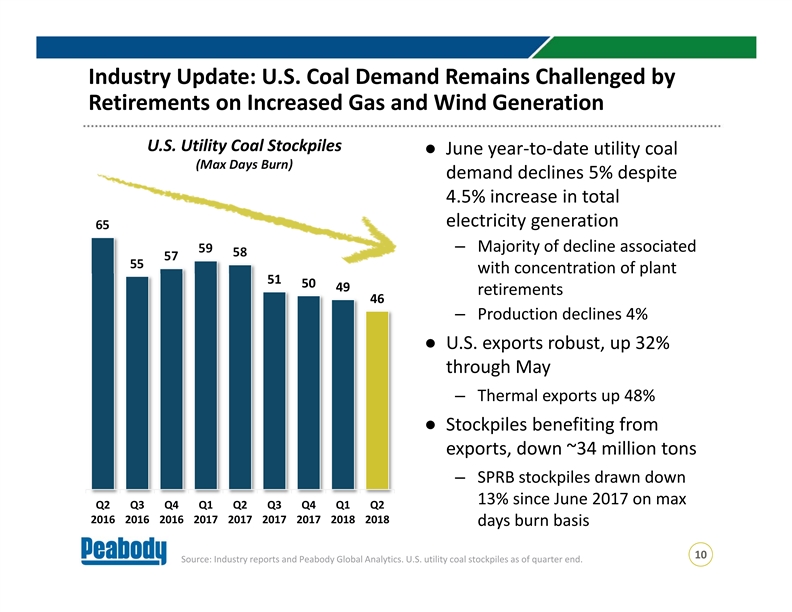
Industry Update: U.S. Coal Demand Remains Challenged by Retirements on Increased Gas and Wind Generation U.S. Utility Coal Stockpiles ● June year‐to‐date utility coal (Max Days Burn) demand declines 5% despite 4.5% increase in total electricity generation 65 – Majority of decline associated 59 58 57 55 with concentration of plant 51 50 49 retirements 46 – Production declines 4% ● U.S. exports robust, up 32% through May – Thermal exports up 48% ● Stockpiles benefiting from exports, down ~34 million tons – SPRB stockpiles drawn down 13% since June 2017 on max Q2 Q3 Q4 Q1 Q2 Q3 Q4 Q1 Q2 2016 2016 2016 2017 2017 2017 2017 2018 2018 days burn basis 10 Source: Industry reports and Peabody Global Analytics. U.S. utility coal stockpiles as of quarter end. Industry Update: U.S. Coal Demand Remains Challenged by Retirements on Increased Gas and Wind Generation U.S. Utility Coal Stockpiles ● June year‐to‐date utility coal (Max Days Burn) demand declines 5% despite 4.5% increase in total electricity generation 65 – Majority of decline associated 59 58 57 55 with concentration of plant 51 50 49 retirements 46 – Production declines 4% ● U.S. exports robust, up 32% through May – Thermal exports up 48% ● Stockpiles benefiting from exports, down ~34 million tons – SPRB stockpiles drawn down 13% since June 2017 on max Q2 Q3 Q4 Q1 Q2 Q3 Q4 Q1 Q2 2016 2016 2016 2017 2017 2017 2017 2018 2018 days burn basis 10 Source: Industry reports and Peabody Global Analytics. U.S. utility coal stockpiles as of quarter end.
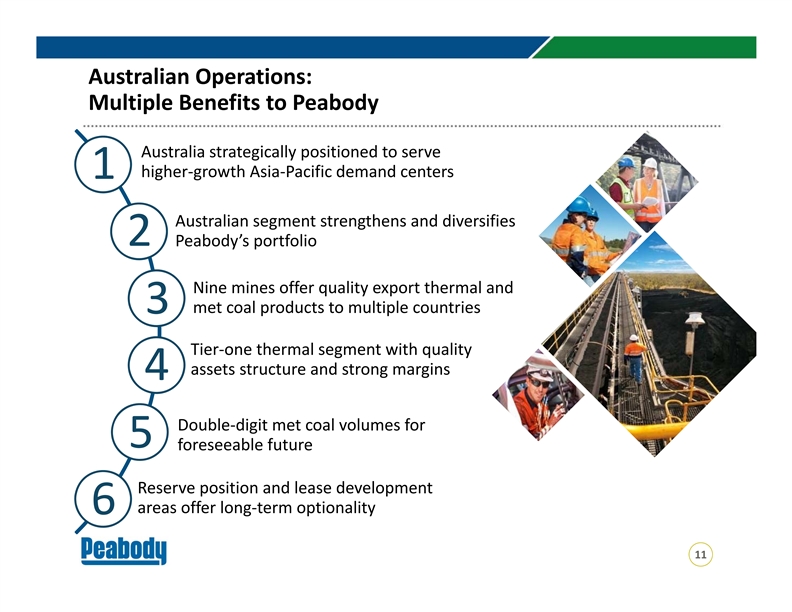
Australian Operations: Multiple Benefits to Peabody Australia strategically positioned to serve higher‐growth Asia‐Pacific demand centers 1 Australian segment strengthens and diversifies 2 Peabody’s portfolio Nine mines offer quality export thermal and met coal products to multiple countries 3 Tier‐one thermal segment with quality assets structure and strong margins 4 Double‐digit met coal volumes for 5 foreseeable future Reserve position and lease development areas offer long‐term optionality 6 11Australian Operations: Multiple Benefits to Peabody Australia strategically positioned to serve higher‐growth Asia‐Pacific demand centers 1 Australian segment strengthens and diversifies 2 Peabody’s portfolio Nine mines offer quality export thermal and met coal products to multiple countries 3 Tier‐one thermal segment with quality assets structure and strong margins 4 Double‐digit met coal volumes for 5 foreseeable future Reserve position and lease development areas offer long‐term optionality 6 11
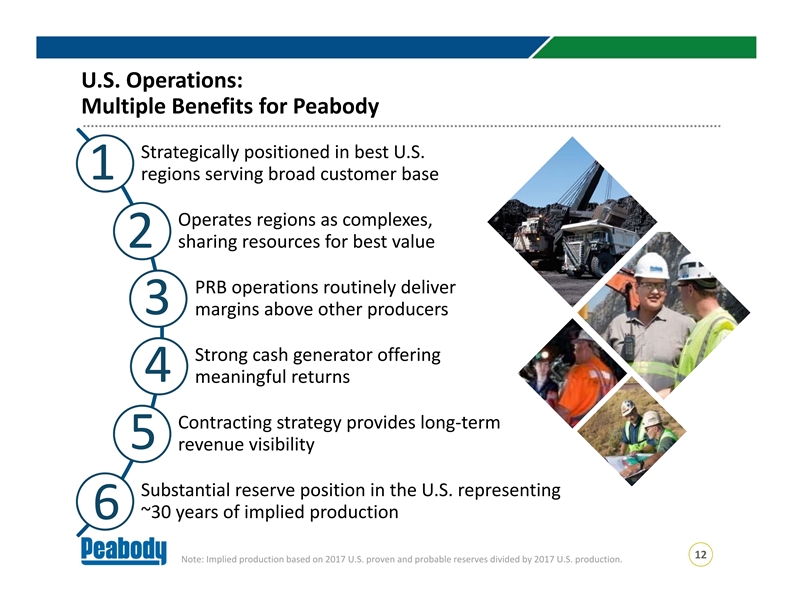
U.S. Operations: Multiple Benefits for Peabody Strategically positioned in best U.S. 1 regions serving broad customer base Operates regions as complexes, 2 sharing resources for best value PRB operations routinely deliver 3 margins above other producers Strong cash generator offering 4 meaningful returns Contracting strategy provides long‐term 5 revenue visibility Substantial reserve position in the U.S. representing ~30 years of implied production 6 12 Note: Implied production based on 2017 U.S. proven and probable reserves divided by 2017 U.S. production.U.S. Operations: Multiple Benefits for Peabody Strategically positioned in best U.S. 1 regions serving broad customer base Operates regions as complexes, 2 sharing resources for best value PRB operations routinely deliver 3 margins above other producers Strong cash generator offering 4 meaningful returns Contracting strategy provides long‐term 5 revenue visibility Substantial reserve position in the U.S. representing ~30 years of implied production 6 12 Note: Implied production based on 2017 U.S. proven and probable reserves divided by 2017 U.S. production.
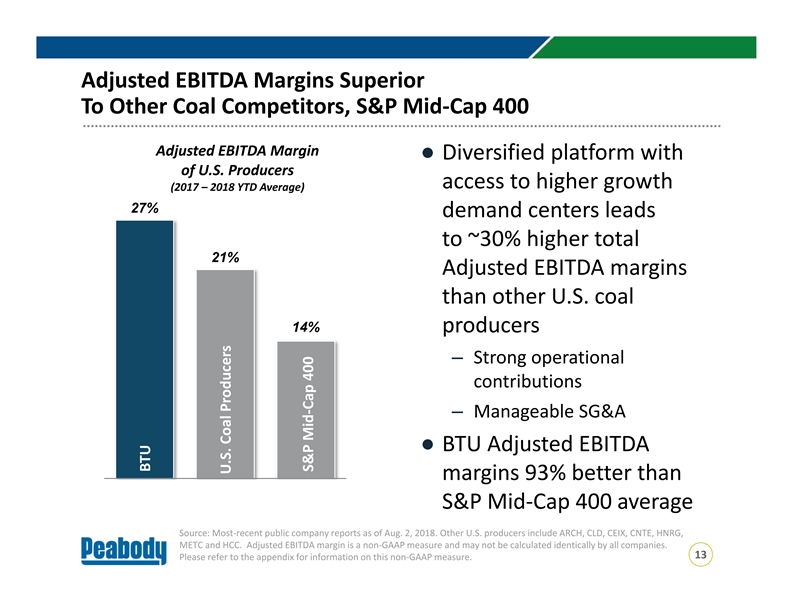
Adjusted EBITDA Margins Superior To Other Coal Competitors, S&P Mid‐Cap 400 Adjusted EBITDA Margin ● Diversified platform with of U.S. Producers access to higher growth (2017 – 2018 YTD Average) 27% demand centers leads to ~30% higher total 21% Adjusted EBITDA margins than other U.S. coal 14% producers – Strong operational contributions – Manageable SG&A ● BTU Adjusted EBITDA margins 93% better than S&P Mid‐Cap 400 average Source: Most‐recent public company reports as of Aug. 2, 2018. Other U.S. producers include ARCH, CLD, CEIX, CNTE, HNRG, METC and HCC. Adjusted EBITDA margin is a non‐GAAP measure and may not be calculated identically by all companies. 13 Please refer to the appendix for information on this non‐GAAP measure. BTU U.S. Coal Producers S&P Mid‐Cap 400Adjusted EBITDA Margins Superior To Other Coal Competitors, S&P Mid‐Cap 400 Adjusted EBITDA Margin ● Diversified platform with of U.S. Producers access to higher growth (2017 – 2018 YTD Average) 27% demand centers leads to ~30% higher total 21% Adjusted EBITDA margins than other U.S. coal 14% producers – Strong operational contributions – Manageable SG&A ● BTU Adjusted EBITDA margins 93% better than S&P Mid‐Cap 400 average Source: Most‐recent public company reports as of Aug. 2, 2018. Other U.S. producers include ARCH, CLD, CEIX, CNTE, HNRG, METC and HCC. Adjusted EBITDA margin is a non‐GAAP measure and may not be calculated identically by all companies. 13 Please refer to the appendix for information on this non‐GAAP measure. BTU U.S. Coal Producers S&P Mid‐Cap 400
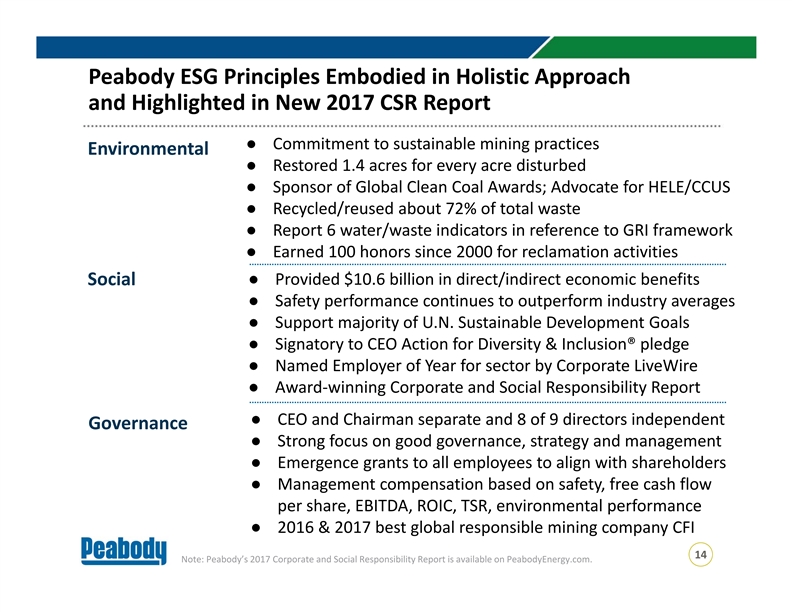
Peabody ESG Principles Embodied in Holistic Approach and Highlighted in New 2017 CSR Report ● Commitment to sustainable mining practices Environmental ● Restored 1.4 acres for every acre disturbed ● Sponsor of Global Clean Coal Awards; Advocate for HELE/CCUS ● Recycled/reused about 72% of total waste ● Report 6 water/waste indicators in reference to GRI framework ● Earned 100 honors since 2000 for reclamation activities Social● Provided $10.6 billion in direct/indirect economic benefits ● Safety performance continues to outperform industry averages ● Support majority of U.N. Sustainable Development Goals ● Signatory to CEO Action for Diversity & Inclusion® pledge ● Named Employer of Year for sector by Corporate LiveWire ● Award‐winning Corporate and Social Responsibility Report ● CEO and Chairman separate and 8 of 9 directors independent Governance ● Strong focus on good governance, strategy and management ● Emergence grants to all employees to align with shareholders ● Management compensation based on safety, free cash flow per share, EBITDA, ROIC, TSR, environmental performance ● 2016 & 2017 best global responsible mining company CFI 14 Note: Peabody’s 2017 Corporate and Social Responsibility Report is available on PeabodyEnergy.com. Peabody ESG Principles Embodied in Holistic Approach and Highlighted in New 2017 CSR Report ● Commitment to sustainable mining practices Environmental ● Restored 1.4 acres for every acre disturbed ● Sponsor of Global Clean Coal Awards; Advocate for HELE/CCUS ● Recycled/reused about 72% of total waste ● Report 6 water/waste indicators in reference to GRI framework ● Earned 100 honors since 2000 for reclamation activities Social● Provided $10.6 billion in direct/indirect economic benefits ● Safety performance continues to outperform industry averages ● Support majority of U.N. Sustainable Development Goals ● Signatory to CEO Action for Diversity & Inclusion® pledge ● Named Employer of Year for sector by Corporate LiveWire ● Award‐winning Corporate and Social Responsibility Report ● CEO and Chairman separate and 8 of 9 directors independent Governance ● Strong focus on good governance, strategy and management ● Emergence grants to all employees to align with shareholders ● Management compensation based on safety, free cash flow per share, EBITDA, ROIC, TSR, environmental performance ● 2016 & 2017 best global responsible mining company CFI 14 Note: Peabody’s 2017 Corporate and Social Responsibility Report is available on PeabodyEnergy.com.
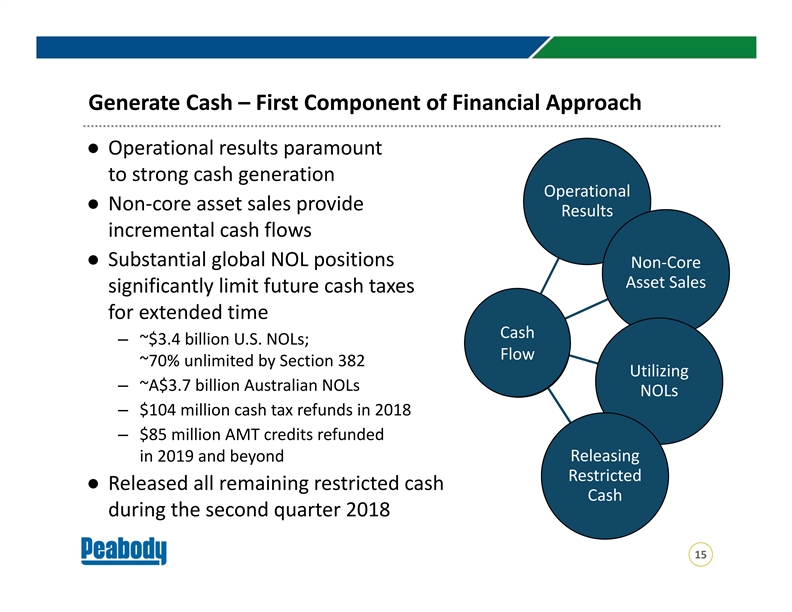
Generate Cash – First Component of Financial Approach ● Operational results paramount to strong cash generation Operational ● Non‐core asset sales provide Results incremental cash flows ● Substantial global NOL positions Non‐Core Asset Sales significantly limit future cash taxes for extended time Cash – ~$3.4 billion U.S. NOLs; Flow ~70% unlimited by Section 382 Utilizing – ~A$3.7 billion Australian NOLs NOLs – $104 million cash tax refunds in 2018 – $85 million AMT credits refunded Releasing in 2019 and beyond Restricted ● Released all remaining restricted cash Cash during the second quarter 2018 15Generate Cash – First Component of Financial Approach ● Operational results paramount to strong cash generation Operational ● Non‐core asset sales provide Results incremental cash flows ● Substantial global NOL positions Non‐Core Asset Sales significantly limit future cash taxes for extended time Cash – ~$3.4 billion U.S. NOLs; Flow ~70% unlimited by Section 382 Utilizing – ~A$3.7 billion Australian NOLs NOLs – $104 million cash tax refunds in 2018 – $85 million AMT credits refunded Releasing in 2019 and beyond Restricted ● Released all remaining restricted cash Cash during the second quarter 2018 15
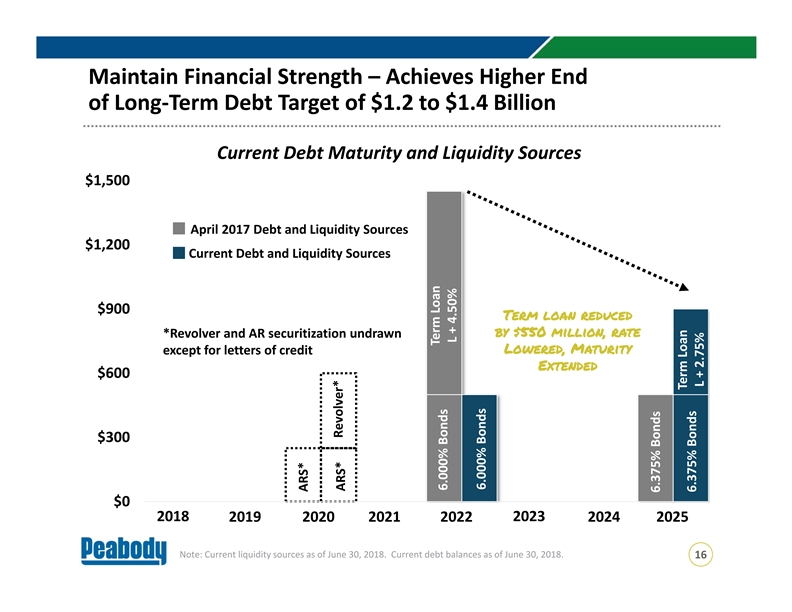
Maintain Financial Strength – Achieves Higher End of Long‐Term Debt Target of $1.2 to $1.4 Billion Current Debt Maturity and Liquidity Sources $1,500 April 2017 Debt and Liquidity Sources $1,200 Current Debt and Liquidity Sources $900 Term loan reduced by $550 million, rate *Revolver and AR securitization undrawn Lowered, Maturity except for letters of credit Extended $600 $300 $0 2018 2023 2019 2020 2021 2022 2024 2025 Note: Current liquidity sources as of June 30, 2018. Current debt balances as of June 30, 2018. 16 ARS* Revolver* ARS* Term Loan 6.000% Bonds L + 4.50% 6.000% Bonds 6.375% Bonds Term Loan 6.375% Bonds L + 2.75%Maintain Financial Strength – Achieves Higher End of Long‐Term Debt Target of $1.2 to $1.4 Billion Current Debt Maturity and Liquidity Sources $1,500 April 2017 Debt and Liquidity Sources $1,200 Current Debt and Liquidity Sources $900 Term loan reduced by $550 million, rate *Revolver and AR securitization undrawn Lowered, Maturity except for letters of credit Extended $600 $300 $0 2018 2023 2019 2020 2021 2022 2024 2025 Note: Current liquidity sources as of June 30, 2018. Current debt balances as of June 30, 2018. 16 ARS* Revolver* ARS* Term Loan 6.000% Bonds L + 4.50% 6.000% Bonds 6.375% Bonds Term Loan 6.375% Bonds L + 2.75%
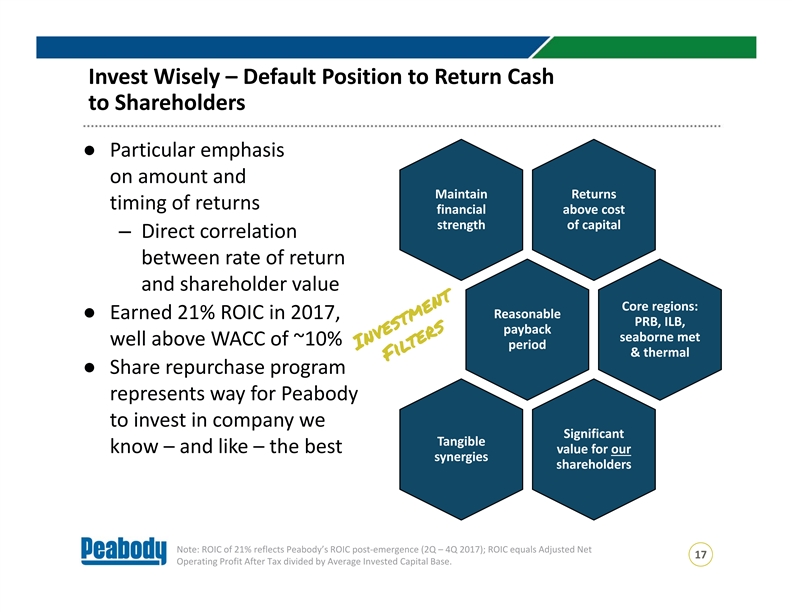
Invest Wisely – Default Position to Return Cash to Shareholders ● Particular emphasis on amount and Maintain Returns timing of returns financial above cost strength of capital – Direct correlation between rate of return and shareholder value Core regions: Reasonable ● Earned 21% ROIC in 2017, PRB, ILB, payback seaborne met well above WACC of ~10% period & thermal ● Share repurchase program represents way for Peabody to invest in company we Significant Tangible know – and like – the best value for our synergies shareholders Note: ROIC of 21% reflects Peabody’s ROIC post‐emergence (2Q – 4Q 2017); ROIC equals Adjusted Net 17 Operating Profit After Tax divided by Average Invested Capital Base. Invest Wisely – Default Position to Return Cash to Shareholders ● Particular emphasis on amount and Maintain Returns timing of returns financial above cost strength of capital – Direct correlation between rate of return and shareholder value Core regions: Reasonable ● Earned 21% ROIC in 2017, PRB, ILB, payback seaborne met well above WACC of ~10% period & thermal ● Share repurchase program represents way for Peabody to invest in company we Significant Tangible know – and like – the best value for our synergies shareholders Note: ROIC of 21% reflects Peabody’s ROIC post‐emergence (2Q – 4Q 2017); ROIC equals Adjusted Net 17 Operating Profit After Tax divided by Average Invested Capital Base.
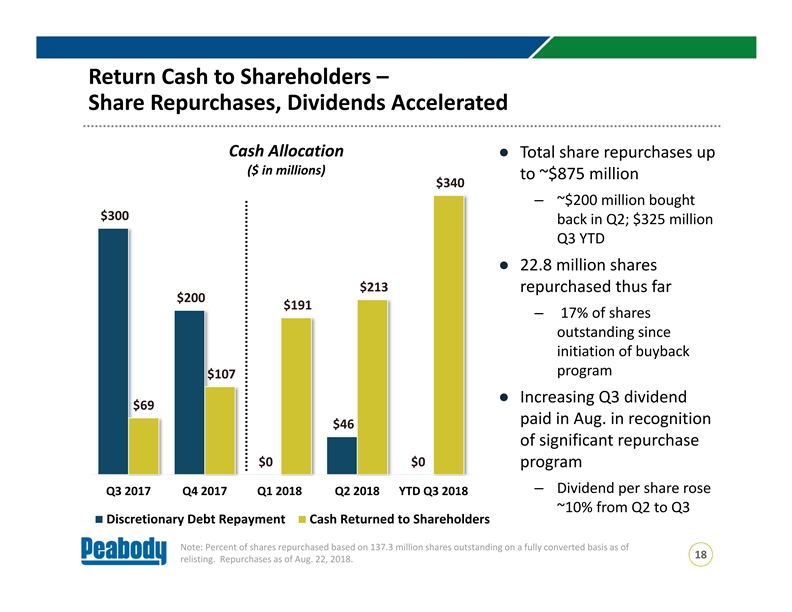
Return Cash to Shareholders – Share Repurchases, Dividends Accelerated Cash Allocation ● Total share repurchases up ($ in millions) to ~$875 million $340 – ~$200 million bought $300 back in Q2; $325 million Q3 YTD ● 22.8 million shares $213 repurchased thus far $200 $191 – 17% of shares outstanding since initiation of buyback program $107 ● Increasing Q3 dividend $69 paid in Aug. in recognition $46 of significant repurchase $0 $0 program – Dividend per share rose Q3 2017 Q4 2017 Q1 2018 Q2 2018 YTD Q3 2018 ~10% from Q2 to Q3 Discretionary Debt Repayment Cash Returned to Shareholders Note: Percent of shares repurchased based on 137.3 million shares outstanding on a fully converted basis as of 18 relisting. Repurchases as of Aug. 22, 2018. Return Cash to Shareholders – Share Repurchases, Dividends Accelerated Cash Allocation ● Total share repurchases up ($ in millions) to ~$875 million $340 – ~$200 million bought $300 back in Q2; $325 million Q3 YTD ● 22.8 million shares $213 repurchased thus far $200 $191 – 17% of shares outstanding since initiation of buyback program $107 ● Increasing Q3 dividend $69 paid in Aug. in recognition $46 of significant repurchase $0 $0 program – Dividend per share rose Q3 2017 Q4 2017 Q1 2018 Q2 2018 YTD Q3 2018 ~10% from Q2 to Q3 Discretionary Debt Repayment Cash Returned to Shareholders Note: Percent of shares repurchased based on 137.3 million shares outstanding on a fully converted basis as of 18 relisting. Repurchases as of Aug. 22, 2018.
Peabody: Integrated Approach Creates Maximum Value · The Peabody team delivered powerful achievements since relisting, and we’re not about to stop · We are committed to outlining approach and then delivering · We have the right assets, financial strength, people and strategies to succeed · We are continuing to progress actions that will drive continued valuation uplifts throughout the commodity cycles NYSE: BTU PeabodyEnergy.com 19Peabody: Integrated Approach Creates Maximum Value · The Peabody team delivered powerful achievements since relisting, and we’re not about to stop · We are committed to outlining approach and then delivering · We have the right assets, financial strength, people and strategies to succeed · We are continuing to progress actions that will drive continued valuation uplifts throughout the commodity cycles NYSE: BTU PeabodyEnergy.com 19
AppendixAppendix
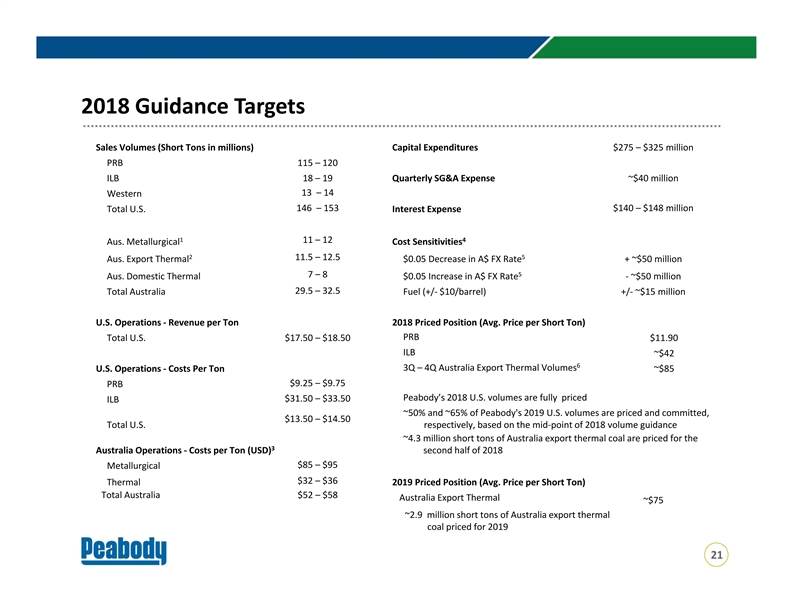
2018 Guidance Targets Sales Volumes (Short Tons in millions) Capital Expenditures $275 – $325 million PRB 115 – 120 ILB 18 – 19 Quarterly SG&A Expense ~$40 million 13 – 14 Western 146 – 153 $140 – $148 million Total U.S. Interest Expense 1 4 11 – 12 Aus. Metallurgical Cost Sensitivities 2 5 11.5 – 12.5 Aus. Export Thermal $0.05 Decrease in A$ FX Rate + ~$50 million 5 7 – 8 Aus. Domestic Thermal $0.05 Increase in A$ FX Rate ‐ ~$50 million 29.5 – 32.5 Total Australia Fuel (+/‐ $10/barrel) +/‐ ~$15 million U.S. Operations ‐ Revenue per Ton 2018 Priced Position (Avg. Price per Short Ton) PRB Total U.S. $17.50 – $18.50 $11.90 ILB ~$42 6 3Q – 4Q Australia Export Thermal Volumes U.S. Operations ‐ Costs Per Ton ~$85 $9.25 – $9.75 PRB Peabody’s 2018 U.S. volumes are fully priced $31.50 – $33.50 ILB ~50% and ~65% of Peabody's 2019 U.S. volumes are priced and committed, $13.50 – $14.50 Total U.S. respectively, based on the mid‐point of 2018 volume guidance ~4.3 million short tons of Australia export thermal coal are priced for the 3 Australia Operations ‐ Costs per Ton (USD) second half of 2018 $85 – $95 Metallurgical $32 – $36 Thermal 2019 Priced Position (Avg. Price per Short Ton) Total Australia $52 – $58 Australia Export Thermal ~$75 ~2.9 million short tons of Australia export thermal coal priced for 2019 212018 Guidance Targets Sales Volumes (Short Tons in millions) Capital Expenditures $275 – $325 million PRB 115 – 120 ILB 18 – 19 Quarterly SG&A Expense ~$40 million 13 – 14 Western 146 – 153 $140 – $148 million Total U.S. Interest Expense 1 4 11 – 12 Aus. Metallurgical Cost Sensitivities 2 5 11.5 – 12.5 Aus. Export Thermal $0.05 Decrease in A$ FX Rate + ~$50 million 5 7 – 8 Aus. Domestic Thermal $0.05 Increase in A$ FX Rate ‐ ~$50 million 29.5 – 32.5 Total Australia Fuel (+/‐ $10/barrel) +/‐ ~$15 million U.S. Operations ‐ Revenue per Ton 2018 Priced Position (Avg. Price per Short Ton) PRB Total U.S. $17.50 – $18.50 $11.90 ILB ~$42 6 3Q – 4Q Australia Export Thermal Volumes U.S. Operations ‐ Costs Per Ton ~$85 $9.25 – $9.75 PRB Peabody’s 2018 U.S. volumes are fully priced $31.50 – $33.50 ILB ~50% and ~65% of Peabody's 2019 U.S. volumes are priced and committed, $13.50 – $14.50 Total U.S. respectively, based on the mid‐point of 2018 volume guidance ~4.3 million short tons of Australia export thermal coal are priced for the 3 Australia Operations ‐ Costs per Ton (USD) second half of 2018 $85 – $95 Metallurgical $32 – $36 Thermal 2019 Priced Position (Avg. Price per Short Ton) Total Australia $52 – $58 Australia Export Thermal ~$75 ~2.9 million short tons of Australia export thermal coal priced for 2019 21
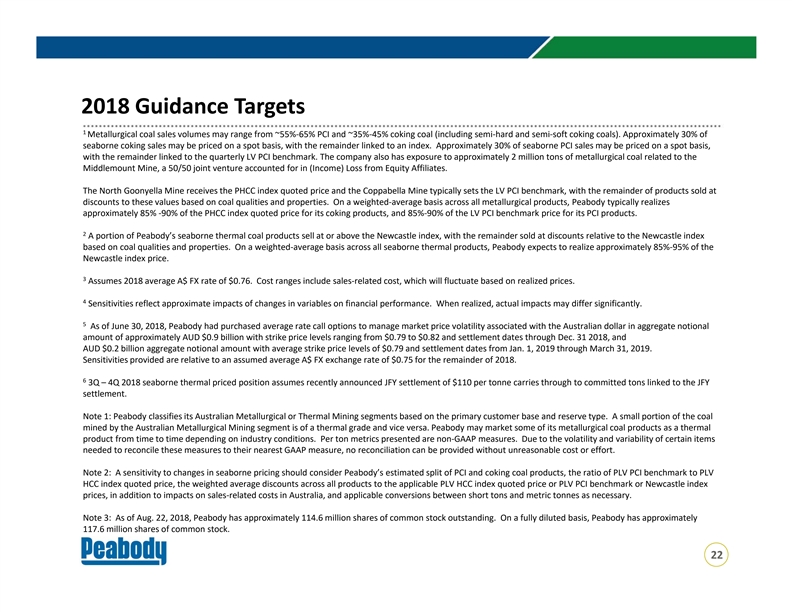
2018 Guidance Targets 1 Metallurgical coal sales volumes may range from ~55%‐65% PCI and ~35%‐45% coking coal (including semi‐hard and semi‐soft coking coals). Approximately 30% of seaborne coking sales may be priced on a spot basis, with the remainder linked to an index. Approximately 30% of seaborne PCI sales may be priced on a spot basis, with the remainder linked to the quarterly LV PCI benchmark. The company also has exposure to approximately 2 million tons of metallurgical coal related to the Middlemount Mine, a 50/50 joint venture accounted for in (Income) Loss from Equity Affiliates. The North Goonyella Mine receives the PHCC index quoted price and the Coppabella Mine typically sets the LV PCI benchmark, with the remainder of products sold at discounts to these values based on coal qualities and properties. On a weighted‐average basis across all metallurgical products, Peabody typically realizes approximately 85% ‐90% of the PHCC index quoted price for its coking products, and 85%‐90% of the LV PCI benchmark price for its PCI products. 2 A portion of Peabody’s seaborne thermal coal products sell at or above the Newcastle index, with the remainder sold at discounts relative to the Newcastle index based on coal qualities and properties. On a weighted‐average basis across all seaborne thermal products, Peabody expects to realize approximately 85%‐95% of the Newcastle index price. 3 Assumes 2018 average A$ FX rate of $0.76. Cost ranges include sales‐related cost, which will fluctuate based on realized prices. 4 Sensitivities reflect approximate impacts of changes in variables on financial performance. When realized, actual impacts may differ significantly. 5 As of June 30, 2018, Peabody had purchased average rate call options to manage market price volatility associated with the Australian dollar in aggregate notional amount of approximately AUD $0.9 billion with strike price levels ranging from $0.79 to $0.82 and settlement dates through Dec. 31 2018, and AUD $0.2 billion aggregate notional amount with average strike price levels of $0.79 and settlement dates from Jan. 1, 2019 through March 31, 2019. Sensitivities provided are relative to an assumed average A$ FX exchange rate of $0.75 for the remainder of 2018. 6 3Q – 4Q 2018 seaborne thermal priced position assumes recently announced JFY settlement of $110 per tonne carries through to committed tons linked to the JFY settlement. Note 1: Peabody classifies its Australian Metallurgical or Thermal Mining segments based on the primary customer base and reserve type. A small portion of the coal mined by the Australian Metallurgical Mining segment is of a thermal grade and vice versa. Peabody may market some of its metallurgical coal products as a thermal product from time to time depending on industry conditions. Per ton metrics presented are non‐GAAP measures. Due to the volatility and variability of certain items needed to reconcile these measures to their nearest GAAP measure, no reconciliation can be provided without unreasonable cost oreffort. Note 2: A sensitivity to changes in seaborne pricing should consider Peabody’s estimated split of PCI and coking coal products, the ratio of PLV PCI benchmark to PLV HCC index quoted price, the weighted average discounts across all products to the applicable PLV HCC index quoted price or PLV PCI benchmark or Newcastle index prices, in addition to impacts on sales‐related costs in Australia, and applicable conversions between short tons and metric tonnes as necessary. Note 3: As of Aug. 22, 2018, Peabody has approximately 114.6 million shares of common stock outstanding. On a fully diluted basis, Peabody has approximately 117.6 million shares of common stock. 222018 Guidance Targets 1 Metallurgical coal sales volumes may range from ~55%‐65% PCI and ~35%‐45% coking coal (including semi‐hard and semi‐soft coking coals). Approximately 30% of seaborne coking sales may be priced on a spot basis, with the remainder linked to an index. Approximately 30% of seaborne PCI sales may be priced on a spot basis, with the remainder linked to the quarterly LV PCI benchmark. The company also has exposure to approximately 2 million tons of metallurgical coal related to the Middlemount Mine, a 50/50 joint venture accounted for in (Income) Loss from Equity Affiliates. The North Goonyella Mine receives the PHCC index quoted price and the Coppabella Mine typically sets the LV PCI benchmark, with the remainder of products sold at discounts to these values based on coal qualities and properties. On a weighted‐average basis across all metallurgical products, Peabody typically realizes approximately 85% ‐90% of the PHCC index quoted price for its coking products, and 85%‐90% of the LV PCI benchmark price for its PCI products. 2 A portion of Peabody’s seaborne thermal coal products sell at or above the Newcastle index, with the remainder sold at discounts relative to the Newcastle index based on coal qualities and properties. On a weighted‐average basis across all seaborne thermal products, Peabody expects to realize approximately 85%‐95% of the Newcastle index price. 3 Assumes 2018 average A$ FX rate of $0.76. Cost ranges include sales‐related cost, which will fluctuate based on realized prices. 4 Sensitivities reflect approximate impacts of changes in variables on financial performance. When realized, actual impacts may differ significantly. 5 As of June 30, 2018, Peabody had purchased average rate call options to manage market price volatility associated with the Australian dollar in aggregate notional amount of approximately AUD $0.9 billion with strike price levels ranging from $0.79 to $0.82 and settlement dates through Dec. 31 2018, and AUD $0.2 billion aggregate notional amount with average strike price levels of $0.79 and settlement dates from Jan. 1, 2019 through March 31, 2019. Sensitivities provided are relative to an assumed average A$ FX exchange rate of $0.75 for the remainder of 2018. 6 3Q – 4Q 2018 seaborne thermal priced position assumes recently announced JFY settlement of $110 per tonne carries through to committed tons linked to the JFY settlement. Note 1: Peabody classifies its Australian Metallurgical or Thermal Mining segments based on the primary customer base and reserve type. A small portion of the coal mined by the Australian Metallurgical Mining segment is of a thermal grade and vice versa. Peabody may market some of its metallurgical coal products as a thermal product from time to time depending on industry conditions. Per ton metrics presented are non‐GAAP measures. Due to the volatility and variability of certain items needed to reconcile these measures to their nearest GAAP measure, no reconciliation can be provided without unreasonable cost oreffort. Note 2: A sensitivity to changes in seaborne pricing should consider Peabody’s estimated split of PCI and coking coal products, the ratio of PLV PCI benchmark to PLV HCC index quoted price, the weighted average discounts across all products to the applicable PLV HCC index quoted price or PLV PCI benchmark or Newcastle index prices, in addition to impacts on sales‐related costs in Australia, and applicable conversions between short tons and metric tonnes as necessary. Note 3: As of Aug. 22, 2018, Peabody has approximately 114.6 million shares of common stock outstanding. On a fully diluted basis, Peabody has approximately 117.6 million shares of common stock. 22
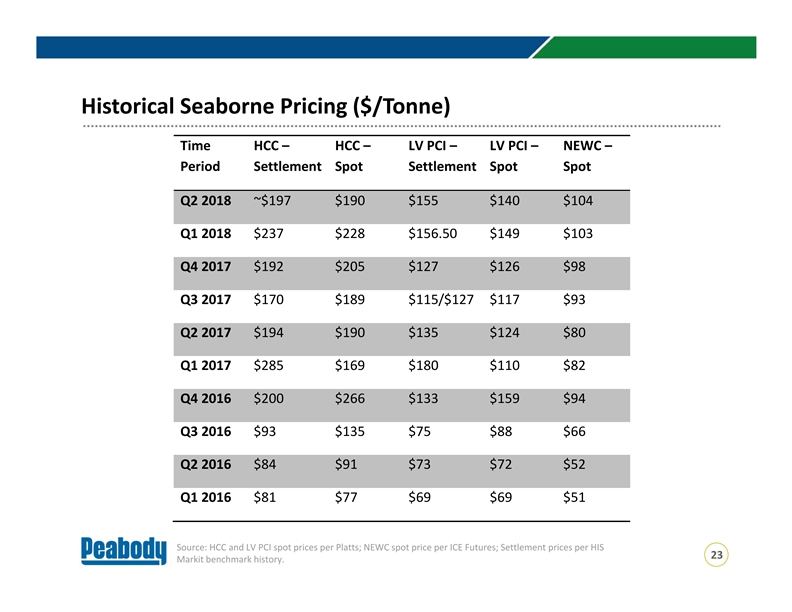
Historical Seaborne Pricing ($/Tonne) Time HCC – HCC – LV PCI – LV PCI – NEWC – Period Settlement Spot Settlement Spot Spot Q2 2018 ~$197 $190 $155 $140 $104 Q1 2018 $237 $228 $156.50 $149 $103 Q4 2017 $192 $205 $127 $126 $98 Q3 2017 $170 $189 $115/$127 $117 $93 Q2 2017 $194 $190 $135 $124 $80 Q1 2017 $285 $169 $180 $110 $82 Q4 2016 $200 $266 $133 $159 $94 Q3 2016 $93 $135 $75 $88 $66 Q2 2016 $84 $91 $73 $72 $52 Q1 2016 $81 $77 $69 $69 $51 Source: HCC and LV PCI spot prices per Platts; NEWC spot price per ICE Futures; Settlement prices per HIS 23 Markit benchmark history. Historical Seaborne Pricing ($/Tonne) Time HCC – HCC – LV PCI – LV PCI – NEWC – Period Settlement Spot Settlement Spot Spot Q2 2018 ~$197 $190 $155 $140 $104 Q1 2018 $237 $228 $156.50 $149 $103 Q4 2017 $192 $205 $127 $126 $98 Q3 2017 $170 $189 $115/$127 $117 $93 Q2 2017 $194 $190 $135 $124 $80 Q1 2017 $285 $169 $180 $110 $82 Q4 2016 $200 $266 $133 $159 $94 Q3 2016 $93 $135 $75 $88 $66 Q2 2016 $84 $91 $73 $72 $52 Q1 2016 $81 $77 $69 $69 $51 Source: HCC and LV PCI spot prices per Platts; NEWC spot price per ICE Futures; Settlement prices per HIS 23 Markit benchmark history.
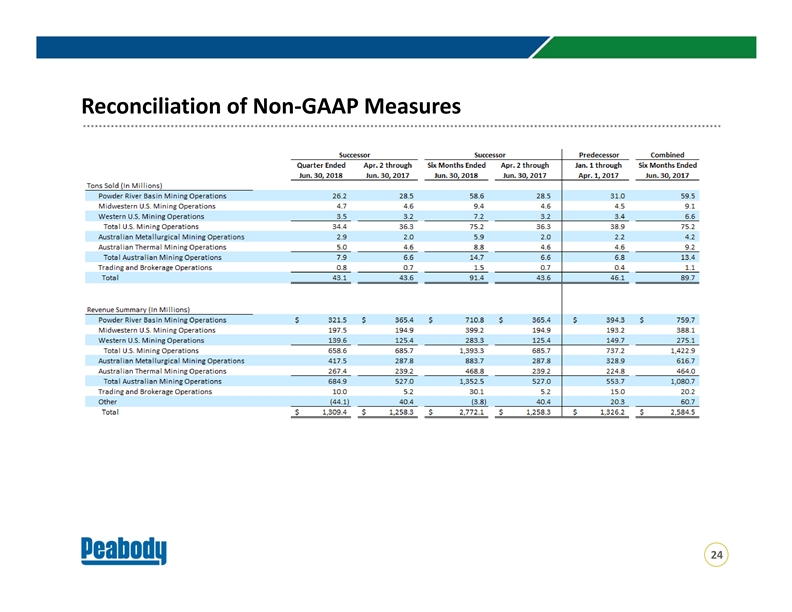
Reconciliation of Non‐GAAP Measures 24Reconciliation of Non‐GAAP Measures 24
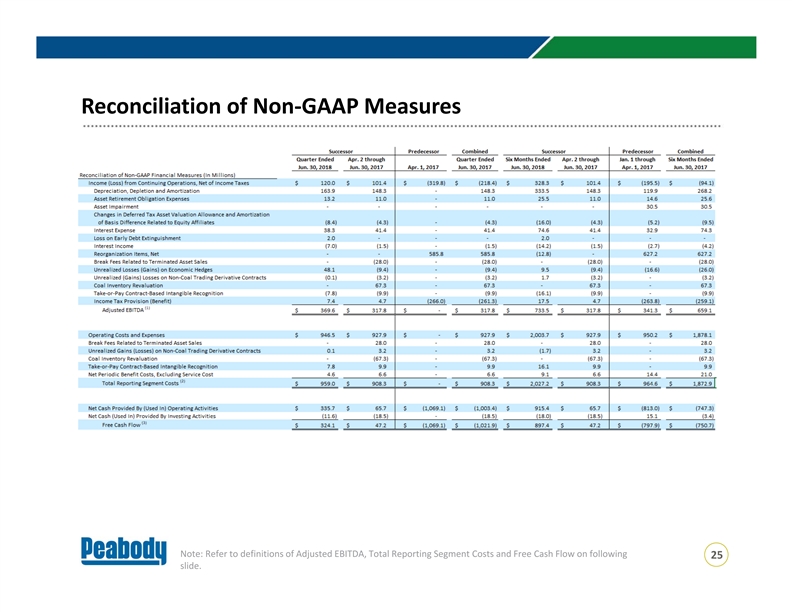
Reconciliation of Non‐GAAP Measures Note: Refer to definitions of Adjusted EBITDA, Total Reporting Segment Costs and Free Cash Flow on following 25 slide. Reconciliation of Non‐GAAP Measures Note: Refer to definitions of Adjusted EBITDA, Total Reporting Segment Costs and Free Cash Flow on following 25 slide.
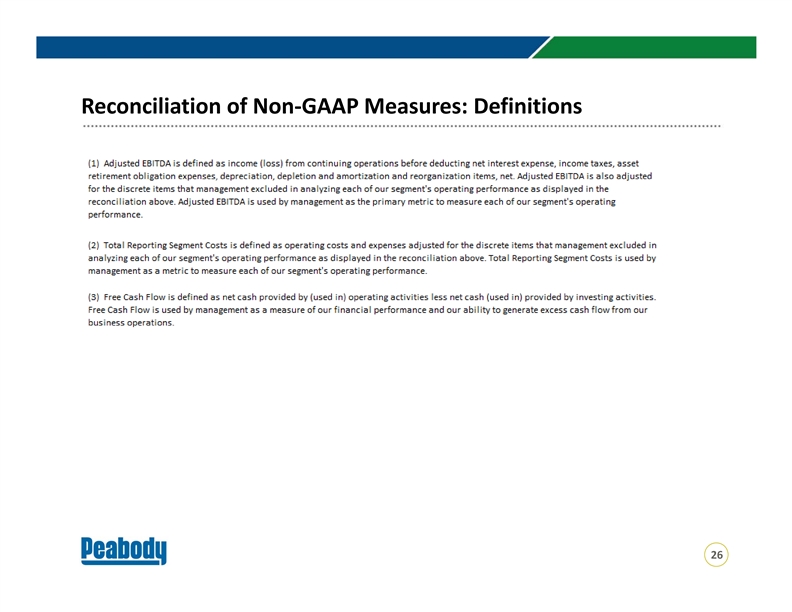
Reconciliation of Non‐GAAP Measures: Definitions 26Reconciliation of Non‐GAAP Measures: Definitions 26
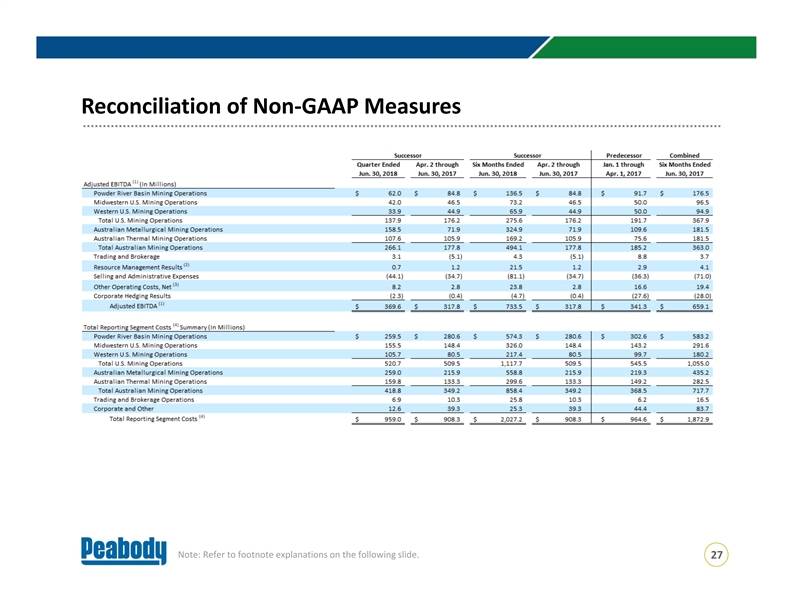
Reconciliation of Non‐GAAP Measures Note: Refer to footnote explanations on the following slide. 27Reconciliation of Non‐GAAP Measures Note: Refer to footnote explanations on the following slide. 27
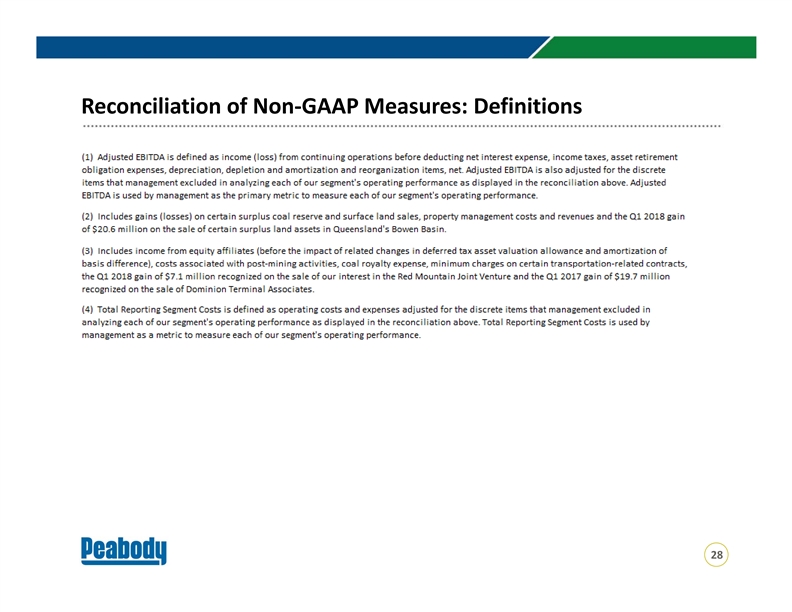
Reconciliation of Non‐GAAP Measures: Definitions 28Reconciliation of Non‐GAAP Measures: Definitions 28
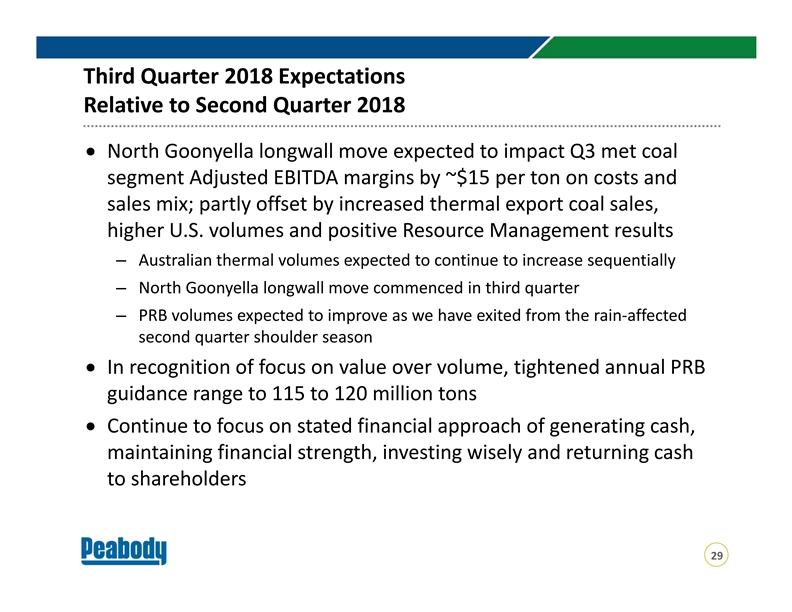
Third Quarter 2018 Expectations Relative to Second Quarter 2018 · North Goonyella longwall move expected to impact Q3 met coal segment Adjusted EBITDA margins by ~$15 per ton on costs and sales mix; partly offset by increased thermal export coal sales, higher U.S. volumes and positive Resource Management results – Australian thermal volumes expected to continue to increase sequentially – North Goonyella longwall move commenced in third quarter – PRB volumes expected to improve as we have exited from the rain‐affected second quarter shoulder season · In recognition of focus on value over volume, tightened annual PRB guidance range to 115 to 120 million tons · Continue to focus on stated financial approach of generating cash, maintaining financial strength, investing wisely and returning cash to shareholders 29Third Quarter 2018 Expectations Relative to Second Quarter 2018 · North Goonyella longwall move expected to impact Q3 met coal segment Adjusted EBITDA margins by ~$15 per ton on costs and sales mix; partly offset by increased thermal export coal sales, higher U.S. volumes and positive Resource Management results – Australian thermal volumes expected to continue to increase sequentially – North Goonyella longwall move commenced in third quarter – PRB volumes expected to improve as we have exited from the rain‐affected second quarter shoulder season · In recognition of focus on value over volume, tightened annual PRB guidance range to 115 to 120 million tons · Continue to focus on stated financial approach of generating cash, maintaining financial strength, investing wisely and returning cash to shareholders 29
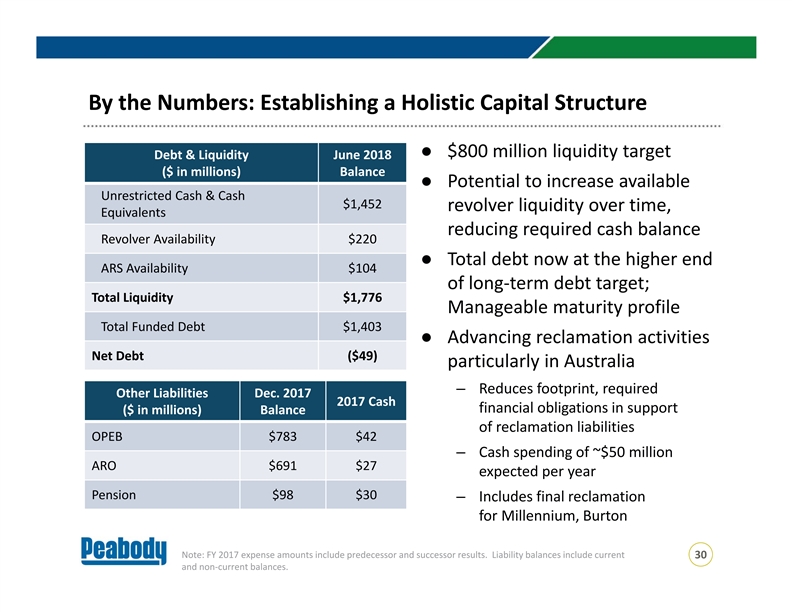
By the Numbers: Establishing a Holistic Capital Structure ● $800 million liquidity target Debt & Liquidity June 2018 ($ in millions) Balance ● Potential to increase available Unrestricted Cash & Cash $1,452 revolver liquidity over time, Equivalents reducing required cash balance Revolver Availability $220 ● Total debt now at the higher end ARS Availability $104 of long‐term debt target; Total Liquidity $1,776 Manageable maturity profile Total Funded Debt $1,403 ● Advancing reclamation activities Net Debt ($49) particularly in Australia – Reduces footprint, required Other Liabilities Dec. 2017 2017 Cash financial obligations in support ($ in millions) Balance of reclamation liabilities OPEB $783 $42 – Cash spending of ~$50 million ARO $691 $27 expected per year Pension $98 $30 – Includes final reclamation for Millennium, Burton Note: FY 2017 expense amounts include predecessor and successor results. Liability balances include current 30 and non‐current balances. By the Numbers: Establishing a Holistic Capital Structure ● $800 million liquidity target Debt & Liquidity June 2018 ($ in millions) Balance ● Potential to increase available Unrestricted Cash & Cash $1,452 revolver liquidity over time, Equivalents reducing required cash balance Revolver Availability $220 ● Total debt now at the higher end ARS Availability $104 of long‐term debt target; Total Liquidity $1,776 Manageable maturity profile Total Funded Debt $1,403 ● Advancing reclamation activities Net Debt ($49) particularly in Australia – Reduces footprint, required Other Liabilities Dec. 2017 2017 Cash financial obligations in support ($ in millions) Balance of reclamation liabilities OPEB $783 $42 – Cash spending of ~$50 million ARO $691 $27 expected per year Pension $98 $30 – Includes final reclamation for Millennium, Burton Note: FY 2017 expense amounts include predecessor and successor results. Liability balances include current 30 and non‐current balances.
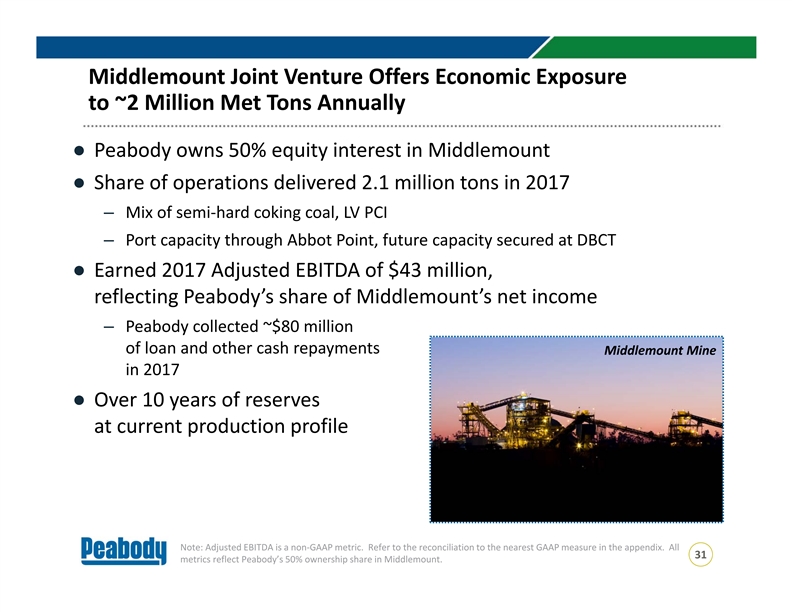
Middlemount Joint Venture Offers Economic Exposure to ~2 Million Met Tons Annually ● Peabody owns 50% equity interest in Middlemount ● Share of operations delivered 2.1 million tons in 2017 – Mix of semi‐hard coking coal, LV PCI – Port capacity through Abbot Point, future capacity secured at DBCT ● Earned 2017 Adjusted EBITDA of $43 million, reflecting Peabody’s share of Middlemount’s net income – Peabody collected ~$80 million of loan and other cash repayments Middlemount Mine in 2017 ● Over 10 years of reserves at current production profile Note: Adjusted EBITDA is a non‐GAAP metric. Refer to the reconciliation to the nearest GAAP measure in the appendix. All 31 metrics reflect Peabody’s 50% ownership share in Middlemount. Middlemount Joint Venture Offers Economic Exposure to ~2 Million Met Tons Annually ● Peabody owns 50% equity interest in Middlemount ● Share of operations delivered 2.1 million tons in 2017 – Mix of semi‐hard coking coal, LV PCI – Port capacity through Abbot Point, future capacity secured at DBCT ● Earned 2017 Adjusted EBITDA of $43 million, reflecting Peabody’s share of Middlemount’s net income – Peabody collected ~$80 million of loan and other cash repayments Middlemount Mine in 2017 ● Over 10 years of reserves at current production profile Note: Adjusted EBITDA is a non‐GAAP metric. Refer to the reconciliation to the nearest GAAP measure in the appendix. All 31 metrics reflect Peabody’s 50% ownership share in Middlemount.
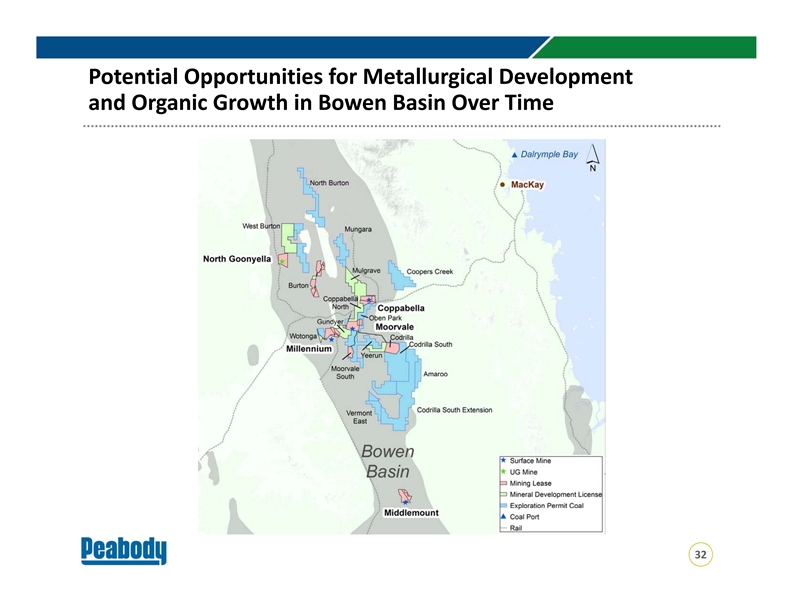
Potential Opportunities for Metallurgical Development and Organic Growth in Bowen Basin Over Time 32Potential Opportunities for Metallurgical Development and Organic Growth in Bowen Basin Over Time 32
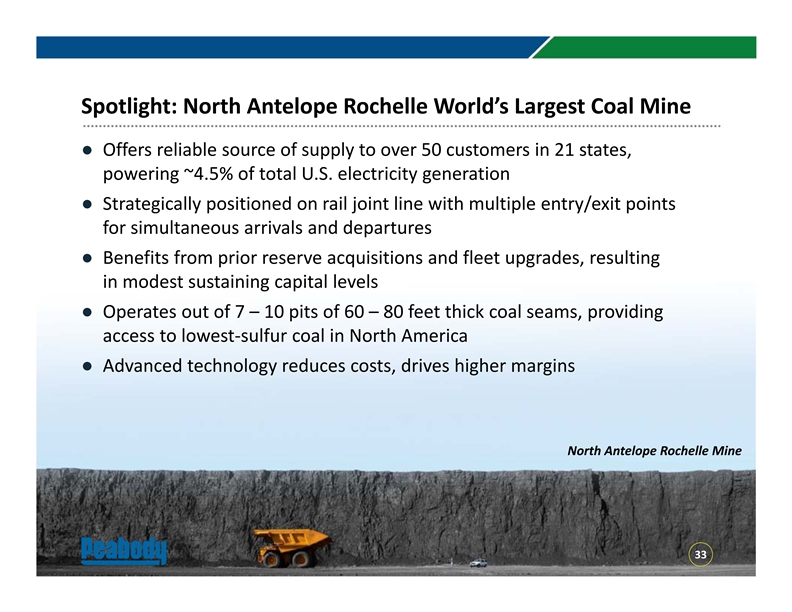
Spotlight: North Antelope Rochelle World’s Largest Coal Mine ● Offers reliable source of supply to over 50 customers in 21 states, powering ~4.5% of total U.S. electricity generation ● Strategically positioned on rail joint line with multiple entry/exit points for simultaneous arrivals and departures ● Benefits from prior reserve acquisitions and fleet upgrades, resulting in modest sustaining capital levels ● Operates out of 7 – 10 pits of 60 – 80 feet thick coal seams, providing access to lowest‐sulfur coal in North America ● Advanced technology reduces costs, drives higher margins North Antelope Rochelle Mine 33Spotlight: North Antelope Rochelle World’s Largest Coal Mine ● Offers reliable source of supply to over 50 customers in 21 states, powering ~4.5% of total U.S. electricity generation ● Strategically positioned on rail joint line with multiple entry/exit points for simultaneous arrivals and departures ● Benefits from prior reserve acquisitions and fleet upgrades, resulting in modest sustaining capital levels ● Operates out of 7 – 10 pits of 60 – 80 feet thick coal seams, providing access to lowest‐sulfur coal in North America ● Advanced technology reduces costs, drives higher margins North Antelope Rochelle Mine 33
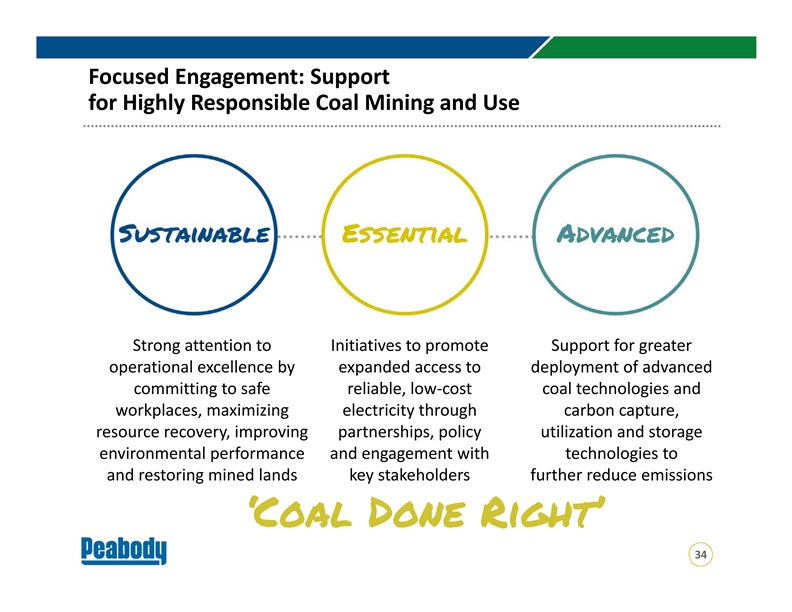
Focused Engagement: Support for Highly Responsible Coal Mining and Use Strong attention to Initiatives to promote Support for greater operational excellence by expanded access to deployment of advanced committing to safe reliable, low‐cost coal technologies and workplaces, maximizing electricity through carbon capture, resource recovery, improving partnerships, policy utilization and storage environmental performance and engagement with technologies to and restoring mined lands key stakeholders further reduce emissions ‘Coal Done Right’ 34Focused Engagement: Support for Highly Responsible Coal Mining and Use Strong attention to Initiatives to promote Support for greater operational excellence by expanded access to deployment of advanced committing to safe reliable, low‐cost coal technologies and workplaces, maximizing electricity through carbon capture, resource recovery, improving partnerships, policy utilization and storage environmental performance and engagement with technologies to and restoring mined lands key stakeholders further reduce emissions ‘Coal Done Right’ 34
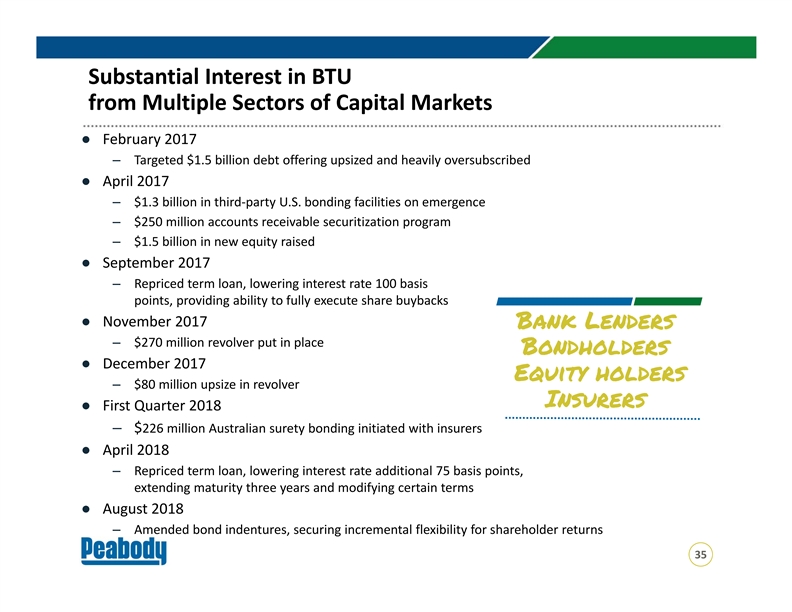
Substantial Interest in BTU from Multiple Sectors of Capital Markets ● February 2017 – Targeted $1.5 billion debt offering upsized and heavily oversubscribed ● April 2017 – $1.3 billion in third‐party U.S. bonding facilities on emergence – $250 million accounts receivable securitization program – $1.5 billion in new equity raised ● September 2017 – Repriced term loan, lowering interest rate 100 basis points, providing ability to fully execute share buybacks ● November 2017 Bank Lenders – $270 million revolver put in place Bondholders ● December 2017 Equity holders – $80 million upsize in revolver Insurers ● First Quarter 2018 – $226 million Australian surety bonding initiated with insurers ● April 2018 – Repriced term loan, lowering interest rate additional 75 basis points, extending maturity three years and modifying certain terms ● August 2018 – Amended bond indentures, securing incremental flexibility for shareholder returns 35Substantial Interest in BTU from Multiple Sectors of Capital Markets ● February 2017 – Targeted $1.5 billion debt offering upsized and heavily oversubscribed ● April 2017 – $1.3 billion in third‐party U.S. bonding facilities on emergence – $250 million accounts receivable securitization program – $1.5 billion in new equity raised ● September 2017 – Repriced term loan, lowering interest rate 100 basis points, providing ability to fully execute share buybacks ● November 2017 Bank Lenders – $270 million revolver put in place Bondholders ● December 2017 Equity holders – $80 million upsize in revolver Insurers ● First Quarter 2018 – $226 million Australian surety bonding initiated with insurers ● April 2018 – Repriced term loan, lowering interest rate additional 75 basis points, extending maturity three years and modifying certain terms ● August 2018 – Amended bond indentures, securing incremental flexibility for shareholder returns 35
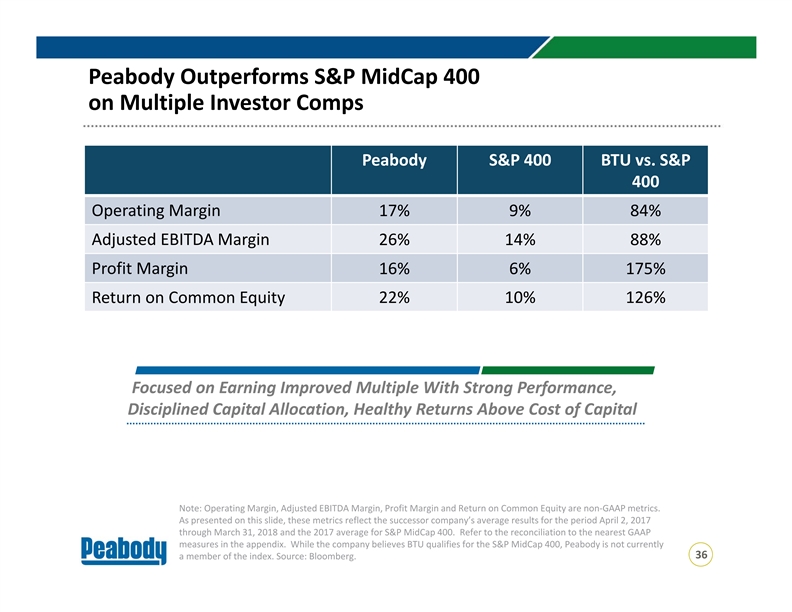
Peabody Outperforms S&P MidCap 400 on Multiple Investor Comps Peabody S&P 400 BTU vs. S&P 400 Operating Margin 17% 9% 84% Adjusted EBITDA Margin 26% 14% 88% Profit Margin 16% 6% 175% Return on Common Equity 22% 10% 126% Focused on Earning Improved Multiple With Strong Performance, Disciplined Capital Allocation, Healthy Returns Above Cost of Capital Note: Operating Margin, Adjusted EBITDA Margin, Profit Margin and Return on Common Equity are non‐GAAP metrics. As presented on this slide, these metrics reflect the successor company’s average results for the period April 2, 2017 through March 31, 2018 and the 2017 average for S&P MidCap 400. Refer to the reconciliation to the nearest GAAP measures in the appendix. While the company believes BTU qualifies for the S&P MidCap 400, Peabody is not currently 36 a member of the index. Source: Bloomberg. Peabody Outperforms S&P MidCap 400 on Multiple Investor Comps Peabody S&P 400 BTU vs. S&P 400 Operating Margin 17% 9% 84% Adjusted EBITDA Margin 26% 14% 88% Profit Margin 16% 6% 175% Return on Common Equity 22% 10% 126% Focused on Earning Improved Multiple With Strong Performance, Disciplined Capital Allocation, Healthy Returns Above Cost of Capital Note: Operating Margin, Adjusted EBITDA Margin, Profit Margin and Return on Common Equity are non‐GAAP metrics. As presented on this slide, these metrics reflect the successor company’s average results for the period April 2, 2017 through March 31, 2018 and the 2017 average for S&P MidCap 400. Refer to the reconciliation to the nearest GAAP measures in the appendix. While the company believes BTU qualifies for the S&P MidCap 400, Peabody is not currently 36 a member of the index. Source: Bloomberg.