Attached files
| file | filename |
|---|---|
| 8-K - 8-K SEAPORT GLOBAL CONFERENCE - Infrastructure & Energy Alternatives, Inc. | a8-kseaportglobalconference.htm |

SEAPORT GLOBAL ENERGY & INDUSTRIALS CONFERENCE AUGUST 28, 2018

DISCLAIMER This presentation includes “forward looking statements” (within the meaning of the “safe harbor” provisions of the United States Private Securities Litigation Reform Act of 1995), including but not limited to those regarding the proposed acquisitions by Infrastructure and Energy Alternatives, Inc. (the “Company” or “IEA”) of Consolidated Construction Solutions I LLC and Subsidiaries dba Saiia Construction (“Saiia”) and The ACC Companies (together “ACC”) (the “Acquisition”). Forward‐looking statements may be identified by the use of words such as “forecast,” “intend,” “seek,” “target,” “anticipate,” “believe,” “expect,” “estimate,” “plan,” “outlook,”and“project”andothersimilar expressions that predict or indicate future events or trends or that are not statements of historical matters. Such forward looking statements with respect to projections, revenues, earnings,performance,strategies,prospects and other aspects of the businesses of the Company are based on current expectations that are subject to risks and uncertainties. A number of factors could cause actual results or outcomes to differ materially from those indicated by such forward looking statements. These factors include, but are not limited to: (1) the ability of the parties to consummate the Acquisition in a timely manner or at all; (2) satisfaction of the conditions precedent to consummation of the Acquisition, including the ability to secure required consents and regulatory approvals in a timely manner or at all; (3) the reduction in value of production tax credits and investment tax credits due to the enactment of the Tax Cuts and Jobs Act in December 2017; (4) the adverse effect on our business and financial condition if we fail to comply with the regulations of The Occupational Safety and Health Act of 1970, as amended, and other state and local agencies that oversee transportation and safety compliance; (5) substantial liabilities that could result from physical hazards; (6) the inability to operate efficiently if we are unable to attract and retain qualified managers and skilled employees; (7) an inability to realize financial and strategic goals from acquisition and investment activity; (8) significant changes in tax and other economic incentives and political and governmental policies which could materially and adversely affect the U.S. wind and solar industries; and (9) other risks and uncertainties indicated in the Company’sSecuritiesandExchangeCommission (the “SEC”) filings. You are cautioned not to place undue reliance upon any forward‐looking statements, which speak only as of the date made. The Company does not undertake to update or revise the forward‐looking statements, whether as a result of new information, future events or otherwise, except as required by law. This presentation includes information based on independent industry publications and other sources. You should not construe the contents of this presentation as legal, accounting, business or tax advice, and you should consult your own professional advisors as to the legal, accounting, business, tax, financial or other matters contained herein. The estimates, forecasts and projections contained herein involve significant elements of subjective judgment and analysis and reflect numerous judgments, estimates and assumptions that are inherently uncertain in prospective financial information of any kind. As such, no representation can be made as to the attainability of such estimates, forecasts and projections. Investors are cautioned that such estimates, forecasts or projections have not been audited and have not been prepared in conformance with GAAP. For a listing of risks and other factors that could impact the combined company’s ability to attain its projected results, please refer to the “forward‐looking statements” above and the “Risk Factors” section of the Proxy Statement. This presentation includes projections that are forward‐looking and based on growth assumptions that are inherently subject to significant uncertainties and contingencies, many of which are beyond IEA’s control. While all projections are necessarily speculative, IEA believes that projections relating to periods beyond 12 months from their date of preparation carry increasingly higher levels of uncertainty and should be read in that context. There will be differences between actual and projected results, and actual results may be materially different than those contained in the projections. This presentation includes non‐GAAP financial measures. Definitions of these non‐GAAP financial measures and reconciliations of these non‐GAAP financial measures to the most directly comparable GAAP financial measures are included on page 19 of this presentation. IEA believes that these non‐GAAP financial measures provide useful information to management and investors regarding certain financial and business trends relating to IEA’s financial condition and results of operations. These non‐GAAP financial measures may exclude items that are significant in understanding and assessing financial results. Therefore, these financial measures should not be considered in isolation or as an alternative to net income or other measures of profitability or performance under GAAP. As thesearenon‐GAAPmeasures,weurgeyoutoreviewIEA’sauditedfinancialstatements, which have been filed with the SEC. 2

IEA COMPANY OVERVIEW • IEA is a leading infrastructure construction company with specialized energy and heavy civil expertise Renewable Civil & Power & • Tier 1 provider of U.S. wind energy construction; estimated 30% market share Energy Infrastructure Industrial ‐ 200+ utility‐scale wind and solar projects completed ‐ 7,350+ wind turbines erected representing >14 Gigawatts of generation capacity • Growing presence in utility‐scale solar ‐ >700 Megawatts of solar power installed IEA’s national talent pool is capable of performing a wide range of heavy • 70+ years of experience in civil, petrochemical, and industrial power civil construction and engineering services across end markets. • #1 estimated market share U.S. wind energy construction(1) Select Services & Capabilities Revenue Breakdown (2) Key Customers Solar Civil/Other 6% Project & Site Excavation / Site Bridges, Roadways, 6% Development Preparation Tunnels, & Shafts Wind 88% Turbine Assembly Structural Steel Underground & Erection Erection Cabling 30% 14GW 700MW 12 of the 16 97% Wind Energy of Wind Power of Solar Power Largest Wind Energy of All Major Projects Market Share(1) Installed Installed Developers Served Completed with a Positive Margin(3) (1) IEA management estimate for FY2017, based upon industry and customer data available to IEA management. (2) Represents IEA management estimate for 2018E. (3) Performance for all projects that had revenue for the period FY2012 – May 2017. 3

INVESTMENT HIGHLIGHTS 1 Highly Specialized EPC Platform with Diversified Service Offerings 2 Established Base of Diversified Blue‐Chip, Investment‐Grade Customers and OEMs 3 Coverage Area and Specialized Capabilities Provide Significant Barriers to Entry 4 Industry Tailwinds with Diverse and Growing End Markets 5 Proven Management Team with Extensive Industry Knowledge and #1 Safety Record 6 Strong Free Cash Flow that Supports Investment in Organic Growth and M&A 7 High Revenue Visibility with a Strong Backlog totaling $1 Billion as of June 30, 2018 4

MULTIPLE LEVERS TO DRIVE GROWTH Multiple Growth Opportunities for IEA Beyond Executing ~$1.0B in Backlog Organic Growth External Growth Opportunities to grow presence across attractive markets Robust platform for M&A growth with long‐term growth potential Mergers & Grow Foothold in Acquisitions Civil, Industrial, & Power Build Solar Expand Self‐Perform Presence Capabilities • Active pursuit of highly strategic and • Leverage 70+ years of experience across actionable targets petrochemical, pharmaceutical, and other heavy industrial facilities • Potential to increase project diversification through work with • Large addressable market with secular • Positive tailwinds exist for • Increase medium and high voltage conventional power, downstream oil and (2) traditional U.S. civil and industrial electrical self‐perform capabilities growth drivers through at least 2050 gas‐related, and other industrial markets • Cross‐selling opportunity with customers • Potential for 300+ bps Adjusted EBITDA margin increase(1) over the existing wind customer base • Accelerate share of currently • The Fast Act and IDOT and INDOT medium‐ term • Ability to capture incremental share of outsourced high voltage scope, including budgets provide for billions of dollars the expanding utility‐scale solar T‐line interconnect • Initial self‐perform projects have of funding for civil / infrastructure construction market commenced in 2018 projects • Solar PV installed capacity • $10 million incremental EBITDA • IEA maintains a distinctive resume and expected to grow at ~10% CAGR projected for 2019(1) excellent reputation across these diverse from 2017 – 2020(2) markets (1) IEA management estimates, based upon industry and customer data available to IEA management. Adjusted EBITDA Margin is defined as Adjusted EBITDA divided by Revenue. (2) Source: U.S. EnergyInformation Administration(January2018). 5

STRONG M&A PIPELINE IN PLACE TO ACCELERATE GROWTH M&A FOCUS SECTORS • Active list comprised of numerous highly strategic and actionable targets • Landscape of small tuck‐in acquisitions and larger “merger” opportunities Utility‐Scale Solar Development • Limited, scaled competitors capable of making acquisitions & Storage • Well‐regarded culturally and broadly viewed as an acquirer of choice Electrical Self‐Perform • Capital structure flexibility and growing free cash flow provide ample firepower to pursue acquisition candidates Industrial • Operational platform in place to support and successfully integrate opportunities / Mechanical ILLUSTRATIVE ACQUISITION PIPELINE(1) Industry Focus Electrical Self‐ Industrial / Estimated Existing IEA Target High Voltage Solar Geography Perform Mechanical Revenue ($M) Relationship A East $125 B East $250 C National $125 D East / West $100 E East $200 F Midwest $80 G Midwest $300 (1) Select opportunities from a list of 30+ tracked targets. There can be no assurance that any future acquisitions will be completed, or if they are completed, that the combined company will realize the expected benefits from such future acquisitions. 6
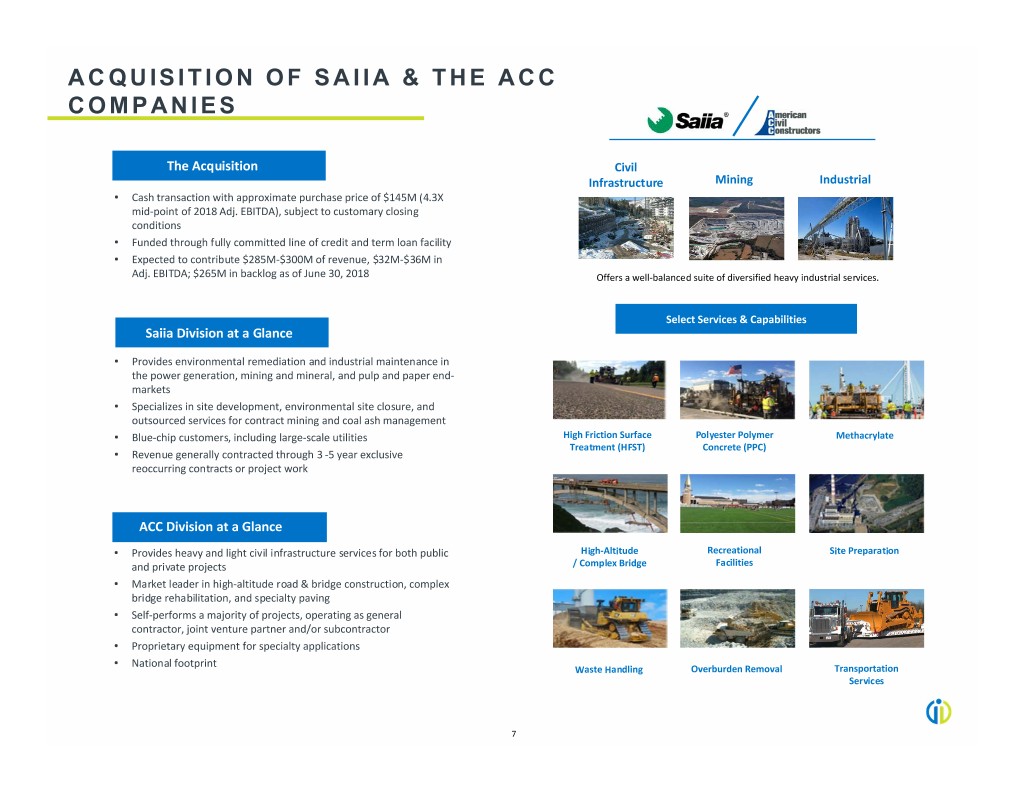
ACQUISITION OF SAIIA & THE ACC COMPANIES The Acquisition Civil Infrastructure Mining Industrial • Cash transaction with approximate purchase price of $145M (4.3X mid‐point of 2018 Adj. EBITDA), subject to customary closing conditions • Funded through fully committed line of credit and term loan facility • Expected to contribute $285M‐$300M of revenue, $32M‐$36M in Adj. EBITDA; $265M in backlog as of June 30, 2018 Offers a well‐balanced suite of diversified heavy industrial services. Select Services & Capabilities Saiia Division at a Glance • Provides environmental remediation and industrial maintenance in the power generation, mining and mineral, and pulp and paper end‐ markets • Specializes in site development, environmental site closure, and outsourced services for contract mining and coal ash management • Blue‐chip customers, including large‐scale utilities High Friction Surface Polyester Polymer Methacrylate Treatment (HFST) Concrete (PPC) • Revenue generally contracted through 3 ‐5 year exclusive reoccurring contracts or project work ACC Division at a Glance • Provides heavy and light civil infrastructure services for both public High‐Altitude Recreational Site Preparation and private projects / Complex Bridge Facilities • Market leader in high‐altitude road & bridge construction, complex bridge rehabilitation, and specialty paving • Self‐performs a majority of projects, operating as general contractor, joint venture partner and/or subcontractor • Proprietary equipment for specialty applications • National footprint Waste Handling Overburden Removal Transportation Services 7
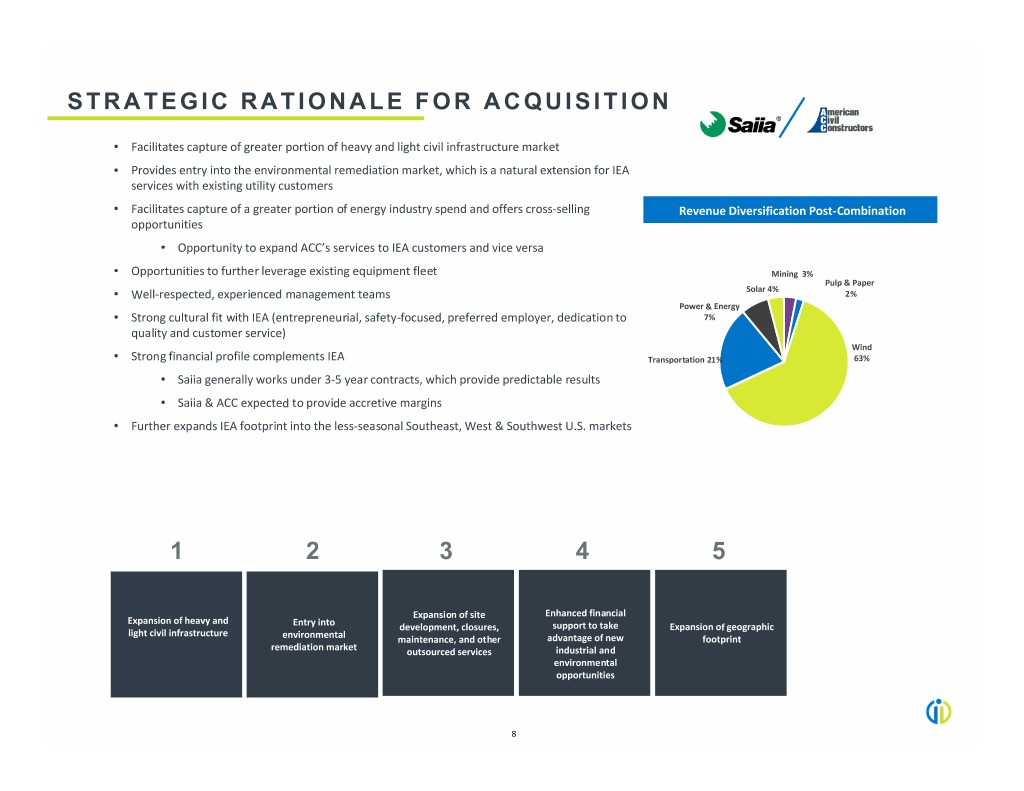
STRATEGIC RATIONALE FOR ACQUISITION • Facilitates capture of greater portion of heavy and light civil infrastructure market • Provides entry into the environmental remediation market, which is a natural extension for IEA services with existing utility customers • Facilitates capture of a greater portion of energy industry spend and offers cross‐selling Revenue Diversification Post‐Combination opportunities • Opportunity to expand ACC’s services to IEA customers and vice versa • Opportunities to further leverage existing equipment fleet Mining 3% Pulp & Paper Solar 4% • Well‐respected, experienced management teams 2% Power & Energy • Strong cultural fit with IEA (entrepreneurial, safety‐focused, preferred employer, dedication to 7% quality and customer service) Wind • Strong financial profile complements IEA Transportation 21% 63% • Saiia generally works under 3‐5 year contracts, which provide predictable results • Saiia & ACC expected to provide accretive margins • Further expands IEA footprint into the less‐seasonal Southeast, West & Southwest U.S. markets 1 2 3 4 5 Expansion of site Enhanced financial Expansion of heavy and Entry into development, closures, support to take Expansion of geographic light civil infrastructure environmental maintenance, and other advantage of new footprint remediation market outsourced services industrial and environmental opportunities 8

EXPANSIVE NATIONAL COVERAGE • IEA’s “double‐breasted” (union & non‐ union) workforce enables the company to work anywhere in the U.S. • Scalable workforce with 2,000+ peak employees • Strategic locations for headquarters and equipment distribution to all projects across the U.S. • National Wind Agreement in place that essentially serves as a Project Labor Agreement for wind turbine construction projects nationwide IEA/Saiia/The ACC Companies Headquarters Existing IEA combined with Saiia and The ACC Companies IEA Only Footprint – States that do not overlap with Saiia and The ACC Companies Saiia and The ACC Companies – States now covered with combined footprint 9

ESTABLISHED BASE OF DIVERSIFIED, BLUE-CHIP CUSTOMERS Existing Relationships Additional Long‐Term, Blue‐Chip Customer Relationships Tier 1 Renewable Energy Developers Tier 1 Utility & Industrial Major State & Municipal Tenure Tenure Tenure 11 years 38 years 15 years 9 years 42 years 8 years 18 years 31 years 4 years 18 years 38 years 12 years 15 years 8 years 4 years 20 years 3 years 15 years 2 years 6 years 20 years 38 years 10 years 9 years 9 years 2 years 18 years 5 years 15 years 38 years 11 years Completed wind projects with 12 of the top 16 Saiia provides their services to over 40 ACC provides their services to over 90 U.S. developers / owners different customers across the Southeastern different customers across the U.S. U.S. A majority of IEA customers also build utility‐scale solar projects and are in active discussions with IEA for solar projects The IEA platform has a highly diverse customer base including long‐standing relationships with states, municipalities, and private blue‐chip customers creating a stable, recurring revenue base. 10

RENEWABLE ENERGY MARKET OVERVIEW • Renewable energy is reshaping the power industry with wind • According to the EIA, the demand for incremental wind power and solar installed capacity projected to grow substantially as capacity will double by 2023 and that demand for utility‐scale projects are fast tracked to take advantage of the Production solar capacity will grow by nearly 400% over the next 15 Tax Credit (the “PTC”) and the Investment Tax Credit (the "ITC") years(1) Factors Driving Increased Demand in Renewable Energy in the U.S. Increased demand for renewable energy from Broad upgrades to existing transmission infrastructure Increased proliferation of smart grid technology and ✔ corporations and consumers ✔ ✔ improved equipment maintenance and reliability U.S. Annual Power Capacity Additions(2) Wind Installed Capacity(3) Solar PV Installed Capacity(4) 40,000 150.0 80.0 35,000 125.0 30,698 115.7 58.0 30,000 103.4 60.0 26,716 53.1 100.0 93.2 49.0 25,000 83.2 44.1 20,699 20,965 20,000 75.0 40.0 16,532 15,000 50.0 U.S. Installed Capacity (GW) U.S. Installed Capacity (GW) 20.0 Power Capacity Additions (MW) 10,000 25.0 5,000 0.0 0 0.0 2017 2018 2019 2020 2013 2014 2015 2016 2017 2017 2018 2019 2020 Wind Solar Natural Gas Other Wind Capacity Solar Capacity (1) Source: American Wind Energy Association (AWEA) 2017 Year End Report. (2) Source: Energy Infrastructure Administration Annual Energy Outlook 2017. (3) Source: MAKE Consulting (May 2017). (4) Source: U.S. Energy Information Administration (January 2017). 11

LEADER IN RENEWABLE ENERGY EPC INDUSTRY Market Overview Self‐Perform is Critical • IEA is one of only three Tier I providers for wind construction and is • Construction is ~20%‐25% of total cost, but is largest risk to the entire project shortlisted on major targeted projects — Owners demand self‐performing services and experienced contractors • IEA believes reliability is more important to customers than price • Self‐perform capabilities allow IEA to retain margin, while better controlling • Owners and project financiers limit acceptable EPCs safety and scheduling of projects • Consolidated market share with few EPCs of scale — Turbine erection — Significant competitive barriers limit new market entrants — Service road design and installation • Labor constrained market — Concrete and foundation — IEA employs 14 project crews; estimates only 50 qualified crews in — Electrical (high voltage being implemented) the U.S.(1) — Mechanical Tier I Engineering Self‐Perform Solar 2017 Wind Competitor Double‐Breasted(2) Provider Management Electrical Capabilities Installation(4) (3) 1,617 MW 1,500 MW 600 MW 1,100 MW Competitive EPC Landscape 500 MW (1) Source: IEA management estimate. (2) “Double‐breasted” workforce is defined as capability to offer union and non‐union labor forces. (3) Executing strategy to self‐perform high‐voltage electrical work. (4) Source: IEA management estimates and MAKE Consulting (May 2017). 12
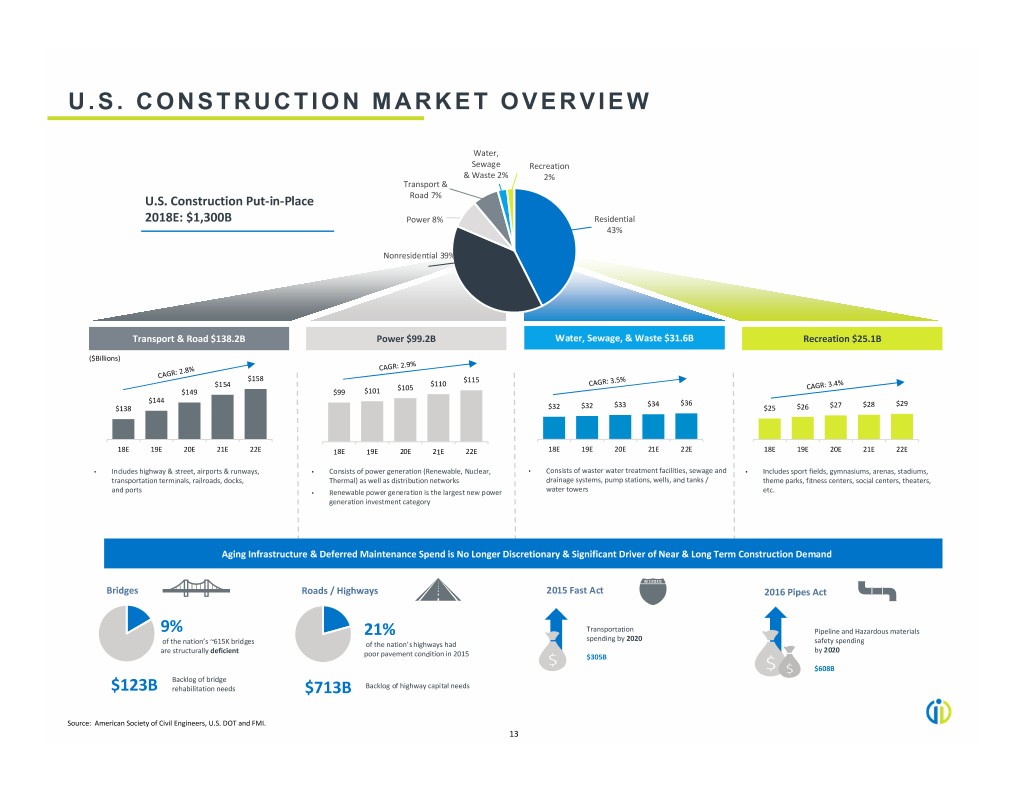
U.S. CONSTRUCTION MARKET OVERVIEW Water, Sewage Recreation & Waste 2% 2% Transport & U.S. Construction Put‐in‐Place Road 7% 2018E: $1,300B Power 8% Residential 43% Nonresidential 39% Transport & Road $138.2B Power $99.2B Water, Sewage, & Waste $31.6B Recreation $25.1B ($Billions) $158 $115 $110 $154 $105 $149 $99 $101 $144 $33 $34 $36 $28 $29 $138 $32 $32 $25 $26 $27 18E 19E 20E 21E 22E 18E 19E 20E 21E 22E 18E 19E 20E 21E 22E 18E 19E 20E 21E 22E • Includes highway & street, airports & runways, • Consists of power generation (Renewable, Nuclear, • Consists of waster water treatment facilities, sewage and • Includes sport fields, gymnasiums, arenas, stadiums, transportation terminals, railroads, docks, Thermal) as well as distribution networks drainage systems, pump stations, wells, and tanks / theme parks, fitness centers, social centers, theaters, water towers and ports • Renewable power generation is the largest new power etc. generation investment category Aging Infrastructure & Deferred Maintenance Spend is No Longer Discretionary & Significant Driver of Near & Long Term Construction Demand Bridges Roads / Highways 2015 Fast Act 2016 Pipes Act 9% Transportation Pipeline and Hazardous materials 21% spending by 2020 of the nation’s ~615K bridges of the nation’s highways had safety spending are structurally deficient by 2020 poor pavement condition in 2015 $305B $608B Backlog of bridge $123B rehabilitation needs $713B Backlog of highway capital needs Source: American Society of Civil Engineers, U.S. DOT and FMI. 13

2018 FINANCIAL GUIDANCE(1) IEA Guidance with IEA Combined with IEA Guidance without Saiia and Saiia and The ACC Full Year Saiia and The The ACC Companies Companies(3) ACC Companies Revenues $685M to $730M $740M to $795M $970M to $1,030M Adjusted EBITDA(2) $64M to $70M $69M to $77M $96M to $106M Adjusted Free Cash Flow(2) $40M to $45M ‐‐ ‐‐ The 2018 financial guidance represents: • Organic revenue growth in the range of 51% to 61%, compared to 2017 • Organic adjusted EBITDA growth of 22% to 33%, compared to 2017 (1) As of August 9, 2018. (2) See slide 15 for definition of adjusted free cash flow and slide 19 for definition of adjusted EBITDA. (3) Assumes acquisition of Saiia and The ACC Companies closes late Q3 2018. 14

FINANCIAL PERFORMANCE CONTINUES TO GAIN MOMENTUM 2018 Combined Full Year Revenue(1) Financial Summary ($ in millions) $1,200 • Total new wind construction declined from 8.7 GW in 2016 to $1,000 $1,000 $879 7.3 GW in 2017 $735 $800 • Build‐up in 2016 due to PTC extension uncertainty; slow‐down in 2017 due $600 to uncertainty over the 2017 Tax Act $400 $603 $708 $200 $454 • Projected 8.4 GW of new wind capacity in 2018E and to continue to grow to $0 11.0 GW in 2019E and 13.0 GW in 2020E(2) '16 '17 18E • Current visibility is the strongest in Company’s history 2018 Combined Full Year Adjusted EBITDA(3) • As of June 30, 2018 IEA had a current backlog of $428 million, or backlog $120 expected to convert to revenue this year, for the remainder of 2018, or 86% of $101 the remaining forecasted revenue for the year $100 $90 $82 $80 $60 $40 $64 $67 $53 $20 $0 BACKLOG BRIDGE(4) ($ in millions) 2016 2017 2018E Adjusted Free Cash Flow (5) $1,400 $84 $1,226 $561 $1,200 $60 100% $50 80% $1,000 $40 $52 $44 60% $800 $449 $30 $43 40% $581 $961 $20 $600 $10 20% $400 $0 0% 2016 2017 2018E $200 $428 $0 2018 2019 2020 Total (1) Included in 2018 is the projected midpoint of Saiia/The ACC Companies revenue of $292.5M ($285M to $300M range) in addition to IEA’s current midpoint guidance of $707.5M. (2) Source: American Wind Energy Association (Jan. 2018). (3) Included in 2018 is the projected midpoint of Saiia/The ACC Companies Adjusted EBITDA of $34M ($32M to $36M range) combined with IEA’s current midpoint guidance of $67M. (4) Blue bars represent IEA’s current backlog/revenue and green bars represent additional pro forma backlog/revenue from Saiia/The ACC Companies acquisition as of June 2018. (5) Adjusted free cash flow is defined as adjusted EBITDA less taxes, interest, capital expenditures and capital lease payments. 15

APPENDIX

SPAC TRANSACTION OVERVIEW On March 26, 2018 (“Closing Date”) the Company completed its merger with M III Acquisition Corp. The Company entered into a new credit facility which provides for aggregate revolving borrowings of up to $50 million and a $50 million (plus, subject to certain conditions, an additional $25 million accordion capacity) delayed‐draw term loan facility, each maturing in March 2021. Equity Highlights Post‐Transaction Ownership • 21.6 million shares outstanding at Closing Date At Close Fully Distributed(1) • Up to 9.0 million shares of common stock issuable as earn‐out based upon 2018 EBITDA target and or/2019 EBITDA target • 3.4 million shares of preferred stock convertible into common stock after 32.7% third anniversary of the Closing Date 48.3% 51.7% 67.3% • Approximately 16.9 million warrants outstanding, exercisable for approximately 8.4 million shares of common stock at a price of $11.50 Stockholders prior to business combination Oaktree and Management (1) Assumes common shares outstanding, plus the 9.0 million of earnout shares and the conversion of preferred stock, with assumed conversion of $10 per common share for 3.4 million shares of common stock. Warrants were excluded as they are not currently in the money. 17
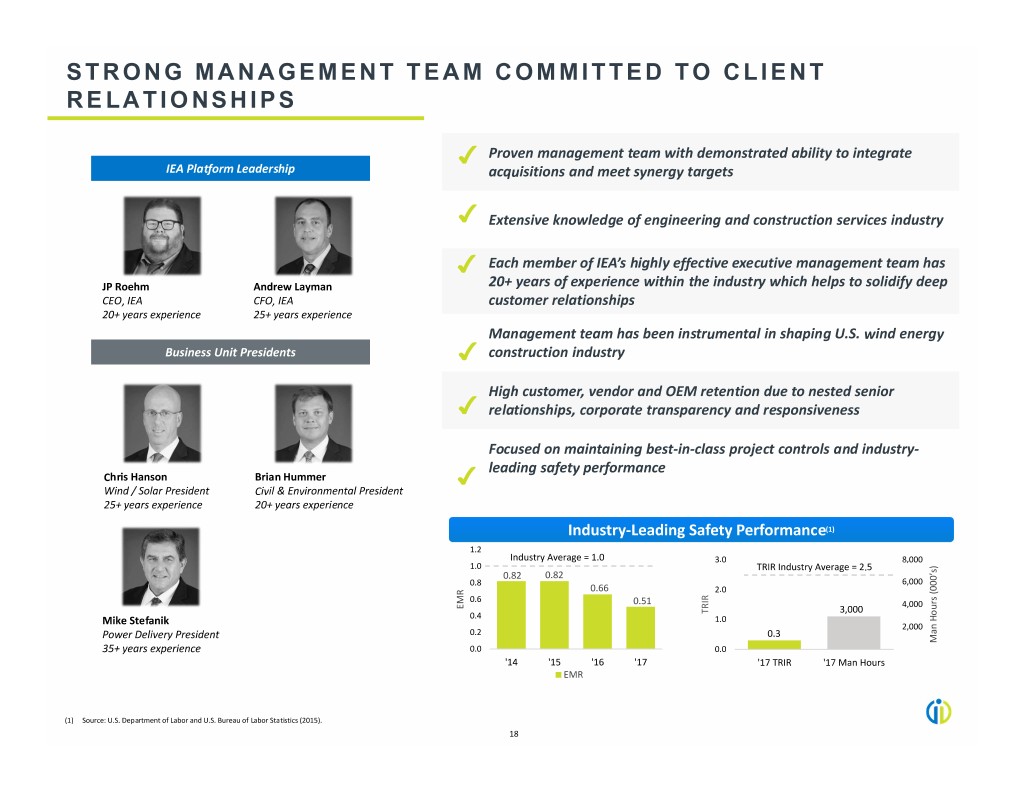
STRONG MANAGEMENT TEAM COMMITTED TO CLIENT RELATIONSHIPS ✔ Proven management team with demonstrated ability to integrate IEA Platform Leadership acquisitions and meet synergy targets ✔ Extensive knowledge of engineering and construction services industry ✔ Each member of IEA’s highly effective executive management team has JP Roehm Andrew Layman 20+ years of experience within the industry which helps to solidify deep CEO, IEA CFO, IEA customer relationships 20+ years experience 25+ years experience Management team has been instrumental in shaping U.S. wind energy Business Unit Presidents ✔ construction industry High customer, vendor and OEM retention due to nested senior ✔ relationships, corporate transparency and responsiveness Focused on maintaining best‐in‐class project controls and industry‐ leading safety performance Chris Hanson Brian Hummer ✔ Wind / Solar President Civil & Environmental President 25+ years experience 20+ years experience Industry‐Leading Safety Performance(1) 1.2 Industry Average = 1.0 3.0 8,000 1.0 TRIR Industry Average = 2.5 0.82 0.82 0.8 6,000 0.66 2.0 0.6 0.51 EMR 4,000 TRIR 3,000 Mike Stefanik 0.4 1.0 2,000 Power Delivery President 0.2 0.3 Man Hours (000’s) 35+ years experience 0.0 0.0 '14 '15 '16 '17 '17 TRIR '17 Man Hours EMR (1) Source: U.S. Department of Labor and U.S. Bureau of Labor Statistics (2015). 18
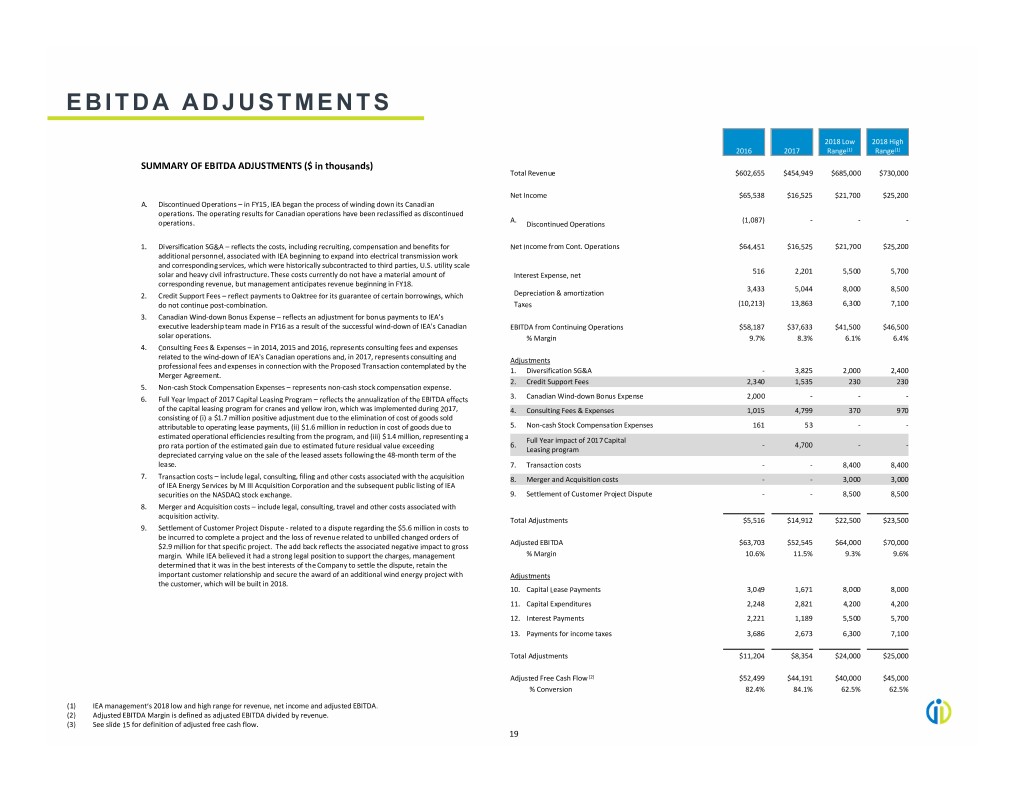
EBITDA ADJUSTMENTS 2018 Low 2018 High 2016 2017 Range(1) Range(1) SUMMARY OF EBITDA ADJUSTMENTS ($ in thousands) Total Revenue $602,655 $454,949 $685,000 $730,000 Net Income $65,538 $16,525 $21,700 $25,200 A. Discontinued Operations – in FY15, IEA began the process of winding down its Canadian operations. The operating results for Canadian operations have been reclassified as discontinued A. (1,087) ‐ ‐ ‐ operations. Discontinued Operations 1. Diversification SG&A – reflects the costs, including recruiting, compensation and benefits for Net Income from Cont. Operations $64,451 $16,525 $21,700 $25,200 additional personnel, associated with IEA beginning to expand into electrical transmission work and corresponding services, which were historically subcontracted to third parties, U.S. utility scale 516 2,201 5,500 5,700 solar and heavy civil infrastructure. These costs currently do not have a material amount of Interest Expense, net corresponding revenue, but management anticipates revenue beginning in FY18. 3,433 5,044 8,000 8,500 2. Credit Support Fees – reflect payments to Oaktree for its guarantee of certain borrowings, which Depreciation & amortization do not continue post‐combination. Taxes (10,213) 13,863 6,300 7,100 3. Canadian Wind‐down Bonus Expense – reflects an adjustment for bonus payments to IEA’s executive leadership team made in FY16 as a result of the successful wind‐down of IEA's Canadian EBITDA from Continuing Operations $58,187 $37,633 $41,500 $46,500 solar operations. % Margin 9.7% 8.3% 6.1% 6.4% 4. Consulting Fees & Expenses – in 2014, 2015 and 2016, represents consulting fees and expenses related to the wind‐down of IEA's Canadian operations and, in 2017, represents consulting and Adjustments professional fees and expenses in connection with the Proposed Transaction contemplated by the 1. Diversification SG&A ‐ 3,825 2,000 2,400 Merger Agreement. 2. Credit Support Fees 2,340 1,535 230 230 5. Non‐cash Stock Compensation Expenses – represents non‐cash stock compensation expense. 6. Full Year Impact of 2017 Capital Leasing Program – reflects the annualization of the EBITDA effects 3. Canadian Wind‐down Bonus Expense 2,000 ‐ ‐ ‐ of the capital leasing program for cranes and yellow iron, which was implemented during 2017, 4. Consulting Fees & Expenses 1,015 4,799 370 970 consisting of (i) a $1.7 million positive adjustment due to the elimination of cost of goods sold attributable to operating lease payments, (ii) $1.6 million in reduction in cost of goods due to 5. Non‐cash Stock Compensation Expenses 161 53 ‐ ‐ estimated operational efficiencies resulting from the program, and (iii) $1.4 million, representing a Full Year impact of 2017 Capital 6. ‐ 4,700 ‐ ‐ pro rata portion of the estimated gain due to estimated future residual value exceeding Leasing program depreciated carrying value on the sale of the leased assets following the 48‐month term of the lease. 7. Transaction costs ‐ ‐ 8,400 8,400 7. Transaction costs – include legal, consulting, filing and other costs associated with the acquisition 8. Merger and Acquisition costs ‐ ‐ 3,000 3,000 of IEA Energy Services by M III Acquisition Corporation and the subsequent public listing of IEA securities on the NASDAQ stock exchange. 9. Settlement of Customer Project Dispute ‐ ‐ 8,500 8,500 8. Merger and Acquisition costs – include legal, consulting, travel and other costs associated with acquisition activity. Total Adjustments $5,516 $14,912 $22,500 $23,500 9. Settlement of Customer Project Dispute ‐ related to a dispute regarding the $5.6 million in costs to be incurred to complete a project and the loss of revenue related to unbilled changed orders of Adjusted EBITDA $63,703 $52,545 $64,000 $70,000 $2.9 million for that specific project. The add back reflects the associated negative impact to gross margin. While IEA believed it had a strong legal position to support the charges, management % Margin 10.6% 11.5% 9.3% 9.6% determined that it was in the best interests of the Company to settle the dispute, retain the important customer relationship and secure the award of an additional wind energy project with Adjustments the customer, which will be built in 2018. 10. Capital Lease Payments 3,049 1,671 8,000 8,000 11. Capital Expenditures 2,248 2,821 4,200 4,200 12. Interest Payments 2,221 1,189 5,500 5,700 13. Payments for income taxes 3,686 2,673 6,300 7,100 Total Adjustments $11,204 $8,354 $24,000 $25,000 Adjusted Free Cash Flow (2) $52,499 $44,191 $40,000 $45,000 % Conversion 82.4% 84.1% 62.5% 62.5% (1) IEA management’s 2018 low and high range for revenue, net income and adjusted EBITDA. (2) Adjusted EBITDA Margin is defined as adjusted EBITDA divided by revenue. (3) See slide 15 for definition of adjusted free cash flow. 19

THANK YOU Investor Relations Contact: Financial Profiles Kimberly Esterkin, Senior Vice President kesterkin@finprofiles.com 310.622.8235
