Attached files
| file | filename |
|---|---|
| 8-K - 8-K - LAKELAND BANCORP INC | d613691d8k.htm |
| EX-99.2 - EX-99.2 - LAKELAND BANCORP INC | d613691dex992.htm |
| EX-2.1 - EX-2.1 - LAKELAND BANCORP INC | d613691dex21.htm |
Exhibit 99.1

|
| Acquisition of Highlands Bancorp, Inc. (OTC Pink: HSBK) August 23, 2018 |
|
| safe Harbor Statement This communication contains forward-looking statements with respect to the proposed mergers and the timing of consummation of the mergers that are made in reliance upon the safe harbor provisions of the Private Securities Litigation Reform Act of 1995. The words “anticipates”, “projects”, “intends”, “estimates”, “expects”, “believes”, “plans”, “may”, “will”, “should”, “could” and other similar expressions are intended to identify such forward looking statements. Statements regarding (i) the anticipated effect of the transaction on earnings per share, including earnings per incremental share issued, and book value per share, including tangible book value dilution and the earn-back period, (ii) other pro forma effects of the transaction, including statements regarding potential cost savings, (iii) the growth opportunities applicable to the combined institution and (iv) the timing of the closing and execution risks associated with the transaction are also forward looking statements. These forward-looking statements are necessarily speculative and speak only as of the date made, and are subject to numerous assumptions, risks and uncertainties, all of which may change over time. Actual results could differ materially from such forward-looking statements. The following factors, among others, could cause actual results to differ materially and adversely from such forward-looking statements: failure to obtain Highlands Bancorp, Inc. shareholder approval of the merger of Highlands Bancorp, Inc. into Lakeland Bancorp, Inc.; failure to receive regulatory approval of the holding company merger or the merger of Highlands State Bank into Lakeland Bank; failure to realize anticipated efficiencies and synergies if the mergers are consummated; material adverse changes in Lakeland Bancorp, Inc.’s or Highlands Bancorp, Inc.’s operations or earnings; decline in the economy in Lakeland Bancorp, Inc.’s and Highlands Bancorp, Inc.’s primary market areas; as well as the risk factors set forth in the periodic reports filed by Lakeland Bancorp, Inc. with the Securities and Exchange Commission. Neither Lakeland Bancorp, Inc. nor Highlands Bancorp, Inc. assumes any obligation for updating any such forward-looking statements at any time. 2 |
|
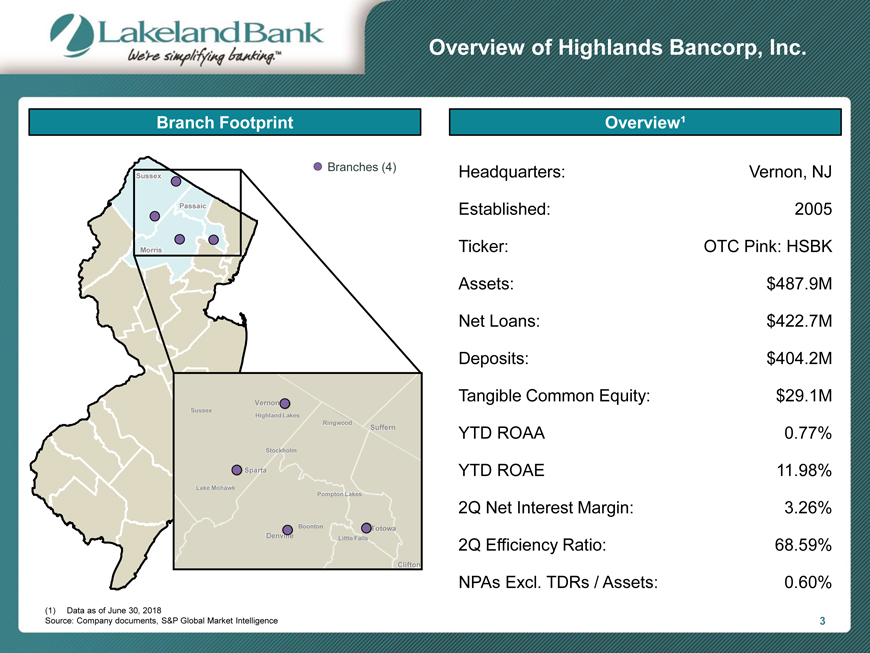
| Overview of Highlands Bancorp, Inc. Branch Footprint Branches (4) Sussex Passaic Morris rr Vernon Sussex Highland Lakes Ringwood Suffern Stockholm Sparta Lake Mohawk Pompton Lakes Boonton Totowa Denville Little Falls Clifton (1) Data as of June 30, 2018 Source: Company documents, S&P Global Market Intelligence Headquarters: Vernon, NJ Established: 2005 Ticker: OTC Pink: HSBK Assets: $487.9M Net Loans: $422.7M Deposits: $404.2M Tangible Common Equity: $29.1M YTD ROAA 0.77% YTD ROAE 11.98% 2Q Net Interest Margin: 3.26% 2Q Efficiency Ratio: 68.59% NPAs Excl. TDRs / Assets: 0.60% 3 |
|
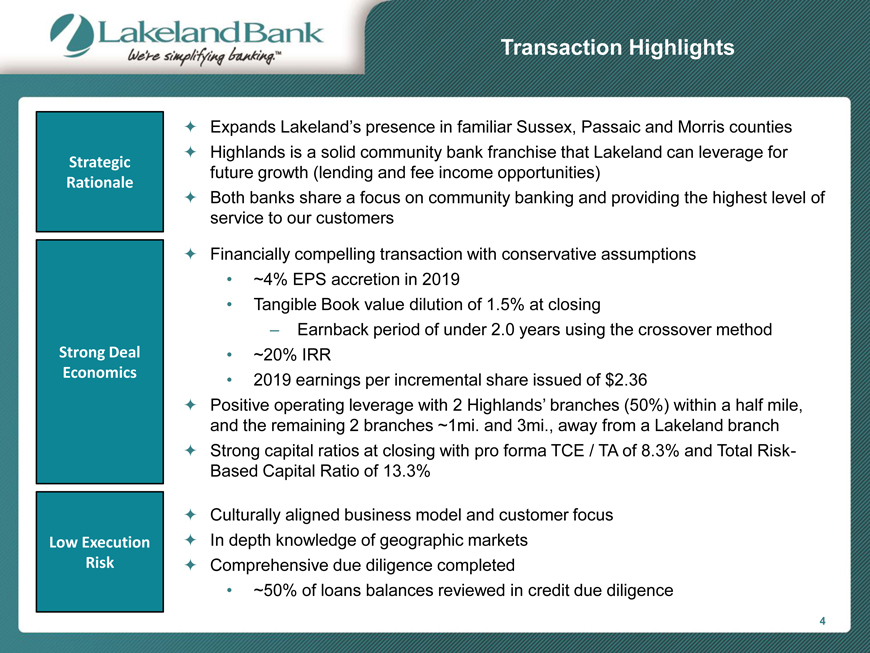
| Expands Lakeland’s presence in familiar Sussex, Passaic and Morris counties Highlands is a solid community bank franchise that Lakeland can leverage for future growth (lending and fee income opportunities) Both banks share a focus on community banking and providing the highest level of service to our customers Financially compelling transaction with conservative assumptions ~4% EPS accretion in 2019 Tangible Book value dilution of 1.5% at closing – Earnback period of under 2.0 years using the crossover method ~20% IRR 2019 earnings per incremental share issued of $2.36 Positive operating leverage with 2 Highlands’ branches (50%) within a half mile, and the remaining 2 branches ~1mi. and 3mi., away from a Lakeland branch Strong capital ratios at closing with pro forma TCE / TA of 8.3% and Total Risk-Based Capital Ratio of 13.3% Culturally aligned business model and customer focus In depth knowledge of geographic markets Comprehensive due diligence completed ~50% of loans balances reviewed in credit due diligence 4 |
|
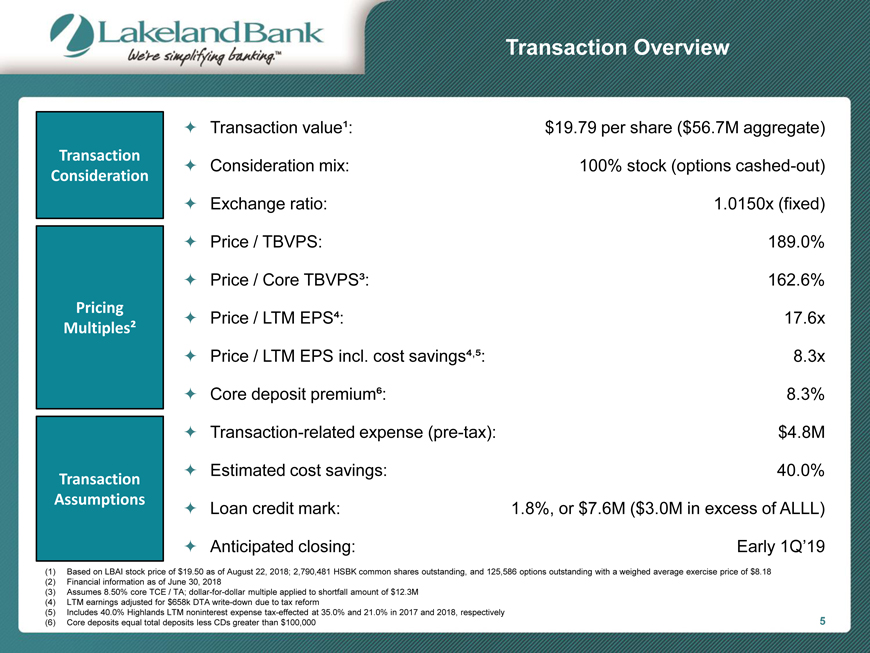
| Transaction Overview Transaction Consideration Pricing Multiples² Transaction Assumptions Transaction valueą: $19.79 per share ($56.7M aggregate) Consideration mix: 100% stock (options cashed-out) Exchange ratio: 1.0150x (fixed) Price / TBVPS: 189.0% Price / Core TBVPS³: 162.6% Price / LTM EPS⁴: 17.6x Price / LTM EPS incl. cost savings4,5: 8.3x Core deposit premium6: 8.3% Transaction-related expense (pre-tax): $4.8M Estimated cost savings: 40.0% Loan credit mark: 1.8%, or $7.6M ($3.0M in excess of ALLL) Anticipated closing: Early 1Q’19 (1) Based on LBAI stock price of $19.50 as of August 22, 2018; 2,790,481 HSBK common shares outstanding, and 125,586 options outstanding with a weighed average exercise price of $8.18 (2) Financial information as of June 30, 2018 (3) Assumes 8.50% core TCE / TA; dollar-for-dollar multiple applied to shortfall amount of $12.3M (4) LTM earnings adjusted for $658k DTA write-down due to tax reform (5) Includes 40.0% Highlands LTM noninterest expense tax-effected at 35.0% and 21.0% in 2017 and 2018, respectively (6) Core deposits equal total deposits less CDs greater than $100,000 5 |
|
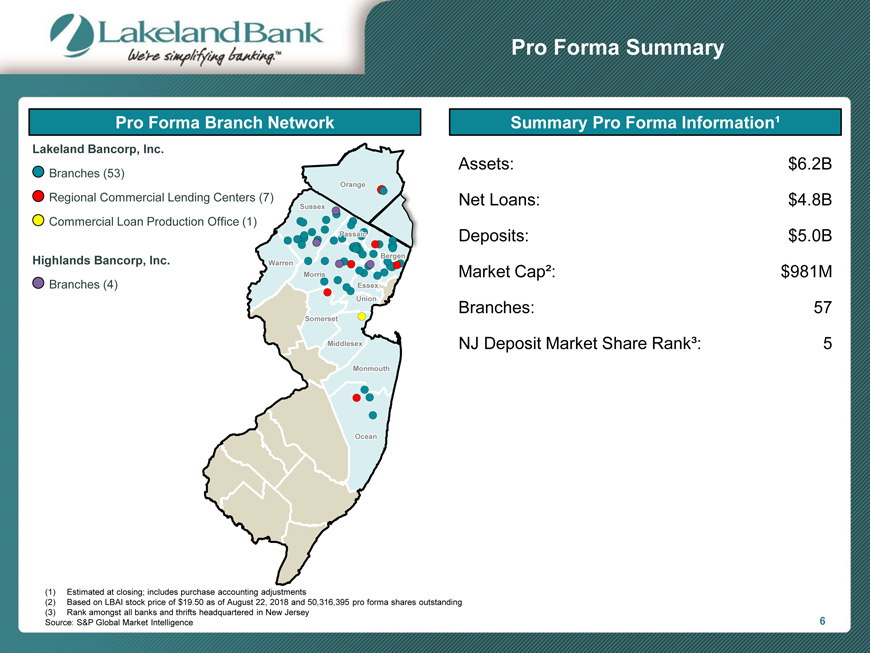
| Pro Forma Summary Pro Forma Branch Network Lakeland Bancorp, Inc. Branches (53) Regional Commercial Lending Centers (7) Commercial Loan Production Office (1) Highlands Bancorp, Inc. Branches (4) Summary Pro Forma Information¹ Assets: $6.2B Net Loans: $4.8B Deposits: $5.0B Market Capž: $981M Branches: 57 NJ Deposit Market Share Rank³: 5 (1) Estimated at closing; includes purchase accounting adjustments (2) Based on LBAI stock price of $19.50 as of August 22, 2018 and 50,316,395 pro forma shares outstanding (3) Rank amongst all banks and thrifts headquartered in New Jersey Source: S&P Global Market Intelligence 6 |
|
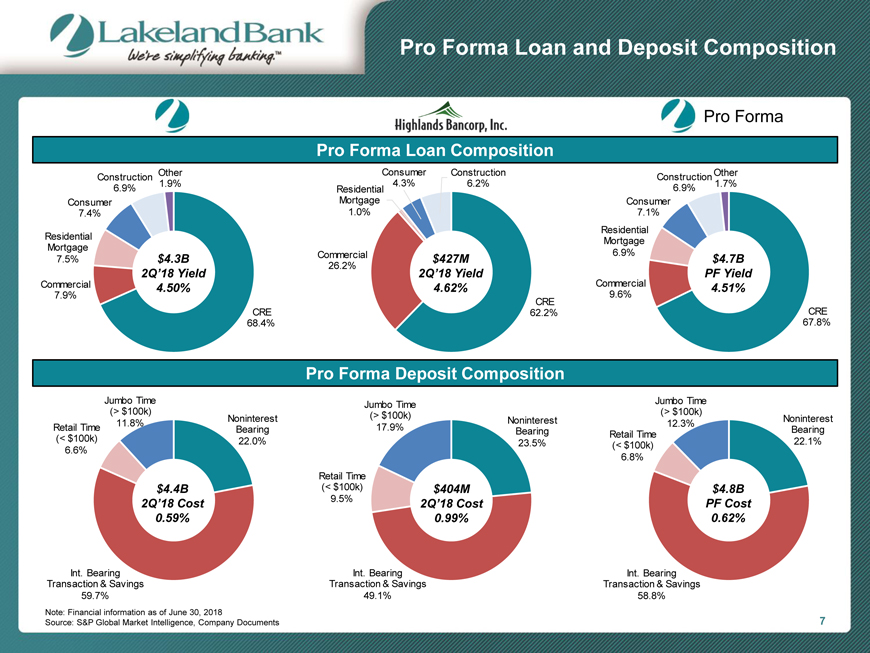
| Pro Forma Loan and Deposit Composition Pro Forma Pro Forma Loan Composition Other Consumer Construction Other Construction Construction 1.9% 4.3% 6.2% 1.7% 6.9% Residential 6.9% Consumer Mortgage Consumer 7.4% 1.0% 7.1% Residential Residential Mortgage Mortgage Commercial 6.9% 7.5% $4.3B $427M $4.7B 26.2% 2Q’18 Yield 2Q’18 Yield Commercial PF Yield Commercial 4.50% 4.62% 4.51% 7.9% 9.6% CRE CRE 62.2% CRE 68.4% 67.8% Pro Forma Deposit Composition Jumbo Time Jumbo Time Jumbo Time (> $100k) (> $100k) (> $100k) Noninterest Noninterest Noninterest 11.8% 17.9% 12.3% Retail Time Bearing Bearing Bearing (< $100k) Retail Time 6.6% 22.0% 23.5% (< $100k) 22.1% 6.8% Retail Time $4.4B (< $100k) $404M $4.8B 2Q’18 Cost 9.5% 2Q’18 Cost PF Cost 0.59% 0.99% 0.62% Int. Bearing Int. Bearing Int. Bearing Transaction & Savings Transaction & Savings Transaction & Savings 59.7% 49.1% 58.8% Note: Financial information as of June 30, 2018 Source: S&P Global Market Intelligence, Company Documents 7 |
|
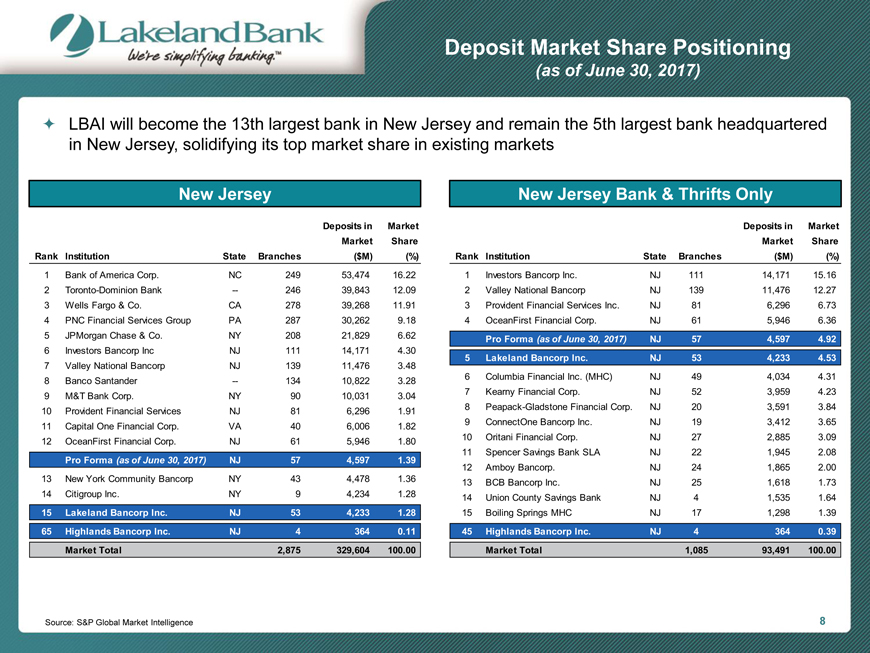
| Deposit Market Share Positioning (as of June 30, 2017) LBAI will become the 13th largest bank in New Jersey and remain the 5th largest bank headquartered in New Jersey, solidifying its top market share in existing markets New Jersey Deposits in Market Market Share Rank Institution State Branches ($M) (%) 1 Bank of America Corp. NC 249 53,474 16.22 2 Toronto-Dominion Bank -- 246 39,843 12.09 3 Wells Fargo & Co. CA 278 39,268 11.91 4 PNC Financial Services Group PA 287 30,262 9.18 5 JPMorgan Chase & Co. NY 208 21,829 6.62 6 Investors Bancorp Inc NJ 111 14,171 4.30 7 Valley National Bancorp NJ 139 11,476 3.48 8 Banco Santander -- 134 10,822 3.28 9 M&T Bank Corp. NY 90 10,031 3.04 10 Provident Financial Services NJ 81 6,296 1.91 11 Capital One Financial Corp. VA 40 6,006 1.82 12 OceanFirst Financial Corp. NJ 61 5,946 1.80 Pro Forma (as of June 30, 2017) NJ 57 4,597 1.39 13 New York Community Bancorp NY 43 4,478 1.36 14 Citigroup Inc. NY 9 4,234 1.28 15 Lakeland Bancorp Inc. NJ 53 4,233 1.28 65 Highlands Bancorp Inc. NJ 4 364 0.11 Market Total 2,875 329,604 100.00 New Jersey Bank & Thrifts Only Deposits in Market Market Share Rank Institution State Branches ($M) (%) 1 Investors Bancorp Inc. NJ 111 14,171 15.16 2 Valley National Bancorp NJ 139 11,476 12.27 3 Provident Financial Services Inc. NJ 81 6,296 6.73 4 OceanFirst Financial Corp. NJ 61 5,946 6.36 Pro Forma (as of June 30, 2017) NJ 57 4,597 4.92 5 Lakeland Bancorp Inc. NJ 53 4,233 4.53 6 Columbia Financial Inc. (MHC) NJ 49 4,034 4.31 7 Kearny Financial Corp. NJ 52 3,959 4.23 8 Peapack-Gladstone Financial Corp. NJ 20 3,591 3.84 9 ConnectOne Bancorp Inc. NJ 19 3,412 3.65 10 Oritani Financial Corp. NJ 27 2,885 3.0911 Spencer Savings Bank SLA NJ 22 1,945 2.08 12 Amboy Bancorp. NJ 24 1,865 2.00 13 BCB Bancorp Inc. NJ 25 1,618 1.73 14 Union County Savings Bank NJ 4 1,535 1.64 15 Boiling Springs MHC NJ 17 1,298 1.39 45 Highlands Bancorp Inc. NJ 4 364 0.39 Market Total 1,085 93,491 100.00 Source: S&P Global Market Intelligence 8 |