Attached files
| file | filename |
|---|---|
| 8-K - FORM 8-K - STAAR SURGICAL CO | tv501434_8k.htm |
Exhibit 99.1
STAAR Surgical Company NASDAQ: STAA August 22, 2018
Forward Looking Statements ; All statements in this presentation that are not statements of historical fact are forward - looking statements, including statements about any of the following: any financial projections, including those relating to the plans, strategies, strategic priorities, and objectives of management for future operations or prospects for achieving such plans, expectations for sales, revenue, revenue growth, earnings, net income, cash flow, cash balances, marketing and clinical initiatives, completion of remediation or other expense, or expense timing, success and timing of new or improved products (including product pipeline), clinical trials, research and development activities, investment imperatives, and any statements of assumptions underlying any of the foregoing, including business momentum. Important factors that could cause actual results to differ materially from those indicated or implied by such forward - looking statements are set forth in the Company’s Annual Report on Form 10 - K for the year ended December 29, 2017 under the caption “Risk Factors,” which is on file with the Securities and Exchange Commission (“SEC”) and available in the “Investor Information” section of the Company’s website under the heading “SEC Filings.” Except as required by law, we disclaim any intention or obligation to update or revise any financial projections or forward - looking statement due to new information or events. ; These forward - looking statements are based on management’s expectations and assumptions as of the date of this presentation and are subject to numerous risks and uncertainties, which could cause actual results to differ materially from those described or implied in the forward - looking statements. The risks and uncertainties include the following: our limited capital resources and limited access to financing; global economic conditions; changes in currency exchange rates; the discretion of regulatory agencies to approve or reject existing, new or improved products, or to require additional actions before approval (including but not limited to FDA requirements regarding the Visian Toric ICL and/or actions related to the FDA Warning Letter and Form FDA - 483s ), or to take enforcement action; research and development efforts; potential international trade disputes; the purchasing patterns of our distributors carrying inventory in the market; and the willingness of surgeons and patients to adopt a new or improved product and procedure. ; The Visian Toric ICL and the Visian ICL with CentraFLOW , now known as EVO Visian ICL , are not approved for sale in the United States . 2

A leading developer, manufacturer and marketer of premium implantable lenses for refractive vision correction. We transform lives by providing visual freedom through premium lens - based surgical correction of refractive error. 3 Business Focus

4 Business Momentum Net Sales Growth Y/Y 7% 10% 33% 55% Fiscal '16 Fiscal '17 Q1 2018 Q2 2018 Sales Momentum Has Further Accelerated in Year 1 of 2018 - 2020 Three - Year Plan

Products Overview EVO Visian ICL™ Visian ICL™ Implantable Collamer® Lens ; ICL delivers Visual Freedom to patients needing Myopic (distance vision) correction ; Patient pay Crystalline Lens Replacement ; IOL replaces the patient’s natural lens after cataract surgery ; Primarily reimbursed 80 % of Q2 2018 Revenue* *In FY 2017 , ICL revenue was $ 68 . 3 million or 75 % of total revenue . IOL was $ 17 . 3 million or 19 % of total revenue . STAAR also sells injectors and injector parts that were approximately 5 . 6 % of FY 17 total revenue or $ 5 . 0 million . The V isian Toric ICL and EVO Visian ICL ™ are not available in the US ; STAAR has facilities in California, Switzerland and Japan . Preloaded Injectors & Parts ; Silicone and Acrylic IOL’s ; Japan and Europe 5 Other Products
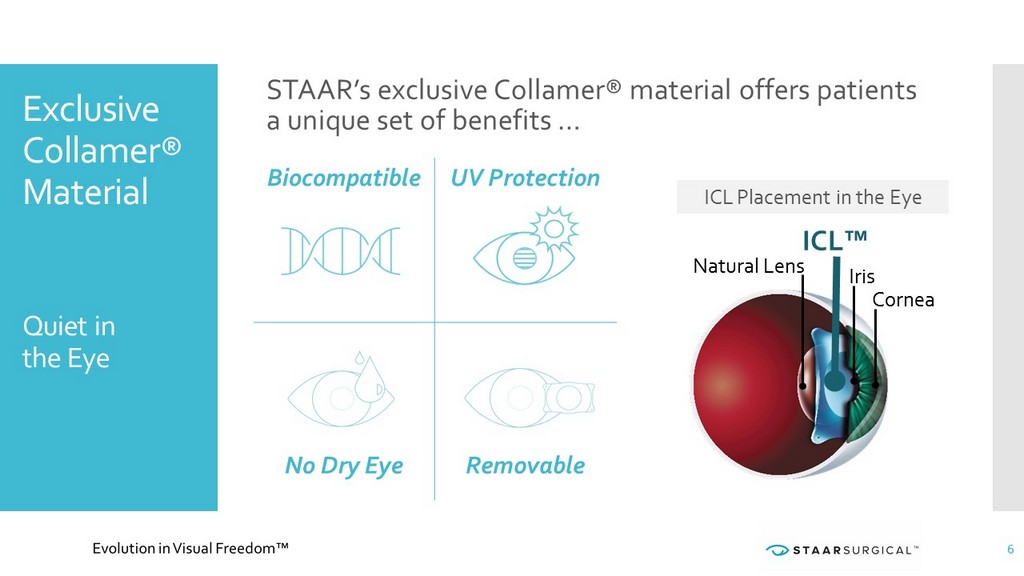
Biocompatible UV Protection No Dry Eye Removable Exclusive Collamer® Material Quiet in the Eye Iris Cornea ICL™ Natural Lens 6 STAAR’s exclusive Collamer® material offers patients a unique set of benefits … ICL Placement in the Eye
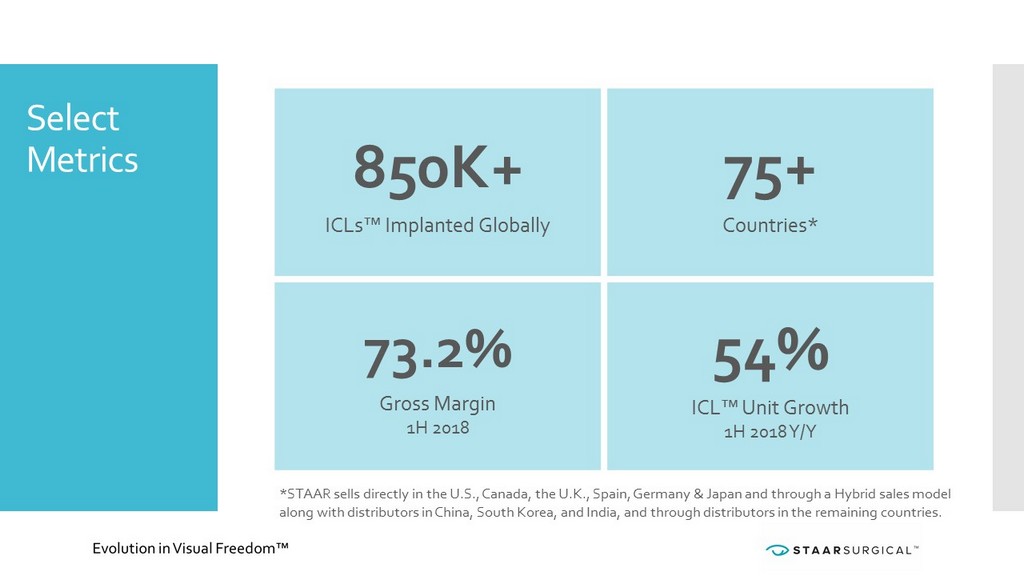
Select Metrics *STAAR sells directly in the U.S., Canada, the U.K., Spain, Germany & Japan and through a Hybrid sales model along with distributors in China, South Korea, and India, and through distributors in the remaining countries. 850K+ ICLs™ Implanted Globally 75+ Countries* 73.2% Gross Margin 1H 2018 54% ICL™ Unit Growth 1H 2018 Y/Y

ICL™ Patient Experience 99.4% of Patients Would Have the ICL’s Implanted Again* *Patient Registry Survey Data on File Step 1 Patient need and awareness Outreach, education and eye surgeon visit Decision to use ICL Step 2 Surgery day Local anesthetic, minimally invasive Quick 20 - 30 minute procedure Step 3 One week post - surgery follow - up Step 4 Annual post - surgery follow - up NEED OUTREACH & EDUCATION IMPLANT 8

ICL™ Patient Testimonials “Upgradeable, Replaceable”… I feel like a big part of health is using what your body already has. Visian ICL is in line with that because it’s keeping your eye completely intact. My eye is still my eye. EVE TORRES GRACIE JIU JITSU INSTRUCTOR, FORMER WWE DIVA, MOM I had my first opportunity to put my Visian ICL eyes to the test recently in the Brazilian Rainforest, and it couldn’t have been more exciting to be able to spot rare species better than ever. 9 PHIL TORRES ENTOMOLOGIST, TV SHOW HOST

Myopia An Inability to Focus at Distance due to Genetic and/or Environmental Factors • Predicted 50% of Global Population • More screen use; near vision work; and less time spent outdoors • Positive correlation between education level and myopia • ICL™ Label Approved Use is - 3 to - 20 diopters of vision correction Researchers Expect a Significant Increase… Myopia Could Impact Almost 5 Billion People Globally by 2050…* *“Ophthalmology 2016;123:1036 - 1042 © 2016 by the American Academy of Ophthalmology;” Myopia incidence was estimated at 1.4B people globally at time of study growing to 4.8B people by 2050 or predicted 50% of global pop. Singapore Health Board 10

Myopia STAAR’s Market Position & Opportunity • STAAR is a market leader providing a premium refractive surgical solution and patient experience for high Myopes. • High Myopia annual market opportunity of ~ 120,000 Eyes* • Moving down the diopter curve represents a significant opportunity for STAAR. • In select strategic accounts high growth approximates 30%+ growth in mid - diopter implants • Mid - Myopia market opportunity of ~ 500,000 Eyes* * Company internal estimate 11 High Myopia ( - 10+ diopters) Mid - Myopia ( - 6 to - 10+ diopters)

Presbyopia An Inability to Focus on Near Objects due to an Age Related Loss of Lens Accommodation ICL refractive solution could be more desirable to patients seeking Visual Freedom • Current refractive options for presbyopia are Monocular/LASIK/RLE • ICL Not laser/equipment dependent • ICL Bilateral placement - no emmetropia qualifier • ICL targets each eye for desired correction • STAAR aims to become a market leader in refractive surgical solution and patient experience for early Presbyopia • Early Presbyopia (Age 45 to 55) market opportunity ~ 1,500,000 Eyes* * Company internal estimate Impacts 1.7 Billion People Globally… Reading Glasses 12 STAAR’s Market Position & Opportunity

Strategic Priorities and Goals 2018 - 2020 13 Culture of Quality Retain Compliance with All Regulatory Bodies x FDA Warning Letter lifted June 2018 Innovation Innovate, Develop and Introduce Premium Collamer Lenses and Delivery Systems Build the Market Successfully Build the Visual Freedom Market for Implantable Lenses by Tangibly Impacting Surgeon Engagement, Practice Development and Patient Desirability Expand Market Share Execute Go - to - Market Strategy to Significantly Expand Market Share Globally Clinical Excellence Enhance Clinical & Medical Affairs Excellence: Clinical Validation, Surgeon Training Foundations 2020 Implement Foundations 2020: Operations and Systems Updates & Improvements Deliver Shareholder Value

TAM 3.6 Million Refractive Vision Correction Procedures Annually * 120,000 500,000 1,500,000 High Myopia Mid-Myopia Early Presbyopia STAAR Global Market Opportunity Est. ~ 2.1 Million Eyes Annually* Current Products Visian ICL (global) EVO (x U.S.) Central Port EVO+ (x U.S.) Larger Optic Product Pipeline Toric ICL in U.S. Astigmatism EVO with EDOF Presbyopia Preloaded Visian ICL Preloaded EVO The ICL with central port (EVO lenses) and Toric ICL are not available in the U.S. Preloaded ICLs are not yet available for sale. *Top 10 Markets/Procedures from 2016 Marketscope Report; A Systematic Review and Meta - Analysis , AAO Journal May 2016; and Estimated Market Share Opportunity 14 STAAR also aims to become a competitive provider of supplemental lenses implanted during or after cataract surgery.

2Q 2018 Highlights Reported August 1, 2018 ; Revenue Growth Accelerated to 55 % Y/Y ; Broad based revenue growth included ICL revenue up 67% and Other products up 18% ; Broad based geographic growth included ICL unit growth in Japan +131%; China +127%; Canada +64%; India +61%; Germany +30%; and European distributors +20% (overall ICL units up 66%) ; Op Ex Increased 32 % Y/Y, Comfortably Below Revenue Growth and Supporting ICL Product Family ; Increased Cash to $21.4 Million compared to $18.5 Million at 12/29/17 FYE ; Received FDA letter in June resolving 2014 Warning Letter ; Post 2Q: Raised ~$78M gross proceeds ( ˂ 5% dilution) in Aug. 2018 offering 15

Financial Outlook 2018* August 1, 2018 Update ; Revenue Growth Percentage Target Increase May Exceed 25% Full Year 2018 Over 2017 (Prior : closer to mid teens/ 20%) ; Achieve At Least Breakeven GAAP Net Income (Prior: EPS Improvement Full Year 2018 over 2017 actual ($0.05)) • Achieve Full Year Positive Cash Flow • Cash Balance Increase Full Year 2018 over 2017 * Note that STAAR may incur charges, realize gains or losses, incur financing costs or interest expense, or experience other events in 2018 that could cause actual results to vary materially from this outlook. 16

STAAR Surgical Company 2018 - 2020 17 Millions of Eyes “Millions of Eyes” Global Opportunity – Myopia and Presbyopia Revenue Growth 15 - 20% Annual Revenue Growth Goal Profitability Targets Targeting Achievement of Sustained Profitability Margin Expansion Gross Margin Improvement & Cash Generation Growth Continues Product Expansion EVO ICL Product Family Expansion – Myopia and Presbyopia EDOF Global Partners Growing Global Partners – Strategic Agreements Secure Base We Believe There is Significant Growth Opportunity…

STAAR Surgical Company NASDAQ: STAA August 22, 2018

Appendix Financial Results 2015 - 2018 19.3 21.0 20.1 22.1 20.4 21.9 23.5 24.9 27.1 33.9 Q1 Q2 Q3 Q4 Q1 Q2 Q3 Q4 Q1 Q2 68.4% 70.8% 70.9% 71.7% 74.4% 2015 2016 2017 Q1 2018 Q2 2018 $82.4 2016 $90.6 2017 $ Millions Revenue Gross Margin 2018 19
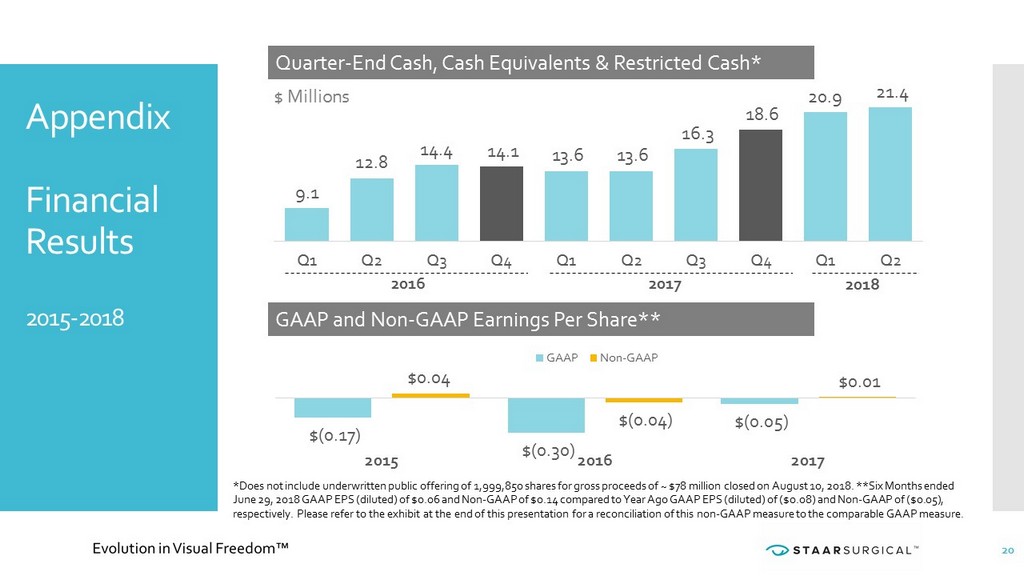
2018 2016 2017 Appendix Financial Results 2015 - 2018 Quarter - End Cash, Cash Equivalents & Restricted Cash* GAAP and Non - GAAP Earnings Per Share** 9.1 12.8 14.4 14.1 13.6 13.6 16.3 18.6 20.9 21.4 Q1 Q2 Q3 Q4 Q1 Q2 Q3 Q4 Q1 Q2 $ Millions $(0.17) $(0.30) $(0.05) $0.04 $(0.04) $0.01 2015 2016 2017 GAAP Non-GAAP *Does not include underwritten public offering of 1,999,850 shares for gross proceeds of ~ $78 million closed on August 10, 2 018 . **Six Months ended June 29, 2018 GAAP EPS (diluted) of $0.06 and Non - GAAP of $0.14 compared to Year Ago GAAP EPS (diluted) of ($0.08) and Non - GAAP of ($0.05), respectively. Please refer to the exhibit at the end of this presentation for a reconciliation of this non - GAAP measure to the comparable GAAP measure. 20

Reconciliation of Non - GAAP Measure This presentation includes supplemental non - GAAP financial information, which STAAR believes investors will find helpful in understanding its operating performance. “Non - GAAP Earnings (Loss) Per Share” excludes the following items that are included in “Earnings (Loss) Per Share” as calculated in accordance with U.S. generally accepted accounting principles (“ GAAP ”): gain or loss on foreign currency transactions, stock - based compensation expenses, and quality remediation expenses. Management believes that “Non - GAAP Earnings (Loss) Per Share” is useful to investors in gauging the outcome of the key drivers of the business performance: the ability to increase sales revenue and our ability to increase profit margin by improving the mix of high value products while reducing the costs over which management has control. Management has excluded quality remediation expenses because their inclusion may mask underlying trends in our business performance. Management has also excluded gains and losses on foreign currency transactions because of the significant fluctuations that can result from period to period as a result of market driven factors. Stock - based compensation expenses consist of expenses for stock options and restricted stock under the Financial Accounting Standards Board’s Accounting Standards Codification (ASC) 718. In calculating Non - GAAP Earnings (Loss) Per Share, STAAR excludes these expenses because they are non - cash expenses and because of the complexity and considerable judgment involved in calculating their values. In addition, these expenses tend to be driven by fluctuations in the price of our stock and not by the same factors that generally affect our other business expenses. The table set forth below reconciles STAAR ’s Earnings (Loss) Per Share to Non - GAAP Earnings (Loss) Per Share . 21

Reconciliation of Non - GAAP Measure (cont.) [Insert chart] 22 Year Ended (in 000’s ) January 1, 2016 December 30, 2016 December 29, 2017 June 30, 2017 June 29, 2018 Unaudited Net income (loss) - (as reported) $ (6,533) $ (12,129) $ (2,139) $ (3,174) $ 2,413 Less: Foreign currency impact 949 147 (819) (294) 597 Stock - based compensation expense 3,304 8,558 3,161 1,378 2,899 Quality remediation expense 3,933 1,865 210 210 - Net income (loss) - (adjusted) $ 1,653 $ (1,559) $ 413 $ (1,880) $ 5,909 Net income (loss) per share, basic - (as reported) $ (0.17) $ (0.30) $ (0.05) $ (0.08) $ 0.06 Foreign currency impact 0.02 0.00 (0.02) (0.01) 0.01 Stock - based compensation expense 0.08 0.21 0.08 0.03 0.07 Quality remediation expense 0.10 0.05 0.01 0.01 - Net income (loss) per share, basic - (adjusted) $ 0.04 $ (0.04) $ 0.01 $ (0.05) $ 0.14 Net income (loss) per share, diluted - (as reported) $ (0.16) $ (0.30) $ (0.05) $ (0.08) $ 0.06 Foreign currency impact 0.02 0.00 (0.02) (0.01) 0.01 Stock - based compensation expense 0.08 0.21 0.08 0.03 0.07 Quality remediation expense 0.10 0.05 0.00 0.01 - Net income (loss) per share, diluted - (adjusted) $ 0.04 $ (0.04) $ 0.01 $ (0.05) $ 0.14 Weighted average shares outstanding - Basic 39,260 40,329 41,004 40,841 41,568 Weighted average shares outstanding - Diluted 40,451 40,329 42,096 40,841 43,654